Architecture Icons
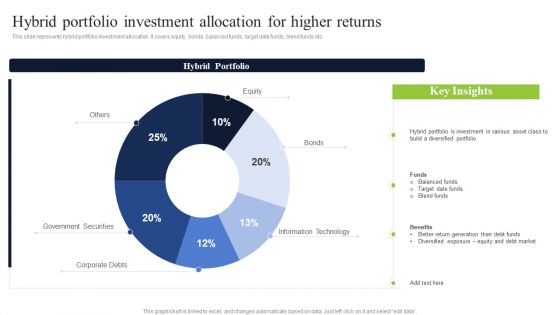
Hybrid Portfolio Investment Allocation For Higher Returns Designs PDF
This slide represents hybrid portfolio investment allocation. It covers equity, bonds, balanced funds, target date funds, blend funds etc. Deliver an awe inspiring pitch with this creative Hybrid Portfolio Investment Allocation For Higher Returns Designs PDF bundle. Topics like Target Date Funds, Diversified Portfolio, Investment can be discussed with this completely editable template. It is available for immediate download depending on the needs and requirements of the user.
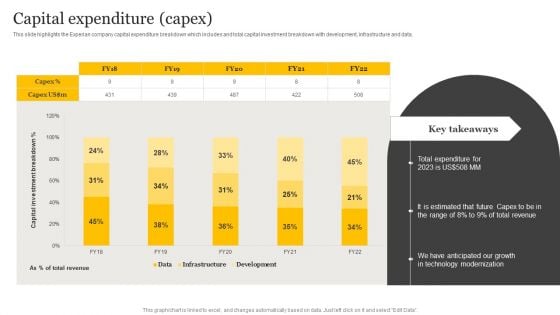
Customer Credit Reporting Company Outline Capital Expenditure Capex Designs PDF
This slide highlights the Experian company capital expenditure breakdown which includes and total capital investment breakdown with development, infrastructure and data. There are so many reasons you need a Customer Credit Reporting Company Outline Capital Expenditure Capex Designs PDF. The first reason is you cannot spend time making everything from scratch, Thus, Slidegeeks has made presentation templates for you too. You can easily download these templates from our website easily.
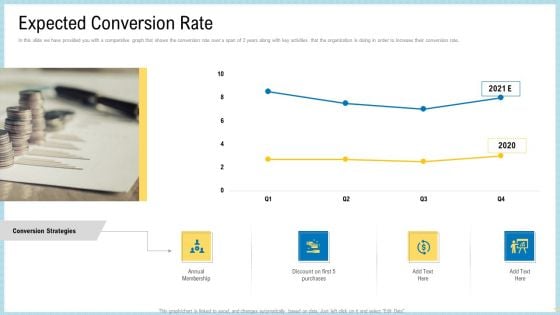
Marketing Technology Stack Expected Conversion Rate Designs PDF
In this slide we have provided you with a comparative graph that shows the conversion rate over a span of 2 years along with key activities that the organization is doing in order to increase their conversion rate.Deliver and pitch your topic in the best possible manner with this marketing technology stack expected conversion rate designs pdf. Use them to share invaluable insights on annual membership, discount on first 5 purchases, conversion strategies and impress your audience. This template can be altered and modified as per your expectations. So, grab it now.
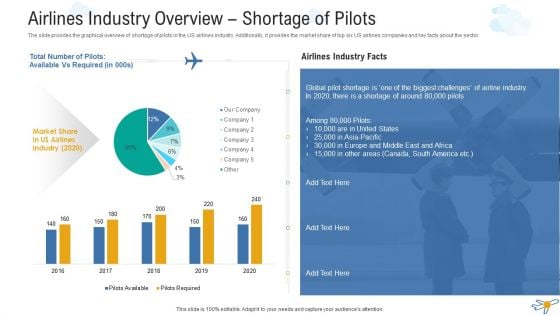
Airlines Industry Overview Shortage Of Pilots Designs PDF
The slide provides the graphical overview of shortage of pilots in the US airlines industry. Additionally, it provides the market share of top six US airlines companies and key facts about the sector. Deliver and pitch your topic in the best possible manner with this airlines industry overview shortage of pilots designs pdf. Use them to share invaluable insights on airlines industry overview shortage of pilots and impress your audience. This template can be altered and modified as per your expectations. So, grab it now.
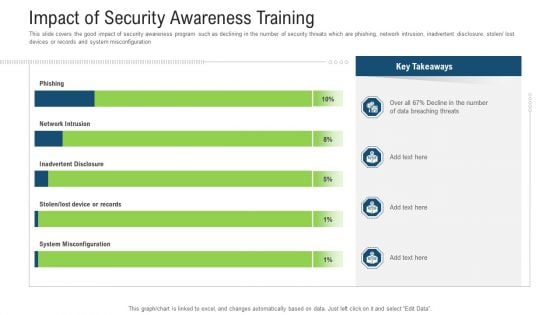
Impact Of Security Awareness Training Ppt Inspiration Design Templates PDF
This slide covers the good impact of security awareness program such as declining in the number of security threats which are phishing, network intrusion, inadvertent disclosure, stolen or lost devices or records and system misconfiguration. Deliver and pitch your topic in the best possible manner with this impact of security awareness training ppt inspiration design templates pdf. Use them to share invaluable insights on impact of security awareness training and impress your audience. This template can be altered and modified as per your expectations. So, grab it now.
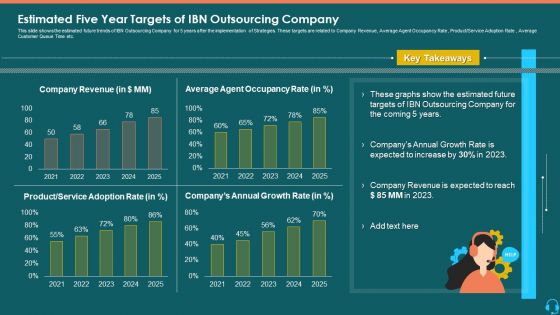
Estimated Five Year Targets Of IBN Outsourcing Company Designs PDF
This slide shows the estimated future trends of IBN Outsourcing Company for 5 years after the implementation of Strategies. These targets are related to Company Revenue, Average Agent Occupancy Rate, Product or Service Adoption Rate , Average Customer Queue Time etc. Deliver an awe-inspiring pitch with this creative estimated five year targets of ibn outsourcing company designs pdf bundle. Topics like company revenue, product, service adoption rate can be discussed with this completely editable template. It is available for immediate download depending on the needs and requirements of the user.
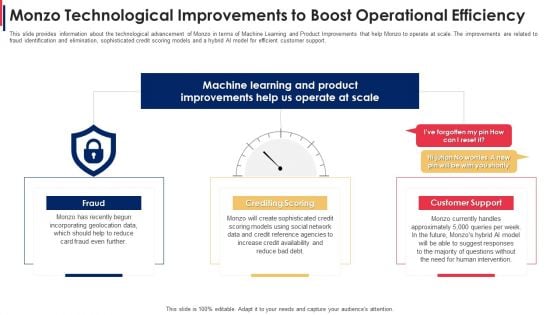
Monzo Technological Improvements To Boost Operational Efficiency Designs PDF
This slide provides information about the technological advancement of Monzo in terms of Machine Learning and Product Improvements that help Monzo to operate at scale. The improvements are related to fraud identification and elimination, sophisticated credit scoring models and a hybrid AI model for efficient customer support. Deliver and pitch your topic in the best possible manner with this monzo technological improvements to boost operational efficiency designs pdf. Use them to share invaluable insights on customer support, geolocation data, social network and impress your audience. This template can be altered and modified as per your expectations. So, grab it now.
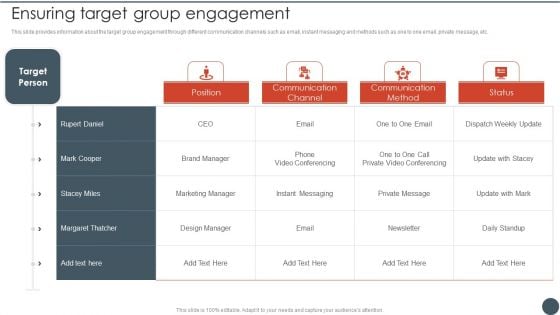
Project Team Engagement Tasks Ensuring Target Group Engagement Designs PDF
The parent company and the subsidiaries are facing coordinating issues which are affecting their overall performance. Lack of coordination creating issues in launching product due to no regular follow up. Delivery of the product is delayed due to lack of coordination. Deliver an awe inspiring pitch with this creative Project Team Engagement Tasks Ensuring Target Group Engagement Designs PDF bundle. Topics like Increase In Project, Reasons For Project, Coordination Issue can be discussed with this completely editable template. It is available for immediate download depending on the needs and requirements of the user.
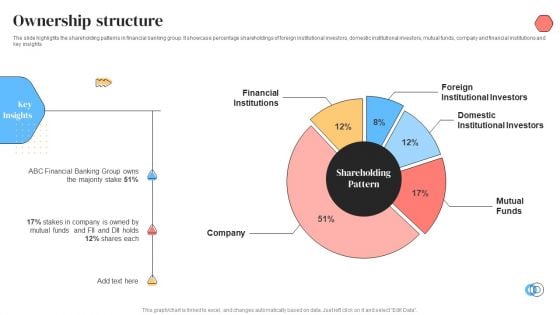
Banking Solutions Company Overview Ownership Structure Designs PDF
The slide highlights the shareholding patterns in financial banking group. It showcase percentage shareholdings of foreign institutional investors, domestic institutional investors, mutual funds, company and financial institutions and key insights. Deliver and pitch your topic in the best possible manner with this Banking Solutions Company Overview Ownership Structure Designs PDF. Use them to share invaluable insights on Mutual Funds, Domestic Institutional Investors, Foreign Institutional Investors and impress your audience. This template can be altered and modified as per your expectations. So, grab it now.
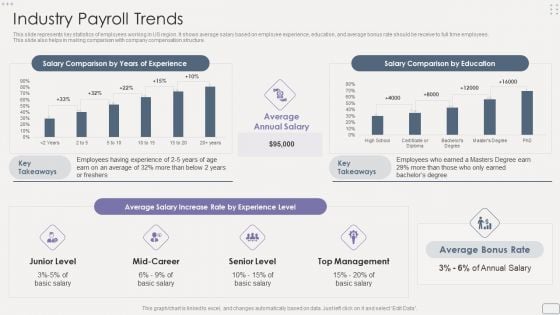
Income Assessment Report Industry Payroll Trends Designs PDF
This slide represents key statistics of employees working in US region. It shows average salary based on employee experience, education, and average bonus rate should be receive to full time employees. This slide also helps in making comparison with company compensation structure.Deliver an awe inspiring pitch with this creative Income Assessment Report Industry Payroll Trends Designs PDF bundle. Topics like Employees Department, Company Quarter, Company Quarter can be discussed with this completely editable template. It is available for immediate download depending on the needs and requirements of the user.
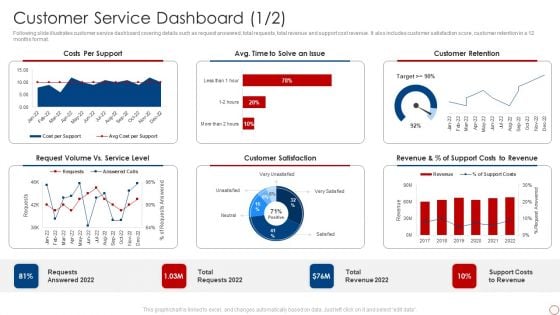
Kpis For Evaluating Business Sustainability Customer Service Dashboard Designs PDF
Following slide illustrates customer service dashboard covering details such as request answered, total requests, total revenue and support cost revenue. It also includes customer satisfaction score, customer retention in a 12 months format. Deliver and pitch your topic in the best possible manner with this Kpis For Evaluating Business Sustainability Customer Service Dashboard Designs PDF. Use them to share invaluable insights on Costs Per Support, Customer Retention, Customer Satisfaction and impress your audience. This template can be altered and modified as per your expectations. So, grab it now.

Market Attractiveness Analysis For Merger And Acquisition Designs PDF
Purpose of the following slide is to show the feasibility of cryptocurrency market. It helps the organization in understanding the market attractiveness of market and if the company should proceed with the Merger and acquisition process. It highlights essential parameters such as CAGR, market size etc. Deliver an awe inspiring pitch with this creative Market Attractiveness Analysis For Merger And Acquisition Designs PDF bundle. Topics like Cryptocurrency Market, Cryptocurrency Investments, Opportunity can be discussed with this completely editable template. It is available for immediate download depending on the needs and requirements of the user.
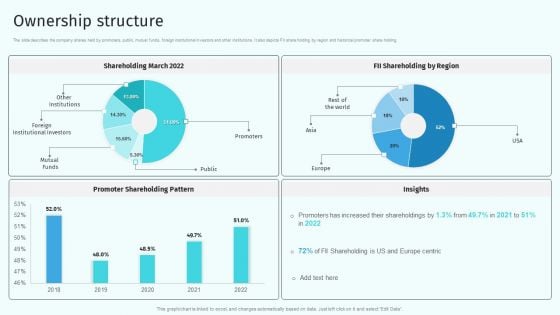
Ownership Structure Health And Property Insurance Company Profile Designs PDF
The slide describes the company shares held by promoters, public, mutual funds, foreign institutional investors and other institutions. It also depicts FII share holding by region and historical promoter share holding. Deliver and pitch your topic in the best possible manner with this Ownership Structure Health And Property Insurance Company Profile Designs PDF. Use them to share invaluable insights on Ownership Structure, Shareholding, Promoter Shareholding Pattern and impress your audience. This template can be altered and modified as per your expectations. So, grab it now.
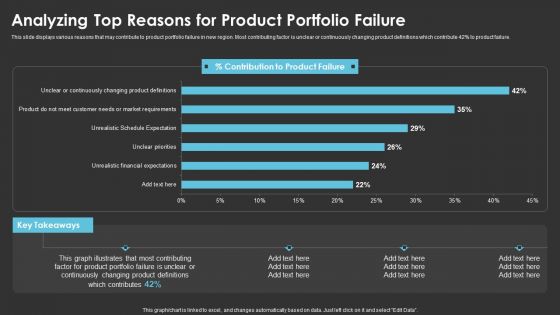
Analyzing Top Reasons For Product Portfolio Failure Designs PDF
This slide displays various reasons that may contribute to product portfolio failure in new region. Most contributing factor is unclear or continuously changing product definitions which contribute 42 percentage to product failure. Deliver and pitch your topic in the best possible manner with this Analyzing Top Reasons For Product Portfolio Failure Designs PDF. Use them to share invaluable insights on Product Portfolio, Analyzing Top Reasons and impress your audience. This template can be altered and modified as per your expectations. So, grab it now.
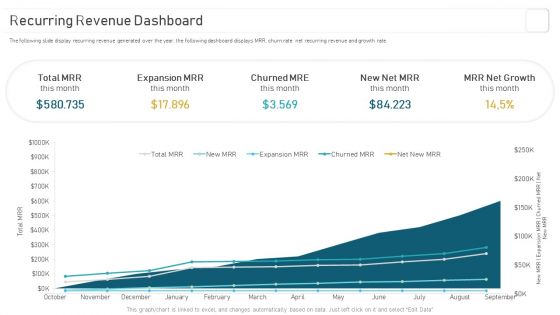
Deploying And Managing Recurring Recurring Revenue Dashboard Designs PDF
The following slide display recurring revenue generated over the year, the following dashboard displays MRR, churn rate net recurring revenue and growth rate. Make sure to capture your audiences attention in your business displays with our gratis customizable Deploying And Managing Recurring Recurring Revenue Dashboard Designs PDF. These are great for business strategies, office conferences, capital raising or task suggestions. If you desire to acquire more customers for your tech business and ensure they stay satisfied, create your own sales presentation with these plain slides.
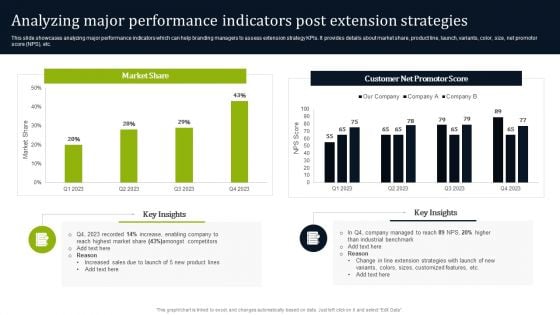
Analyzing Major Performance Indicators Post Extension Strategies Designs PDF
This slide showcases analyzing major performance indicators which can help branding managers to assess extension strategy KPIs. It provides details about market share, product line, launch, variants, color, size, net promotor score NPS, etc. Want to ace your presentation in front of a live audience Our Analyzing Major Performance Indicators Post Extension Strategies Designs PDF can help you do that by engaging all the users towards you. Slidegeeks experts have put their efforts and expertise into creating these impeccable powerpoint presentations so that you can communicate your ideas clearly. Moreover, all the templates are customizable, and easy-to-edit and downloadable. Use these for both personal and commercial use.
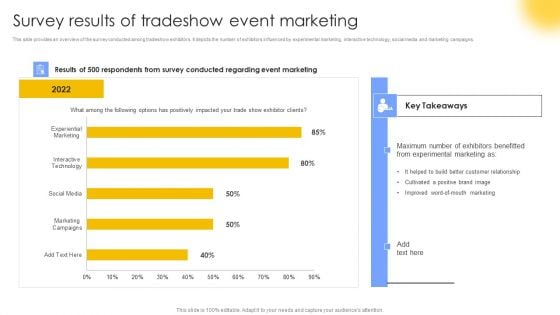
Survey Results Of Tradeshow Event Marketing Designs PDF
This slide provides an overview of the survey conducted among tradeshow exhibitors. It depicts the number of exhibitors influenced by experimental marketing, interactive technology, social media and marketing campaigns. Make sure to capture your audiences attention in your business displays with our gratis customizable Survey Results Of Tradeshow Event Marketing Designs PDF. These are great for business strategies, office conferences, capital raising or task suggestions. If you desire to acquire more customers for your tech business and ensure they stay satisfied, create your own sales presentation with these plain slides.
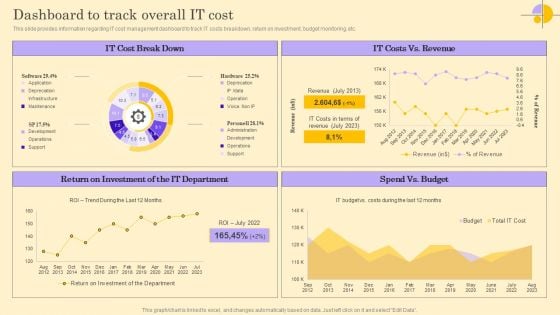
Dashboard To Track Overall IT Cost Ppt Background Designs PDF
This slide provides information regarding IT cost management dashboard to track IT costs breakdown, return on investment, budget monitoring, etc. Boost your pitch with our creative Dashboard To Track Overall IT Cost Ppt Background Designs PDF. Deliver an awe-inspiring pitch that will mesmerize everyone. Using these presentation templates you will surely catch everyones attention. You can browse the ppts collection on our website. We have researchers who are experts at creating the right content for the templates. So you do not have to invest time in any additional work. Just grab the template now and use them.
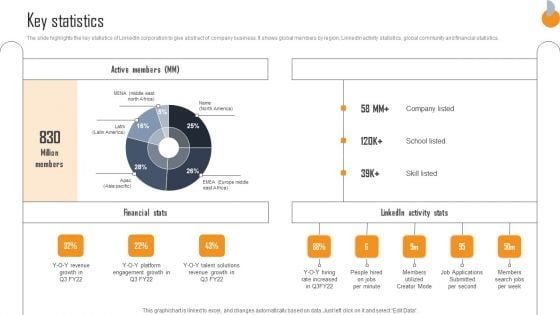
Business Connection Network Company Outline Key Statistics Designs PDF
The slide highlights the key statistics of LinkedIn corporation to give abstract of company business. It shows global members by region, LinkedIn activity statistics, global community and financial statistics. Make sure to capture your audiences attention in your business displays with our gratis customizable Business Connection Network Company Outline Key Statistics Designs PDF. These are great for business strategies, office conferences, capital raising or task suggestions. If you desire to acquire more customers for your tech business and ensure they stay satisfied, create your own sales presentation with these plain slides.
Monthly Sales Performance Tracking And Monitoring Dashboard Designs PDF
This slide showcases a dashboard presenting various metrics to measure and analyze sales performance for revenue growth. It includes key components such as number of sales, revenue, profit, cost, sales revenue, sales increment, cost analysis and cross sell. Make sure to capture your audiences attention in your business displays with our gratis customizable Monthly Sales Performance Tracking And Monitoring Dashboard Designs PDF. These are great for business strategies, office conferences, capital raising or task suggestions. If you desire to acquire more customers for your tech business and ensure they stay satisfied, create your own sales presentation with these plain slides.
Dashboard For Tracking Aftersales Customer Services Team Performance Designs PDF
This slide covers the KPI dashboard for ticket tracking. It includes metrics such as tickets by month, service level, and details of customer service department agents. Boost your pitch with our creative Dashboard For Tracking Aftersales Customer Services Team Performance Designs PDF. Deliver an awe inspiring pitch that will mesmerize everyone. Using these presentation templates you will surely catch everyones attention. You can browse the ppts collection on our website. We have researchers who are experts at creating the right content for the templates. So you do not have to invest time in any additional work. Just grab the template now and use them.
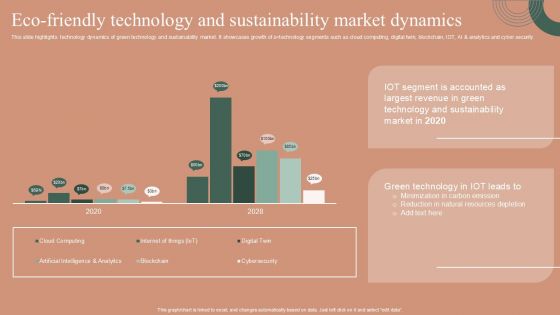
Eco Friendly Technology And Sustainability Market Dynamics Designs PDF
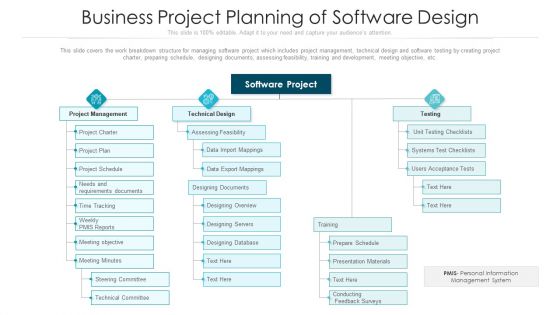
Business Project Planning Of Software Design Ppt PowerPoint Presentation File Graphics Tutorials PDF
This slide covers the work breakdown structure for managing software project which includes project management, technical design and software testing by creating project charter, preparing schedule, designing documents, assessing feasibility, training and development, meeting objective, etc. Presenting business project planning of software design ppt powerpoint presentation file graphics tutorials pdf to dispense important information. This template comprises three stages. It also presents valuable insights into the topics including project management, technical design, testing. This is a completely customizable PowerPoint theme that can be put to use immediately. So, download it and address the topic impactfully.
PowerPoint Presentation Business Pie Chart List Ppt Presentation
PowerPoint Presentation Business Pie Chart list PPT Presentation-These high quality powerpoint pre-designed slides and powerpoint templates have been carefully created by our professional team to help you impress your audience. All slides have been created and are 100% editable in powerpoint. Each and every property of any graphic - color, size, orientation, shading, outline etc. can be modified to help you build an effective powerpoint presentation. Any text can be entered at any point in the powerpoint template or slide. Simply DOWNLOAD, TYPE and PRESENT! Display a fair minded approach with our PowerPoint Presentation Business Pie Chart List Ppt Presentation. Give due attention to all aspects.
PowerPoint Process Company Leadership 3d Circular Chart List Ppt Slide
PowerPoint Process Company Leadership 3d Circular Chart list PPT Slide-These high quality powerpoint pre-designed slides and powerpoint templates have been carefully created by our professional team to help you impress your audience. All slides have been created and are 100% editable in powerpoint. Each and every property of any graphic - color, size, orientation, shading, outline etc. can be modified to help you build an effective powerpoint presentation. Any text can be entered at any point in the powerpoint template or slide. Simply DOWNLOAD, TYPE and PRESENT! Entice them with our PowerPoint Process Company Leadership 3d Circular Chart List Ppt Slide. Lure them with your thoughts.
PowerPoint Process Download Pie Chart Puzzle Process Ppt Slide
PowerPoint Process Download Pie chart Puzzle Process PPT Slide-These high quality powerpoint pre-designed slides and powerpoint templates have been carefully created by our professional team to help you impress your audience. All slides have been created and are 100% editable in powerpoint. Each and every property of any graphic - color, size, orientation, shading, outline etc. can be modified to help you build an effective powerpoint presentation. Any text can be entered at any point in the powerpoint template or slide. Simply DOWNLOAD, TYPE and PRESENT! Get the correct coordination with our PowerPoint Process Download Pie Chart Puzzle Process Ppt Slide. They blend beautifully with your thoughts.
PowerPoint Process Success Pie Chart Puzzle Process Ppt Slide
PowerPoint Process Success Pie chart Puzzle Process PPT Slide-These high quality powerpoint pre-designed slides and powerpoint templates have been carefully created by our professional team to help you impress your audience. All slides have been created and are 100% editable in powerpoint. Each and every property of any graphic - color, size, orientation, shading, outline etc. can be modified to help you build an effective powerpoint presentation. Any text can be entered at any point in the powerpoint template or slide. Simply DOWNLOAD, TYPE and PRESENT! Make your presentations helpful with our PowerPoint Process Success Pie Chart Puzzle Process Ppt Slide. Dont waste time struggling with PowerPoint. Let us do it for you.
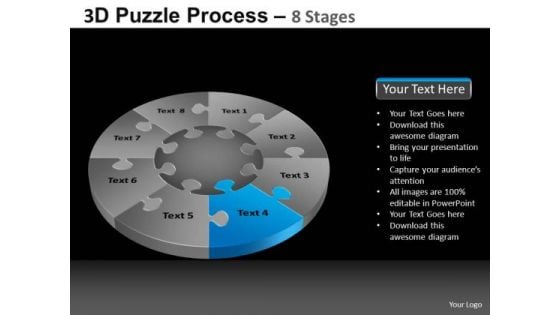
PowerPoint Slide Process Pie Chart Puzzle Process Ppt Slidelayout
PowerPoint Slide Process Pie chart Puzzle Process PPT Slidelayout-These high quality powerpoint pre-designed slides and powerpoint templates have been carefully created by our professional team to help you impress your audience. All slides have been created and are 100% editable in powerpoint. Each and every property of any graphic - color, size, orientation, shading, outline etc. can be modified to help you build an effective powerpoint presentation. Any text can be entered at any point in the powerpoint template or slide. Simply DOWNLOAD, TYPE and PRESENT! Stand on your own feet with our PowerPoint Slide Process Pie Chart Puzzle Process Ppt Slidelayout. They will deliver all the assistance you need.
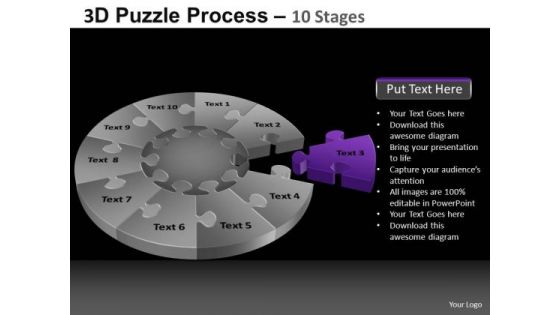
PowerPoint Slide Sales Pie Chart Puzzle Process Ppt Layout
PowerPoint Slide Sales Pie chart Puzzle Process PPT Layout-These high quality powerpoint pre-designed slides and powerpoint templates have been carefully created by our professional team to help you impress your audience. All slides have been created and are 100% editable in powerpoint. Each and every property of any graphic - color, size, orientation, shading, outline etc. can be modified to help you build an effective powerpoint presentation. Any text can be entered at any point in the powerpoint template or slide. Simply DOWNLOAD, TYPE and PRESENT! Gather the data and present with our PowerPoint Slide Sales Pie Chart Puzzle Process Ppt Layout. Try us out and see what a difference our templates make.
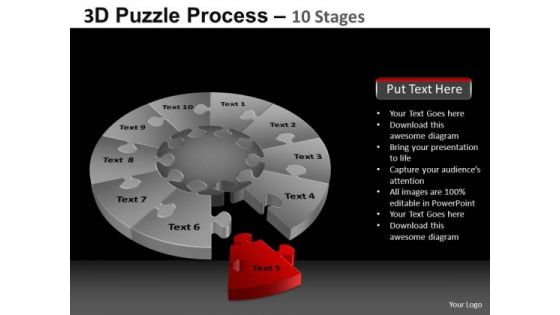
PowerPoint Slide Success Pie Chart Puzzle Process Ppt Template
PowerPoint Slide Success Pie chart Puzzle Process PPT Template-These high quality powerpoint pre-designed slides and powerpoint templates have been carefully created by our professional team to help you impress your audience. All slides have been created and are 100% editable in powerpoint. Each and every property of any graphic - color, size, orientation, shading, outline etc. can be modified to help you build an effective powerpoint presentation. Any text can be entered at any point in the powerpoint template or slide. Simply DOWNLOAD, TYPE and PRESENT! Be expressive with our PowerPoint Slide Success Pie Chart Puzzle Process Ppt Template. Bring in feeling to your thoughts.
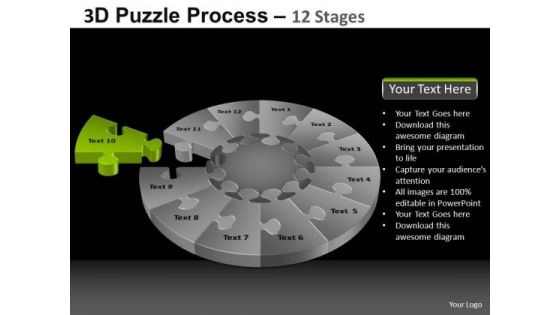
PowerPoint Slidelayout Editable Pie Chart Puzzle Process Ppt Backgrounds
PowerPoint Slidelayout Editable Pie chart Puzzle Process PPT Backgrounds-These high quality powerpoint pre-designed slides and powerpoint templates have been carefully created by our professional team to help you impress your audience. All slides have been created and are 100% editable in powerpoint. Each and every property of any graphic - color, size, orientation, shading, outline etc. can be modified to help you build an effective powerpoint presentation. Any text can be entered at any point in the powerpoint template or slide. Simply DOWNLOAD, TYPE and PRESENT! Get your experiment rolling along. Press the button with our PowerPoint Slidelayout Editable Pie Chart Puzzle Process Ppt Backgrounds.
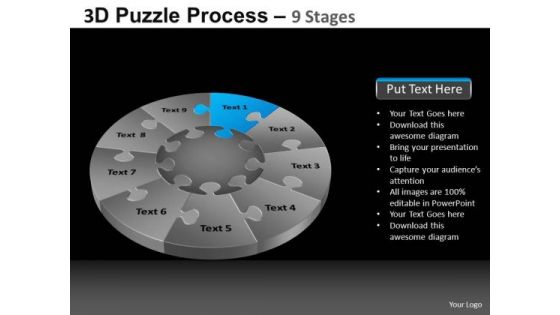
PowerPoint Slidelayout Global Pie Chart Puzzle Process Ppt Slide
PowerPoint Slidelayout Global Pie chart Puzzle Process PPT Slide-These high quality powerpoint pre-designed slides and powerpoint templates have been carefully created by our professional team to help you impress your audience. All slides have been created and are 100% editable in powerpoint. Each and every property of any graphic - color, size, orientation, shading, outline etc. can be modified to help you build an effective powerpoint presentation. Any text can be entered at any point in the powerpoint template or slide. Simply DOWNLOAD, TYPE and PRESENT! Learning from failures leads to success. Assimilate the lessons with our PowerPoint Slidelayout Global Pie Chart Puzzle Process Ppt Slide.
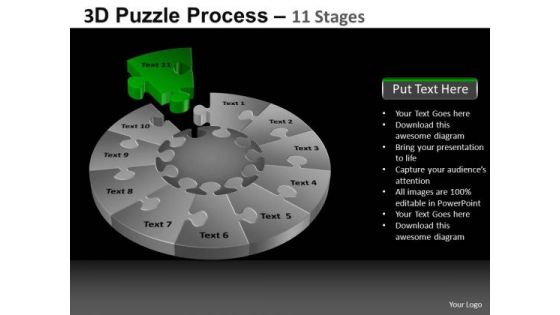
PowerPoint Slidelayout Leadership Pie Chart Puzzle Process Ppt Process
PowerPoint Slidelayout Leadership Pie chart Puzzle Process PPT Process-These high quality powerpoint pre-designed slides and powerpoint templates have been carefully created by our professional team to help you impress your audience. All slides have been created and are 100% editable in powerpoint. Each and every property of any graphic - color, size, orientation, shading, outline etc. can be modified to help you build an effective powerpoint presentation. Any text can be entered at any point in the powerpoint template or slide. Simply DOWNLOAD, TYPE and PRESENT! Coach your organization with our PowerPoint Slidelayout Leadership Pie Chart Puzzle Process Ppt Process. You will come out on top.
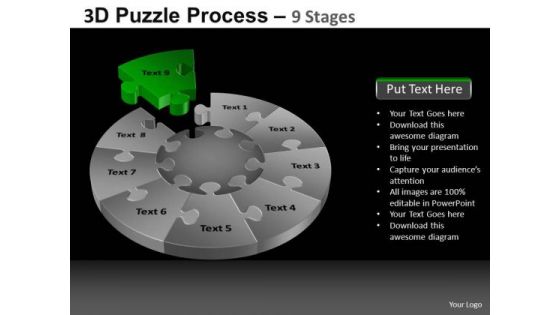
PowerPoint Slides Growth Pie Chart Puzzle Process Ppt Process
PowerPoint Slides Growth Pie chart Puzzle Process PPT Process-These high quality powerpoint pre-designed slides and powerpoint templates have been carefully created by our professional team to help you impress your audience. All slides have been created and are 100% editable in powerpoint. Each and every property of any graphic - color, size, orientation, shading, outline etc. can be modified to help you build an effective powerpoint presentation. Any text can be entered at any point in the powerpoint template or slide. Simply DOWNLOAD, TYPE and PRESENT! Figure on our PowerPoint Slides Growth Pie Chart Puzzle Process Ppt Process for their expertise. They will prove their fibre again and again.
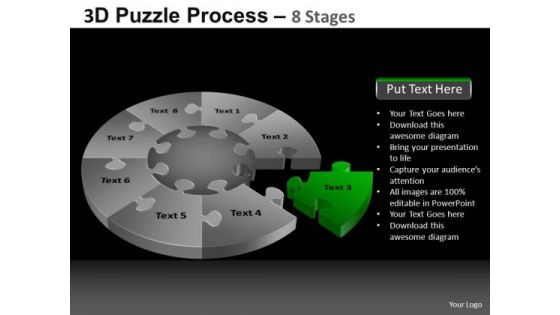
PowerPoint Slides Growth Pie Chart Puzzle Process Ppt Slidelayout
PowerPoint Slides Growth Pie chart Puzzle Process PPT Slidelayout-These high quality powerpoint pre-designed slides and powerpoint templates have been carefully created by our professional team to help you impress your audience. All slides have been created and are 100% editable in powerpoint. Each and every property of any graphic - color, size, orientation, shading, outline etc. can be modified to help you build an effective powerpoint presentation. Any text can be entered at any point in the powerpoint template or slide. Simply DOWNLOAD, TYPE and PRESENT! Don't let criticism concern you. Fend off all blows with our PowerPoint Slides Growth Pie Chart Puzzle Process Ppt Slidelayout.
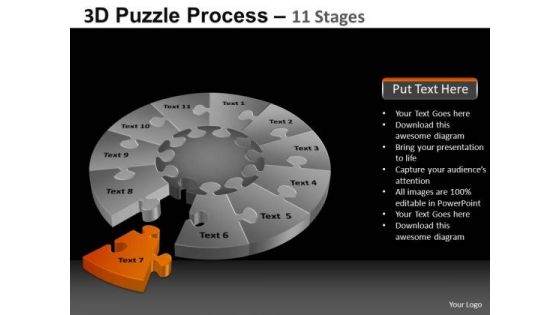
PowerPoint Slides Image Pie Chart Puzzle Process Ppt Layouts
PowerPoint Slides Image Pie chart Puzzle Process PPT Layouts-These high quality powerpoint pre-designed slides and powerpoint templates have been carefully created by our professional team to help you impress your audience. All slides have been created and are 100% editable in powerpoint. Each and every property of any graphic - color, size, orientation, shading, outline etc. can be modified to help you build an effective powerpoint presentation. Any text can be entered at any point in the powerpoint template or slide. Simply DOWNLOAD, TYPE and PRESENT! Deliver fascinating presentations with our PowerPoint Slides Image Pie Chart Puzzle Process Ppt Layouts. Dont waste time struggling with PowerPoint. Let us do it for you.
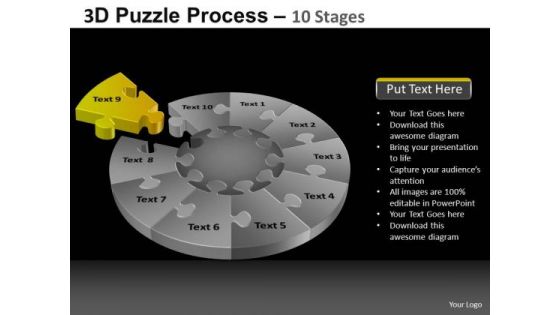
PowerPoint Slides Image Pie Chart Puzzle Process Ppt Slidelayout
PowerPoint Slides Image Pie chart Puzzle Process PPT Slidelayout-These high quality powerpoint pre-designed slides and powerpoint templates have been carefully created by our professional team to help you impress your audience. All slides have been created and are 100% editable in powerpoint. Each and every property of any graphic - color, size, orientation, shading, outline etc. can be modified to help you build an effective powerpoint presentation. Any text can be entered at any point in the powerpoint template or slide. Simply DOWNLOAD, TYPE and PRESENT! Ideas will flower and bloom with our PowerPoint Slides Image Pie Chart Puzzle Process Ppt Slidelayout. Your company will begin to flourish.
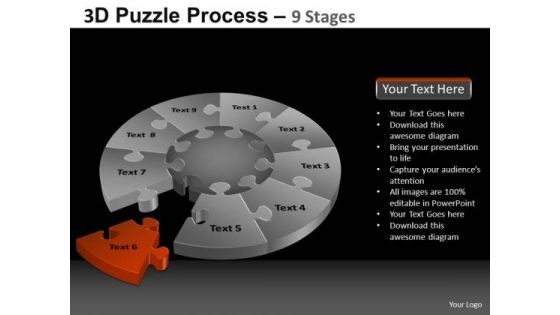
PowerPoint Slides Sales Pie Chart Puzzle Process Ppt Layout
PowerPoint Slides Sales Pie chart Puzzle Process PPT Layout-These high quality powerpoint pre-designed slides and powerpoint templates have been carefully created by our professional team to help you impress your audience. All slides have been created and are 100% editable in powerpoint. Each and every property of any graphic - color, size, orientation, shading, outline etc. can be modified to help you build an effective powerpoint presentation. Any text can be entered at any point in the powerpoint template or slide. Simply DOWNLOAD, TYPE and PRESENT! Drum up a fervour with our PowerPoint Slides Sales Pie Chart Puzzle Process Ppt Layout. You will come out on top.
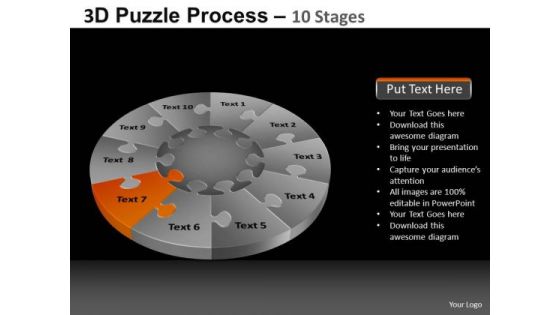
PowerPoint Template Business Pie Chart Puzzle Process Ppt Slides
PowerPoint Template Business Pie chart Puzzle Process PPT Slides-These high quality powerpoint pre-designed slides and powerpoint templates have been carefully created by our professional team to help you impress your audience. All slides have been created and are 100% editable in powerpoint. Each and every property of any graphic - color, size, orientation, shading, outline etc. can be modified to help you build an effective powerpoint presentation. Any text can be entered at any point in the powerpoint template or slide. Simply DOWNLOAD, TYPE and PRESENT! Nip any falsehood in the bud. Our PowerPoint Template Business Pie Chart Puzzle Process Ppt Slides will nourish the truth.
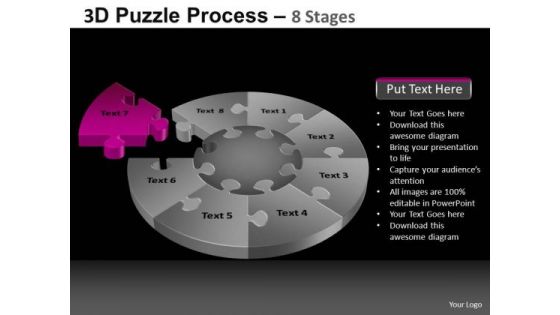
PowerPoint Template Leadership Pie Chart Puzzle Process Ppt Layouts
PowerPoint Template Leadership Pie chart Puzzle Process PPT Layouts-These high quality powerpoint pre-designed slides and powerpoint templates have been carefully created by our professional team to help you impress your audience. All slides have been created and are 100% editable in powerpoint. Each and every property of any graphic - color, size, orientation, shading, outline etc. can be modified to help you build an effective powerpoint presentation. Any text can be entered at any point in the powerpoint template or slide. Simply DOWNLOAD, TYPE and PRESENT! Examine all factors in detail. Give each one close attention with our PowerPoint Template Leadership Pie Chart Puzzle Process Ppt Layouts.
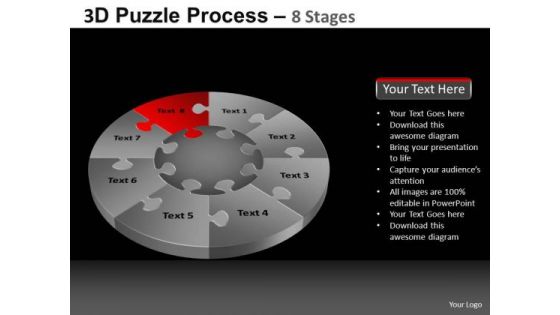
PowerPoint Templates Marketing Pie Chart Puzzle Process Ppt Layouts
PowerPoint Templates Marketing Pie chart Puzzle Process PPT Layouts-These high quality powerpoint pre-designed slides and powerpoint templates have been carefully created by our professional team to help you impress your audience. All slides have been created and are 100% editable in powerpoint. Each and every property of any graphic - color, size, orientation, shading, outline etc. can be modified to help you build an effective powerpoint presentation. Any text can be entered at any point in the powerpoint template or slide. Simply DOWNLOAD, TYPE and PRESENT! Brighten up the day with our PowerPoint Templates Marketing Pie Chart Puzzle Process Ppt Layouts. Dispal any darkness around.
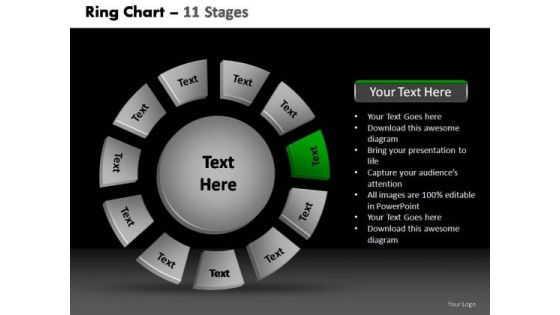
PowerPoint Process Chart Donut With Core Ppt Backgrounds
PowerPoint Process Chart Donut with Core PPT Backgrounds-These amazing PowerPoint pre-designed slides and PowerPoint templates have been carefully created by our team of experts to help you impress your audience. Our stunning collection of Powerpoint slides are 100% editable and can easily fit in any PowerPoint presentations. By using these animations and graphics in PowerPoint and you can easily make professional presentations. Any text can be entered at any point in the PowerPoint template or slide. Just DOWNLOAD our awesome PowerPoint templates and you are ready to go. The adaptability of our PowerPoint Process Chart Donut With Core Ppt Backgrounds is a fact. They will align with your bidding.
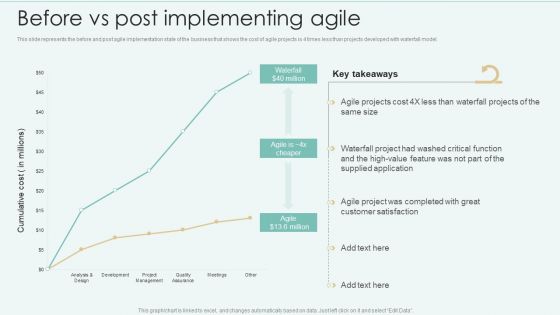
Strategies Of Agile Development To Enhance Processes Before Vs Post Implementing Agile Diagrams PDF
This slide represents the before and post agile implementation state of the business that shows the cost of agile projects is 4 times less than projects developed with waterfall model. Create an editable Strategies Of Agile Development To Enhance Processes Before Vs Post Implementing Agile Diagrams PDF that communicates your idea and engages your audience. Whether you are presenting a business or an educational presentation, pre designed presentation templates help save time. Strategies Of Agile Development To Enhance Processes Before Vs Post Implementing Agile Diagrams PDF is highly customizable and very easy to edit, covering many different styles from creative to business presentations. Slidegeeks has creative team members who have crafted amazing templates. So, go and get them without any delay.
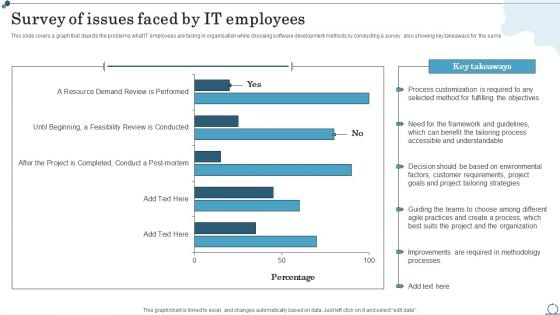
Survey Of Issues Faced By IT Employees Agile IT Methodology In Project Management Diagrams PDF
This slide covers a graph that depicts the problems what IT employees are facing in organisation while choosing software development methods by conducting a survey also showing key takeaways for the same.Get a simple yet stunning designed Survey Of Issues Faced By IT Employees Agile IT Methodology In Project Management Diagrams PDF. It is the best one to establish the tone in your meetings. It is an excellent way to make your presentations highly effective. So, download this PPT today from Slidegeeks and see the positive impacts. Our easy-to-edit Survey Of Issues Faced By IT Employees Agile IT Methodology In Project Management Diagrams PDF can be your go-to option for all upcoming conferences and meetings. So, what are you waiting for Grab this template today.
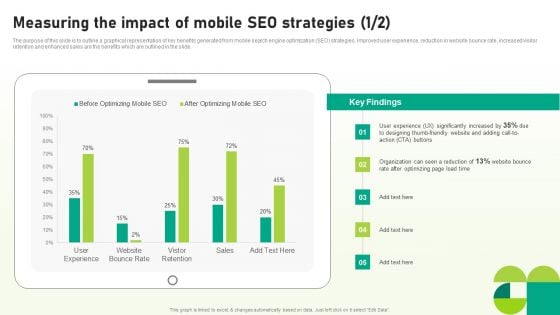
Utilizing SEO To Boost Customer Measuring The Impact Of Mobile SEO Strategies Diagrams PDF
The purpose of this slide is to outline a graphical representation of key benefits generated from mobile search engine optimization SEO strategies. Improved user experience, reduction in website bounce rate, increased visitor retention and enhanced sales are the benefits which are outlined in the slide. Explore a selection of the finest Utilizing SEO To Boost Customer Measuring The Impact Of Mobile SEO Strategies Diagrams PDF here. With a plethora of professionally designed and pre-made slide templates, you can quickly and easily find the right one for your upcoming presentation. You can use our Utilizing SEO To Boost Customer Measuring The Impact Of Mobile SEO Strategies Diagrams PDF to effectively convey your message to a wider audience. Slidegeeks has done a lot of research before preparing these presentation templates. The content can be personalized and the slides are highly editable. Grab templates today from Slidegeeks.
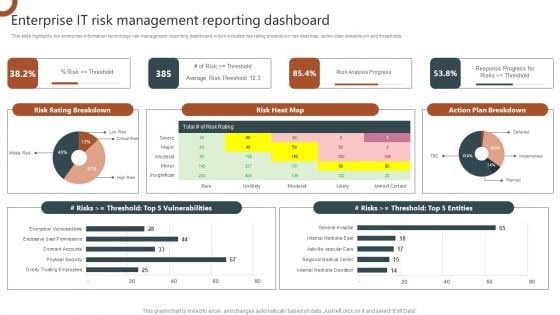
Organizations Risk Management And IT Security Enterprise IT Risk Management Reporting Dashboard Diagrams PDF
This slide highlights the enterprise information technology risk management reporting dashboard which includes risk rating breakdown risk heat map, action plan breakdown and thresholds. This Organizations Risk Management And IT Security Enterprise IT Risk Management Reporting Dashboard Diagrams PDF is perfect for any presentation, be it in front of clients or colleagues. It is a versatile and stylish solution for organizing your meetings. The Organizations Risk Management And IT Security Enterprise IT Risk Management Reporting Dashboard Diagrams PDF features a modern design for your presentation meetings. The adjustable and customizable slides provide unlimited possibilities for acing up your presentation. Slidegeeks has done all the homework before launching the product for you. So, do not wait, grab the presentation templates today.

Workplace Facility Management Services Company Facility Management Services Global Market Scenario Diagrams PDF
This slide highlights the facility management services market share and future growth rate in graphical format which showcases product life cycle of different countries and organized and unorganized sector future growth rate. Explore a selection of the finest Workplace Facility Management Services Company Facility Management Services Global Market Scenario Diagrams PDF here. With a plethora of professionally designed and pre made slide templates, you can quickly and easily find the right one for your upcoming presentation. You can use our Workplace Facility Management Services Company Facility Management Services Global Market Scenario Diagrams PDF to effectively convey your message to a wider audience. Slidegeeks has done a lot of research before preparing these presentation templates. The content can be personalized and the slides are highly editable. Grab templates today from Slidegeeks.
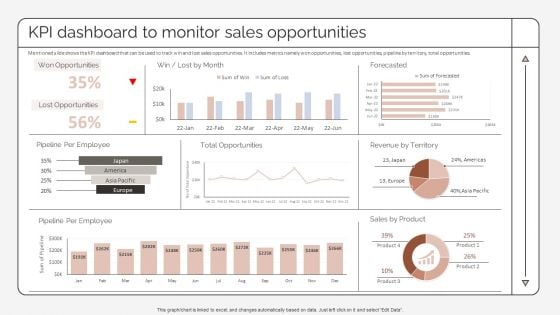
Kpi Dashboard To Monitor Sales Opportunities Strategic Promotion Plan To Improve Product Diagrams PDF
Mentioned slide shows the KPI dashboard that can be used to track win and lost sales opportunities. It includes metrics namely won opportunities, lost opportunities, pipeline by territory, total opportunities.Explore a selection of the finest Kpi Dashboard To Monitor Sales Opportunities Strategic Promotion Plan To Improve Product Diagrams PDF here. With a plethora of professionally designed and pre-made slide templates, you can quickly and easily find the right one for your upcoming presentation. You can use our Kpi Dashboard To Monitor Sales Opportunities Strategic Promotion Plan To Improve Product Diagrams PDF to effectively convey your message to a wider audience. Slidegeeks has done a lot of research before preparing these presentation templates. The content can be personalized and the slides are highly editable. Grab templates today from Slidegeeks.
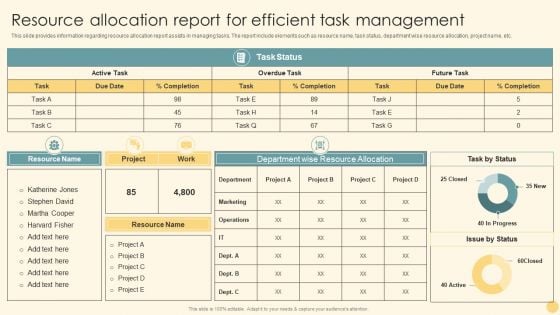
Resource Allocation Report For Efficient Task Management Ppt PowerPoint Presentation File Diagrams PDF
This slide provides information regarding resource allocation report assists in managing tasks. The report include elements such as resource name, task status, department wise resource allocation, project name, etc. Get a simple yet stunning designed Resource Allocation Report For Efficient Task Management Ppt PowerPoint Presentation File Diagrams PDF. It is the best one to establish the tone in your meetings. It is an excellent way to make your presentations highly effective. So, download this PPT today from Slidegeeks and see the positive impacts. Our easy to edit Resource Allocation Report For Efficient Task Management Ppt PowerPoint Presentation File Diagrams PDF can be your go to option for all upcoming conferences and meetings. So, what are you waiting for Grab this template today.
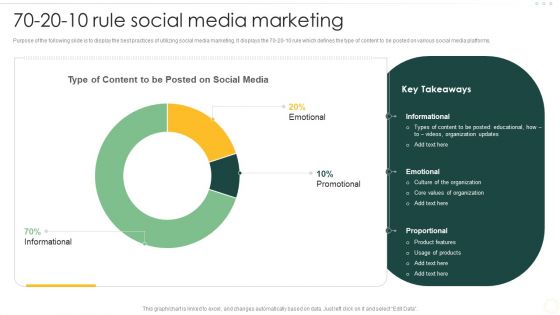
Effective Organizational B2B And B2C 70 20 10 Rule Social Media Marketing Diagrams PDF
Purpose of the following slide is to display the best practices of utilizing social media marketing. It displays the 70-20-10 rule which defines the type of content to be posted on various social media platforms. Do you have an important presentation coming up Are you looking for something that will make your presentation stand out from the rest Look no further than Effective Organizational B2B And B2C 70 20 10 Rule Social Media Marketing Diagrams PDF. With our professional designs, you can trust that your presentation will pop and make delivering it a smooth process. And with Slidegeeks, you can trust that your presentation will be unique and memorable. So why wait Grab Effective Organizational B2B And B2C 70 20 10 Rule Social Media Marketing Diagrams PDF today and make your presentation stand out from the rest.
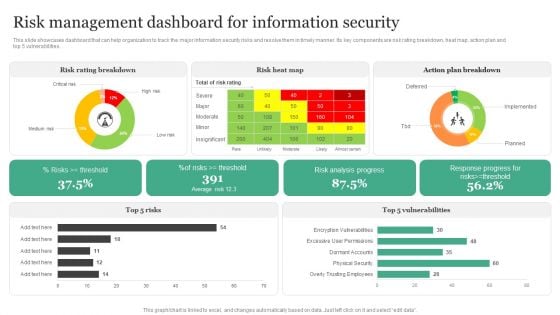
Risk Management Dashboard For Information Security Information Security Risk Administration Diagrams PDF
This slide showcases dashboard that can help organization to track the major information security risks and resolve them in timely manner. Its key components are risk rating breakdown, heat map, action plan and top 5 vulnerabilities.Create an editable Risk Management Dashboard For Information Security Information Security Risk Administration Diagrams PDF that communicates your idea and engages your audience. Whether you are presenting a business or an educational presentation, pre-designed presentation templates help save time. Risk Management Dashboard For Information Security Information Security Risk Administration Diagrams PDF is highly customizable and very easy to edit, covering many different styles from creative to business presentations. Slidegeeks has creative team members who have crafted amazing templates. So, go and get them without any delay.

Global Automotive Industry Research And Analysis Global Motor Vehicle Sales By Region Diagrams PDF
This slide covers a graphical representation of worldwide automobile sales for Europe, Asia, Africa, NAFTA, Central, and South America, etc. It also includes key insights about Chinese car sales expansion, USA sales, Indias sales, etc. Explore a selection of the finest Global Automotive Industry Research And Analysis Global Motor Vehicle Sales By Region Diagrams PDF here. With a plethora of professionally designed and pre made slide templates, you can quickly and easily find the right one for your upcoming presentation. You can use our Global Automotive Industry Research And Analysis Global Motor Vehicle Sales By Region Diagrams PDF to effectively convey your message to a wider audience. Slidegeeks has done a lot of research before preparing these presentation templates. The content can be personalized and the slides are highly editable. Grab templates today from Slidegeeks.

Customer Engagement Methods For Online Platforms Emerging Trends In Mobile Shopping Industry Diagrams PDF
This slide includes statistics related to mobile commerce market size, average time spend by consumers on phone and age based categorization of consumers who do research online before making a purchase. Do you have an important presentation coming up. Are you looking for something that will make your presentation stand out from the rest. Look no further than Customer Engagement Methods For Online Platforms Emerging Trends In Mobile Shopping Industry Diagrams PDF. With our professional designs, you can trust that your presentation will pop and make delivering it a smooth process. And with Slidegeeks, you can trust that your presentation will be unique and memorable. So why wait. Grab Customer Engagement Methods For Online Platforms Emerging Trends In Mobile Shopping Industry Diagrams PDF today and make your presentation stand out from the rest.
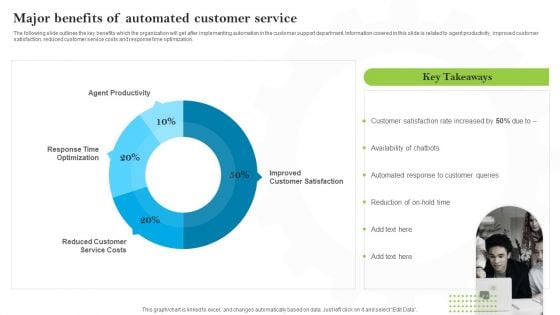
Introducing AI Tools Major Benefits Of Automated Customer Service Diagrams PDF
The following slide outlines the key benefits which the organization will get after implementing automation in the customer support department. Information covered in this slide is related to agent productivity, improved customer satisfaction, reduced customer service costs and response time optimization. Explore a selection of the finest Introducing AI Tools Major Benefits Of Automated Customer Service Diagrams PDF here. With a plethora of professionally designed and pre-made slide templates, you can quickly and easily find the right one for your upcoming presentation. You can use our Introducing AI Tools Major Benefits Of Automated Customer Service Diagrams PDF to effectively convey your message to a wider audience. Slidegeeks has done a lot of research before preparing these presentation templates. The content can be personalized and the slides are highly editable. Grab templates today from Slidegeeks.
Human Augmented Machine Learning IT Augmented Intelligence Information Tracking Dashboard Diagrams PDF
This slide depicts the information tracking dashboard by augmented intelligence model covering the data analysis. Data analysis includes image analysis, storage size, new users on the cloud platform, etc. Get a simple yet stunning designed Human Augmented Machine Learning IT Augmented Intelligence Information Tracking Dashboard Diagrams PDF. It is the best one to establish the tone in your meetings. It is an excellent way to make your presentations highly effective. So, download this PPT today from Slidegeeks and see the positive impacts. Our easy-to-edit Human Augmented Machine Learning IT Augmented Intelligence Information Tracking Dashboard Diagrams PDF can be your go-to option for all upcoming conferences and meetings. So, what are you waiting for. Grab this template today.
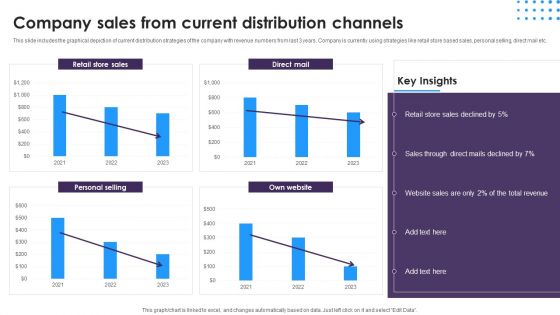
Omnichannel Distribution System To Satisfy Customer Needs Company Sales From Current Distribution Channels Diagrams PDF
This slide includes the graphical depiction of current distribution strategies of the company with revenue numbers from last 3 years. Company is currently using strategies like retail store based sales, personal selling, direct mail etc. Get a simple yet stunning designed Omnichannel Distribution System To Satisfy Customer Needs Company Sales From Current Distribution Channels Diagrams PDF. It is the best one to establish the tone in your meetings. It is an excellent way to make your presentations highly effective. So, download this PPT today from Slidegeeks and see the positive impacts. Our easy-to-edit Omnichannel Distribution System To Satisfy Customer Needs Company Sales From Current Distribution Channels Diagrams PDF can be your go-to option for all upcoming conferences and meetings. So, what are you waiting for Grab this template today.
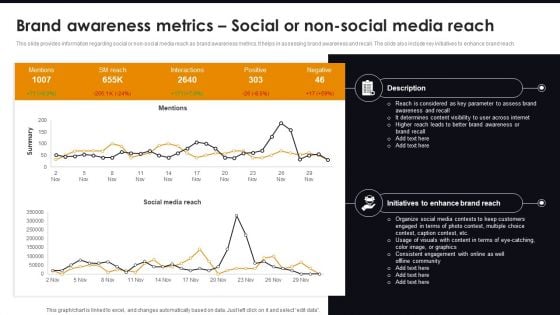
Brand Awareness Metrics Social Or Non-Social Media Reach Comprehensive Guide For Brand Recognition Diagrams PDF
This slide provides information regarding social or non-social media reach as brand awareness metrics. It helps in assessing brand awareness and recall. The slide also include key initiatives to enhance brand reach. Get a simple yet stunning designed Brand Awareness Metrics Social Or Non-Social Media Reach Comprehensive Guide For Brand Recognition Diagrams PDF. It is the best one to establish the tone in your meetings. It is an excellent way to make your presentations highly effective. So, download this PPT today from Slidegeeks and see the positive impacts. Our easy-to-edit Brand Awareness Metrics Social Or Non-Social Media Reach Comprehensive Guide For Brand Recognition Diagrams PDF can be your go-to option for all upcoming conferences and meetings. So, what are you waiting for Grab this template today.
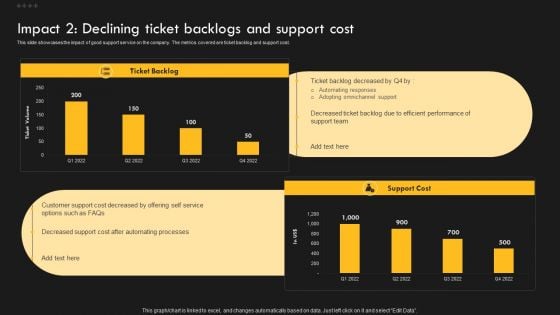
Service Improvement Techniques For Client Retention Impact 2 Declining Ticket Backlogs And Support Diagrams PDF
This slide showcases the impact of good support service on the company. The metrics covered are customer satisfaction and retention. Explore a selection of the finest Service Improvement Techniques For Client Retention Impact 2 Declining Ticket Backlogs And Support Diagrams PDF here. With a plethora of professionally designed and pre-made slide templates, you can quickly and easily find the right one for your upcoming presentation. You can use our Service Improvement Techniques For Client Retention Impact 2 Declining Ticket Backlogs And Support Diagrams PDF to effectively convey your message to a wider audience. Slidegeeks has done a lot of research before preparing these presentation templates. The content can be personalized and the slides are highly editable. Grab templates today from Slidegeeks.
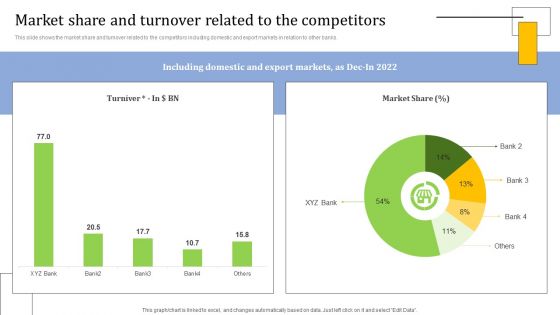
Strategies For Credit Risk Management Market Share And Turnover Related To The Diagrams PDF
This slide shows the market share and turnover related to the competitors including domestic and export markets in relation to other banks. Do you have an important presentation coming up Are you looking for something that will make your presentation stand out from the rest Look no further than Strategies For Credit Risk Management Market Share And Turnover Related To The Diagrams PDF. With our professional designs, you can trust that your presentation will pop and make delivering it a smooth process. And with Slidegeeks, you can trust that your presentation will be unique and memorable. So why wait Grab Strategies For Credit Risk Management Market Share And Turnover Related To The Diagrams PDF today and make your presentation stand out from the rest.
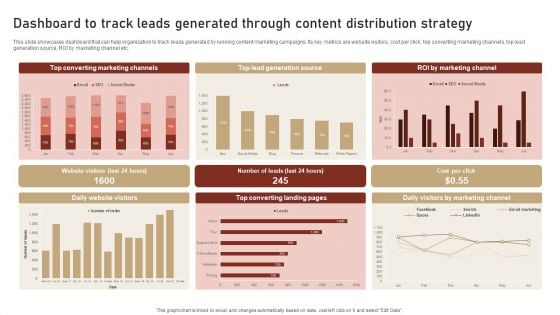
Content Delivery And Promotion Dashboard To Track Leads Generated Through Content Diagrams PDF
This slide showcases dashboard that can help organization to track leads generated by running content marketing campaigns. Its key metrics are website visitors, cost per click, top converting marketing channels, top lead generation source, ROI by marketing channel etc. Do you have an important presentation coming up Are you looking for something that will make your presentation stand out from the rest Look no further than Content Delivery And Promotion Dashboard To Track Leads Generated Through Content Diagrams PDF. With our professional designs, you can trust that your presentation will pop and make delivering it a smooth process. And with Slidegeeks, you can trust that your presentation will be unique and memorable. So why wait Grab Content Delivery And Promotion Dashboard To Track Leads Generated Through Content Diagrams PDF today and make your presentation stand out from the rest.
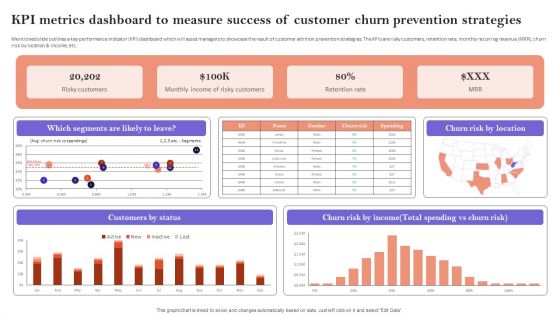
KPI Metrics Dashboard To Measure Success Of Customer Churn Prevention Strategies Diagrams PDF
Mentioned slide outlines a key performance indicator KPI dashboard which will assist managers to showcase the result of customer attrition prevention strategies. The KPIs are risky customers, retention rate, monthly recurring revenue MRR, churn risk by location and income, etc. This KPI Metrics Dashboard To Measure Success Of Customer Churn Prevention Strategies Diagrams PDF is perfect for any presentation, be it in front of clients or colleagues. It is a versatile and stylish solution for organizing your meetings. The KPI Metrics Dashboard To Measure Success Of Customer Churn Prevention Strategies Diagrams PDF features a modern design for your presentation meetings. The adjustable and customizable slides provide unlimited possibilities for acing up your presentation. Slidegeeks has done all the homework before launching the product for you. So, do not wait, grab the presentation templates today
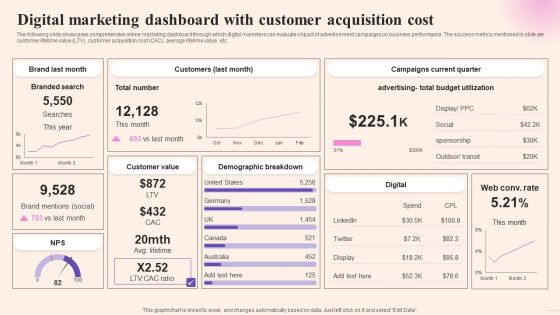
Comprehensive Guide To Build Marketing Digital Marketing Dashboard With Customer Acquisition Diagrams PDF
The following slide showcases comprehensive online marketing dashboard through which digital marketers can evaluate impact of advertisement campaigns on business performance. The success metrics mentioned in slide are customer lifetime value LTV, customer acquisition cost CAC, average lifetime value, etc. Do you have an important presentation coming up Are you looking for something that will make your presentation stand out from the rest Look no further than Comprehensive Guide To Build Marketing Digital Marketing Dashboard With Customer Acquisition Diagrams PDF. With our professional designs, you can trust that your presentation will pop and make delivering it a smooth process. And with Slidegeeks, you can trust that your presentation will be unique and memorable. So why wait Grab Comprehensive Guide To Build Marketing Digital Marketing Dashboard With Customer Acquisition Diagrams PDF today and make your presentation stand out from the rest.
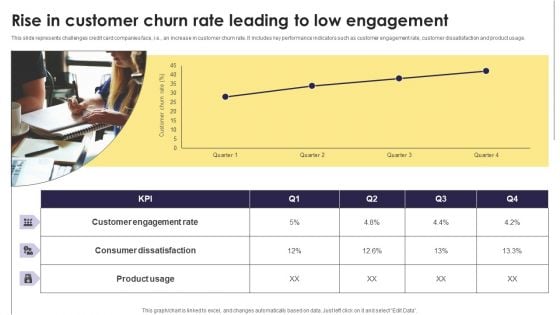
Implementation Of An Efficient Credit Card Promotion Plan Rise In Customer Churn Rate Leading Diagrams PDF
This slide represents challenges credit card companies face, i.e., an increase in customer churn rate. It includes key performance indicators such as customer engagement rate, customer dissatisfaction and product usage. Explore a selection of the finest Implementation Of An Efficient Credit Card Promotion Plan Rise In Customer Churn Rate Leading Diagrams PDF here. With a plethora of professionally designed and pre made slide templates, you can quickly and easily find the right one for your upcoming presentation. You can use our Implementation Of An Efficient Credit Card Promotion Plan Rise In Customer Churn Rate Leading Diagrams PDF to effectively convey your message to a wider audience. Slidegeeks has done a lot of research before preparing these presentation templates. The content can be personalized and the slides are highly editable. Grab templates today from Slidegeeks.
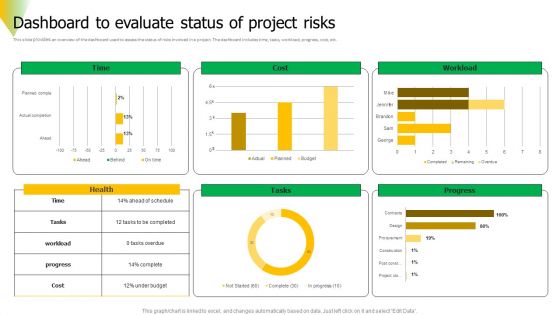
Risk Assessment Dashboard To Evaluate Status Of Project Risks Diagrams PDF
This slide provides an overview of the dashboard used to assess the status of risks involved in a project. The dashboard includes time, tasks, workload, progress, cost, etc. Get a simple yet stunning designed Risk Assessment Dashboard To Evaluate Status Of Project Risks Diagrams PDF. It is the best one to establish the tone in your meetings. It is an excellent way to make your presentations highly effective. So, download this PPT today from Slidegeeks and see the positive impacts. Our easy to edit Risk Assessment Dashboard To Evaluate Status Of Project Risks Diagrams PDF can be your go to option for all upcoming conferences and meetings. So, what are you waiting for Grab this template today.
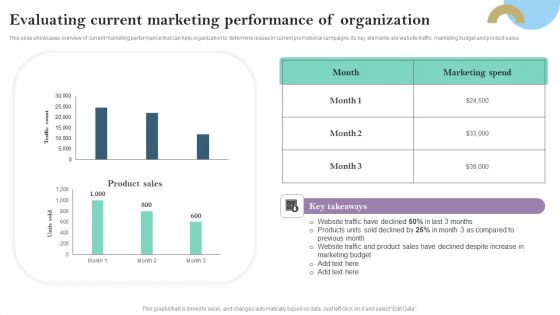
Evaluating Current Marketing Performance Of Organization Ppt PowerPoint Presentation Diagram Templates PDF
This slide showcases overview of current marketing performance that can help organization to determine issues in current promotional campaigns. Its key elements are website traffic, marketing budget and product sales Explore a selection of the finest Evaluating Current Marketing Performance Of Organization Ppt PowerPoint Presentation Diagram Templates PDF here. With a plethora of professionally designed and pre made slide templates, you can quickly and easily find the right one for your upcoming presentation. You can use our Evaluating Current Marketing Performance Of Organization Ppt PowerPoint Presentation Diagram Templates PDF to effectively convey your message to a wider audience. Slidegeeks has done a lot of research before preparing these presentation templates. The content can be personalized and the slides are highly editable. Grab templates today from Slidegeeks.
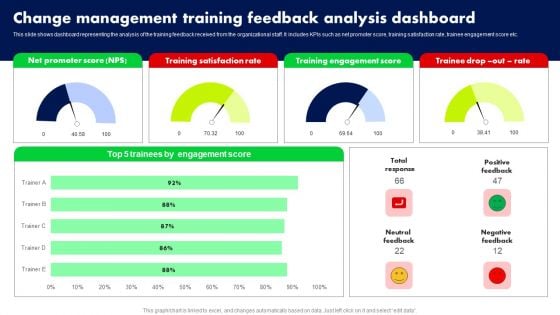
Change Management Training Feedback Analysis Dashboard Ppt PowerPoint Presentation File Diagrams PDF
This slide shows dashboard representing the analysis of the training feedback received from the organizational staff. It includes KPIs such as net promoter score, training satisfaction rate, trainee engagement score etc. Get a simple yet stunning designed Change Management Training Feedback Analysis Dashboard Ppt PowerPoint Presentation File Diagrams PDF. It is the best one to establish the tone in your meetings. It is an excellent way to make your presentations highly effective. So, download this PPT today from Slidegeeks and see the positive impacts. Our easy to edit Change Management Training Feedback Analysis Dashboard Ppt PowerPoint Presentation File Diagrams PDF can be your go to option for all upcoming conferences and meetings. So, what are you waiting for Grab this template today.
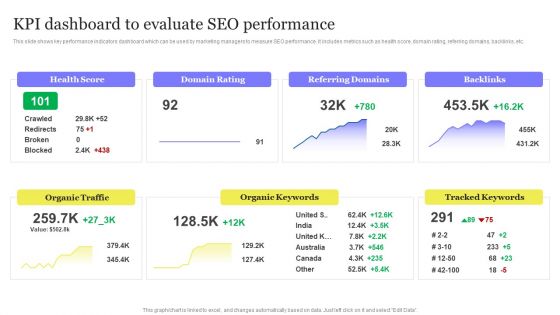
Enhancing Digital Visibility Using SEO Content Strategy KPI Dashboard To Evaluate SEO Performance Diagrams PDF
This slide shows key performance indicators dashboard which can be used by marketing managers to measure SEO performance. It includes metrics such as health score, domain rating, referring domains, backlinks, etc. This Enhancing Digital Visibility Using SEO Content Strategy KPI Dashboard To Evaluate SEO Performance Diagrams PDF is perfect for any presentation, be it in front of clients or colleagues. It is a versatile and stylish solution for organizing your meetings. The Enhancing Digital Visibility Using SEO Content Strategy KPI Dashboard To Evaluate SEO Performance Diagrams PDF features a modern design for your presentation meetings. The adjustable and customizable slides provide unlimited possibilities for acing up your presentation. Slidegeeks has done all the homework before launching the product for you. So, do not wait, grab the presentation templates today
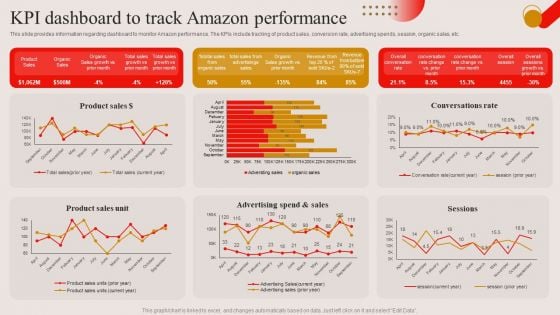
KPI Dashboard To Track Amazon Performance Ppt PowerPoint Presentation Diagram Lists PDF
This slide provides information regarding dashboard to monitor Amazon performance. The KPIs include tracking of product sales, conversion rate, advertising spends, session, organic sales, etc. Explore a selection of the finest KPI Dashboard To Track Amazon Performance Ppt PowerPoint Presentation Diagram Lists PDF here. With a plethora of professionally designed and pre made slide templates, you can quickly and easily find the right one for your upcoming presentation. You can use our KPI Dashboard To Track Amazon Performance Ppt PowerPoint Presentation Diagram Lists PDF to effectively convey your message to a wider audience. Slidegeeks has done a lot of research before preparing these presentation templates. The content can be personalized and the slides are highly editable. Grab templates today from Slidegeeks.
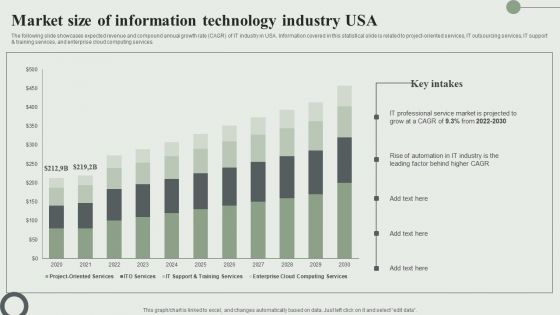
Market Size Of Information Technology Industry USA Ppt PowerPoint Presentation Diagram Lists PDF
The following slide showcases expected revenue and compound annual growth rate CAGR of IT industry in USA. Information covered in this statistical slide is related to project oriented services, IT outsourcing services, IT support and training services, and enterprise cloud computing services. Get a simple yet stunning designed Market Size Of Information Technology Industry USA Ppt PowerPoint Presentation Diagram Lists PDF. It is the best one to establish the tone in your meetings. It is an excellent way to make your presentations highly effective. So, download this PPT today from Slidegeeks and see the positive impacts. Our easy to edit Market Size Of Information Technology Industry USA Ppt PowerPoint Presentation Diagram Lists PDF can be your go to option for all upcoming conferences and meetings. So, what are you waiting for Grab this template today.
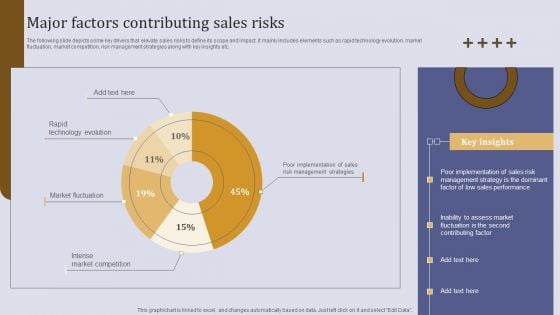
Executing Sales Risk Administration Procedure Major Factors Contributing Sales Risks Diagrams PDF
The following slide depicts some key drivers that elevate sales risks to define its scope and impact. It mainly includes elements such as rapid technology evolution, market fluctuation, market competition, risk management strategies along with key insights etc. Get a simple yet stunning designed Executing Sales Risk Administration Procedure Major Factors Contributing Sales Risks Diagrams PDF. It is the best one to establish the tone in your meetings. It is an excellent way to make your presentations highly effective. So, download this PPT today from Slidegeeks and see the positive impacts. Our easy to edit Executing Sales Risk Administration Procedure Major Factors Contributing Sales Risks Diagrams PDF can be your go to option for all upcoming conferences and meetings. So, what are you waiting for Grab this template today.
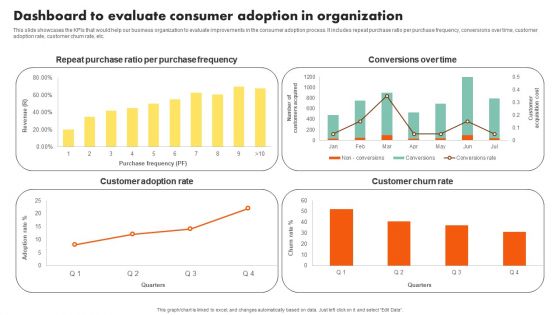
Examining Customer Experience Path To Enhance Adoption Rate Dashboard To Evaluate Consumer Adoption Diagrams PDF
This slide showcases the KPIs that would help our business organization to evaluate improvements in the consumer adoption process. It includes repeat purchase ratio per purchase frequency, conversions over time, customer adoption rate, customer churn rate, etc. Create an editable Examining Customer Experience Path To Enhance Adoption Rate Dashboard To Evaluate Consumer Adoption Diagrams PDF that communicates your idea and engages your audience. Whether youre presenting a business or an educational presentation, pre designed presentation templates help save time. Examining Customer Experience Path To Enhance Adoption Rate Dashboard To Evaluate Consumer Adoption Diagrams PDF is highly customizable and very easy to edit, covering many different styles from creative to business presentations. Slidegeeks has creative team members who have crafted amazing templates. So, go and get them without any delay.
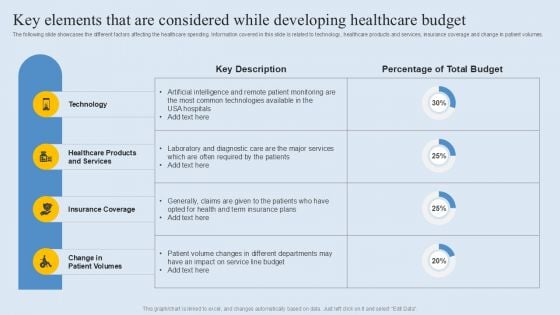
Key Elements That Are Considered While Developing Healthcare Budget Diagrams PDF
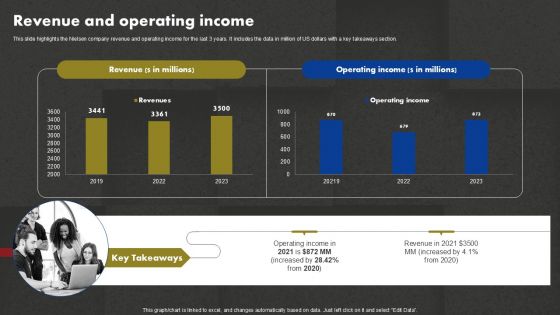
Data And Customer Analysis Company Outline Revenue And Operating Income Diagrams PDF
Enterprise SMS Marketing Subscribers Tracking Dashboard Ppt PowerPoint Presentation Diagram PDF
This slide represents the key metrics dashboard to monito and track the SMS marketing subscribers of the enterprise. It includes details related to KPIs such as total subscribers, new subscribers, total unsubscribes etc. Do you have an important presentation coming up Are you looking for something that will make your presentation stand out from the rest Look no further than Enterprise SMS Marketing Subscribers Tracking Dashboard Ppt PowerPoint Presentation Diagram PDF. With our professional designs, you can trust that your presentation will pop and make delivering it a smooth process. And with Slidegeeks, you can trust that your presentation will be unique and memorable. So why wait Grab Enterprise SMS Marketing Subscribers Tracking Dashboard Ppt PowerPoint Presentation Diagram PDF today and make your presentation stand out from the rest.
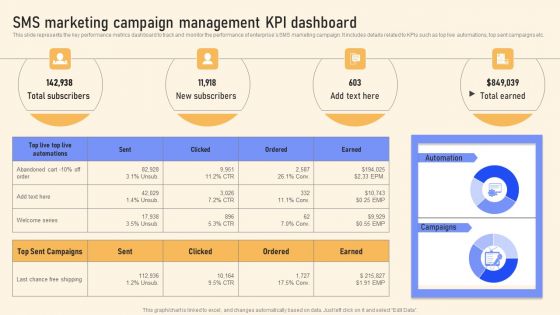
SMS Marketing Campaign Management KPI Dashboard Ppt PowerPoint Presentation Diagram Templates PDF
This slide represents the key performance metrics dashboard to track and monitor the performance of enterprises SMS marketing campaign. It includes details related to KPIs such as top live automations, top sent campaigns etc. Get a simple yet stunning designed SMS Marketing Campaign Management KPI Dashboard Ppt PowerPoint Presentation Diagram Templates PDF. It is the best one to establish the tone in your meetings. It is an excellent way to make your presentations highly effective. So, download this PPT today from Slidegeeks and see the positive impacts. Our easy to edit SMS Marketing Campaign Management KPI Dashboard Ppt PowerPoint Presentation Diagram Templates PDF can be your go to option for all upcoming conferences and meetings. So, what are you waiting for Grab this template today.
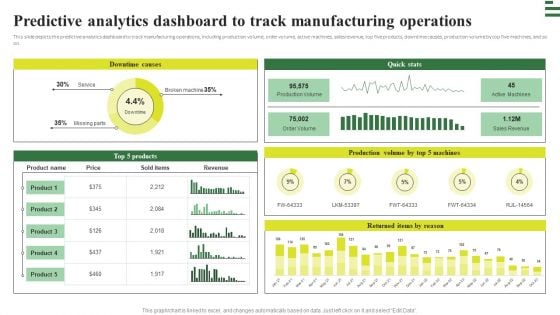
Transforming Manufacturing With Automation Predictive Analytics Dashboard To Track Diagrams PDF
This slide depicts the predictive analytics dashboard to track manufacturing operations, including production volume, order volume, active machines, sales revenue, top five products, downtime causes, production volume by top five machines, and so on. Get a simple yet stunning designed Transforming Manufacturing With Automation Predictive Analytics Dashboard To Track Diagrams PDF. It is the best one to establish the tone in your meetings. It is an excellent way to make your presentations highly effective. So, download this PPT today from Slidegeeks and see the positive impacts. Our easy to edit Transforming Manufacturing With Automation Predictive Analytics Dashboard To Track Diagrams PDF can be your go to option for all upcoming conferences and meetings. So, what are you waiting for Grab this template today.
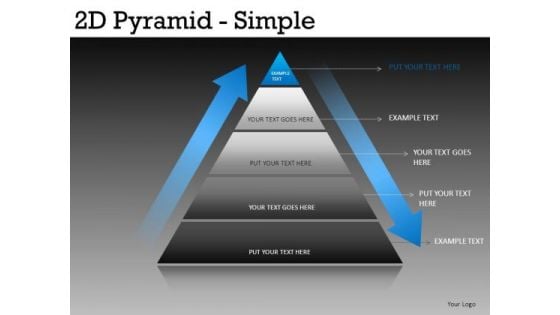
Pyramid Diagrams-pyramid PowerPoint Templates
Pyramid Diagrams-Pyramid PowerPoint Templates-These high quality powerpoint pre-designed slides and powerpoint templates have been carefully created by our professional team to help you impress your audience. All slides have been created and are 100% editable in powerpoint. Each and every property of any graphic - color, size, orientation, shading, outline etc. can be modified to help you build an effective powerpoint presentation. Any text can be entered at any point in the powerpoint template or slide. Simply DOWNLOAD, TYPE and PRESENT! Locate problems with our Pyramid Diagrams-pyramid PowerPoint Templates. Download without worries with our money back guaranteee.
Dashboard For Tracking Brand Awareness Advertisement Campaign Results Designs PDF
This slide showcases dashboard that can help organization to track results of online advertisement campaigns. Its key components ad impressions, click through rate, cost per conversion, revenue per click, impressions, new users and sessions.Are you in need of a template that can accommodate all of your creative concepts This one is crafted professionally and can be altered to fit any style. Use it with Google Slides or PowerPoint. Include striking photographs, symbols, depictions, and other visuals. Fill, move around, or remove text boxes as desired. Test out color palettes and font mixtures. Edit and save your work, or work with colleagues. Download Dashboard For Tracking Brand Awareness Advertisement Campaign Results Designs PDF and observe how to make your presentation outstanding. Give an impeccable presentation to your group and make your presentation unforgettable.
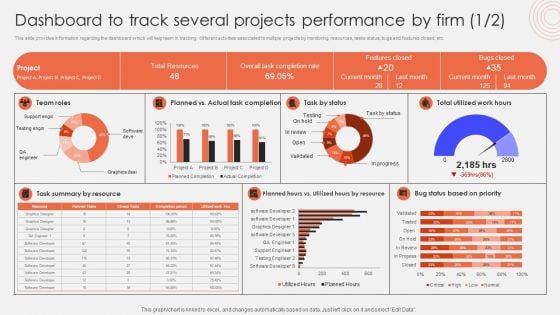
Dashboard To Track Several Projects Performance By Firm Designs PDF
This slide provides information regarding the dashboard which will help team in tracking different activities associated to multiple projects by monitoring resources, tasks status, bugs and features closed, etc. Are you in need of a template that can accommodate all of your creative concepts This one is crafted professionally and can be altered to fit any style. Use it with Google Slides or PowerPoint. Include striking photographs, symbols, depictions, and other visuals. Fill, move around, or remove text boxes as desired. Test out color palettes and font mixtures. Edit and save your work, or work with colleagues. Download Dashboard To Track Several Projects Performance By Firm Designs PDF and observe how to make your presentation outstanding. Give an impeccable presentation to your group and make your presentation unforgettable.
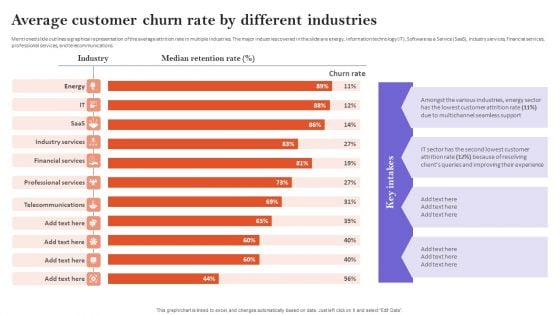
Average Customer Churn Rate By Different Industries Designs PDF
Mentioned slide outlines a graphical representation of the average attrition rate in multiple industries. The major industries covered in the slide are energy, information technology IT, Software as a Service SaaS, industry services, financial services, professional services, and telecommunications. Slidegeeks is one of the best resources for PowerPoint templates. You can download easily and regulate Average Customer Churn Rate By Different Industries Designs PDF for your personal presentations from our wonderful collection. A few clicks is all it takes to discover and get the most relevant and appropriate templates. Use our Templates to add a unique zing and appeal to your presentation and meetings. All the slides are easy to edit and you can use them even for advertisement purposes.
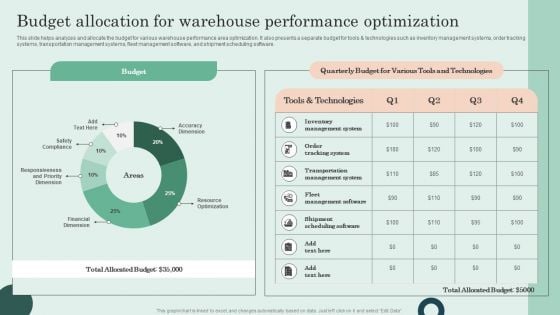
Budget Allocation For Warehouse Performance Optimization Designs PDF
This slide helps analyzes and allocate the budget for various warehouse performance area optimization. It also presents a separate budget for tools and technologies such as inventory management systems, order tracking systems, transportation management systems, fleet management software, and shipment scheduling software. Boost your pitch with our creative Budget Allocation For Warehouse Performance Optimization Designs PDF. Deliver an awe-inspiring pitch that will mesmerize everyone. Using these presentation templates you will surely catch everyones attention. You can browse the ppts collection on our website. We have researchers who are experts at creating the right content for the templates. So you do not have to invest time in any additional work. Just grab the template now and use them.
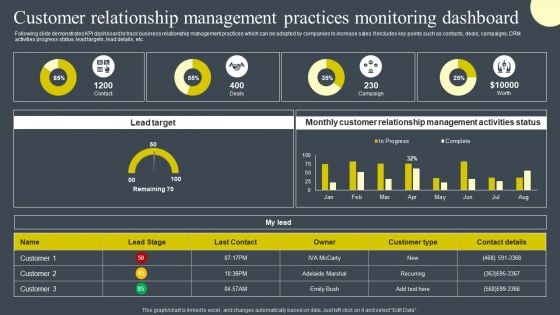
Customer Relationship Management Practices Monitoring Dashboard Designs PDF
Following slide demonstrates KPI dashboard to track business relationship management practices which can be adopted by companies to increase sales. It includes key points such as contacts, deals, campaigns, CRM activities progress status, lead targets, lead details, etc. Are you in need of a template that can accommodate all of your creative concepts This one is crafted professionally and can be altered to fit any style. Use it with Google Slides or PowerPoint. Include striking photographs, symbols, depictions, and other visuals. Fill, move around, or remove text boxes as desired. Test out color palettes and font mixtures. Edit and save your work, or work with colleagues. Download Customer Relationship Management Practices Monitoring Dashboard Designs PDF and observe how to make your presentation outstanding. Give an impeccable presentation to your group and make your presentation unforgettable.
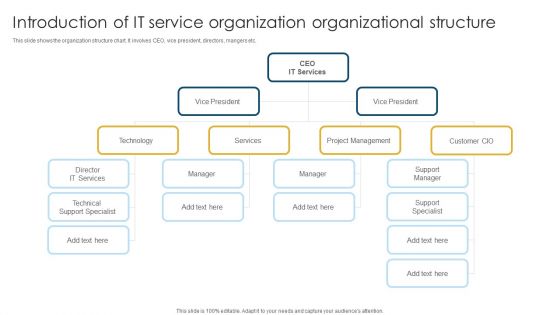
Introduction Of IT Service Organization Organizational Structure Designs PDF
This slide shows the organization structure chart. It involves CEO, vice president, directors, mangers etc. Persuade your audience using this Introduction Of IT Service Organization Organizational Structure Designs PDF. This PPT design covers two stages, thus making it a great tool to use. It also caters to a variety of topics including Vice President, Project Management, Technical Specialist. Download this PPT design now to present a convincing pitch that not only emphasizes the topic but also showcases your presentation skills.
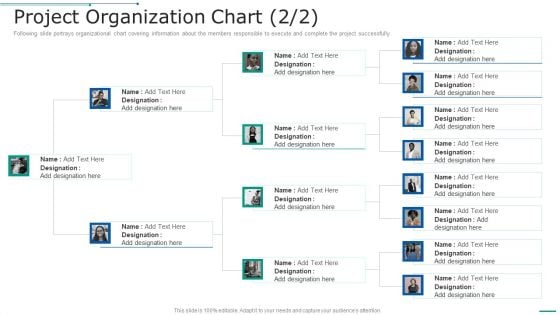
PMP Toolkit Project Organization Chart Project Ppt Pictures Tips PDF
This slide illustrates organizational chart covering information about the members responsible to execute and complete the project successfully. Presenting pmp toolkit project organization chart project ppt pictures tips pdf to provide visual cues and insights. Share and navigate important information on two stages that need your due attention. This template can be used to pitch topics like project organization chart. In addtion, this PPT design contains high resolution images, graphics, etc, that are easily editable and available for immediate download.

Implementing Strategies To Enhance Organizational Hierarchy Chart For Supermarket Chain
This slide covers hierarchy chart for supermarket or grocery store. It involves regional managers, merchandising, public relations and vice president distribution. Take your projects to the next level with our ultimate collection of Implementing Strategies To Enhance Organizational Hierarchy Chart For Supermarket Chain. Slidegeeks has designed a range of layouts that are perfect for representing task or activity duration, keeping track of all your deadlines at a glance. Tailor these designs to your exact needs and give them a truly corporate look with your own brand colors they will make your projects stand out from the rest This slide covers hierarchy chart for supermarket or grocery store. It involves regional managers, merchandising, public relations and vice president distribution.
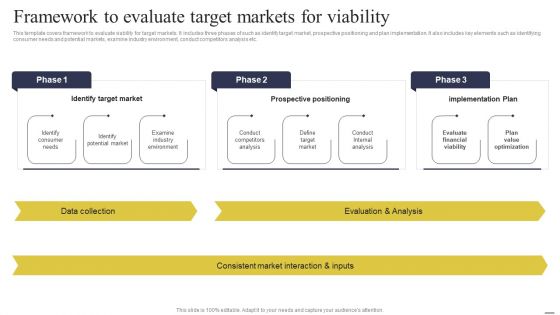
Defining Generic Target Marketing Techniques Framework To Evaluate Target Markets For Viability Clipart PDF
This template covers framework to evaluate viability for target markets. It includes three phases of such as identify target market, prospective positioning and plan implementation. It also includes key elements such as identifying consumer needs and potential markets, examine industry environment, conduct competitors analysis etc. Boost your pitch with our creative Defining Generic Target Marketing Techniques Framework To Evaluate Target Markets For Viability Clipart PDF. Deliver an awe inspiring pitch that will mesmerize everyone. Using these presentation templates you will surely catch everyones attention. You can browse the ppts collection on our website. We have researchers who are experts at creating the right content for the templates. So you do not have to invest time in any additional work. Just grab the template now and use them.
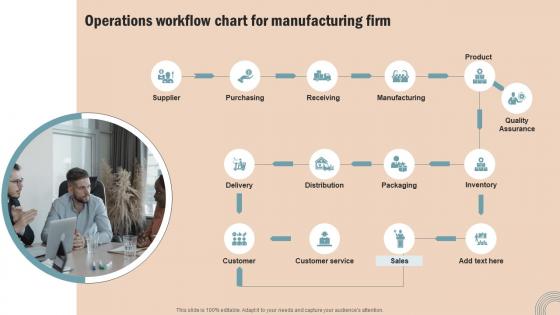
Operations Workflow Chart Operations Strategy Improve Business Productivity Slides Pdf
Presenting this PowerPoint presentation, titled Operations Workflow Chart Operations Strategy Improve Business Productivity Slides Pdf, with topics curated by our researchers after extensive research. This editable presentation is available for immediate download and provides attractive features when used. Download now and captivate your audience. Presenting this Operations Workflow Chart Operations Strategy Improve Business Productivity Slides Pdf. Our researchers have carefully researched and created these slides with all aspects taken into consideration. This is a completely customizable Operations Workflow Chart Operations Strategy Improve Business Productivity Slides Pdf that is available for immediate downloading. Download now and make an impact on your audience. Highlight the attractive features available with our PPTs. Our Operations Workflow Chart Operations Strategy Improve Business Productivity Slides Pdf are topically designed to provide an attractive backdrop to any subject. Use them to look like a presentation pro.
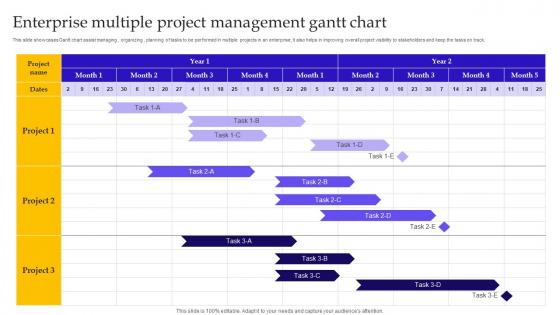
Enterprise Multiple Project Management Gantt Chart Elements Pdf
This slide showcases Gantt chart assist managing, organizing, planning of tasks to be performed in multiple projects in an enterprise, it also helps in improving overall project visibility to stakeholders and keep the tasks on track. Showcasing this set of slides titled Enterprise Multiple Project Management Gantt Chart Elements Pdf. The topics addressed in these templates are Enterprise Multiple Project, Management Gantt Chart, Planning Of Tasks. All the content presented in this PPT design is completely editable. Download it and make adjustments in color, background, font etc. as per your unique business setting. This slide showcases Gantt chart assist managing, organizing, planning of tasks to be performed in multiple projects in an enterprise, it also helps in improving overall project visibility to stakeholders and keep the tasks on track.
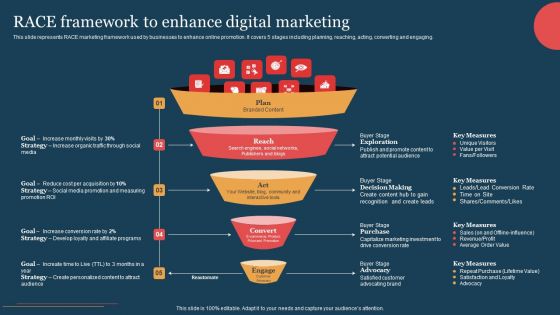
RACE Framework To Enhance Digital Marketing Portrait PDF
This slide represents RACE marketing framework used by businesses to enhance online promotion. It covers 5 stages including planning, reaching, acting, converting and engaging. Are you searching for a RACE Framework To Enhance Digital Marketing Portrait PDF that is uncluttered, straightforward, and original Its easy to edit, and you can change the colors to suit your personal or business branding. For a presentation that expresses how much effort you have put in, this template is ideal With all of its features, including tables, diagrams, statistics, and lists, its perfect for a business plan presentation. Make your ideas more appealing with these professional slides. Download RACE Framework To Enhance Digital Marketing Portrait PDF from Slidegeeks today.
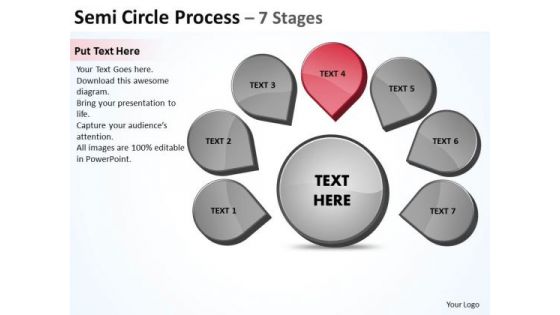
Seven Steps Business PowerPoint Templates Download Strategy Ppt Venn Diagram Slides
We present our seven steps business powerpoint templates download strategy ppt Venn Diagram Slides.Present our Process and Flows PowerPoint Templates because your listeners do not have to put on their thinking caps. Download our Finance PowerPoint Templates because you envisage some areas of difficulty in the near future. The overall financial situation could be a source of worry. Use our Circle Charts PowerPoint Templates because the Venn graphic comprising interlinking circles geometrically demonstate how various functions operating independantly, to a large extent, are essentially interdependant. Download and present our Shapes PowerPoint Templates because there are so many different pieces to the puzzle. Use our Marketing PowerPoint Templates because networking is an imperative in todays world. You need to access the views of others. Similarly you need to give access to them of your abilities.Use these PowerPoint slides for presentations relating to Business, chart, color, concept, connect, connection, corporate, data, design, diagram, financial, flow, flowchart, glassy, glossy, group, important, organize, plan, process, teamwork. The prominent colors used in the PowerPoint template are Pink, Gray, White. The feedback we get is that our seven steps business powerpoint templates download strategy ppt Venn Diagram Slides are Wistful. Customers tell us our connect PowerPoint templates and PPT Slides are designed by professionals Professionals tell us our seven steps business powerpoint templates download strategy ppt Venn Diagram Slides are Glamorous. Customers tell us our data PowerPoint templates and PPT Slides help you meet deadlines which are an element of today's workplace. Just browse and pick the slides that appeal to your intuitive senses. Use our seven steps business powerpoint templates download strategy ppt Venn Diagram Slides are the best it can get when it comes to presenting. Professionals tell us our design PowerPoint templates and PPT Slides are Fancy. Your thoughts will be engraved in the minds of your audience. Our Seven Steps Business PowerPoint Templates Download Strategy Ppt Venn Diagram Slides will etch them in.
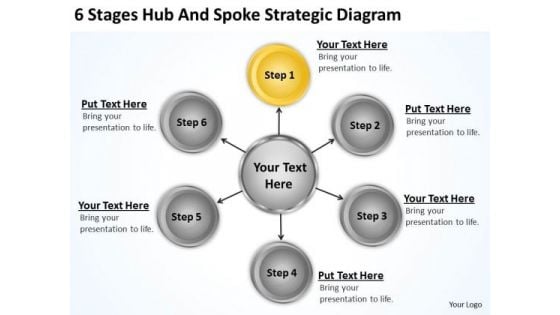
PowerPoint Graphics Business 6 Stages Hub And Spoke Strategic Diagram Ppt Templates
We present our Powerpoint Graphics Business 6 Stages Hub And Spoke Strategic Diagram Ppt Templates.Download our Arrows PowerPoint Templates because It will get your audience in sync. Present our Business PowerPoint Templates because You can Stir your ideas in the cauldron of our PowerPoint Templates and Slides. Cast a magic spell on your audience. Download and present our Circle Charts PowerPoint Templates because You have the co-ordinates for your destination of success. Let our PowerPoint Templates and Slides map out your journey. Present our Shapes PowerPoint Templates because You can Inspire your team with our PowerPoint Templates and Slides. Let the force of your ideas flow into their minds. Use our Process and Flows PowerPoint Templates because It is Aesthetically crafted by artistic young minds. Our PowerPoint Templates and Slides are designed to display your dexterity.Use these PowerPoint slides for presentations relating to 3d, Act, Arrow, Blue, Business, Chart, Circle, Concept, Control, Cycle, Design, Development, Diagram, Evaluate, Flow, Flow-Chart, Flowchart, Fresh, Graphic, Green, Idea, Management, Method, Model, Orange, Process, Purple, Quality, Rainbow, Red, Research, Schema, Spiral, Step, Strategy, Success, System, Vector, White, Work, Workflow, Yellow. The prominent colors used in the PowerPoint template are Gray, Black, White. Give a good account with our PowerPoint Graphics Business 6 Stages Hub And Spoke Strategic Diagram Ppt Templates. Put your views across with clarity.
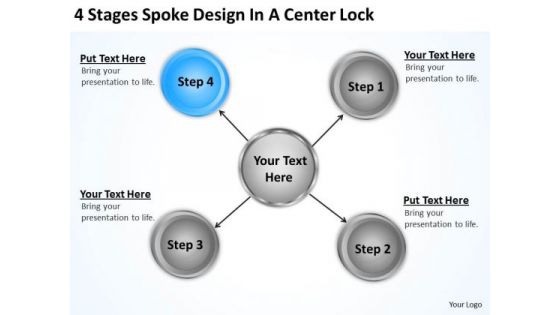
Work Flow Business Process Diagram Lock Ppt PowerPoint Templates Backgrounds For Slides
We present our Work Flow Business Process Diagram Lock Ppt Powerpoint Templates Backgrounds For Slides.Download our Arrows PowerPoint Templates because You can Double your output with our PowerPoint Templates and Slides. They make beating deadlines a piece of cake. Use our Business PowerPoint Templates because Our PowerPoint Templates and Slides are designed to help you succeed. They have all the ingredients you need. Use our Circle Charts PowerPoint Templates because Our PowerPoint Templates and Slides are the chords of your song. String them along and provide the lilt to your views. Download our Shapes PowerPoint Templates because You can Bait your audience with our PowerPoint Templates and Slides. They will bite the hook of your ideas in large numbers. Present our Process and Flows PowerPoint Templates because Our PowerPoint Templates and Slides will let Your superior ideas hit the target always and everytime.Use these PowerPoint slides for presentations relating to 3d, Act, Arrow, Blue, Business, Chart, Circle, Concept, Control, Cycle, Design, Development, Diagram, Evaluate, Flow, Flow-Chart, Flowchart, Fresh, Graphic, Green, Idea, Management, Method, Model, Orange, Process, Purple, Quality, Rainbow, Red, Research, Schema, Spiral, Step, Strategy, Success, System, Vector, White, Work, Workflow, Yellow. The prominent colors used in the PowerPoint template are Blue, Gray, Black. Meet your targets with our Work Flow Business Process Diagram Lock Ppt PowerPoint Templates Backgrounds For Slides. You will come out on top.
Business Process Flow Chart PowerPoint Templates 2010 Slides
We present our business process flow chart powerpoint templates 2010 Slides.Download our Advertising PowerPoint Templates because It will let you Set new benchmarks with our PowerPoint Templates and Slides. They will keep your prospects well above par. Download our Arrows PowerPoint Templates because Our PowerPoint Templates and Slides has conjured up a web of all you need with the help of our great team. Use them to string together your glistening ideas. Download and present our Shapes PowerPoint Templates because Our PowerPoint Templates and Slides will generate and maintain the level of interest you desire. They will create the impression you want to imprint on your audience. Use our Process and Flows PowerPoint Templates because It will let you Set new benchmarks with our PowerPoint Templates and Slides. They will keep your prospects well above par. Download and present our Business PowerPoint Templates because Our PowerPoint Templates and Slides are created with admirable insight. Use them and give your group a sense of your logical mind.Use these PowerPoint slides for presentations relating to Arrow, business, button, chart, circle, cycle, define, deploy, develop, diagram, eps10, flow, graphic, illustration, improvement, integrate, lifecycle, line, measure, ongoing, optimize, pattern, process, relationship, role, round, shape, text, transparency, vector, wave, wheel. The prominent colors used in the PowerPoint template are Blue, White, Gray. The feedback we get is that our business process flow chart powerpoint templates 2010 Slides are second to none. The feedback we get is that our define PowerPoint templates and PPT Slides will generate and maintain the level of interest you desire. They will create the impression you want to imprint on your audience. Professionals tell us our business process flow chart powerpoint templates 2010 Slides will help them to explain complicated concepts. Professionals tell us our circle PowerPoint templates and PPT Slides are aesthetically designed to attract attention. We guarantee that they will grab all the eyeballs you need. Presenters tell us our business process flow chart powerpoint templates 2010 Slides are aesthetically designed to attract attention. We guarantee that they will grab all the eyeballs you need. You can be sure our chart PowerPoint templates and PPT Slides look good visually. Buzz the right word with our Business Process Flow Chart PowerPoint Templates 2010 Slides. You will come out on top.
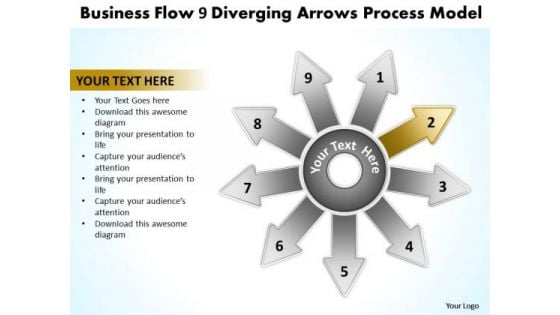
Presentation Flow 9 Diverging Arrows Process Model Cycle Diagram PowerPoint Templates
We present our presentation flow 9 diverging arrows process model Cycle Diagram PowerPoint templates.Download and present our Process and Flows PowerPoint Templates because you have the right arrows in your quiver. Present our Arrows PowerPoint Templates because our templates illustrates your ability. Download our Marketing PowerPoint Templates because customer satisfaction is a mantra of the marketplace. Building a loyal client base is an essential element of your business. Use our Flow charts PowerPoint Templates because you know your business and have a vision for it. Present our Targets PowerPoint Templates because this slide illustrates your thoughts and experiences to your staff.Use these PowerPoint slides for presentations relating to Arrow, background, banner,yellow, concept,creative, design, direction, flow, ten,illustration, infographic, instruction, label,layout, manual, marketing, modern, next,number, offer, one, options, order,pointer, process, product,promotion, sequence, simple, special,step, symbol. The prominent colors used in the PowerPoint template are Yellow, Black, White. Customers tell us our presentation flow 9 diverging arrows process model Cycle Diagram PowerPoint templates are Luxurious. We assure you our design PowerPoint templates and PPT Slides are designed to make your presentations professional. PowerPoint presentation experts tell us our presentation flow 9 diverging arrows process model Cycle Diagram PowerPoint templates will make the presenter look like a pro even if they are not computer savvy. People tell us our creative PowerPoint templates and PPT Slides are Enchanting. We assure you our presentation flow 9 diverging arrows process model Cycle Diagram PowerPoint templates are Magical. Use our design PowerPoint templates and PPT Slides are Excellent. Drive home your point with our Presentation Flow 9 Diverging Arrows Process Model Cycle Diagram PowerPoint Templates. You will come out on top.
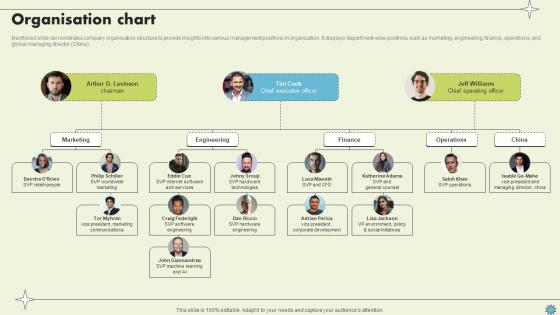
Organisation Chart Consumer Electronics Company Profile CP SS V
Mentioned slide demonstrates company organisation structure to provide insights into various management positions in organization. It displays department-wise positions such as marketing, engineering, finance, operations, and global managing director ChinaIf your project calls for a presentation, then Slidegeeks is your go-to partner because we have professionally designed, easy-to-edit templates that are perfect for any presentation. After downloading, you can easily edit Organisation Chart Consumer Electronics Company Profile CP SS V and make the changes accordingly. You can rearrange slides or fill them with different images. Check out all the handy templates Mentioned slide demonstrates company organisation structure to provide insights into various management positions in organization. It displays department-wise positions such as marketing, engineering, finance, operations, and global managing director China
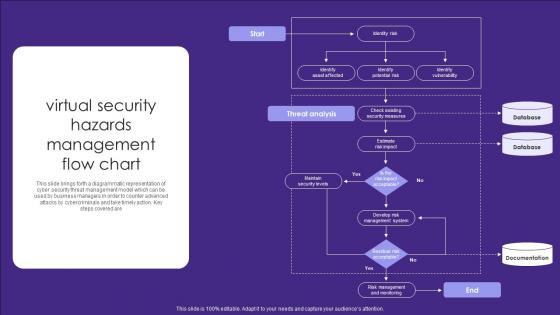
Virtual Security Hazards Management Flow Chart Infographics Pdf
This slide brings forth a diagrammatic representation of cyber security threat management model which can be used by business managers in order to counter advanced attacks by cybercriminals and take timely action. Key steps covered are Showcasing this set of slides titled Virtual Security Hazards Management Flow Chart Infographics Pdf. The topics addressed in these templates are Security Measures, Database, Documentation. All the content presented in this PPT design is completely editable. Download it and make adjustments in color, background, font etc. as per your unique business setting. This slide brings forth a diagrammatic representation of cyber security threat management model which can be used by business managers in order to counter advanced attacks by cybercriminals and take timely action. Key steps covered are
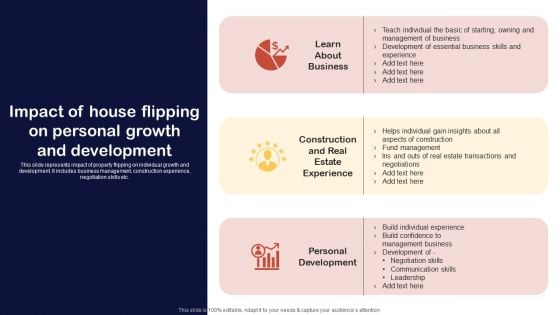
Synopsis For House Flipping Techniques Impact Of House Flipping On Personal Growth Development Formats PDF
This slide represents impact of property flipping on individual growth and development. It includes business management, construction experience, negotiation skills etc. Whether you have daily or monthly meetings, a brilliant presentation is necessary. Synopsis For House Flipping Techniques Impact Of House Flipping On Personal Growth Development Formats PDF can be your best option for delivering a presentation. Represent everything in detail using Synopsis For House Flipping Techniques Impact Of House Flipping On Personal Growth Development Formats PDF and make yourself stand out in meetings. The template is versatile and follows a structure that will cater to your requirements. All the templates prepared by Slidegeeks are easy to download and edit. Our research experts have taken care of the corporate themes as well. So, give it a try and see the results.
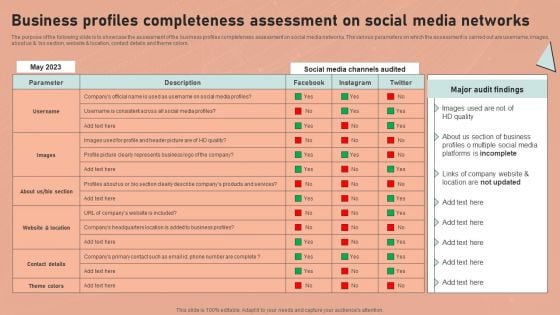
Definitive Guide To Conduct Digital Marketing Inspection Business Profiles Completeness Assessment Guidelines PDF
The purpose of the following slide is to showcase the assessment of the business profiles completeness assessment on social media networks. The various parameters on which the assessment is carried out are username, images, about us and bio section, website and location, contact details and theme colors. Crafting an eye catching presentation has never been more straightforward. Let your presentation shine with this tasteful yet straightforward Definitive Guide To Conduct Digital Marketing Inspection Business Profiles Completeness Assessment Guidelines PDF template. It offers a minimalistic and classy look that is great for making a statement. The colors have been employed intelligently to add a bit of playfulness while still remaining professional. Construct the ideal Definitive Guide To Conduct Digital Marketing Inspection Business Profiles Completeness Assessment Guidelines PDF that effortlessly grabs the attention of your audience. Begin now and be certain to wow your customers.
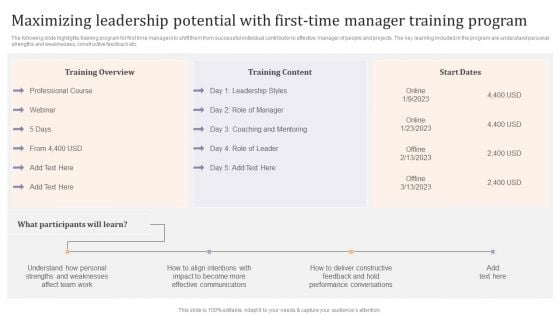
Maximizing Leadership Potential With First Time Manager Training Program Ppt Styles Example PDF
The following slide highlights training program for first time managers to shift them from successful individual contributor to effective manager of people and projects. The key learning included in the program are understand personal strengths and weaknesses, constructive feedback etc. Whether you have daily or monthly meetings, a brilliant presentation is necessary. Maximizing Leadership Potential With First Time Manager Training Program Ppt Styles Example PDF can be your best option for delivering a presentation. Represent everything in detail using Maximizing Leadership Potential With First Time Manager Training Program Ppt Styles Example PDF and make yourself stand out in meetings. The template is versatile and follows a structure that will cater to your requirements. All the templates prepared by Slidegeeks are easy to download and edit. Our research experts have taken care of the corporate themes as well. So, give it a try and see the results.
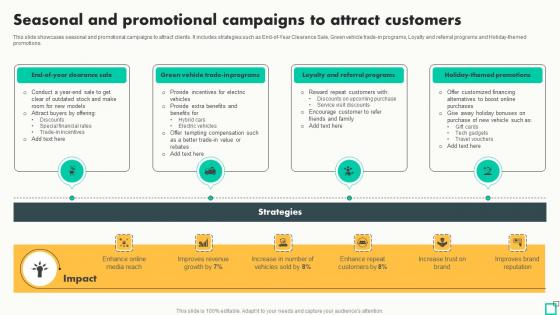
Seasonal And Promotional Campaigns To Attract Innovative Tactics For Revving Up Strategy SS
This slide showcases seasonal and promotional campaigns to attract clients. It includes strategies such as End-of-Year Clearance Sale, Green vehicle trade-in programs, Loyalty and referral programs and Holiday-themed promotions. Slidegeeks has constructed Seasonal And Promotional Campaigns To Attract Innovative Tactics For Revving Up Strategy SS after conducting extensive research and examination. These presentation templates are constantly being generated and modified based on user preferences and critiques from editors. Here, you will find the most attractive templates for a range of purposes while taking into account ratings and remarks from users regarding the content. This is an excellent jumping-off point to explore our content and will give new users an insight into our top-notch PowerPoint Templates. This slide showcases seasonal and promotional campaigns to attract clients. It includes strategies such as End-of-Year Clearance Sale, Green vehicle trade-in programs, Loyalty and referral programs and Holiday-themed promotions.
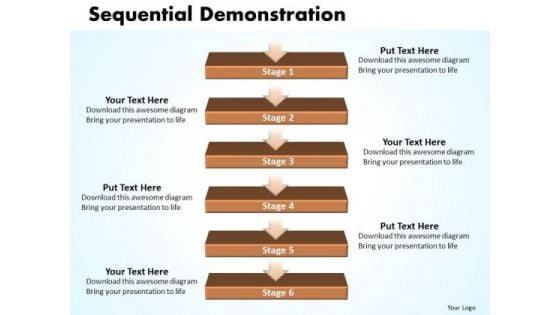
Ppt Linear Flow PowerPoint Theme 6 Stages1 Templates
PPT linear flow powerpoint theme 6 stages1 Templates-You can easily collaborate this PowerPoint diagram with colleagues to create detailed process diagrams and use them as a key element in streamlining your processes. -PPT linear flow powerpoint theme 6 stages1 Templates-Advertising, Arrow, Concept, Corporate, Creative, Design, Direction, Flow, Illustration, Info, Graphic, Instruction, Label, Layout, Manual, Modern, Number, Offer, Order, Pointer, Product, Progress, Promotion, Sequence, Special, Step, Symbol Our Ppt Linear Flow PowerPoint Theme 6 Stages1 Templates have an enduring feature. They constantly remind people of your views.
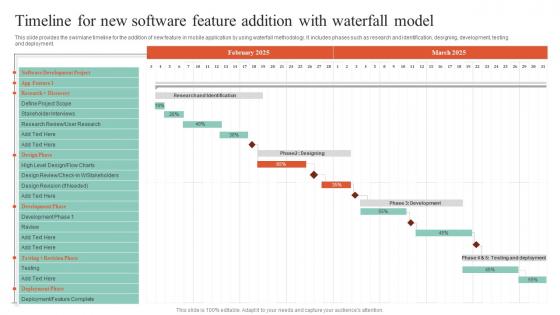
Executing Guide For Waterfall Timeline For New Software Feature Addition With Waterfall Diagrams Pdf
This slide provides the swimlane timeline for the addition of new feature in mobile application by using waterfall methodology. It includes phases such as research and identification, designing, development, testing and deployment. If you are looking for a format to display your unique thoughts, then the professionally designed Executing Guide For Waterfall Timeline For New Software Feature Addition With Waterfall Diagrams Pdf is the one for you. You can use it as a Google Slides template or a PowerPoint template. Incorporate impressive visuals, symbols, images, and other charts. Modify or reorganize the text boxes as you desire. Experiment with shade schemes and font pairings. Alter, share or cooperate with other people on your work. Download Executing Guide For Waterfall Timeline For New Software Feature Addition With Waterfall Diagrams Pdf and find out how to give a successful presentation. Present a perfect display to your team and make your presentation unforgettable. This slide provides the swimlane timeline for the addition of new feature in mobile application by using waterfall methodology. It includes phases such as research and identification, designing, development, testing and deployment.
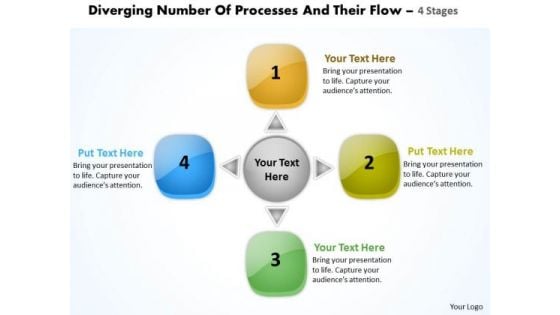
Diverging Number Of Processes And Their Flow 4 Stages Cycle Diagram PowerPoint Slides
We present our diverging number of processes and their flow 4 stages Cycle Diagram PowerPoint Slides.Download and present our Boxes PowerPoint Templates because this slide is Designed to help bullet-point your views and thoughts. Download our Business PowerPoint Templates because this template can project the path to sucess that you have charted. Use our Arrows PowerPoint Templates because let your words be the drops of wisdom spreading knowledge and peace like ripples through the expectant minds of your devoted followers. Download and present our Shapes PowerPoint Templates because you can Focus on each one and investigate which one would be the best fit for your needs. Download and present our Flow Charts PowerPoint Templates because this diagram has the unique ability to drive home your ideas and show how they mesh to guarantee success.Use these PowerPoint slides for presentations relating to 3d, abstract, algorithm, arrow, background, blank, block, box, business, chain, chart, circle, colorful, concept, connect, connection, corporate, design, diagram, empty, flow, flowchart, graph, graphic, hierarchy, illustration, information, isolated, management, network, organisation, organization, organize, plan, procedure, process, program, scalable, shape, sign, solution, structure, symbol, teamwork, technology,. The prominent colors used in the PowerPoint template are Green, Blue, Yellow. Presenters tell us our diverging number of processes and their flow 4 stages Cycle Diagram PowerPoint Slides are visually appealing. You can be sure our algorithm PowerPoint templates and PPT Slides are Youthful. Professionals tell us our diverging number of processes and their flow 4 stages Cycle Diagram PowerPoint Slides are second to none. People tell us our arrow PowerPoint templates and PPT Slides are Adorable. People tell us our diverging number of processes and their flow 4 stages Cycle Diagram PowerPoint Slides are Amazing. Professionals tell us our business PowerPoint templates and PPT Slides are Gorgeous. Feel like a celebrity with our Diverging Number Of Processes And Their Flow 4 Stages Cycle Diagram PowerPoint Slides. They ensure ample adulation.
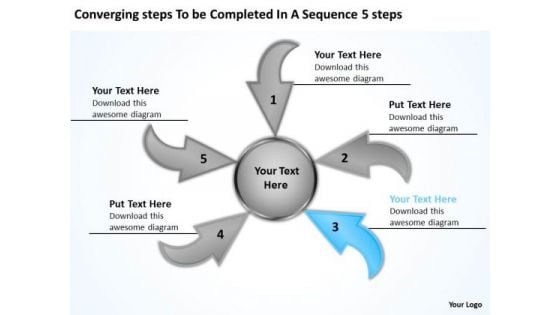
Steps To Be Completed In A Sequence 5 Circular Process Diagram PowerPoint Templates
We present our steps to be completed in a sequence 5 Circular Process Diagram PowerPoint templates.Download our Arrows PowerPoint Templates because this slide depicts the occasion for gifting and giving. Use our Process and Flows PowerPoint Templates because this layout helps you to see satisfaction spread across the room as they unravel your gifted views. Present our Flow Charts PowerPoint Templates because it outlines the process with this innovative graphic to authenticate your plan of achieving the goal of added value/profit. Use our Business PowerPoint Templates because this template helps you to grab the attention of your listeners. Use our Shapes PowerPoint Templates because this slide illustrates your thoughts and experiences to your staff.Use these PowerPoint slides for presentations relating to Arrow, Business, Chart, Circular, Concept, Diagram, Informative, Internet, Market, Marketing, Member, Performance, Process, Profit, Profitable, Project, Refer, Referral, Referring, Revenue, Socialize, Steps, Strategy, Web, Websites. The prominent colors used in the PowerPoint template are Blue light, Gray, Black. People tell us our steps to be completed in a sequence 5 Circular Process Diagram PowerPoint templates are Stylish. People tell us our Diagram PowerPoint templates and PPT Slides are Sparkling. The feedback we get is that our steps to be completed in a sequence 5 Circular Process Diagram PowerPoint templates are Royal. Presenters tell us our Internet PowerPoint templates and PPT Slides are designed by professionals Customers tell us our steps to be completed in a sequence 5 Circular Process Diagram PowerPoint templates are topically designed to provide an attractive backdrop to any subject. The feedback we get is that our Chart PowerPoint templates and PPT Slides will make you look like a winner. Open up the windows of your mind. Unlatch them with our Steps To Be Completed In A Sequence 5 Circular Process Diagram PowerPoint Templates.
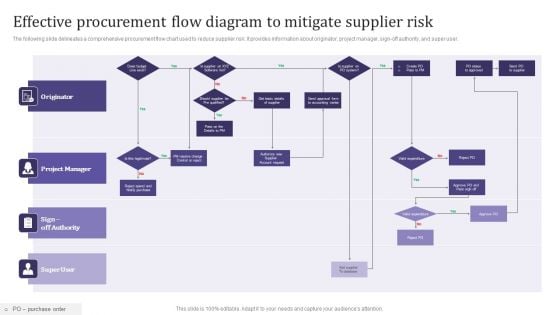
Effective Procurement Flow Diagram To Mitigate Supplier Risk Infographics PDF
The following slide delineates a comprehensive procurement flow chart used to reduce supplier risk. It provides information about originator, project manager, sign-off authority, and super user. Persuade your audience using this Effective Procurement Flow Diagram To Mitigate Supplier Risk Infographics PDF. This PPT design covers four stages, thus making it a great tool to use. It also caters to a variety of topics including Project Manager, Originator, Super User. Download this PPT design now to present a convincing pitch that not only emphasizes the topic but also showcases your presentation skills.
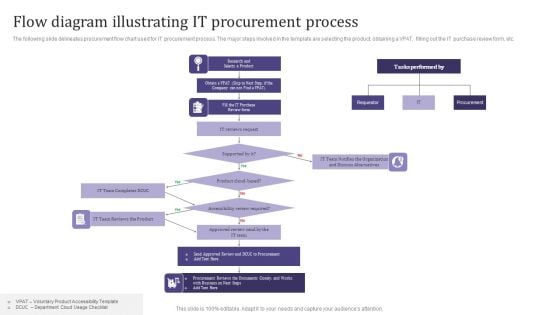
Flow Diagram Illustrating It Procurement Process Infographics PDF
The following slide delineates procurement flow chart used for IT procurement process. The major steps involved in the template are selecting the product, obtaining a VPAT, filling out the IT purchase review form, etc. Persuade your audience using this Flow Diagram Illustrating It Procurement Process Infographics PDF. This PPT design covers one stages, thus making it a great tool to use. It also caters to a variety of topics including Product, Required, Organization. Download this PPT design now to present a convincing pitch that not only emphasizes the topic but also showcases your presentation skills.
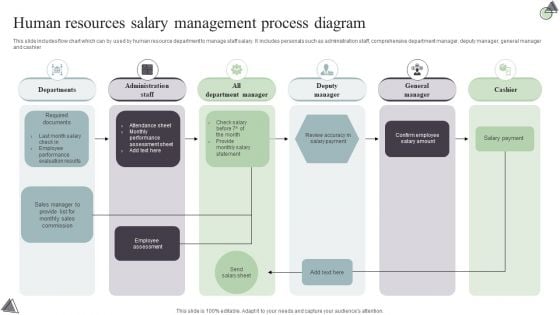
Human Resources Salary Management Process Diagram Download PDF
This slide includes flow chart which can by used by human resource department to manage staff salary. It includes personals such as administration staff, comprehensive department manager, deputy manager, general manager and cashier. Persuade your audience using this Human Resources Salary Management Process Diagram Download PDF. This PPT design covers six stages, thus making it a great tool to use. It also caters to a variety of topics including Departments, Administration Staff, All Department Manager, Deputy Manager, General Manager, Cashier. Download this PPT design now to present a convincing pitch that not only emphasizes the topic but also showcases your presentation skills.
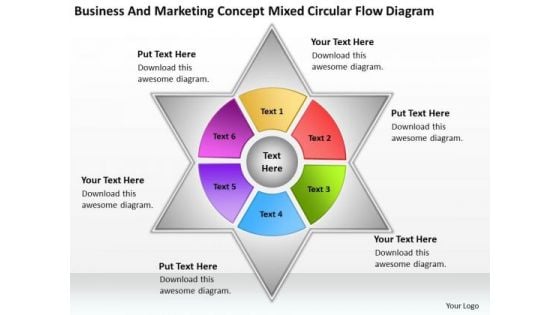
And Marketing Concept Mixed Circular Flow Diagram What Is Business Plan PowerPoint Templates
We present our and marketing concept mixed circular flow diagram what is business plan PowerPoint templates.Use our Flow Charts PowerPoint Templates because It will Raise the bar of your Thoughts. They are programmed to take you to the next level. Download and present our Process and Flows PowerPoint Templates because It is Aesthetically crafted by artistic young minds. Our PowerPoint Templates and Slides are designed to display your dexterity. Download and present our Marketing PowerPoint Templates because Our PowerPoint Templates and Slides will help you be quick off the draw. Just enter your specific text and see your points hit home. Download and present our Success PowerPoint Templates because You have a driving passion to excel in your field. Our PowerPoint Templates and Slides will prove ideal vehicles for your ideas. Download our Shapes PowerPoint Templates because It is Aesthetically crafted by artistic young minds. Our PowerPoint Templates and Slides are designed to display your dexterity.Use these PowerPoint slides for presentations relating to Diagram, banner, website, cross, square, model, form, order, business, concept, vector, cube, bright, symbol, brochure, match, guide, usable, graphic,element, marketing, different, idea, shape, abstract, cycle, creative, box, illustration, piece, connection, strategy, place, shade, frame, web, solution, design, group,color, colorful, art, part, arrows. The prominent colors used in the PowerPoint template are Green, Yellow, Blue. Catapult your thoughts with our And Marketing Concept Mixed Circular Flow Diagram What Is Business Plan PowerPoint Templates. They will travel a great distance.
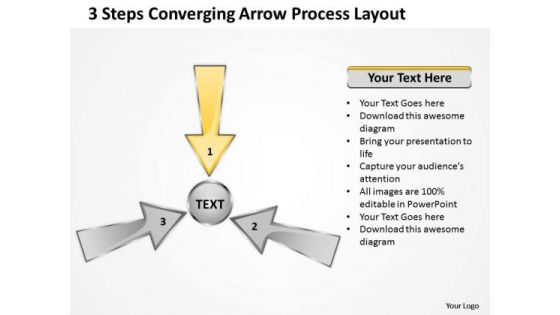
3 Steps Converging Arrow Process Layout Cycle Flow Diagram PowerPoint Template
We present our 3 steps converging arrow process layout Cycle Flow Diagram PowerPoint template.Present our Flow Charts PowerPoint Templates because this template helps you to put your finger on the pulse of your business and sense the need to re-align a bit. Present our Business PowerPoint Templates because this diagram is designed to help your audience to develop their thoughts along the way. Present our Shapes PowerPoint Templates because this diagram put it all together to form the complete picture and reach the goal. Present our Success PowerPoint Templates because the choices you make today will determine the future growth of your enterprise. Use our Arrows PowerPoint Templates because individual components well researched and understood in their place.Use these PowerPoint slides for presentations relating to Arrow, Business, Chart, Circular, Concept, Diagram, Informative, Internet, Market, Marketing, Member, Performance, Process, Profit, Profitable, Project, Refer, Referral, Referring, Revenue, Socialize, Steps, Strategy, Web, Websites. The prominent colors used in the PowerPoint template are Yellow, White, Gray. People tell us our 3 steps converging arrow process layout Cycle Flow Diagram PowerPoint template are aesthetically designed to attract attention. We guarantee that they will grab all the eyeballs you need. Customers tell us our Concept PowerPoint templates and PPT Slides will make the presenter successul in his career/life. People tell us our 3 steps converging arrow process layout Cycle Flow Diagram PowerPoint template are second to none. Professionals tell us our Diagram PowerPoint templates and PPT Slides will help them to explain complicated concepts. Customers tell us our 3 steps converging arrow process layout Cycle Flow Diagram PowerPoint template are Spiffy. Use our Market PowerPoint templates and PPT Slides are Reminiscent. Show attitude with our 3 Steps Converging Arrow Process Layout Cycle Flow Diagram PowerPoint Template. Let your listeners know your depth.

Advertising Workflow Chart Ppt Powerpoint Presentation Complete Deck With Slides
Improve your presentation delivery using this Advertising Workflow Chart Ppt Powerpoint Presentation Complete Deck With Slides. Support your business vision and objectives using this well-structured PPT deck. This template offers a great starting point for delivering beautifully designed presentations on the topic of your choice. Comprising fifteen slides this professionally designed template is all you need to host discussion and meetings with collaborators. Each slide is self-explanatory and equipped with high-quality graphics that can be adjusted to your needs. Therefore, you will face no difficulty in portraying your desired content using this PPT slideshow. This PowerPoint slideshow contains every important element that you need for a great pitch. It is not only editable but also available for immediate download and utilization. The color, font size, background, shapes everything can be modified to create your unique presentation layout. Therefore, download it now. Our Advertising Workflow Chart Ppt Powerpoint Presentation Complete Deck With Slides are topically designed to provide an attractive backdrop to any subject. Use them to look like a presentation pro.
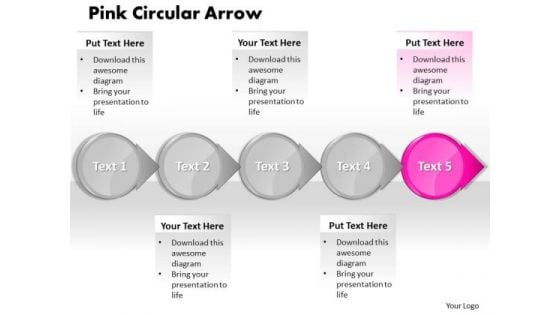
Ppt Pink Arrow Process Flow PowerPoint Template Chart Templates
PPT pink arrow process flow powerpoint template chart Templates-To display a structured combination of statements and achievements, our premium quality set of Circular Arrows - Horizontal for Microsoft PowerPoint describes the perfect tool. This compelling set consists of ready-made text layouts designed in the shape of arrows and text boxes. Those challenging charts offer a large variety of options. All elements are editable and can be changed e. g. in color or size.-PPT pink arrow process flow powerpoint template chart Templates-abstract, access, arrow, background, banner, business, chart, circle, color, concept, connection, corporate, creative, cycle, design, different, element, graphic, group, idea, illustration, process, red, shape, speech, strategy, symbol, template, text, usable, vector, Be superman with our Ppt Pink Arrow Process Flow PowerPoint Template Chart Templates. You will come out on top.
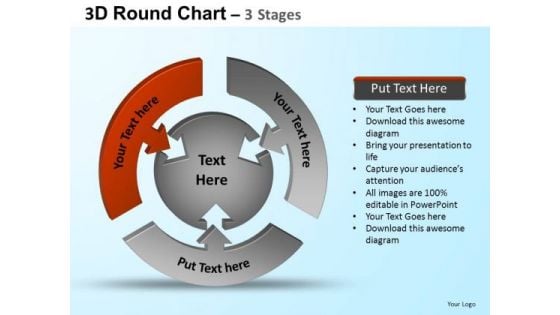
PowerPoint Backgrounds Marketing Round Process Flow Chart Ppt Presentation
PowerPoint Backgrounds Marketing Round Process Flow Chart PPT Presentation-These amazing PowerPoint pre-designed slides and PowerPoint templates have been carefully created by our team of experts to help you impress your audience. Our stunning collection of Powerpoint slides are 100% editable and can easily fit in any PowerPoint presentations. By using these animations and graphics in PowerPoint and you can easily make professional presentations. Any text can be entered at any point in the PowerPoint template or slide. Just DOWNLOAD our awesome PowerPoint templates and you are ready to go. Be the architect of your own destiny. Design it with our PowerPoint Backgrounds Marketing Round Process Flow Chart Ppt Presentation.
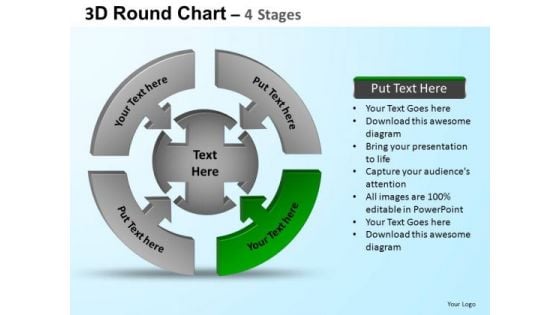
PowerPoint Slides Process Round Process Flow Chart Ppt Backgrounds
PowerPoint Slides Process Round Process Flow Chart PPT Backgrounds-These amazing PowerPoint pre-designed slides and PowerPoint templates have been carefully created by our team of experts to help you impress your audience. Our stunning collection of Powerpoint slides are 100% editable and can easily fit in any PowerPoint presentations. By using these animations and graphics in PowerPoint and you can easily make professional presentations. Any text can be entered at any point in the PowerPoint template or slide. Just DOWNLOAD our awesome PowerPoint templates and you are ready to go. Amuse your audience with our PowerPoint Slides Process Round Process Flow Chart Ppt Backgrounds. Some of them are designed to be far out.
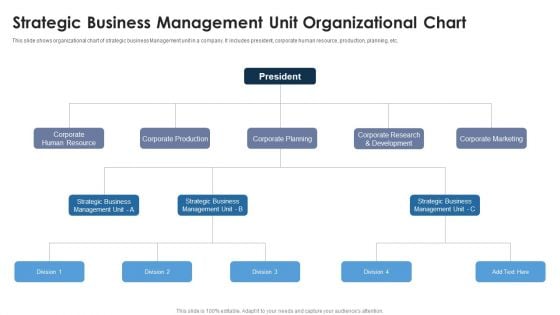
Strategic Business Management Unit Organizational Chart Ideas PDF
This slide shows organizational chart of strategic business Management unit in a company. It includes president, corporate human resource, production, planning, etc.Persuade your audience using this Strategic Business Management Unit Organizational Chart Ideas PDF This PPT design covers five stages, thus making it a great tool to use. It also caters to a variety of topics including Human Resource, Corporate Production, Corporate Planning Download this PPT design now to present a convincing pitch that not only emphasizes the topic but also showcases your presentation skills.
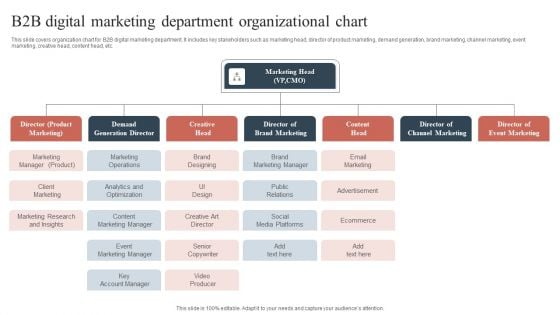
B2B Digital Marketing Department Organizational Chart Sample PDF
This slide covers organization chart for B2B digital marketing department. It includes key stakeholders such as marketing head, director of product marketing, demand generation, brand marketing, channel marketing, event marketing, creative head, content head, etc. Persuade your audience using this B2B Digital Marketing Department Organizational Chart Sample PDF. This PPT design covers six stages, thus making it a great tool to use. It also caters to a variety of topics including Marketing Operations, Brand Marketing Manager, Email Marketing. Download this PPT design now to present a convincing pitch that not only emphasizes the topic but also showcases your presentation skills.
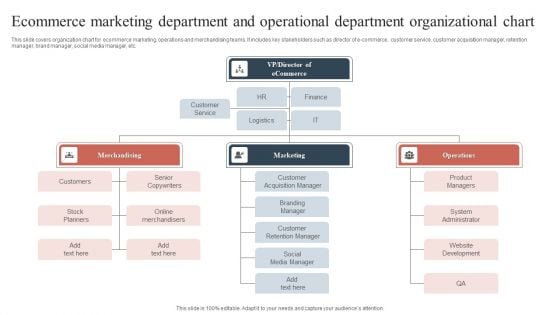
Ecommerce Marketing Department And Operational Department Organizational Chart Structure PDF
This slide covers organization chart for ecommerce marketing, operations and merchandising teams. It includes key stakeholders such as director of e commerce, customer service. customer acquisition manager, retention manager, brand manager, social media manager, etc. Persuade your audience using this Ecommerce Marketing Department And Operational Department Organizational Chart Structure PDF. This PPT design covers nine stages, thus making it a great tool to use. It also caters to a variety of topics including System Administrator, Stock Planners, Customer Acquisition Manager. Download this PPT design now to present a convincing pitch that not only emphasizes the topic but also showcases your presentation skills.
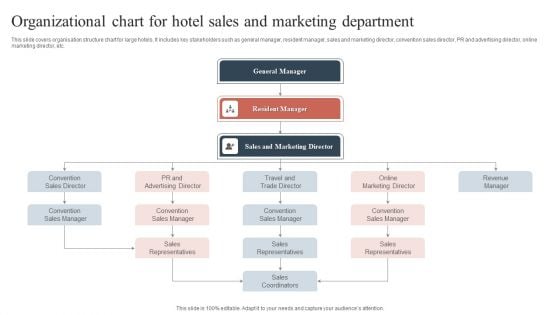
Organizational Chart For Hotel Sales And Marketing Department Guidelines PDF
This slide covers organisation structure chart for large hotels. It includes key stakeholders such as general manager, resident manager, sales and marketing director, convention sales director, PR and advertising director, online marketing director, etc. Persuade your audience using this Organizational Chart For Hotel Sales And Marketing Department Guidelines PDF. This PPT design covers six stages, thus making it a great tool to use. It also caters to a variety of topics including Convention Sales Manager, Sales Representatives, Convention Sales Manager. Download this PPT design now to present a convincing pitch that not only emphasizes the topic but also showcases your presentation skills.
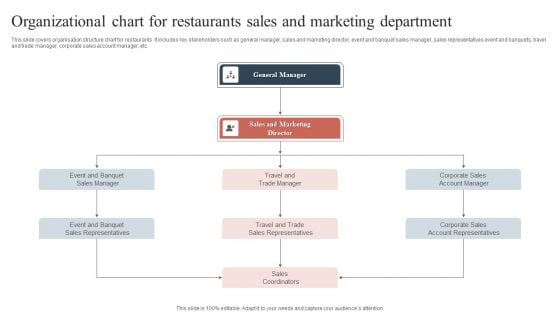
Organizational Chart For Restaurants Sales And Marketing Department Pictures PDF
This slide covers organisation structure chart for restaurants. It includes key stakeholders such as general manager, sales and marketing director, event and banquet sales manager, sales representatives event and banquets, travel and trade manager, corporate sales account manager, etc. Persuade your audience using this Organizational Chart For Restaurants Sales And Marketing Department Pictures PDF. This PPT design covers four stages, thus making it a great tool to use. It also caters to a variety of topics including General Manager, Trade Sales Representatives, Corporate Sales Account Manager. Download this PPT design now to present a convincing pitch that not only emphasizes the topic but also showcases your presentation skills.
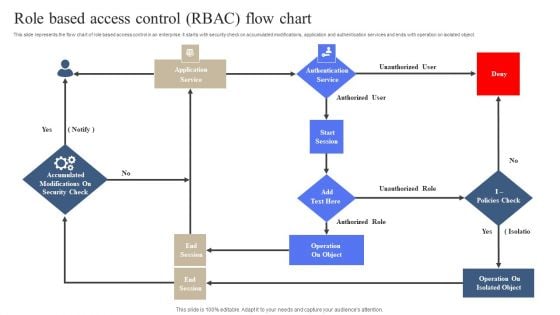
Role Based Access Control RBAC Flow Chart Slides PDF
This slide represents the flow chart of role based access control in an enterprise. It starts with security check on accumulated modifications, application and authentication services and ends with operation on isolated object. Persuade your audience using this Role Based Access Control RBAC Flow Chart Slides PDF. This PPT design covers One stage, thus making it a great tool to use. It also caters to a variety of topics including Operation On Object, Operation On Isolated Object. Download this PPT design now to present a convincing pitch that not only emphasizes the topic but also showcases your presentation skills.
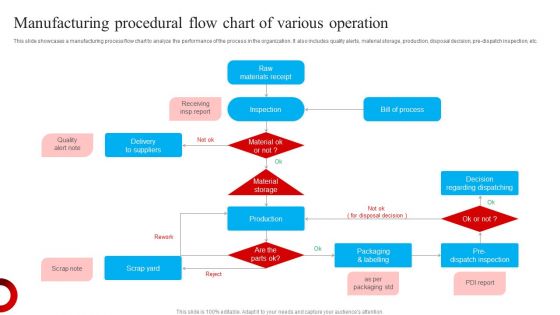
Manufacturing Procedural Flow Chart Of Various Operation Inspiration PDF
This slide showcases a manufacturing process flow chart to analyze the performance of the process in the organization. It also includes quality alerts, material storage, production, disposal decision, pre-dispatch inspection, etc. Persuade your audience using this Manufacturing Procedural Flow Chart Of Various Operation Inspiration PDF. This PPT design covers one stages, thus making it a great tool to use. It also caters to a variety of topics including Raw Materials Receipt, Inspection, Delivery Suppliers . Download this PPT design now to present a convincing pitch that not only emphasizes the topic but also showcases your presentation skills.
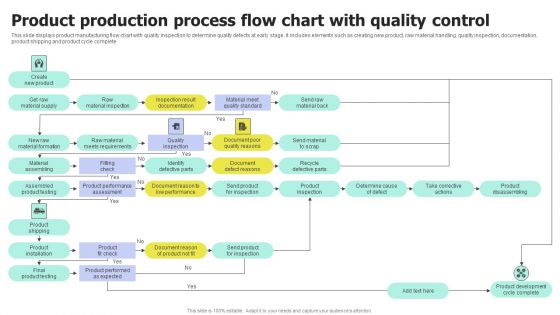
Product Production Process Flow Chart With Quality Control Inspiration PDF
Persuade your audience using this Product Production Process Flow Chart With Quality Control Inspiration PDF. This PPT design covers Two stages, thus making it a great tool to use. It also caters to a variety of topics including Product Production, Process Flow Chart, Quality Control. Download this PPT design now to present a convincing pitch that not only emphasizes the topic but also showcases your presentation skills.
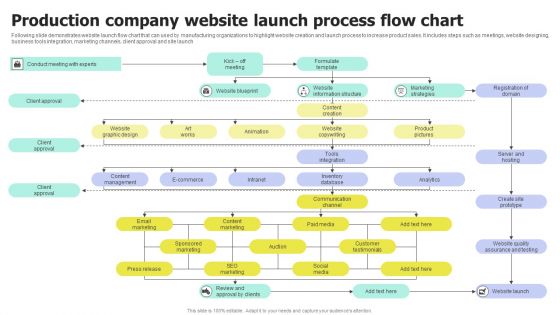
Production Company Website Launch Process Flow Chart Portrait PDF
Persuade your audience using this Production Company Website Launch Process Flow Chart Portrait PDF. This PPT design covers Three stages, thus making it a great tool to use. It also caters to a variety of topics including Production Company, Website Launch, Process Flow Chart. Download this PPT design now to present a convincing pitch that not only emphasizes the topic but also showcases your presentation skills.
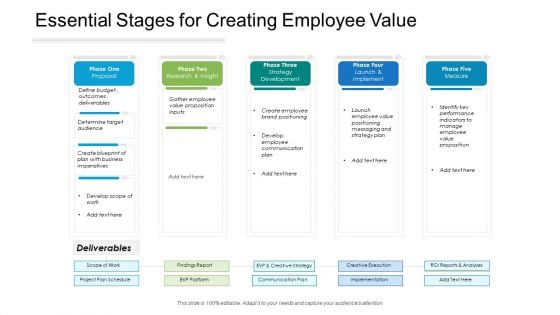
Essential Stages For Creating Employee Value Ppt PowerPoint Presentation Slides Ideas PDF
Persuade your audience using this essential stages for creating employee value ppt powerpoint presentation slides ideas pdf. This PPT design covers five stages, thus making it a great tool to use. It also caters to a variety of topics including phase one proposal, phase two research and insight, phase three strategy development, phase four launch and implement, phase five measure. Download this PPT design now to present a convincing pitch that not only emphasizes the topic but also showcases your presentation skills.

Business Diagram Three Heads With Pie For Data Driven Technology PowerPoint Slide
This business diagram displays three human faces with pie charts. This Power Point template has been designed to compare and present business data. You may use this diagram to impart professional appearance to your presentations.
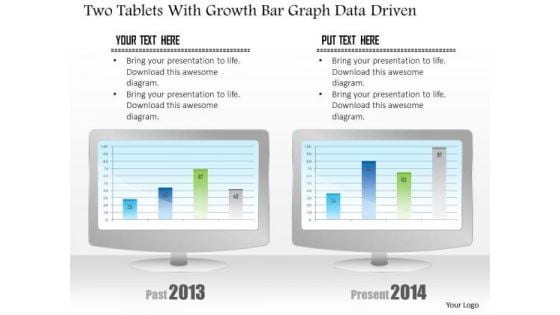
Business Diagram Two Tablets With Growth Bar Graph Data Driven PowerPoint Slide
This business diagram has been designed with comparative charts on tablets. This slide suitable for data representation. You can also use this slide to present business reports and information. Use this diagram to present your views in a wonderful manner.
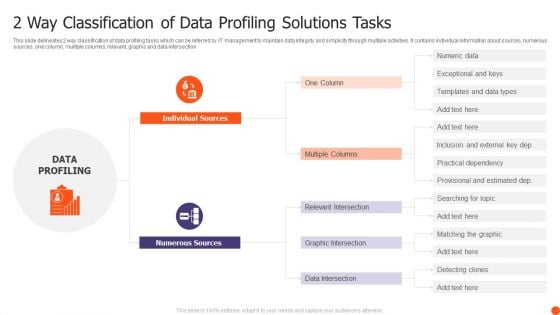
2 Way Classification Of Data Profiling Solutions Tasks Ppt Model Background Designs PDF
This slide delineates 2 way classification of data profiling tasks which can be referred by IT management to maintain data integrity and simplicity through multiple activities. It contains individual information about sources, numerous sources, one column, multiple columns, relevant, graphic and data intersection Presenting 2 Way Classification Of Data Profiling Solutions Tasks Ppt Model Background Designs PDF to dispense important information. This template comprises two stages. It also presents valuable insights into the topics including Individual Sources, Numerous Sources, Multiple Columns. This is a completely customizable PowerPoint theme that can be put to use immediately. So, download it and address the topic impactfully.
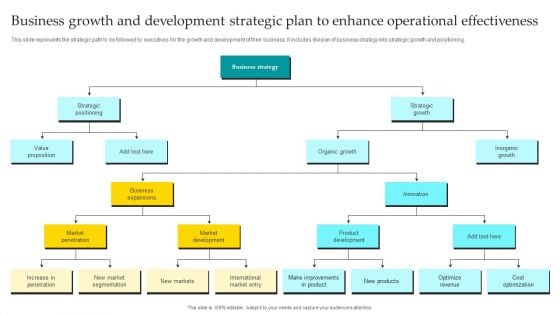
Business Growth And Development Strategic Plan To Enhance Operational Effectiveness Designs PDF
This slide represents the strategic path to be followed by executives for the growth and development of their business. It includes division of business strategy into strategic growth and positioning. Presenting Business Growth And Development Strategic Plan To Enhance Operational Effectiveness Designs PDF to dispense important information. This template comprises six stages. It also presents valuable insights into the topics including Strategic Positioning, Value Proposition, Business Expansions. This is a completely customizable PowerPoint theme that can be put to use immediately. So, download it and address the topic impactfully.
Gantt Chart Bundle Powerpoint Ppt Templates And Slides

Hart With Growing Up Arrow Symbol PowerPoint Themes And PowerPoint Slides 0611
Microsoft PowerPoint Theme and Slide with chart with growing up arrow You will rarely find fault with our Hart With Growing Up Arrow Symbol PowerPoint Themes And PowerPoint Slides 0611. They are designed by a fastidious team.
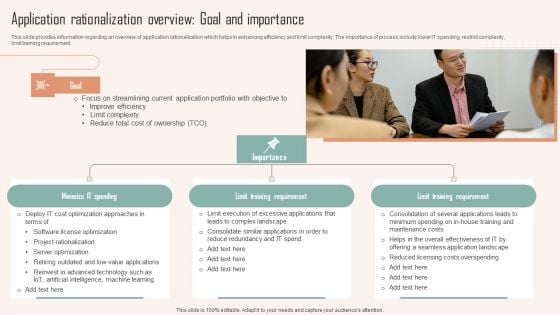
Application Rationalization Overview Goal And Importance Ppt PowerPoint Presentation Diagram Lists PDF
This slide provides information regarding an overview of application rationalization which helps in enhancing efficiency and limit complexity. The importance of process include lower IT spending, restrict complexity, limit training requirement. Create an editable Application Rationalization Overview Goal And Importance Ppt PowerPoint Presentation Diagram Lists PDF that communicates your idea and engages your audience. Whether youre presenting a business or an educational presentation, pre designed presentation templates help save time. Application Rationalization Overview Goal And Importance Ppt PowerPoint Presentation Diagram Lists PDF is highly customizable and very easy to edit, covering many different styles from creative to business presentations. Slidegeeks has creative team members who have crafted amazing templates. So, go and get them without any delay.
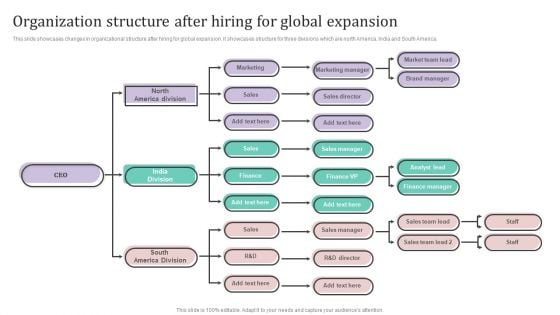
Organization Structure After Hiring For Global Expansion Ppt PowerPoint Presentation Diagram Lists PDF
This slide showcases changes in organizational structure after hiring for global expansion. It showcases structure for three divisions which are north America, India and South America.Formulating a presentation can take up a lot of effort and time, so the content and message should always be the primary focus. The visuals of the PowerPoint can enhance the presenters message, so our Organization Structure After Hiring For Global Expansion Ppt PowerPoint Presentation Diagram Lists PDF was created to help save time. Instead of worrying about the design, the presenter can concentrate on the message while our designers work on creating the ideal templates for whatever situation is needed. Slidegeeks has experts for everything from amazing designs to valuable content, we have put everything into Organization Structure After Hiring For Global Expansion Ppt PowerPoint Presentation Diagram Lists PDF.
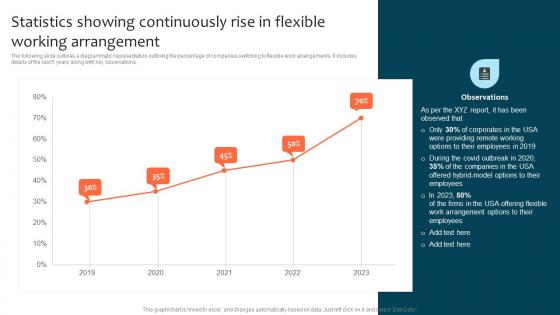
Statistics Showing Continuously Rise In Flexible Working Optimizing Staff Retention Rate Brochure Pdf
The following slide outlines a diagrammatic representation outlining the percentage of companies switching to flexible work arrangements. It includes details of the last 5 years along with key observations. Find highly impressive Statistics Showing Continuously Rise In Flexible Working Optimizing Staff Retention Rate Brochure Pdf on Slidegeeks to deliver a meaningful presentation. You can save an ample amount of time using these presentation templates. No need to worry to prepare everything from scratch because Slidegeeks experts have already done a huge research and work for you. You need to download Statistics Showing Continuously Rise In Flexible Working Optimizing Staff Retention Rate Brochure Pdf for your upcoming presentation. All the presentation templates are 100 percent editable and you can change the color and personalize the content accordingly. Download now. The following slide outlines a diagrammatic representation outlining the percentage of companies switching to flexible work arrangements. It includes details of the last 5 years along with key observations.
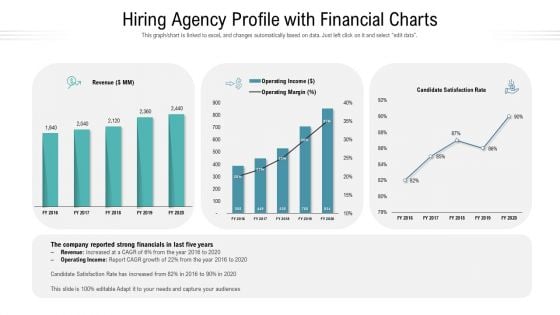
Hiring Agency Profile With Financial Charts Ppt Model Example PDF
This graph or chart is linked to excel, and changes automatically based on data. Just left click on it and select edit data. Pitch your topic with ease and precision using this hiring agency profile with financial charts ppt model example pdf. This layout presents information on revenue, operating income, operating margin, satisfaction rate. It is also available for immediate download and adjustment. So, changes can be made in the color, design, graphics or any other component to create a unique layout.
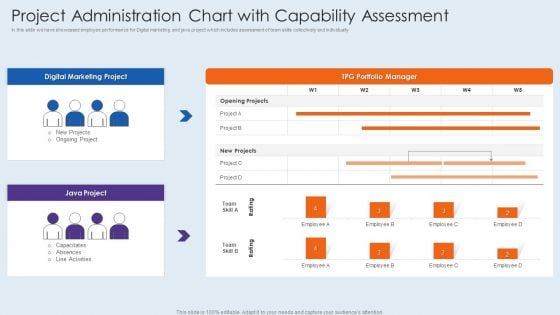
Project Administration Chart With Capability Assessment Elements PDF
In this slide we have showcased employee performance for Digital marketing and java project which includes assessment of team skills collectively and individually. Showcasing this set of slides titled project administration chart with capability assessment elements pdf. The topics addressed in these templates are project administration chart with capability assessment. All the content presented in this PPT design is completely editable. Download it and make adjustments in color, background, font etc. as per your unique business setting.
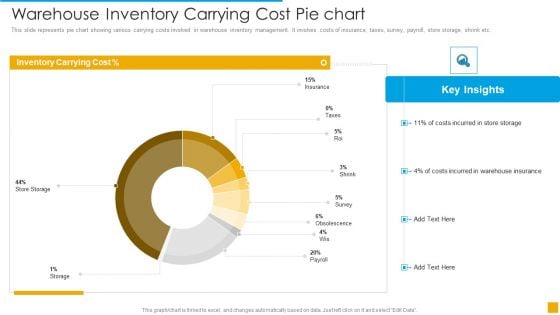
Warehouse Inventory Carrying Cost Pie Chart Demonstration PDF
This slide represents pie chart showing various carrying costs involved in warehouse inventory management. It involves costs of insurance, taxes, survey, payroll, store storage, shrink etc.Pitch your topic with ease and precision using this Warehouse Inventory Carrying Cost Pie Chart Demonstration PDF. This layout presents information on Cost, Inventory, Storage. It is also available for immediate download and adjustment. So, changes can be made in the color, design, graphics or any other component to create a unique layout.
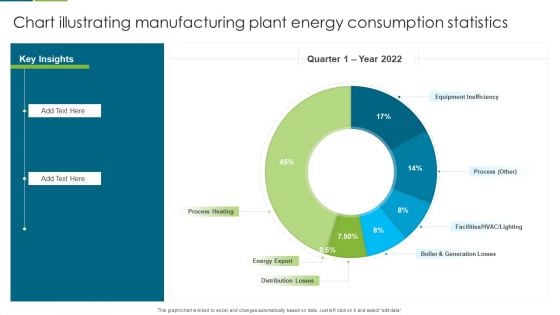
Chart Illustrating Manufacturing Plant Energy Consumption Statistics Slides PDF
This graph or chart is linked to excel, and changes automatically based on data. Just left click on it and select edit data. Pitch your topic with ease and precision using this Chart Illustrating Manufacturing Plant Energy Consumption Statistics Slides PDF. This layout presents information on Equipment Inefficiency, Process Heating, Energy Export. It is also available for immediate download and adjustment. So, changes can be made in the color, design, graphics or any other component to create a unique layout.
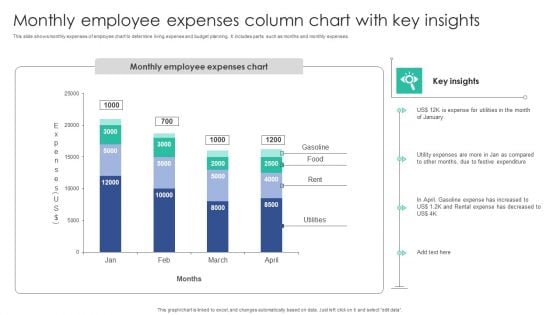
Monthly Employee Expenses Column Chart With Key Insights Download PDF
This slide shows monthly expenses of employee chart to determine living expense and budget planning. It includes parts such as months and monthly expenses.Showcasing this set of slides titled Monthly Employee Expenses Column Chart With Key Insights Download PDF. The topics addressed in these templates are Expense Utilities, Festive Expenditure, Gasoline Expense. All the content presented in this PPT design is completely editable. Download it and make adjustments in color, background, font etc. as per your unique business setting.
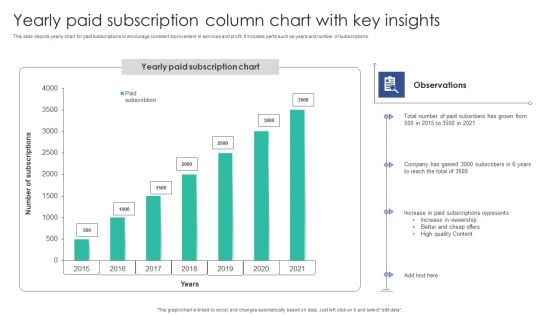
Yearly Paid Subscription Column Chart With Key Insights Microsoft PDF
This slide depicts yearly chart for paid subscriptions to encourage constant improvement in services and profit. It includes parts such as years and number of subscriptions.Showcasing this set of slides titled Yearly Paid Subscription Column Chart With Key Insights Microsoft PDF. The topics addressed in these templates are Paid Subscribers, Company Gained, Subscriptions Represents. All the content presented in this PPT design is completely editable. Download it and make adjustments in color, background, font etc. as per your unique business setting.
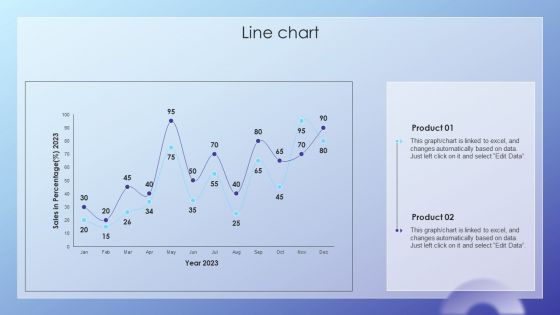
Client Acquisition Journey Plan Line Chart Ppt File Deck PDF
Create an editable Client Acquisition Journey Plan Line Chart Ppt File Deck PDF that communicates your idea and engages your audience. Whether youre presenting a business or an educational presentation, pre-designed presentation templates help save time. Client Acquisition Journey Plan Line Chart Ppt File Deck PDF is highly customizable and very easy to edit, covering many different styles from creative to business presentations. Slidegeeks has creative team members who have crafted amazing templates. So, go and get them without any delay.

Digital Advertisement Spend Trend Chart By Industries Elements PDF
This slide depicts expenditure trends for digital advertising by top industries. It includes retail, automotive, financial services, telecom, consumer products, travel, healthcare, media, entertainment, etc. Showcasing this set of slides titled Digital Advertisement Spend Trend Chart By Industries Elements PDF. The topics addressed in these templates are Retail Sector, Total Budget, Chart By Industries. All the content presented in this PPT design is completely editable. Download it and make adjustments in color, background, font etc. as per your unique business setting.
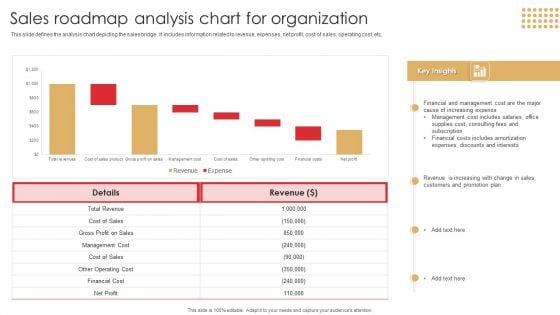
Sales Roadmap Analysis Chart For Organization Download PDF
This slide defines the analysis chart depicting the sales bridge . It includes information related to revenue, expenses, net profit, cost of sales, operating cost, etc.Showcasing this set of slides titled Sales Roadmap Analysis Chart For Organization Download PDF. The topics addressed in these templates are Management Cost, Financial Cost, Includes Amortization. All the content presented in this PPT design is completely editable. Download it and make adjustments in color, background, font etc. as per your unique business setting.
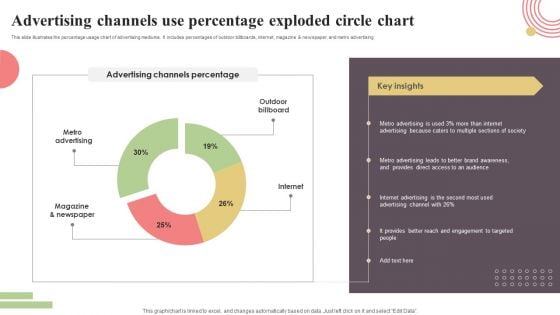
Advertising Channels Use Percentage Exploded Circle Chart Sample PDF
This slide illustrates the percentage usage chart of advertising mediums. It includes percentages of outdoor billboards, internet, magazine and newspaper, and metro advertising. Showcasing this set of slides titled Advertising Channels Use Percentage Exploded Circle Chart Sample PDF. The topics addressed in these templates are Metro Advertising, Magazine And Newspaper, Internet, Outdoor, Billboard. All the content presented in this PPT design is completely editable. Download it and make adjustments in color, background, font etc. as per your unique business setting.
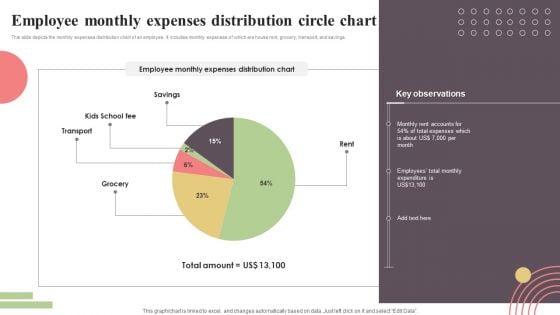
Employee Monthly Expenses Distribution Circle Chart Elements PDF
This slide depicts the monthly expenses distribution chart of an employee. It includes monthly expenses of which are house rent, grocery, transport, and savings. Showcasing this set of slides titled Employee Monthly Expenses Distribution Circle Chart Elements PDF. The topics addressed in these templates are Savings, Kids School Fee, Transport, Grocery, Rent. All the content presented in this PPT design is completely editable. Download it and make adjustments in color, background, font etc. as per your unique business setting.
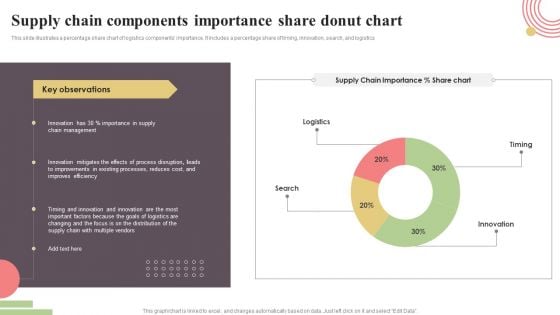
Supply Chain Components Importance Share Donut Chart Rules PDF
This slide illustrates a percentage share chart of logistics components importance. It includes a percentage share of timing, innovation, search, and logistics. Showcasing this set of slides titled Supply Chain Components Importance Share Donut Chart Rules PDF. The topics addressed in these templates are Timing, Innovation, Search, Logistics. All the content presented in this PPT design is completely editable. Download it and make adjustments in color, background, font etc. as per your unique business setting.
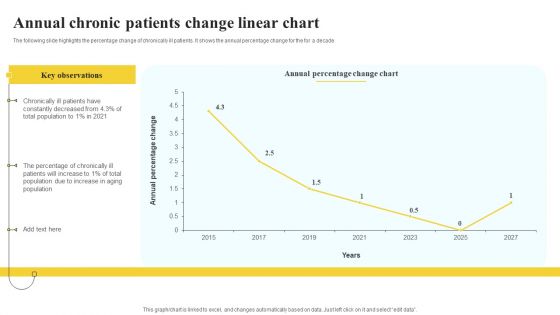
Annual Chronic Patients Change Linear Chart Demonstration PDF
The following slide highlights the percentage change of chronically ill patients. It shows the annual percentage change for the for a decade Showcasing this set of slides titled Annual Chronic Patients Change Linear Chart Demonstration PDF. The topics addressed in these templates are Key Observations, Annual Percentage, Linear Chart. All the content presented in this PPT design is completely editable. Download it and make adjustments in color, background, font etc. as per your unique business setting.
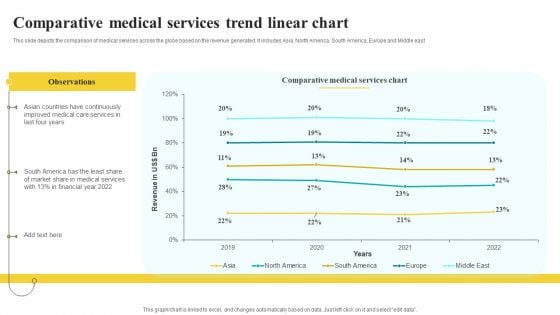
Comparative Medical Services Trend Linear Chart Mockup PDF
This slide depicts the comparison of medical services across the globe based on the revenue generated. It includes Asia, North America, South America, Europe and Middle east Showcasing this set of slides titled Comparative Medical Services Trend Linear Chart Mockup PDF. The topics addressed in these templates are Observations, Comparative Medical Services, Linear Chart. All the content presented in this PPT design is completely editable. Download it and make adjustments in color, background, font etc. as per your unique business setting.
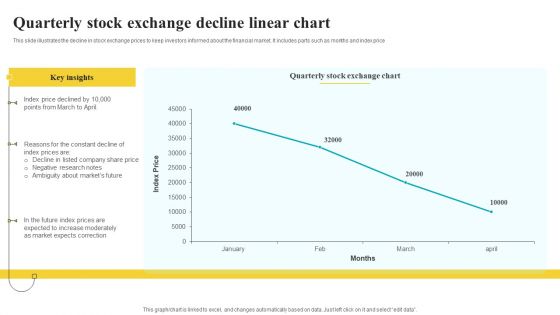
Quarterly Stock Exchange Decline Linear Chart Inspiration PDF
This slide illustrates the decline in stock exchange prices to keep investors informed about the financial market. It includes parts such as months and index price Pitch your topic with ease and precision using this Quarterly Stock Exchange Decline Linear Chart Inspiration PDF. This layout presents information on Key Insights, Exchange Chart, Correction. It is also available for immediate download and adjustment. So, changes can be made in the color, design, graphics or any other component to create a unique layout.
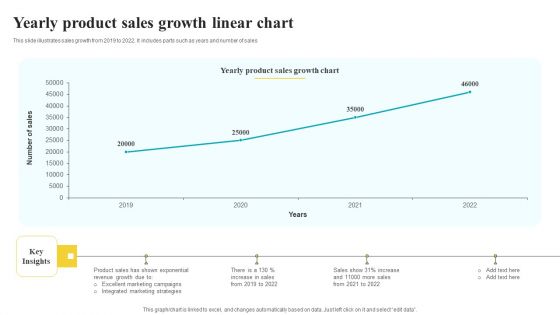
Yearly Product Sales Growth Linear Chart Pictures PDF
This slide illustrates sales growth from 2019 to 2022. It includes parts such as years and number of sales Pitch your topic with ease and precision using this Yearly Product Sales Growth Linear Chart Pictures PDF. This layout presents information on Sales Growth Chart, Key Insights, Strategies. It is also available for immediate download and adjustment. So, changes can be made in the color, design, graphics or any other component to create a unique layout.
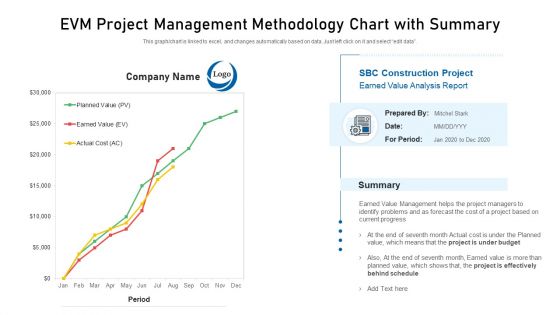
EVM Project Management Methodology Chart With Summary Clipart PDF
Pitch your topic with ease and precision using this evm project management methodology chart with summary clipart pdf. This layout presents information on project based, value management, forecast. It is also available for immediate download and adjustment. So, changes can be made in the color, design, graphics or any other component to create a unique layout.
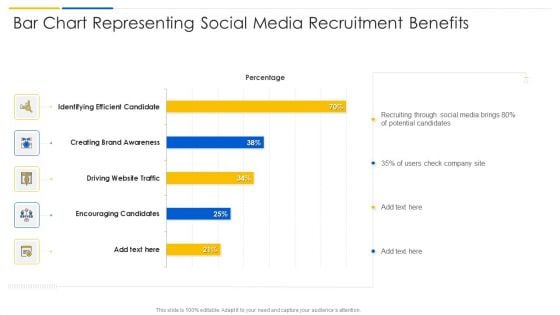
Bar Chart Representing Social Media Recruitment Benefits Infographics PDF
Pitch your topic with ease and precision using this bar chart representing social media recruitment benefits infographics pdf. This layout presents information on encouraging candidates, driving website traffic, creating brand awareness. It is also available for immediate download and adjustment. So, changes can be made in the color, design, graphics or any other component to create a unique layout.
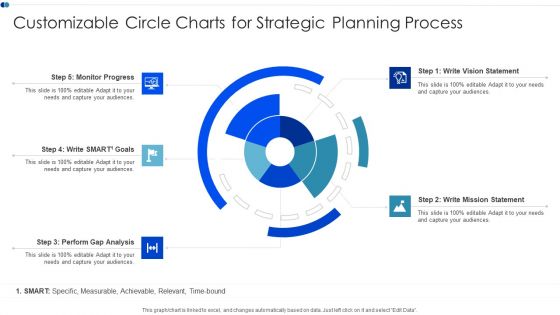
Customizable Circle Charts For Strategic Planning Process Clipart PDF
Pitch your topic with ease and precision using this Customizable Circle Charts For Strategic Planning Process Clipart PDF This layout presents information on Vision Statement, Mission Statement, Monitor Progress It is also available for immediate download and adjustment. So, changes can be made in the color, design, graphics or any other component to create a unique layout.
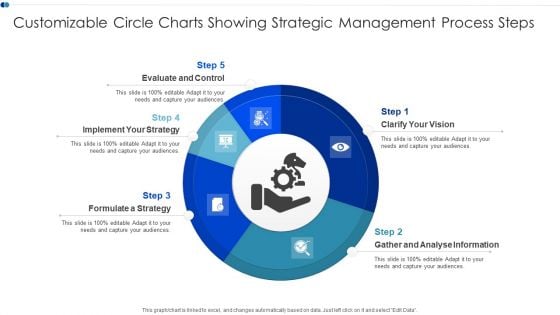
Customizable Circle Charts Showing Strategic Management Process Steps Professional PDF
Showcasing this set of slides titled Customizable Circle Charts Showing Strategic Management Process Steps Professional PDF The topics addressed in these templates are Evaluate And Control, Formulate Strategy, Analyse Information All the content presented in this PPT design is completely editable. Download it and make adjustments in color, background, font etc. as per your unique business setting.
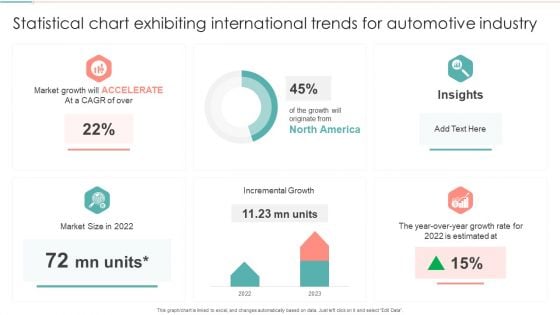
Statistical Chart Exhibiting International Trends For Automotive Industry Mockup PDF
Showcasing this set of slides titled Statistical Chart Exhibiting International Trends For Automotive Industry Mockup PDF. The topics addressed in these templates are Market Growth, Incremental Growth, Growth Estimated. All the content presented in this PPT design is completely editable. Download it and make adjustments in color, background, font etc. as per your unique business setting.
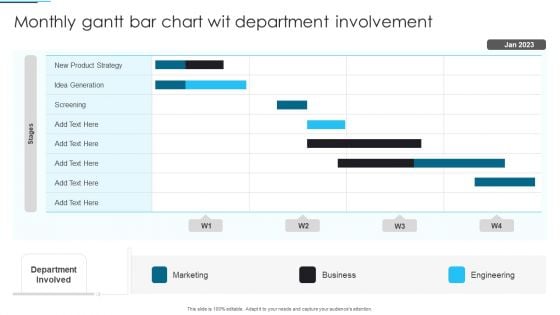
Monthly Gantt Bar Chart Wit Department Involvement Inspiration PDF
Pitch your topic with ease and precision using this Monthly Gantt Bar Chart Wit Department Involvement Inspiration PDF. This layout presents information on Product Strategy, Business, Marketing. It is also available for immediate download and adjustment. So, changes can be made in the color, design, graphics or any other component to create a unique layout.
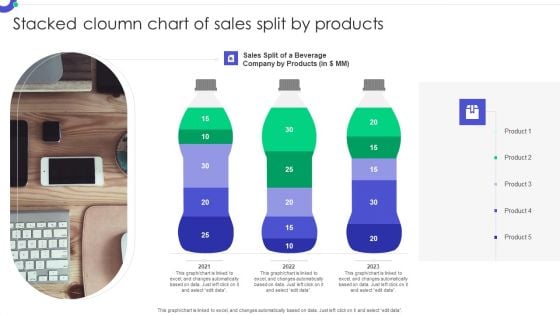
Stacked Cloumn Chart Of Sales Split By Products Graphics PDF
Showcasing this set of slides titled Stacked Cloumn Chart Of Sales Split By Products Graphics PDF. The topics addressed in these templates are Sales Split Beverage, Company Products. All the content presented in this PPT design is completely editable. Download it and make adjustments in color, background, font etc. as per your unique business setting.
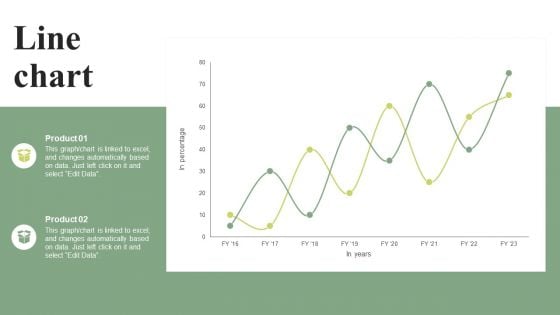
Line Chart Effective Planning For Monetary Strategy Execution Elements PDF
If your project calls for a presentation, then Slidegeeks is your go-to partner because we have professionally designed, easy-to-edit templates that are perfect for any presentation. After downloading, you can easily edit Line Chart Effective Planning For Monetary Strategy Execution Elements PDF and make the changes accordingly. You can rearrange slides or fill them with different images. Check out all the handy templates
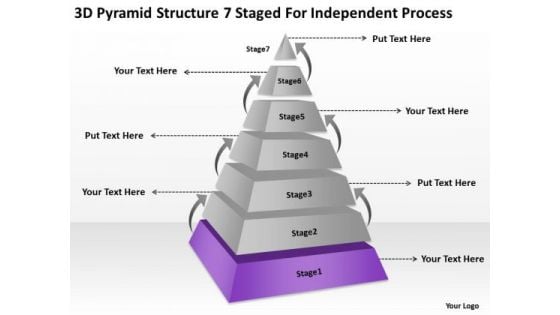
3d Pyramid Structre 7 Staged For Independent Process Ppt Business Plan PowerPoint Slides
We present our 3d pyramid structre 7 staged for independent process ppt business plan PowerPoint Slides.Use our Arrows PowerPoint Templates because You can Stir your ideas in the cauldron of our PowerPoint Templates and Slides. Cast a magic spell on your audience. Download and present our Pyramids PowerPoint Templates because Our PowerPoint Templates and Slides come in all colours, shades and hues. They help highlight every nuance of your views. Download our Process and Flows PowerPoint Templates because Our PowerPoint Templates and Slides will Activate the energies of your audience. Get their creative juices flowing with your words. Download our Business PowerPoint Templates because You have the co-ordinates for your destination of success. Let our PowerPoint Templates and Slides map out your journey. Download our Marketing PowerPoint Templates because Our PowerPoint Templates and Slides provide you with a vast range of viable options. Select the appropriate ones and just fill in your text. Use these PowerPoint slides for presentations relating to Pyramid, chart, diagram, seven, step, success, arrows, level, shape, part, isolated, triangle, innovation, business, concept,hierarchy, teamwork, symbol, abstract, team, management, support, illustration, stage, object, system, strategy, status, reflection, growth, progress, operational, independent, construction, structure, performance. The prominent colors used in the PowerPoint template are Purple, Gray, White. Embark upon an epic journey. Chart it out to the last detail on our 3d Pyramid Structre 7 Staged For Independent Process Ppt Business Plan PowerPoint Slides.

Nielsen Business Profile Revenue And Operating Income Ppt PowerPoint Presentation Diagram PDF
This slide highlights the Nielsen company revenue and operating income for the last 3 years. It includes the data in million of US dollars with a key takeaways section. This Nielsen Business Profile Revenue And Operating Income Ppt PowerPoint Presentation Diagram PDF from Slidegeeks makes it easy to present information on your topic with precision. It provides customization options, so you can make changes to the colors, design, graphics, or any other component to create a unique layout. It is also available for immediate download, so you can begin using it right away. Slidegeeks has done good research to ensure that you have everything you need to make your presentation stand out. Make a name out there for a brilliant performance.

Traditional Marketing Guide To Increase Audience Engagement Cost Spent On Traditional Marketing Channels Diagrams PDF
This slide provides an overview of the cost spent on various marketing forms. The forms covered are print, broadcasting, outdoor, one on one and referral marketing. This Traditional Marketing Guide To Increase Audience Engagement Cost Spent On Traditional Marketing Channels Diagrams PDF from Slidegeeks makes it easy to present information on your topic with precision. It provides customization options, so you can make changes to the colors, design, graphics, or any other component to create a unique layout. It is also available for immediate download, so you can begin using it right away. Slidegeeks has done good research to ensure that you have everything you need to make your presentation stand out. Make a name out there for a brilliant performance.
Dashboard For Tracking Customer Service Team Performance Consumer Contact Point Guide Diagrams PDF
This slide covers the KPI dashboard for analyzing the performance of client support department. It includes metrics such as first call resolution, unresolved calls, average response rate, the best day to call, average time to solve issues, etc. The Dashboard For Tracking Customer Service Team Performance Consumer Contact Point Guide Diagrams PDF is a compilation of the most recent design trends as a series of slides. It is suitable for any subject or industry presentation, containing attractive visuals and photo spots for businesses to clearly express their messages. This template contains a variety of slides for the user to input data, such as structures to contrast two elements, bullet points, and slides for written information. Slidegeeks is prepared to create an impression.

Social Networks Marketing To Improve Enterprise Audience Insights For Developing Diagrams PDF
This slide shows the report showing details related to insights of target audience of the enterprise. It includes details related to age, gender split, location spread , page views, fans and reach etc. Slidegeeks is here to make your presentations a breeze with Social Networks Marketing To Improve Enterprise Audience Insights For Developing Diagrams PDF With our easy-to-use and customizable templates, you can focus on delivering your ideas rather than worrying about formatting. With a variety of designs to choose from, youre sure to find one that suits your needs. And with animations and unique photos, illustrations, and fonts, you can make your presentation pop. So whether youre giving a sales pitch or presenting to the board, make sure to check out Slidegeeks first.
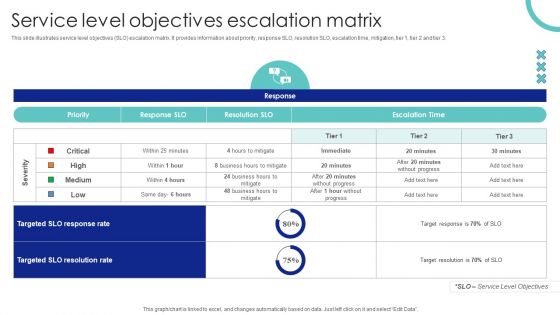
Service Level Objectives Escalation Matrix Ppt PowerPoint Presentation File Diagrams PDF
This slide illustrates service level objectives SLO escalation matrix. It provides information about priority, response SLO, resolution SLO, escalation time, mitigation, tier 1, tier 2 and tier 3. Slidegeeks is here to make your presentations a breeze with Service Level Objectives Escalation Matrix Ppt PowerPoint Presentation File Diagrams PDF With our easy to use and customizable templates, you can focus on delivering your ideas rather than worrying about formatting. With a variety of designs to choose from, you are sure to find one that suits your needs. And with animations and unique photos, illustrations, and fonts, you can make your presentation pop. So whether you are giving a sales pitch or presenting to the board, make sure to check out Slidegeeks first.
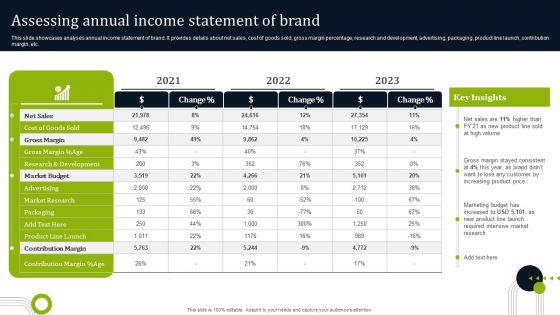
Introducing New Commodities Through Product Line Extension Assessing Annual Income Statement Diagrams PDF
This slide showcases analyses annual income statement of brand. It provides details about net sales, cost of goods sold, gross margin percentage, research and development, advertising, packaging, product line launch, contribution margin, etc. Slidegeeks is here to make your presentations a breeze with Introducing New Commodities Through Product Line Extension Assessing Annual Income Statement Diagrams PDF With our easy-to-use and customizable templates, you can focus on delivering your ideas rather than worrying about formatting. With a variety of designs to choose from, you are sure to find one that suits your needs. And with animations and unique photos, illustrations, and fonts, you can make your presentation pop. So whether you are giving a sales pitch or presenting to the board, make sure to check out Slidegeeks first.
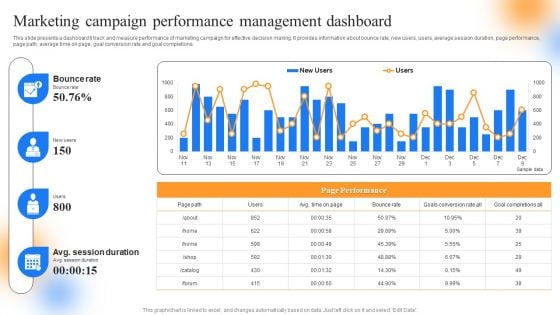
Strategic Guide To Perform Marketing Marketing Campaign Performance Management Dashboard Diagrams PDF
This slide presents a dashboard ti track and measure performance of marketing campaign for effective decision making. It provides information about bounce rate, new users, users, average session duration, page performance, page path, average time on page, goal conversion rate and goal completions. Slidegeeks is here to make your presentations a breeze with Strategic Guide To Perform Marketing Marketing Campaign Performance Management Dashboard Diagrams PDF With our easy to use and customizable templates, you can focus on delivering your ideas rather than worrying about formatting. With a variety of designs to choose from, youre sure to find one that suits your needs. And with animations and unique photos, illustrations, and fonts, you can make your presentation pop. So whether youre giving a sales pitch or presenting to the board, make sure to check out Slidegeeks first.
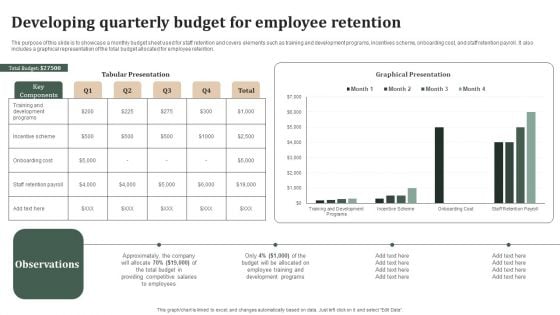
Successful Staff Retention Techniques Developing Quarterly Budget For Employee Retention Diagrams PDF
The purpose of this slide is to showcase a monthly budget sheet used for staff retention and covers elements such as training and development programs, incentives scheme, onboarding cost, and staff retention payroll. It also includes a graphical representation of the total budget allocated for employee retention. This Successful Staff Retention Techniques Developing Quarterly Budget For Employee Retention Diagrams PDF from Slidegeeks makes it easy to present information on your topic with precision. It provides customization options, so you can make changes to the colors, design, graphics, or any other component to create a unique layout. It is also available for immediate download, so you can begin using it right away. Slidegeeks has done good research to ensure that you have everything you need to make your presentation stand out. Make a name out there for a brilliant performance.
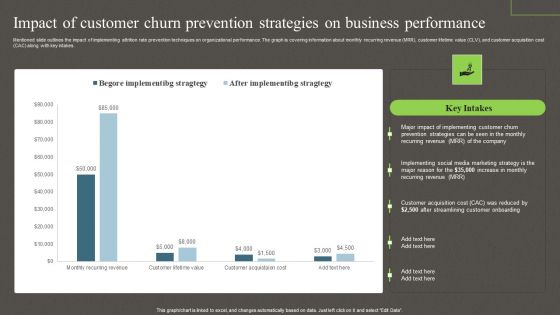
Impact Of Customer Churn Prevention Strategies On Business Performance Ppt PowerPoint Presentation Diagram Images PDF
Mentioned slide outlines the impact of implementing attrition rate prevention techniques on organizational performance. The graph is covering information about monthly recurring revenue MRR, customer lifetime value CLV, and customer acquisition cost CAC along with key intakes. The Impact Of Customer Churn Prevention Strategies On Business Performance Ppt PowerPoint Presentation Diagram Images PDF is a compilation of the most recent design trends as a series of slides. It is suitable for any subject or industry presentation, containing attractive visuals and photo spots for businesses to clearly express their messages. This template contains a variety of slides for the user to input data, such as structures to contrast two elements, bullet points, and slides for written information. Slidegeeks is prepared to create an impression.
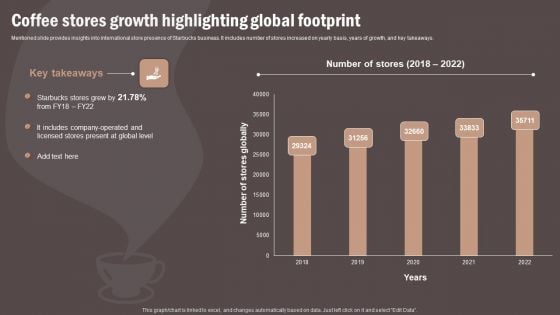
Coffee Cafe Company Profile Coffee Stores Growth Highlighting Global Footprint Diagrams PDF
Mentioned slide provides insights into international store presence of Starbucks business. It includes number of stores increased on yearly basis, years of growth, and key takeaways. Slidegeeks is here to make your presentations a breeze with Coffee Cafe Company Profile Coffee Stores Growth Highlighting Global Footprint Diagrams PDF With our easy to use and customizable templates, you can focus on delivering your ideas rather than worrying about formatting. With a variety of designs to choose from, you are sure to find one that suits your needs. And with animations and unique photos, illustrations, and fonts, you can make your presentation pop. So whether you are giving a sales pitch or presenting to the board, make sure to check out Slidegeeks first.
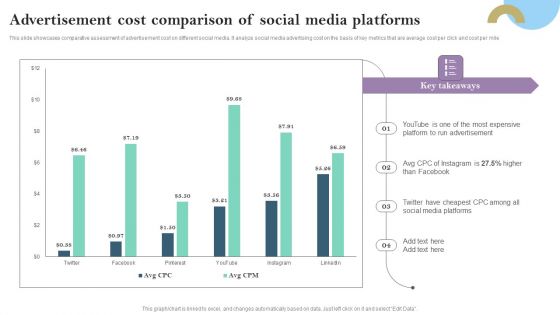
Advertisement Cost Comparison Of Social Media Platforms Ppt PowerPoint Presentation Diagram PDF
This slide showcases comparative assessment of advertisement cost on different social media. It analyze social media advertising cost on the basis of key metrics that are average cost per click and cost per mile Slidegeeks is here to make your presentations a breeze with Advertisement Cost Comparison Of Social Media Platforms Ppt PowerPoint Presentation Diagram PDF With our easy to use and customizable templates, you can focus on delivering your ideas rather than worrying about formatting. With a variety of designs to choose from, you are sure to find one that suits your needs. And with animations and unique photos, illustrations, and fonts, you can make your presentation pop. So whether you are giving a sales pitch or presenting to the board, make sure to check out Slidegeeks first.

Impact Of Marketing Strategies On Business Performance Ppt PowerPoint Presentation Diagram Lists PDF
The following slide showcases the positive outcome of marketing strategies on companys performance. Post-implementing marketing strategies company recorded significant increase in brand awareness rate, sales and profit, market share, and customer retention rate. The Impact Of Marketing Strategies On Business Performance Ppt PowerPoint Presentation Diagram Lists PDF is a compilation of the most recent design trends as a series of slides. It is suitable for any subject or industry presentation, containing attractive visuals and photo spots for businesses to clearly express their messages. This template contains a variety of slides for the user to input data, such as structures to contrast two elements, bullet points, and slides for written information. Slidegeeks is prepared to create an impression.
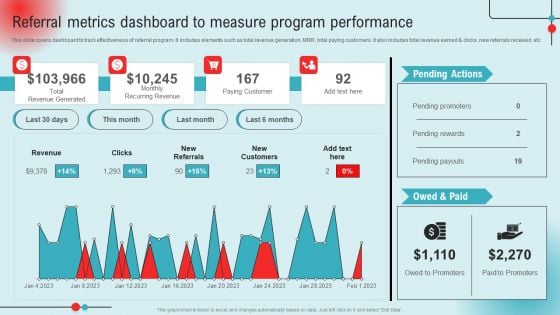
Referral Metrics Dashboard To Measure Program Performance Ppt PowerPoint Presentation Diagram Lists PDF
This slide covers dashboard to track effectiveness of referral program. It includes elements such as total revenue generation, MRR, total paying customers. It also includes total revenue earned and clicks, new referrals received, etc. This Referral Metrics Dashboard To Measure Program Performance Ppt PowerPoint Presentation Diagram Lists PDF from Slidegeeks makes it easy to present information on your topic with precision. It provides customization options, so you can make changes to the colors, design, graphics, or any other component to create a unique layout. It is also available for immediate download, so you can begin using it right away. Slidegeeks has done good research to ensure that you have everything you need to make your presentation stand out. Make a name out there for a brilliant performance.
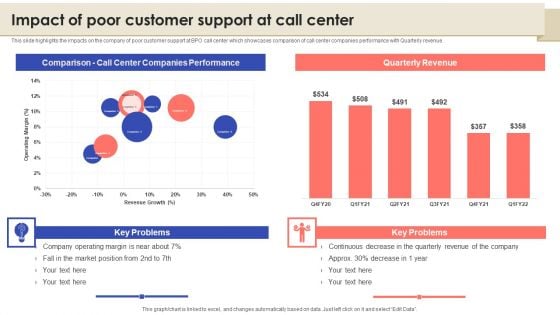
Call Center Quality Enhancement Plan Impact Of Poor Customer Support At Call Center Diagrams PDF
This slide highlights the impacts on the company of poor customer support at BPO call center which showcases comparison of call center companies performance with Quarterly revenue. This Call Center Quality Enhancement Plan Impact Of Poor Customer Support At Call Center Diagrams PDF from Slidegeeks makes it easy to present information on your topic with precision. It provides customization options, so you can make changes to the colors, design, graphics, or any other component to create a unique layout. It is also available for immediate download, so you can begin using it right away. Slidegeeks has done good research to ensure that you have everything you need to make your presentation stand out. Make a name out there for a brilliant performance.
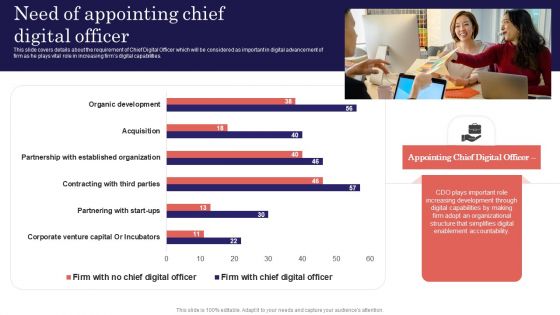
Digitalized Business Checklist Need Of Appointing Chief Digital Officer Diagrams PDF
This slide covers details about the requirement of Chief Digital Officer which will be considered as important in digital advancement of firm as he plays vital role in increasing firms digital capabilities. The Digitalized Business Checklist Need Of Appointing Chief Digital Officer Diagrams PDF is a compilation of the most recent design trends as a series of slides. It is suitable for any subject or industry presentation, containing attractive visuals and photo spots for businesses to clearly express their messages. This template contains a variety of slides for the user to input data, such as structures to contrast two elements, bullet points, and slides for written information. Slidegeeks is prepared to create an impression.
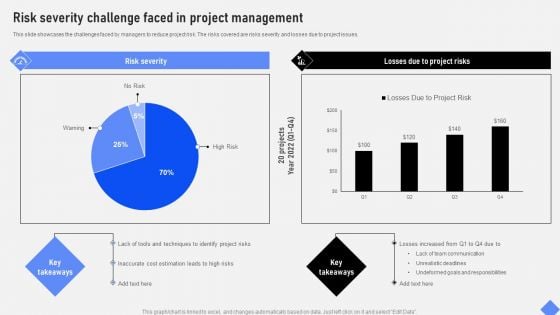
Effective Business Project Risk Mitigation Plan Risk Severity Challenge Faced In Project Management Diagrams PDF
This slide showcases the challenges faced by managers to reduce project risk. The risks covered are risks severity and losses due to project issues. This Effective Business Project Risk Mitigation Plan Risk Severity Challenge Faced In Project Management Diagrams PDF from Slidegeeks makes it easy to present information on your topic with precision. It provides customization options, so you can make changes to the colors, design, graphics, or any other component to create a unique layout. It is also available for immediate download, so you can begin using it right away. Slidegeeks has done good research to ensure that you have everything you need to make your presentation stand out. Make a name out there for a brilliant performance.
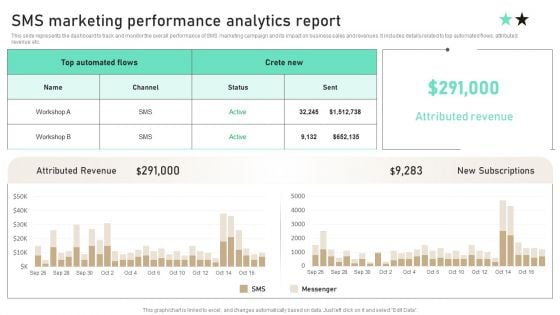
SMS Marketing Performance Analytics Report Ppt PowerPoint Presentation Diagram Templates PDF
This slide represents the dashboard to track and monitor the overall performance of SMS marketing campaign and its impact on business sales and revenues. It includes details related to top automated flows, attributed revenue etc. Slidegeeks is here to make your presentations a breeze with SMS Marketing Performance Analytics Report Ppt PowerPoint Presentation Diagram Templates PDF With our easy to use and customizable templates, you can focus on delivering your ideas rather than worrying about formatting. With a variety of designs to choose from, you are sure to find one that suits your needs. And with animations and unique photos, illustrations, and fonts, you can make your presentation pop. So whether you are giving a sales pitch or presenting to the board, make sure to check out Slidegeeks first.
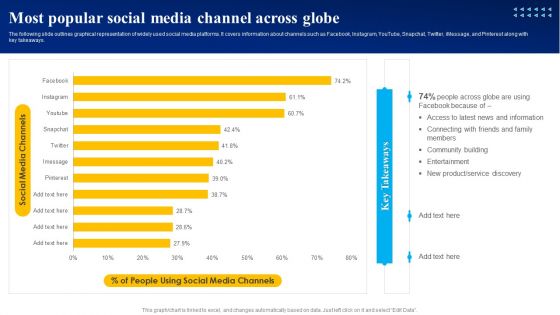
Most Popular Social Media Channel Across Globe Ppt PowerPoint Presentation Diagram Lists PDF
The following slide outlines graphical representation of widely used social media platforms. It covers information about channels such as Facebook, Instagram, YouTube, Snapchat, Twitter, iMessage, and Pinterest along with key takeaways. Slidegeeks is here to make your presentations a breeze with Most Popular Social Media Channel Across Globe Ppt PowerPoint Presentation Diagram Lists PDF With our easy to use and customizable templates, you can focus on delivering your ideas rather than worrying about formatting. With a variety of designs to choose from, you are sure to find one that suits your needs. And with animations and unique photos, illustrations, and fonts, you can make your presentation pop. So whether you are giving a sales pitch or presenting to the board, make sure to check out Slidegeeks first.
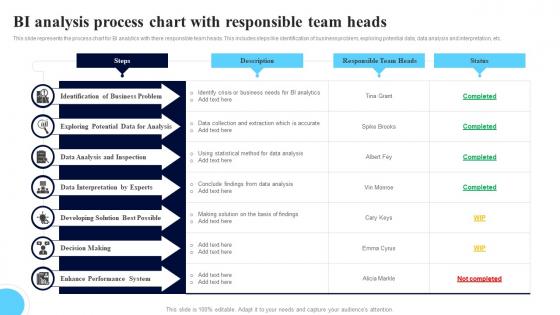
BI Analysis Process Chart With Responsible Team Heads Mockup Pdf
This slide represents the process chart for BI analytics with there responsible team heads. This includes steps like identification of business problem, exploring potential data, data analysis and interpretation, etc. Showcasing this set of slides titled BI Analysis Process Chart With Responsible Team Heads Mockup Pdf. The topics addressed in these templates are Identification Of Business, Data Analysis, Data Interpretation. All the content presented in this PPT design is completely editable. Download it and make adjustments in color, background, font etc. as per your unique business setting. This slide represents the process chart for BI analytics with there responsible team heads. This includes steps like identification of business problem, exploring potential data, data analysis and interpretation, etc.
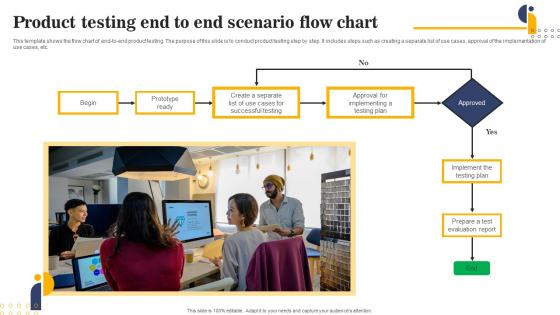
Product Testing End To End Scenario Flow Chart Download Pdf
This template shows the flow chart of end-to-end product testing. The purpose of this slide is to conduct product testing step by step. It includes steps such as creating a separate list of use cases, approval of the implementation of use cases, etc.Pitch your topic with ease and precision using this Product Testing End To End Scenario Flow Chart Download Pdf This layout presents information on Successful Testing, Prototype Ready, Approval Implementing It is also available for immediate download and adjustment. So, changes can be made in the color, design, graphics or any other component to create a unique layout. This template shows the flow chart of end to end product testing. The purpose of this slide is to conduct product testing step by step. It includes steps such as creating a separate list of use cases, approval of the implementation of use cases, etc.
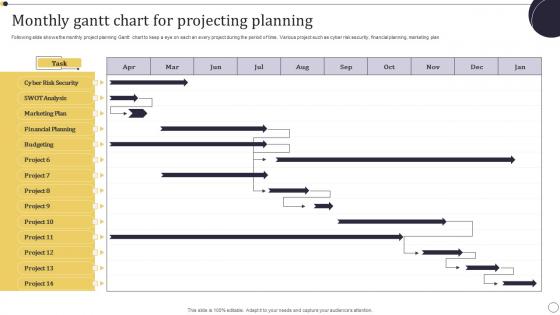
Monthly Gantt Chart For Projecting Planning Information Pdf
Following slide shows the monthly project planning Gantt chart to keep a eye on each an every project during the period of time. Various project such as cyber risk security, financial planning, marketing plan Showcasing this set of slides titled Monthly Gantt Chart For Projecting Planning Information Pdf. The topics addressed in these templates are Marketing Plan, Financial Planning, Cyber Risk Security . All the content presented in this PPT design is completely editable. Download it and make adjustments in color, background, font etc. as per your unique business setting. Following slide shows the monthly project planning Gantt chart to keep a eye on each an every project during the period of time. Various project such as cyber risk security, financial planning, marketing plan
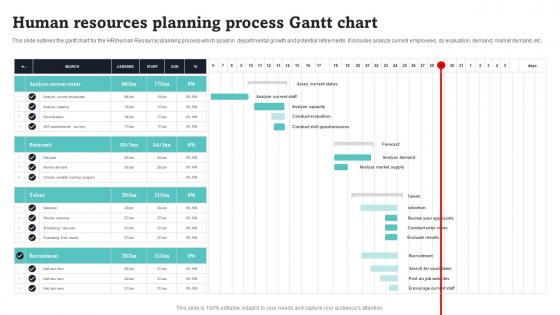
Human Resources Planning Process Gantt Chart Portrait Pdf
This slide outlines the gantt chart for the HRhuman Resource planning process which assist in departmental growth and potential retirements. It includes analyze current employees, do evaluation, demand, market demand, etc. Pitch your topic with ease and precision using this Human Resources Planning Process Gantt Chart Portrait Pdf. This layout presents information on Analyze Current Status, Forecast, Talent. It is also available for immediate download and adjustment. So, changes can be made in the color, design, graphics or any other component to create a unique layout. This slide outlines the gantt chart for the HRhuman Resource planning process which assist in departmental growth and potential retirements. It includes analyze current employees, do evaluation, demand, market demand, etc.

SAP Implementation Process Gantt Chart Ppt Slides Sample Pdf
This slide represents the timeline or Gantt chart of the SAP implementation process. It further includes various stages of process such as build team and identify business goal, evaluate business process, implement business blueprint, etc. Pitch your topic with ease and precision using this SAP Implementation Process Gantt Chart Ppt Slides Sample Pdf. This layout presents information on Business Goal, Evaluate Business Process, Implement Business Blueprint. It is also available for immediate download and adjustment. So, changes can be made in the color, design, graphics or any other component to create a unique layout. This slide represents the timeline or Gantt chart of the SAP implementation process. It further includes various stages of process such as build team and identify business goal, evaluate business process, implement business blueprint, etc.

 Home
Home