Ascending Arrow
Operations Of Commercial Bank Dashboard Tracking Total Loans And Deposits Ppt Icon Mockup PDF
This slide contains dashboard that are used to track the loans and deposits in the bank. Deliver an awe-inspiring pitch with this creative operations of commercial bank dashboard tracking total loans and deposits ppt icon mockup pdf bundle. Topics like growth rate, 12 month trend can be discussed with this completely editable template. It is available for immediate download depending on the needs and requirements of the user.
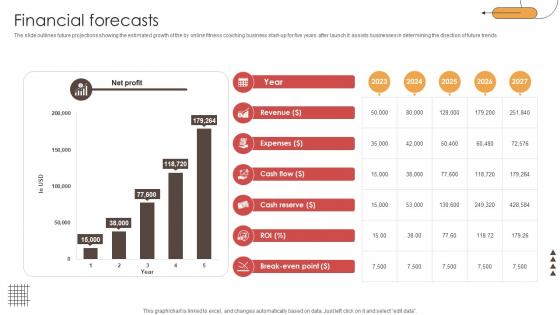
Financial Forecasts Digital Physical Training Business Market Entry Plan GTM SS V
The slide outlines future projections showing the estimated growth of the by online fitness coaching business start-up for five years after launch It assists businesses in determining the direction of future trends.Retrieve professionally designed Financial Forecasts Digital Physical Training Business Market Entry Plan GTM SS V to effectively convey your message and captivate your listeners. Save time by selecting pre-made slideshows that are appropriate for various topics, from business to educational purposes. These themes come in many different styles, from creative to corporate, and all of them are easily adjustable and can be edited quickly. Access them as PowerPoint templates or as Google Slides themes. You do not have to go on a hunt for the perfect presentation because Slidegeeks got you covered from everywhere. The slide outlines future projections showing the estimated growth of the by online fitness coaching business start-up for five years after launch It assists businesses in determining the direction of future trends.
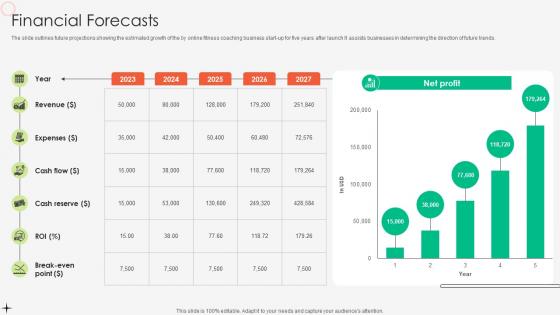
Financial Forecasts Online Fitness Tutoring Business Market Entry Plan GTM SS V
The slide outlines future projections showing the estimated growth of the by online fitness coaching business start-up for five years after launch It assists businesses in determining the direction of future trends.Slidegeeks has constructed Financial Forecasts Online Fitness Tutoring Business Market Entry Plan GTM SS V after conducting extensive research and examination. These presentation templates are constantly being generated and modified based on user preferences and critiques from editors. Here, you will find the most attractive templates for a range of purposes while taking into account ratings and remarks from users regarding the content. This is an excellent jumping-off point to explore our content and will give new users an insight into our top-notch PowerPoint Templates. The slide outlines future projections showing the estimated growth of the by online fitness coaching business start-up for five years after launch It assists businesses in determining the direction of future trends.
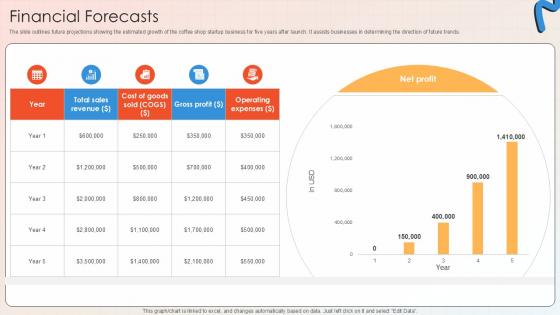
Financial Forecasts Apparel And Shoes E Commerce Market PPT Slide GTM SS V
The slide outlines future projections showing the estimated growth of the coffee shop startup business for five years after launch. It assists businesses in determining the direction of future trends. Present like a pro with Financial Forecasts Apparel And Shoes E Commerce Market PPT Slide GTM SS V. Create beautiful presentations together with your team, using our easy-to-use presentation slides. Share your ideas in real-time and make changes on the fly by downloading our templates. So whether you are in the office, on the go, or in a remote location, you can stay in sync with your team and present your ideas with confidence. With Slidegeeks presentation got a whole lot easier. Grab these presentations today. The slide outlines future projections showing the estimated growth of the coffee shop startup business for five years after launch. It assists businesses in determining the direction of future trends.
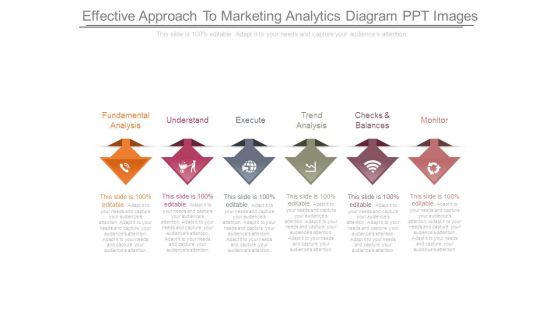
Effective Approach To Marketing Analytics Diagram Ppt Images
This is a effective approach to marketing analytics diagram ppt images. This is a six stage process. The stages in this process are fundamental analysis, understand, execute, trend analysis, checks and balances, monitor.
Business Turnaround Plan Development Checklist Icons PDF
This slide signifies the checklist on organisation turn around strategy. It includes various questions related to the approach that are either implemented in corporate for growth and stability Persuade your audience using this business turnaround plan development checklist icons pdf This PPT design covers six stages, thus making it a great tool to use. It also caters to a variety of topics including competitors your turnaround, communication channel, increasing organisation Download this PPT design now to present a convincing pitch that not only emphasizes the topic but also showcases your presentation skills.
Key Metrics To Measure Success Digital Marketing Strategies Improve Enterprise Sales Icons Pdf
The following slide showcases key performance indicators KPIs through which marketers can evaluate the effectiveness of marketing tactics. The KPIs covered in the slide are website traffic, brand impressions, annual contract value, new leads in pipeline, gross profit, net profit, market share, attrition rate, and monthly active users. Do you know about Slidesgeeks Key Metrics To Measure Success Digital Marketing Strategies Improve Enterprise Sales Icons Pdf These are perfect for delivering any kind od presentation. Using it, create PowerPoint presentations that communicate your ideas and engage audiences. Save time and effort by using our pre designed presentation templates that are perfect for a wide range of topic. Our vast selection of designs covers a range of styles, from creative to business, and are all highly customizable and easy to edit. Download as a PowerPoint template or use them as Google Slides themes. The following slide showcases key performance indicators KPIs through which marketers can evaluate the effectiveness of marketing tactics. The KPIs covered in the slide are website traffic, brand impressions, annual contract value, new leads in pipeline, gross profit, net profit, market share, attrition rate, and monthly active users.
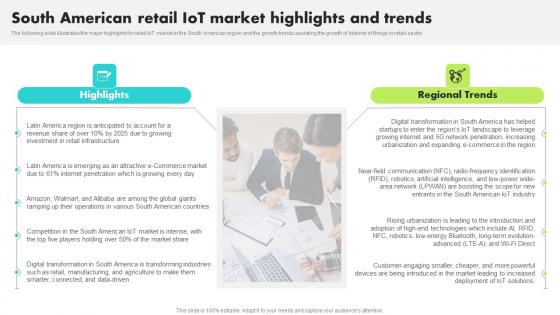
South American Retail IoT Market Highlights Guide For Retail IoT Solutions Analysis Formats Pdf
The following slide illustrates the major highlights for retail IoT market in the South American region and the growth trends assisting the growth of internet of things in retail sector Presenting this PowerPoint presentation, titled South American Retail IoT Market Highlights Guide For Retail IoT Solutions Analysis Formats Pdf, with topics curated by our researchers after extensive research. This editable presentation is available for immediate download and provides attractive features when used. Download now and captivate your audience. Presenting this South American Retail IoT Market Highlights Guide For Retail IoT Solutions Analysis Formats Pdf. Our researchers have carefully researched and created these slides with all aspects taken into consideration. This is a completely customizable South American Retail IoT Market Highlights Guide For Retail IoT Solutions Analysis Formats Pdf that is available for immediate downloading. Download now and make an impact on your audience. Highlight the attractive features available with our PPTs. The following slide illustrates the major highlights for retail IoT market in the South American region and the growth trends assisting the growth of internet of things in retail sector
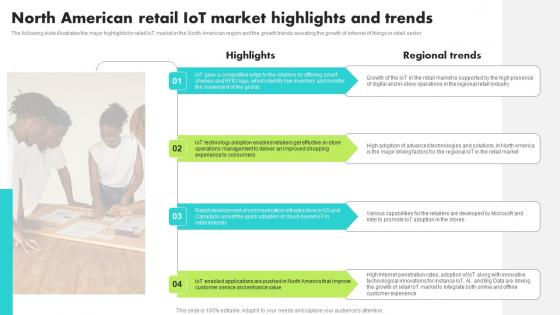
North American Retail IoT Market Highlights Guide For Retail IoT Solutions Analysis Guidelines Pdf
The following slide illustrates the major highlights for retail IoT market in the North American region and the growth trends assisting the growth of internet of things in retail sector Formulating a presentation can take up a lot of effort and time, so the content and message should always be the primary focus. The visuals of the PowerPoint can enhance the presenters message, so our North American Retail IoT Market Highlights Guide For Retail IoT Solutions Analysis Guidelines Pdf was created to help save time. Instead of worrying about the design, the presenter can concentrate on the message while our designers work on creating the ideal templates for whatever situation is needed. Slidegeeks has experts for everything from amazing designs to valuable content, we have put everything into North American Retail IoT Market Highlights Guide For Retail IoT Solutions Analysis Guidelines Pdf The following slide illustrates the major highlights for retail IoT market in the North American region and the growth trends assisting the growth of internet of things in retail sector
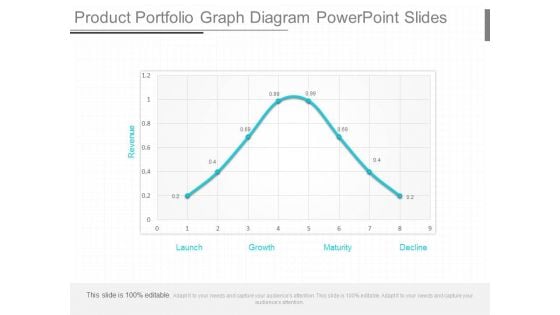
Product Portfolio Graph Diagram Powerpoint Slides
This is a product portfolio graph diagram powerpoint slides. This is a eight stage process. The stages in this process are revenue, launch, growth, maturity, decline.
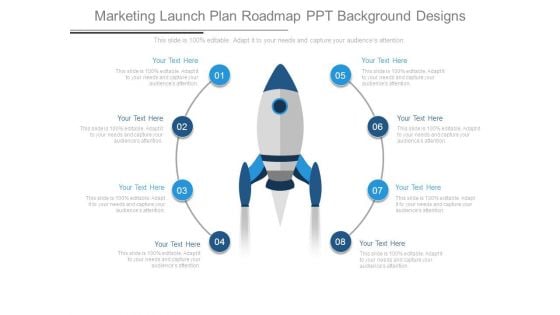
Marketing Launch Plan Roadmap Ppt Background Designs
This is a marketing launch plan roadmap ppt background designs. This is a eight stage process. The stages in this process are business, marketing, growth, success, planning.
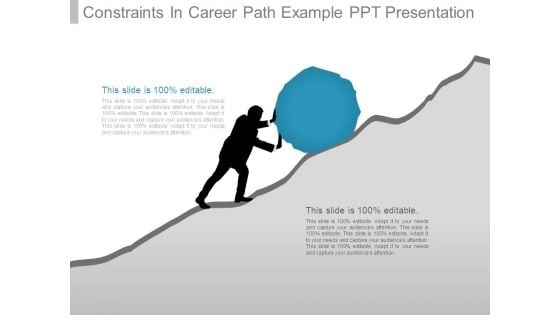
Constraints In Career Path Example Ppt Presentation
This is a constraints in career path example ppt presentation. This is a one stage process. The stages in this process are business, strategy, growth, success, presentation.
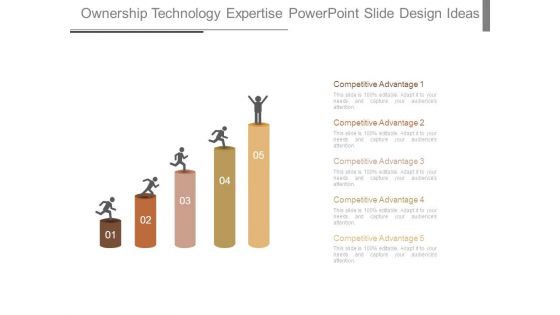
Ownership Technology Expertise Powerpoint Slide Design Ideas
This is a ownership technology expertise powerpoint slide design ideas. This is a five stage process. The stages in this process are business, process, marketing, strategy, growth.
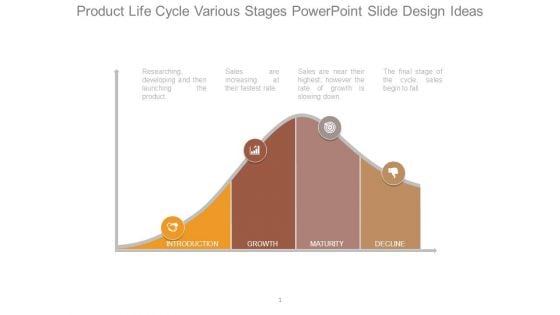
Product Life Cycle Various Stages Powerpoint Slide Design Ideas
This is a product life cycle various stages powerpoint slide design ideas. This is a four stage process. The stages in this process are introduction, growth, maturity, decline.
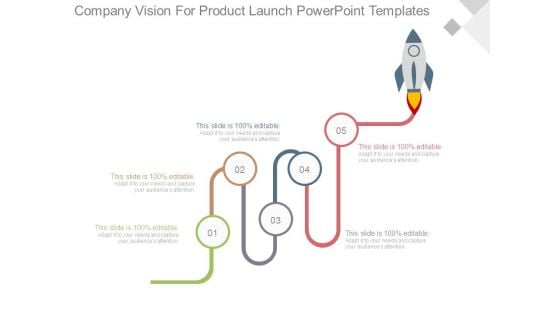
Company Vision For Product Launch Powerpoint Templates
This is a company vision for product launch powerpoint templates. This is a five stage process. The stages in this process are business, marketing, growth.
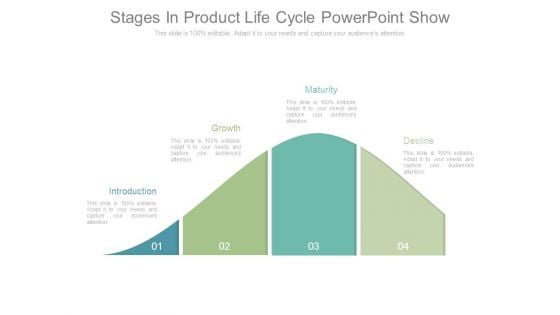
Stages In Product Life Cycle Powerpoint Show
This is a stages in product life cycle powerpoint show. This is a four stage process. The stages in this process are introduction, growth, maturity, decline.
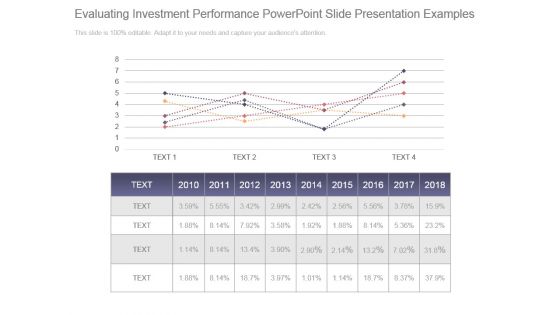
Evaluating Investment Performance Powerpoint Slide Presentation Examples
This is a evaluating investment performance powerpoint slide presentation examples. This is a five stage process. The stages in this process are graph, year, planning, growth, success.
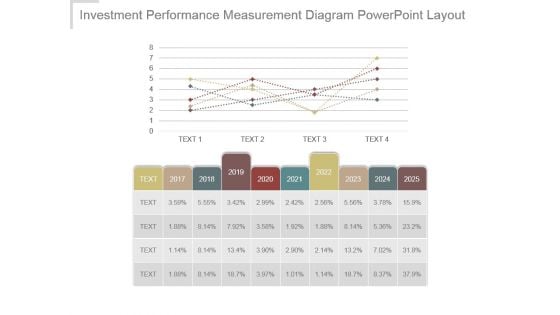
Investment Performance Measurement Diagram Powerpoint Layout
This is a investment performance measurement diagram powerpoint layout. This is a five stage process. The stages in this process are bar graph, growth, success, business, marketing.
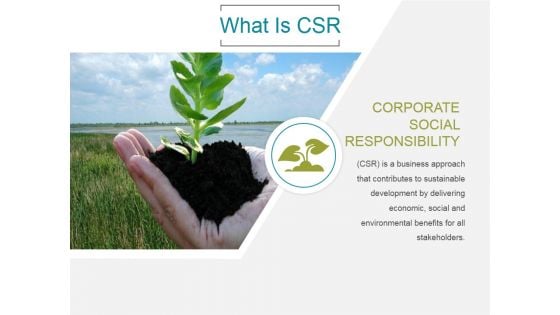
What Is Csr Ppt PowerPoint Presentation Pictures
This is a what is csr ppt powerpoint presentation pictures. This is a one stage process. The stages in this process are growth, business, marketing, environment.
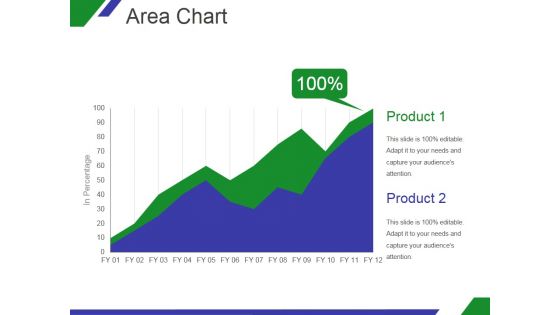
Area Chart Ppt PowerPoint Presentation Designs
This is a area chart ppt powerpoint presentation designs. This is a two stage process. The stages in this process are product, graph, in percentage, growth, business.
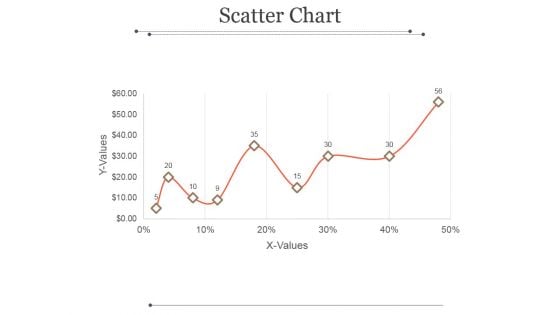
Scatter Chart Ppt PowerPoint Presentation Example
This is a scatter chart ppt powerpoint presentation example. This is a nine stage process. The stages in this process are x values, y values, business, growth, success.
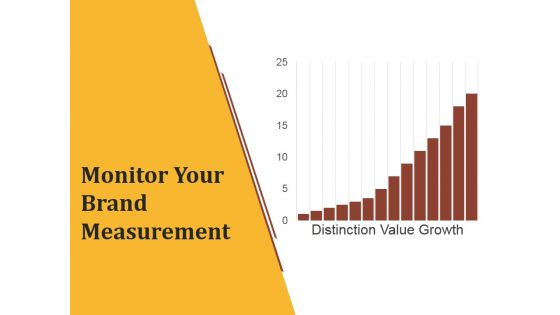
Monitor Your Brand Measurement Ppt PowerPoint Presentation Slides
This is a monitor your brand measurement ppt powerpoint presentation slides. This is a fourteen stage process. The stages in this process are distinction value growth, success, graph.
Scatter Chart Ppt PowerPoint Presentation Icon
This is a scatter chart ppt powerpoint presentation icon. This is a two stage process. The stages in this process are product, growth, business, marketing.
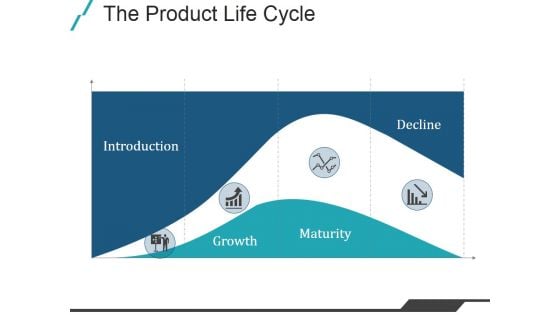
The Product Life Cycle Ppt PowerPoint Presentation Designs
This is a the product life cycle ppt powerpoint presentation designs. This is a four stage process. The stages in this process are introduction, growth, maturity, decline.
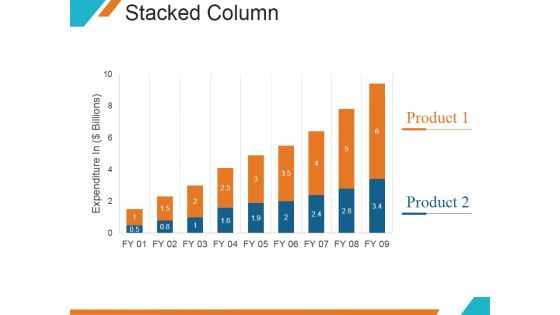
Stacked Column Ppt PowerPoint Presentation Topics
This is a stacked column ppt powerpoint presentation topics. This is a nine stage process. The stages in this process are expenditure in, product, graph, growth, success.
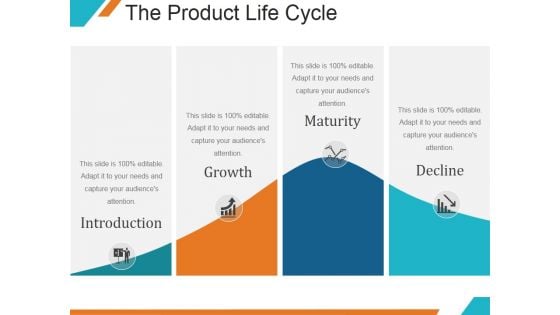
The Product Life Cycle Ppt PowerPoint Presentation Ideas
This is a the product life cycle ppt powerpoint presentation ideas. This is a four stage process. The stages in this process are introduction, growth, maturity, decline.

Scatter Chart Ppt PowerPoint Presentation Portfolio Design Inspiration
This is a scatter chart ppt powerpoint presentation portfolio design inspiration. This is a twelve stage process. The stages in this process are graph, growth, success, business.
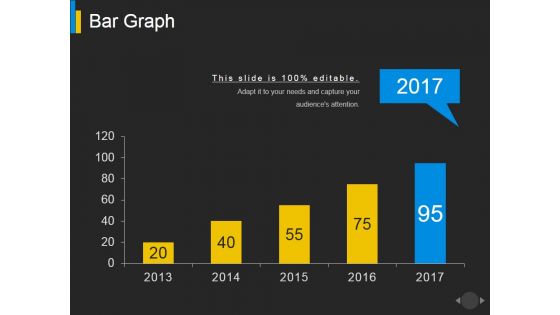
Bar Graph Ppt PowerPoint Presentation Pictures Graphics Pictures
This is a bar graph ppt powerpoint presentation pictures graphics pictures. This is a five stage process. The stages in this process are graph, growth, business, marketing, finance.
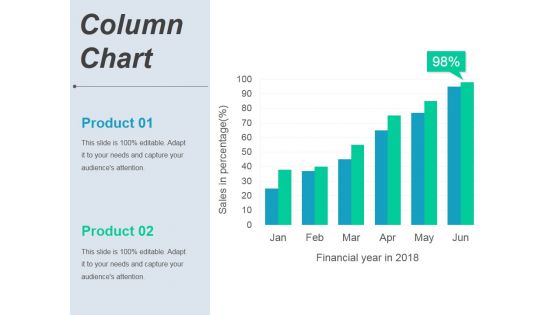
Column Chart Ppt PowerPoint Presentation Portfolio Graphics Template
This is a column chart ppt powerpoint presentation portfolio graphics template. This is a six stage process. The stages in this process are product, finance, growth, success, business.

Combo Chart Ppt PowerPoint Presentation Professional Graphics Example
This is a combo chart ppt powerpoint presentation professional graphics example. This is a eight stage process. The stages in this process are product, finance, growth, success, business.
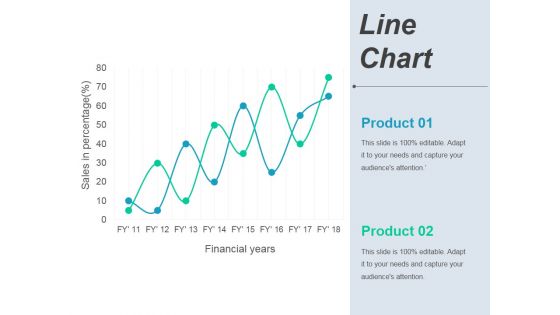
Line Chart Ppt PowerPoint Presentation Ideas Deck
This is a line chart ppt powerpoint presentation ideas deck. This is a two stage process. The stages in this process are business, marketing, finance, growth.
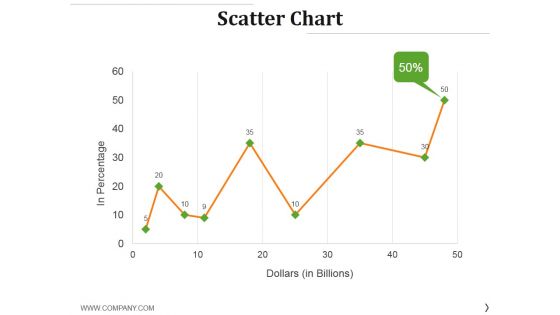
Scatter Chart Ppt PowerPoint Presentation Layouts Gridlines
This is a scatter chart ppt powerpoint presentation layouts gridlines. This is a nine stage process. The stages in this process are in percentage, dollars, growth, success, finance.

Our Mission Ppt PowerPoint Presentation Infographic Template Elements
This is a our mission ppt powerpoint presentation infographic template elements. This is a one stage process. The stages in this process are growth, business, marketing, launch, success.
Scatter Chart Ppt PowerPoint Presentation Icon Visuals
This is a scatter chart ppt powerpoint presentation icon visuals. This is a nine stage process. The stages in this process are business, growth, finance, success, marketing.
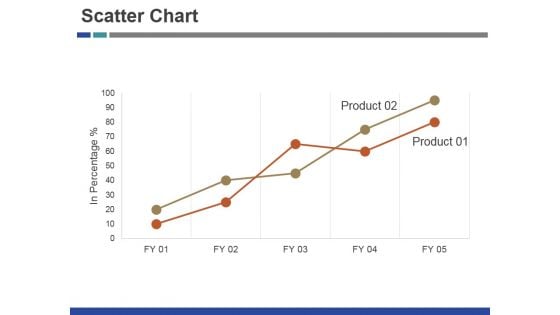
Scatter Chart Ppt PowerPoint Presentation Inspiration Brochure
This is a scatter chart ppt powerpoint presentation inspiration brochure. This is a two stage process. The stages in this process are product, growth, success, business.
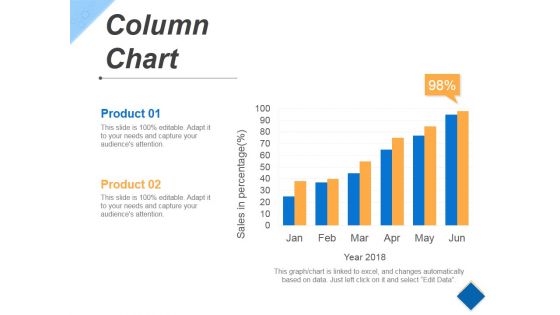
Column Chart Ppt PowerPoint Presentation Styles Vector
This is a column chart ppt powerpoint presentation styles vector. This is a six stage process. The stages in this process are growth, success, business, marketing, product.
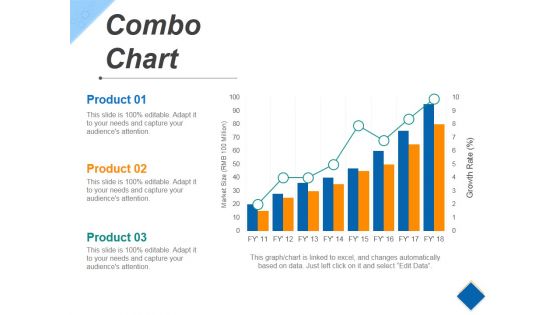
Combo Chart Ppt PowerPoint Presentation Diagram Images
This is a combo chart ppt powerpoint presentation diagram images. This is a eight stage process. The stages in this process are growth, success, business, marketing, product.

Line Chart Ppt PowerPoint Presentation Pictures Maker
This is a line chart ppt powerpoint presentation pictures maker. This is a two stage process. The stages in this process are financial years, product, growth, success.

Clustered Bar Ppt PowerPoint Presentation File Inspiration
This is a clustered bar ppt powerpoint presentation file inspiration. This is a two stage process. The stages in this process are product, profit, growth, success, graph.
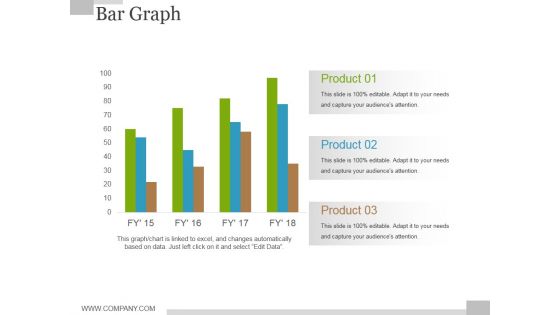
Bar Graph Ppt PowerPoint Presentation File Graphics Template
This is a bar graph ppt powerpoint presentation file graphics template. This is a four stage process. The stages in this process are product, business, graph, growth, success.
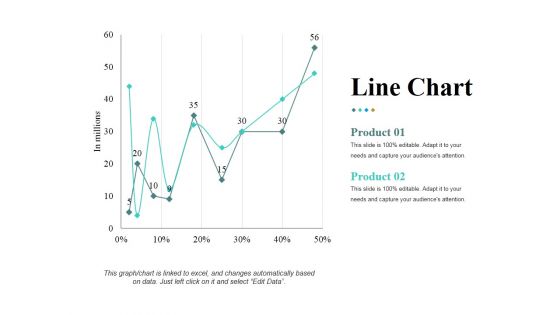
Line Chart Ppt PowerPoint Presentation Pictures Ideas
This is a line chart ppt powerpoint presentation pictures ideas. This is a two stage process. The stages in this process are in millions, percentage, finance, product, growth.

Scatter Chart Ppt PowerPoint Presentation Infographic Template Objects
This is a scatter chart ppt powerpoint presentation infographic template objects. This is a nine stage process. The stages in this process are product, growth, success, graph.
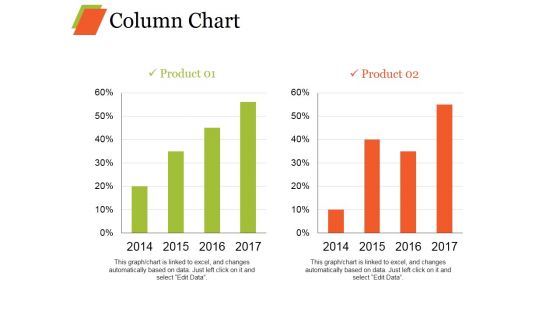
Column Chart Ppt PowerPoint Presentation Infographics Model
This is a column chart ppt powerpoint presentation infographics model. This is a two stage process. The stages in this process are bar graph, growth, product, percentage, year.
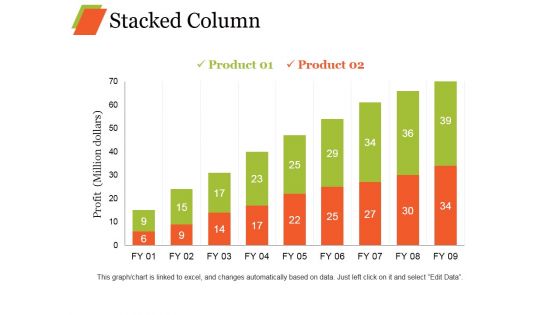
Stacked Column Ppt PowerPoint Presentation Inspiration Templates
This is a stacked column ppt powerpoint presentation inspiration templates. This is a two stage process. The stages in this process are product, profit, success, growth, business.
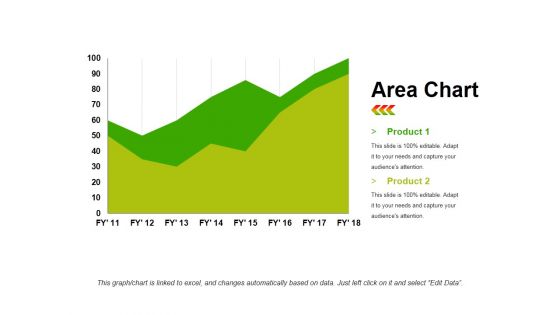
Area Chart Ppt PowerPoint Presentation Layouts Structure
This is a area chart ppt powerpoint presentation layouts structure. This is a two stage process. The stages in this process are area chart, product, business, growth, success.
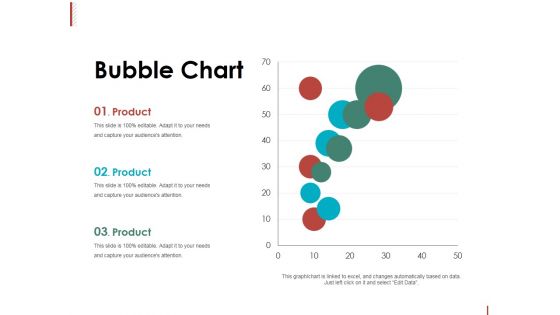
Bubble Chart Ppt PowerPoint Presentation File Professional
This is a bubble chart ppt powerpoint presentation file professional. This is a three stage process. The stages in this process are product, bubble chart, growth, business, success.

Client Referrals Ppt PowerPoint Presentation Gallery Guidelines
This is a client referrals ppt powerpoint presentation gallery guidelines. This is a four stage process. The stages in this process are clients, growth, success, business, marketing.
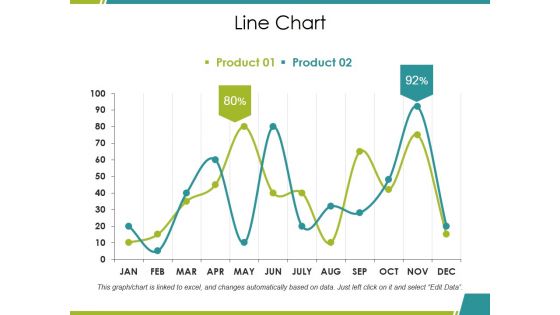
Line Chart Ppt PowerPoint Presentation Model Pictures
This is a line chart ppt powerpoint presentation model pictures. This is a two stage process. The stages in this process are product, percentage, growth, line chart, business.
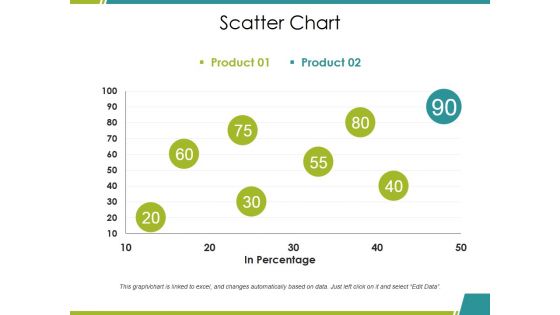
Scatter Chart Ppt PowerPoint Presentation Summary Inspiration
This is a scatter chart ppt powerpoint presentation summary inspiration. This is a two stage process. The stages in this process are product, in percentage, growth, success, business.
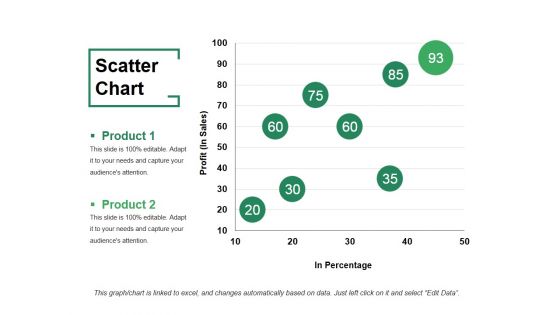
Scatter Chart Ppt PowerPoint Presentation File Visuals
This is a scatter chart ppt powerpoint presentation file visuals. This is a two stage process. The stages in this process are product, profit, in percentage, growth, success.
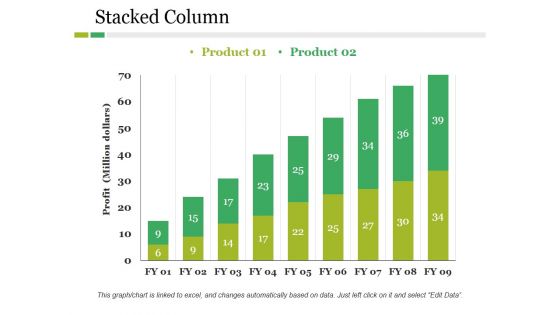
Stacked Column Ppt PowerPoint Presentation Pictures Outfit
This is a stacked column ppt powerpoint presentation pictures outfit. This is a two stage process. The stages in this process are product, profit, growth, bar graph, success.
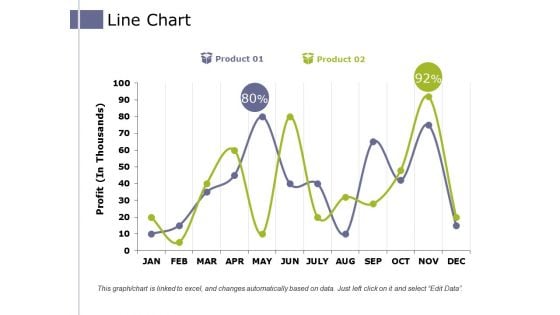
Line Chart Ppt PowerPoint Presentation Pictures Example Introduction
This is a line chart ppt powerpoint presentation pictures example introduction. This is a two stage process. The stages in this process are product, profit, business, growth, success.
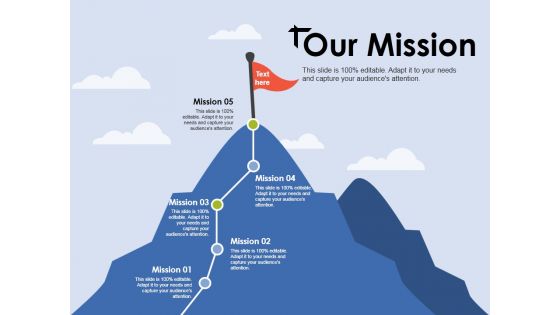
Our Mission Ppt PowerPoint Presentation Show Graphics
This is a our mission ppt powerpoint presentation show graphics. This is a one stage process. The stages in this process are mission, growth, success, business, marketing.

Bubble Chart Ppt PowerPoint Presentation Infographics Images
This is a bubble chart ppt powerpoint presentation infographics images. This is a two stage process. The stages in this process are product, bubble chart, business, growth, success.
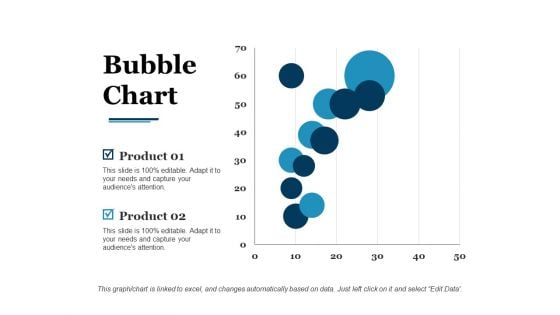
Bubble Chart Ppt PowerPoint Presentation Pictures Good
This is a bubble chart ppt powerpoint presentation pictures good. This is a two stage process. The stages in this process are product, bubble chart, growth.
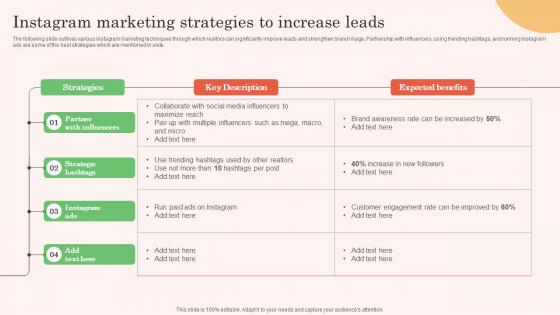
Instagram Marketing Strategies To Increase Leads Real Estate Property Marketing Brochure Pdf
The following slide outlines various Instagram marketing techniques through which realtors can significantly improve leads and strengthen brand image. Partnership with influencers, using trending hashtags, and running Instagram ads are some of the best strategies which are mentioned in slide.The Instagram Marketing Strategies To Increase Leads Real Estate Property Marketing Brochure Pdf is a compilation of the most recent design trends as a series of slides. It is suitable for any subject or industry presentation, containing attractive visuals and photo spots for businesses to clearly express their messages. This template contains a variety of slides for the user to input data, such as structures to contrast two elements, bullet points, and slides for written information. Slidegeeks is prepared to create an impression. The following slide outlines various Instagram marketing techniques through which realtors can significantly improve leads and strengthen brand image. Partnership with influencers, using trending hashtags, and running Instagram ads are some of the best strategies which are mentioned in slide.
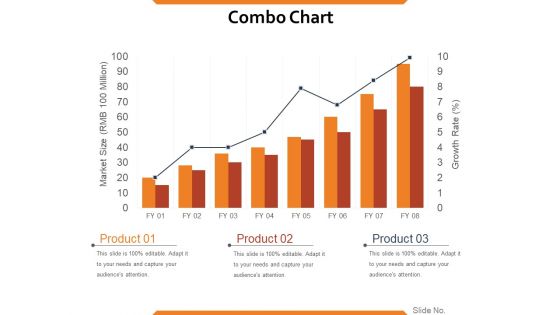
Combo Chart Ppt PowerPoint Presentation Styles Good
This is a combo chart ppt powerpoint presentation styles good. This is a eight stage process. The stages in this process are market size, growth rate, product, growth, strategy, graph, finance.
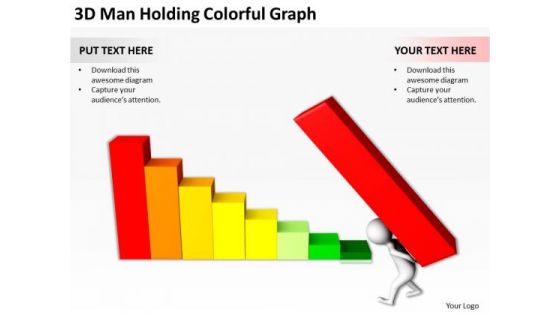
Business People Vector Man Holding Colorful Graph PowerPoint Templates Ppt Backgrounds For Slides
We present our business people vector man holding colorful graph PowerPoint templates PPT backgrounds for slides.Download our People PowerPoint Templates because You should Bet on your luck with our PowerPoint Templates and Slides. Be assured that you will hit the jackpot. Download and present our Process and Flows PowerPoint Templates because Our PowerPoint Templates and Slides will give you great value for your money. Be assured of finding the best projection to highlight your words. Use our Future PowerPoint Templates because Our PowerPoint Templates and Slides will let Your superior ideas hit the target always and everytime. Download our Shapes PowerPoint Templates because Our PowerPoint Templates and Slides offer you the needful to organise your thoughts. Use them to list out your views in a logical sequence. Download and present our Marketing PowerPoint Templates because Our PowerPoint Templates and Slides are created with admirable insight. Use them and give your group a sense of your logical mind.Use these PowerPoint slides for presentations relating to 3d, abstract, bargraph, bars, blue, business, character, chart, colored, colors,concept, economy, figure, finances, financial, graph, green, growing, growth,holding, human, illustration, isolated, male, man, manipulating, mannequin,market, multi, optimizing, orange, people, person, progression, rainbow, raising,red, render, row, solution, standing, stick, tendency, trend, upward, white, white background, yellow. The prominent colors used in the PowerPoint template are Red, Yellow, Green. Professionals tell us our business people vector man holding colorful graph PowerPoint templates PPT backgrounds for slides effectively help you save your valuable time. Professionals tell us our bargraph PowerPoint templates and PPT Slides provide you with a vast range of viable options. Select the appropriate ones and just fill in your text. People tell us our business people vector man holding colorful graph PowerPoint templates PPT backgrounds for slides are designed by professionals Customers tell us our bargraph PowerPoint templates and PPT Slides have awesome images to get your point across. The feedback we get is that our business people vector man holding colorful graph PowerPoint templates PPT backgrounds for slides have awesome images to get your point across. Use our colored PowerPoint templates and PPT Slides are incredible easy to use. Our Business People Vector Man Holding Colorful Graph PowerPoint Templates Ppt Backgrounds For Slides team exert themselves. They put in all the effort for you.
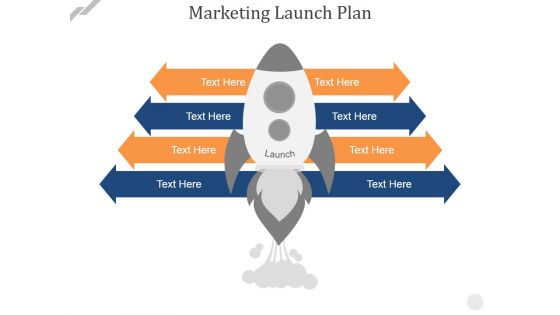
Marketing Launch Plan Ppt PowerPoint Presentation Model Format Ideas
This is a marketing launch plan ppt powerpoint presentation model format ideas. This is a one stage process. The stages in this planning, success, management, strategy, marketing, business.
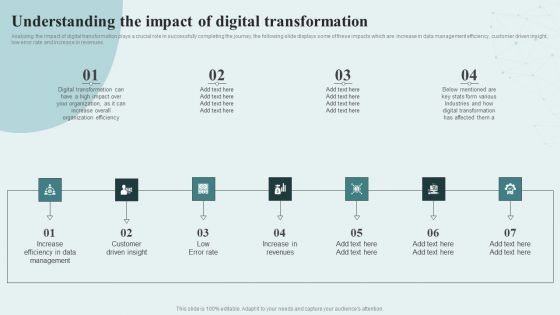
Digital Competency Evaluation And Modification Understanding The Impact Of Digital Download PDF
Analyzing the impact of digital transformation plays a crucial role in successfully completing the journey, the following slide displays some of these impacts which are increase in data management efficiency, customer driven insight, low error rate and increase in revenues. Do you know about Slidesgeeks Digital Competency Evaluation And Modification Understanding The Impact Of Digital Download PDF These are perfect for delivering any kind od presentation. Using it, create PowerPoint presentations that communicate your ideas and engage audiences. Save time and effort by using our pre-designed presentation templates that are perfect for a wide range of topic. Our vast selection of designs covers a range of styles, from creative to business, and are all highly customizable and easy to edit. Download as a PowerPoint template or use them as Google Slides themes.


 Continue with Email

 Home
Home


