Ascending Arrow
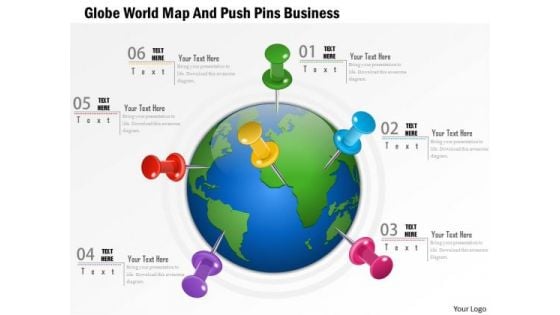
Consulting Slides Globe World Map And Push Pins Business Presentation
This diagram displays globe with world map and push pins. Use this diagram, in your presentations to express views on geography, business agendas and global business network. This diagram may be used in business growth and global business strategies related presentations. Charm your audience by using this diagram in your presentations.
Consulting Slides Graph With Abc Steps And Icons Business Presentation
This diagram displays bar graph with ABC steps and business icons. This diagram may be used in your presentations to depict any information and data which requires visual presentation. Use this diagram, in your presentations to express view on growth, progress and success. Create eye-catching presentations using this diagram.
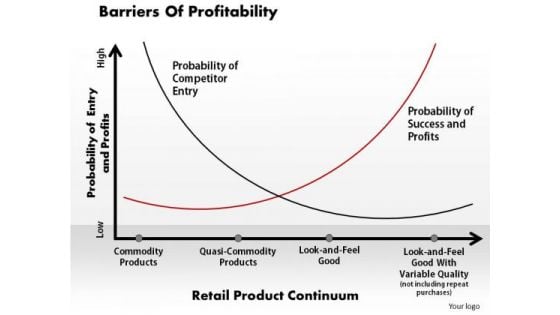
Business Framework Barriers Of Profitability PowerPoint Presentation
Explain the concept of profitability and barriers of profitability with our power point diagram slide. This diagram slide has been crafted with graphic of two phase chart to display barriers in profitability. We have used red and black growth lines with cross and hyperbolic regions which are displaying the barriers. use this image for finance related presentations.
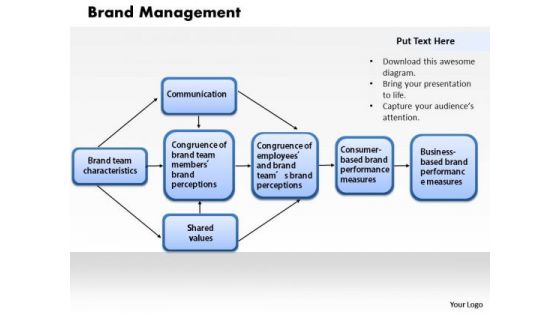
Business Framework Brand Management PowerPoint Presentation
This power point diagram slide contains the linear flow chart with two variable stages. This flow chart is used to display the concept of brand management. Define the usability and importance of brand management in business and growth with this unique PPT slide. Display brand management in any business presentation with our exclusive slide.
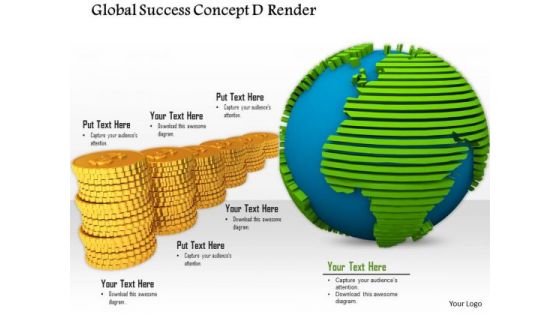
Stock Photo Globe With Gold Coins For Global Success PowerPoint Slide
This image slide displays globe with gold coins. This image slide depicts financial and economic growth and success. Use this image slide, in your presentation to express social and business views related to world. This image slide will enhance the quality of your presentations.
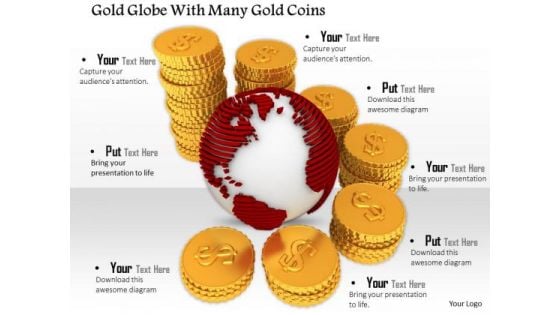
Stock Photo Globe With Red Textured Map Gold Coins PowerPoint Slide
This image slide displays red textured globe with gold coins. This image slide depicts financial and economic growth and success. Use this image slide, in your presentation to express social and business views related to world. This image slide will enhance the quality of your presentations.
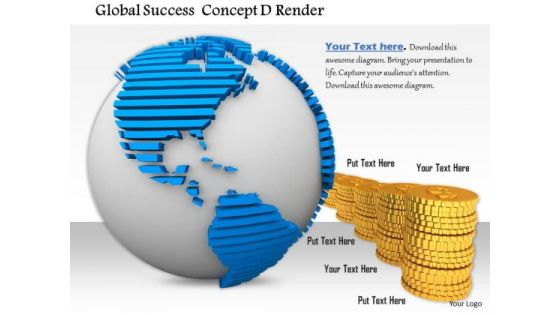
Stock Photo White Colored Globe Textured Map Gold Coins PowerPoint Slide
This image slide displays white colored textured globe with gold coins. This image slide depicts financial and economic growth. Use this image slide, in your presentation to express social and business views related to world. This image slide will enhance the quality of your presentations.
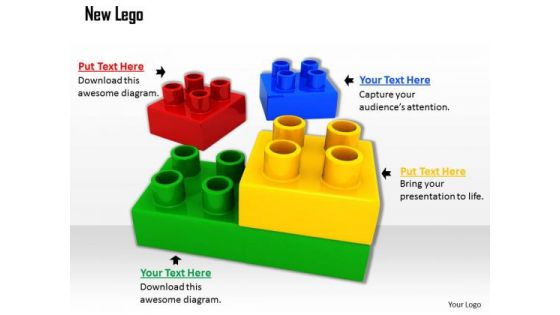
Stock Photo New Legos PowerPoint Slide
This image slide displays graphic of colorful Legos connected. Use this image slide, in your presentations to express views on growth, build, construction organization and game. This image may also be used to depict strategic business management. This image slide will enhance the quality of your presentations.
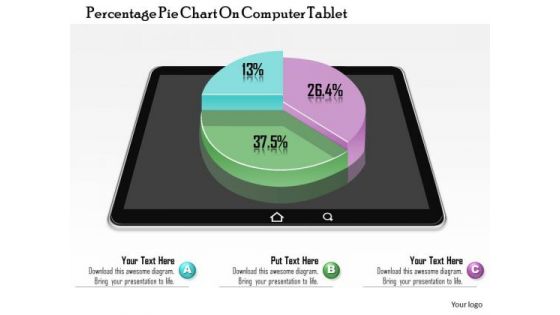
Business Diagram Percentage Pie Chart On Computer Tablet Presentation Template
This image slide displays business consulting diagram of percentage pie chart on computer tablet. This image has been made with 3d colorful graphic of pie chart on black tablet. Use this PowerPoint template, in your presentations to express various views like growth, achievements, success in business. This image slide will make your presentations outshine.
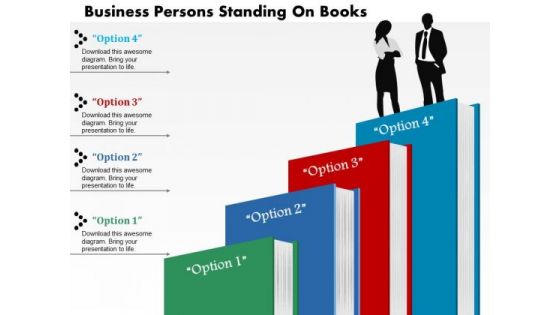
Business Diagram Persons Standing On Books Presentation Template
This image slide displays diagram of 3d people standing on books. This image slide has been made with 3d image of two business executive standing on 3d colorful graphic of books. Use this PowerPoint template, in your presentations to express views on growth, target, management and planning in any business. This image slide will make your presentations colorful.
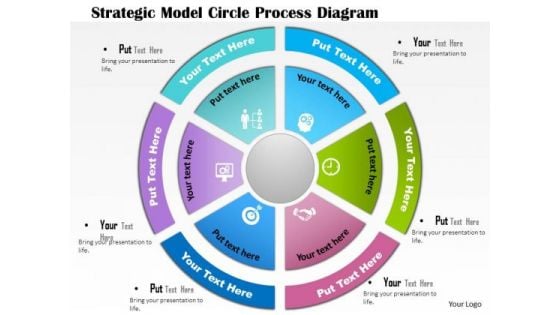
Business Diagram Strategic Model Circle Process Diagram Presentation Template
This image slide displays diagram of circle with various business symbols. This image slide exhibits strategic model in circle. Use this PowerPoint template, in your presentations to express strategies on growth , target, management and planning in any business. This image slide will make your presentations colorful.
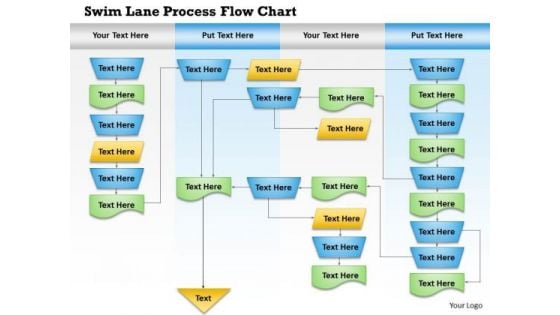
Business Diagram Swim Lane Process Flow Chart Presentation Template
This image slide displays diagram of swim lane process flow chart. This image slide has been made with swim lane flowchart that visually distinguishes responsibilities for sub-processes of a business process. Use this PowerPoint template, in your presentations to express views on growth, target, management and planning in any business. This image slide will make your presentations eye-catching.
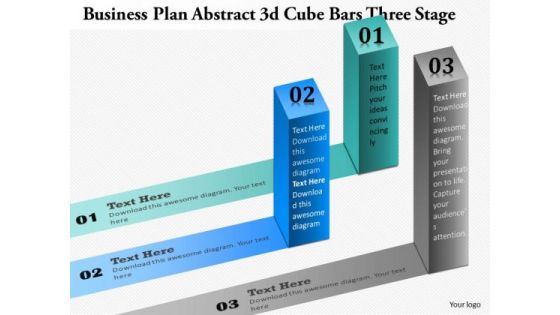
Business Diagram Abstract 3d Cube Bars Three Stages Presentation Template
This diagram displays 3d cube bars with three stages. It contains bar graph to present three stages of any business process or it can be used to exhibit three stages of business growth. Use this professional and customized business diagram in your PowerPoint presentations.
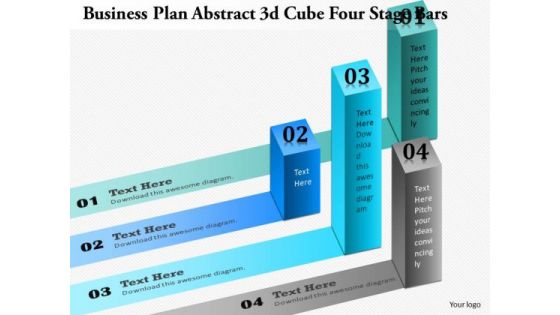
Business Diagram Abstract 3d Cube Four Stage Bars Presentation Template
This diagram display 3d cube four stage bars. It conations bar graph to present four stages of any business process or it can be used to exhibit four stages of business growth. Use this professional and customized business diagram in your PowerPoint presentations.
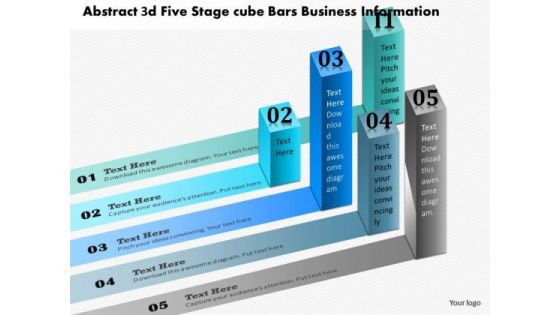
Business Diagram Abstract 3d Five Stage Cube Bars Business Information Presentation Template
This diagram displays 3d five stage cube bars. It conations bar graph to present four stages of any business process or it can be used to exhibit four stages of business growth. Use this professional and customized business diagram in your PowerPoint presentations.

Business Diagram Abstract 3d Six Stage Cube Bars Presentation Template
This diagram displays 3d six stage cube bars. It contains bar graph to present six stages of any business process or it can be used to exhibit six stages of business growth. Use this professional and customized business diagram in your PowerPoint presentations.
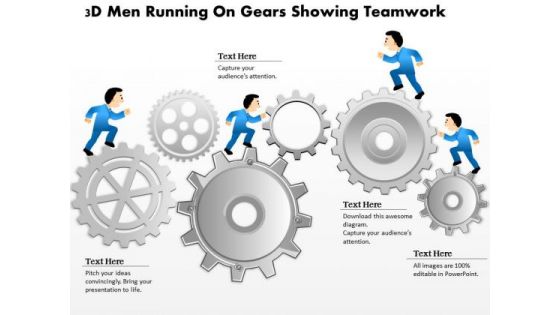
Business Diagram 3d Men Running On Gears Showing Teamwork Presentation Template
This image slide displays 3d men running on gears. In this slide, there is graphic of two business executives running on the gears. This image slide depicts teamwork. Use this PowerPoint template, in your presentations to express growth, teamwork and management in any industrial, mechanical and technology business. This image slide will enhance the quality of your presentations.

Business Diagram Alarm Clock With Business Checklist For Time Management Presentation Template
This image slide displays alarm clock with business checklist. In this slide, there is graphic of 3d alarm clock with business checklist on clipboard. This image slide depicts time management. Use this PowerPoint template, in your presentations to express views on planning, time management and growth. This image slide will enhance the quality of your presentations.
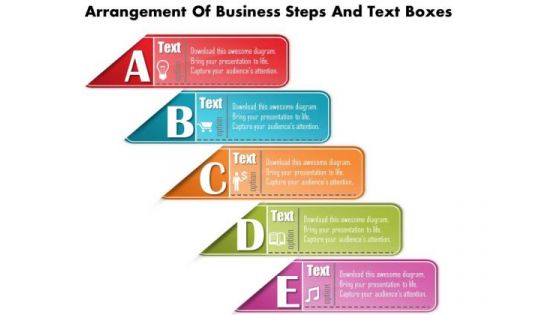
Business Diagram Arrangement Of Business Steps And Text Boxes Presentation Template
This image slide displays business consulting diagram of arrangement of business steps and textboxes. In this slide, there is graphic of alphabetic colorful textboxes with different icons in steps. This image slide depicts planning. Use this PowerPoint template, in your presentations to express growth, teamwork and planning in business. This image slide will make your presentations attractive.
Business Diagram Business Agenda Diagram With Icons Presentation Template
This image slide displays business agenda diagram with icons. This slide consist of various business icons in background and business agenda list in front with numbering displayed with fingers . This image slide depicts planning. This PowerPoint template will help you express business targets, growth, achievements etc. This image slide will enhance the quality of your presentations.
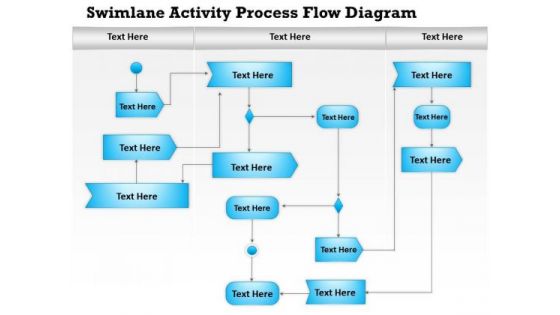
Business Diagram Swimlane Activity Process Flow Diagram Presentation Template
This image slide displays diagram of swim lane process flow chart. This image slide has been made with swim lane flowchart that visually distinguishes responsibilities for sub-processes of a business process. Use this PowerPoint template, in your presentations to express views on growth, target, management and planning activities in business. This image slide will make your presentations impressive.
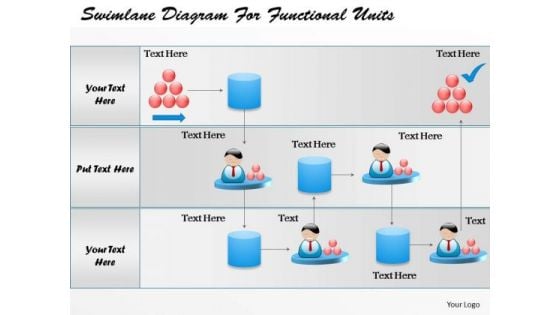
Business Diagram Swimlane Diagram For Functional Units Presentation Template
This image slide displays swim lane diagram for functional units. This image slide has been made with swim lane flowchart that visually distinguishes responsibilities. Use this PowerPoint template, in your presentations to express views on various functions of business like growth, target, management and planning. This image slide will make your presentations colorful.
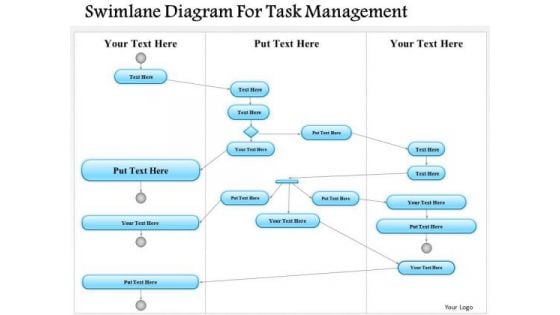
Business Diagram Swimlane Diagram For Task Management Presentation Template
This image slide displays swim lane diagram for task management. This image slide has been made with swim lane flowchart which visually distinguishes responsibilities for sub-processes of a business process. Use this PowerPoint template, in your presentations to express views on growth, target, management and planning in any business. This image slide will make your presentations eye-catching.
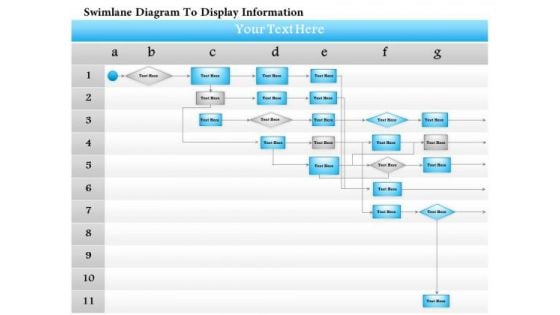
Business Diagram Swimlane Diagram To Display Information Presentation Template
This image slide displays swim lane diagram to display information. This image slide has been made with swim lane flowchart that visually distinguishes priorities of information. Use this PowerPoint template, in your presentations to express views on growth, target, management and planning in any business. This image slide will make your presentations precise.
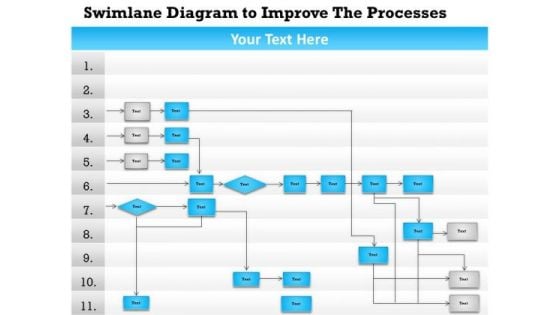
Business Diagram Swimlane Diagram To Improve The Processes Presentation Template
This image slide displays swim lane diagram to improve the process. This image slide has been made with swim lane flowchart which visually distinguishes responsibilities for sub-processes of a business process. Use this PowerPoint template, in your presentations to express views on growth, target, management and planning in any business. This image slide will make your presentations attractive.
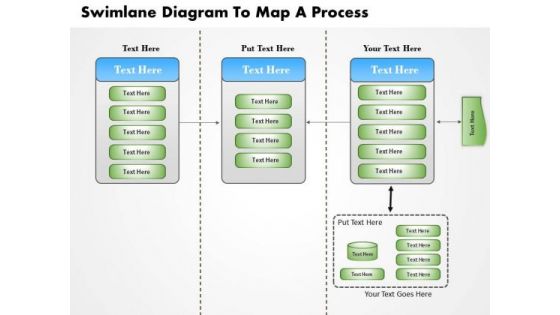
Business Diagram Swimlane Diagram To Map A Process Presentation Template
This image slide displays swim lane diagram to map a process. This image slide has been made with swim lane flowchart that visually distinguishes responsibilities for sub-processes of a business process. Use this PowerPoint template, in your presentations to express views on growth, target, management and planning processes in business. This image slide will make your presentations precise.
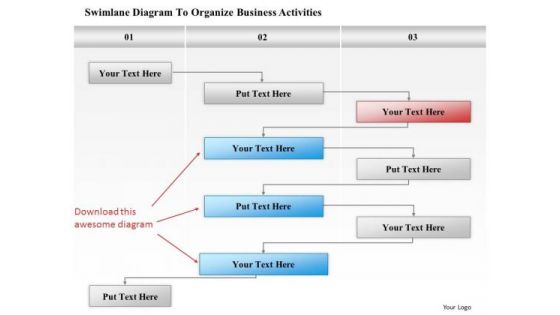
Business Diagram Swimlane Diagram To Organize Business Activities Presentation Template
This image slide displays swim lane diagram to organize business activities. This image slide has been made with swim lane flowchart that visually distinguishes responsibilities for sub-processes of a business process. Use this PowerPoint template, in your presentations to express views on growth, target, management and planning in business. This image slide will make your presentations precise.
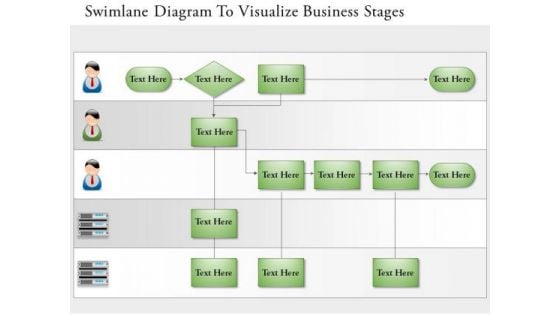
Business Diagram Swimlane Diagram To Visualize Business Stages Presentation Template
This image slide displays swim lane diagram to visualize business stages. This image slide has been made with swim lane flowchart that visually distinguishes responsibilities for sub-stages of a business. Use this PowerPoint template, in your presentations to express views on growth, target, management and planning in business. This image slide will make your presentations precise.
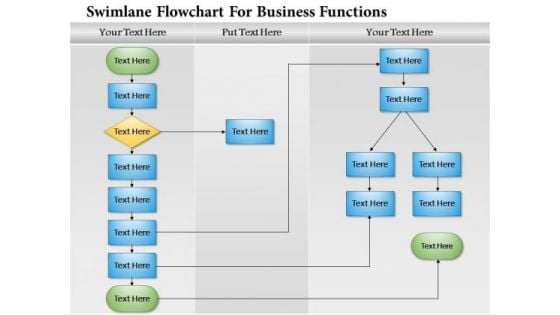
Business Diagram Swimlane Flowchart For Business Functions Presentation Template
This image slide displays swim lane flow chart for business functions. This image slide has been made with swim lane flowchart that visually distinguishes priorities for sub-functions of a business. Use this PowerPoint template, in your presentations to express views on growth, target, management and planning in business. This image slide will make your presentations precise.

Business Diagram Three Different Areas Map Globes Presentation Template
This business diagram displays three different areas map globes. This PowerPoint diagram has been designed with three different locations globes and options. Use this diagram, in your presentations to express views on globalization, global business, world trade, global growth and global industry. This diagram will help you express your views to target audience.
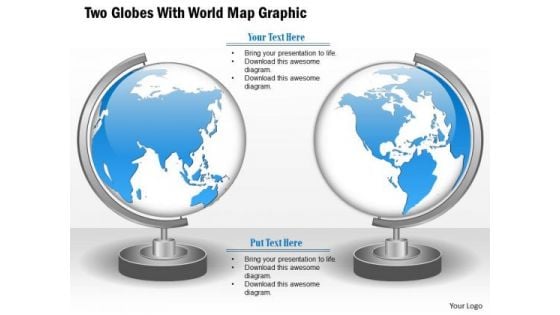
Business Diagram Two Globes With World Map Graphic Presentation Template
This PowerPoint template has been designed with graphic of two different locations globes and options. Use this diagram, in your presentations to express views on globalization, global business, world trade, global growth and global industry. This diagram will help you express your views to target audience.
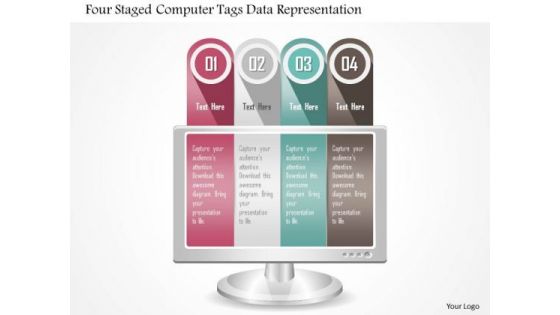
Business Diagram Four Staged Computer Tags Data Representation Presentation Template
This diagram has been designed with four staged computer tags. You can insert this diagram into your presentations to clarify information. Highlight your ideas broad based on strong fundamentals and illustrate how they step by step achieve the set growth factor.
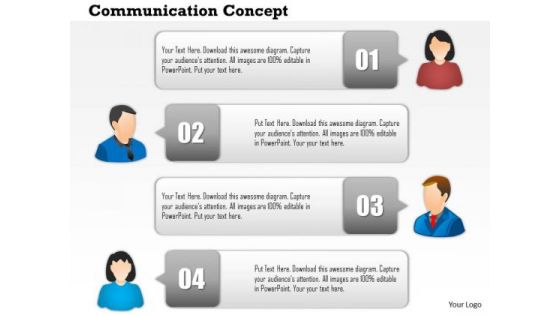
Business Diagram Four Staged Communication Text Boxes Presentation Template
This diagram has been designed with four communication steps with text boxes. You can insert this diagram into your presentations to clarify information. Highlight your ideas broad based on strong fundamentals and illustrate how they step by step achieve the set growth factor.
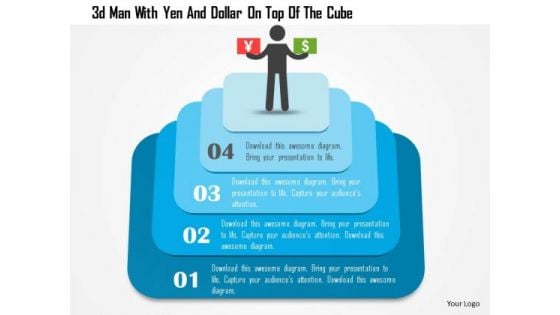
Business Diagram 3d Man With Yen And Dollar On Top Of The Cube Presentation Template
This power point template slide has been designed with graphic of 3d man, yen and dollar on the top of the cube. This PPT diagram contains the concept of financial growth. Use this PPT diagram for business and finance related presentations.
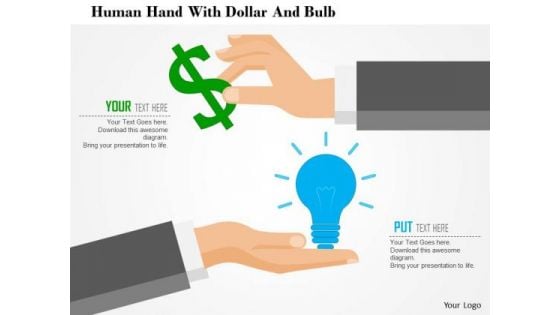
Business Diagram Human Hand With Dollar And Bulb Presentation Template
In this power point template two human hand graphic has been used to show the concept of financial growth and idea generation for it. This PPT also contains the graphic of dollar and bulb to justify the concept. Use this PPT for your business and finance related presentations.
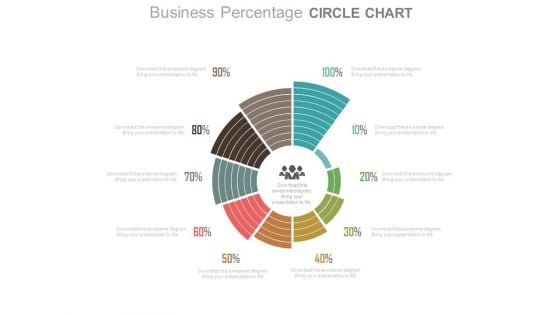
Business Percentage Ratio Circle Chart Powerpoint Slides
This PowerPoint template contains design of circle chart with team icon and percentage ratios. You may download this slide to display steps for strategic growth planning. You can easily customize this template to make it more unique as per your need.
Linear Timeline With Year And Business Icons Powerpoint Slides
This timeline slide design can be used to display yearly business growth. It contains timeline diagram with years and business icons. This timeline template can be used in presentations where you need to display a roadmap or it may be used for business target analysis.

Pie Chart With Increasing Percentage Values Powerpoint Slides
This PowerPoint template has been designed with diagram of pie chart with increasing percentage values. This PPT slide can be used to prepare presentations for profit growth report and also for financial data analysis. You can download finance PowerPoint template to prepare awesome presentations.
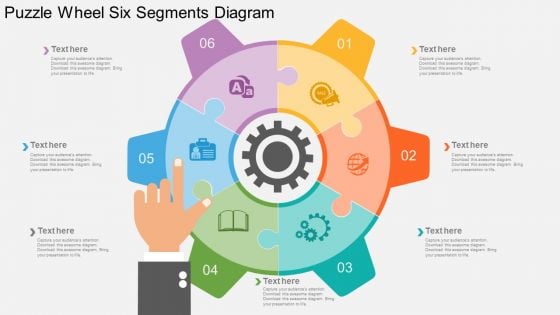
Puzzle Wheel Six Segments Diagram Powerpoint Template
Emphatically define your message with our above template which contains puzzle gear wheel with six segments. Download this diagram slide to display solutions for business growth. This diagram is editable you can edit text, color, shade and style as per you need.
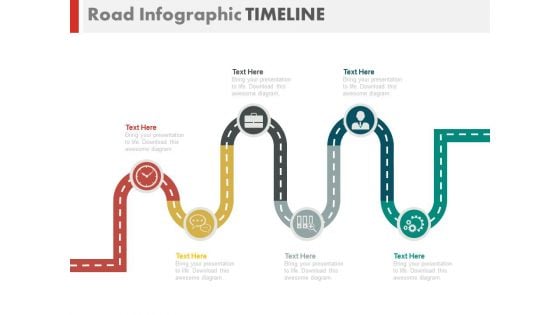
Zigzag Business Roadmap Infographics Powerpoint Slides
This timeline slide design can be used to display yearly business growth. It contains zigzag business roadmap with icons. This timeline template can be used in presentations where you need to display a roadmap or it may be used for business target analysis.
Zigzag Timeline With Business Icons Powerpoint Slides
This timeline slide design can be used to display yearly business growth. It contains zigzag business roadmap with icons. This timeline template can be used in presentations where you need to display a roadmap or it may be used for business target analysis.
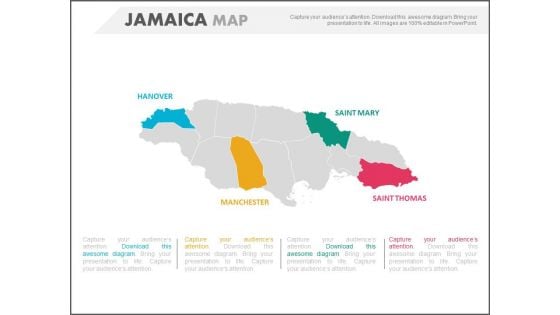
Country Jamaica Map With Four States Highlighted Powerpoint Slides
This PowerPoint template displays graphics of country Jamaica map with four states highlighted. This PPT template can be used in business presentations to depict economic growth of highlighted states. This slide can also be used by school students for educational projects.
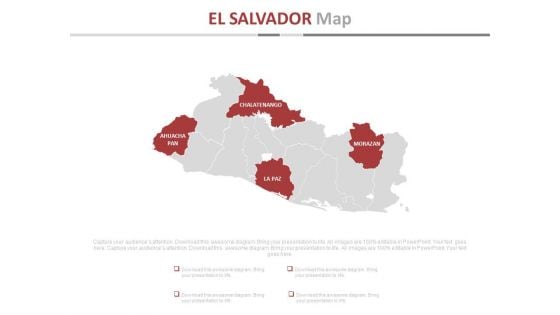
El Salvador Map Diagram With Four States Highlight Powerpoint Slides
This PowerPoint template displays graphics of country Salvador map with four states highlighted. This PPT template can be used in business presentations to depict economic growth of highlighted states. This slide can also be used by school students for educational projects.
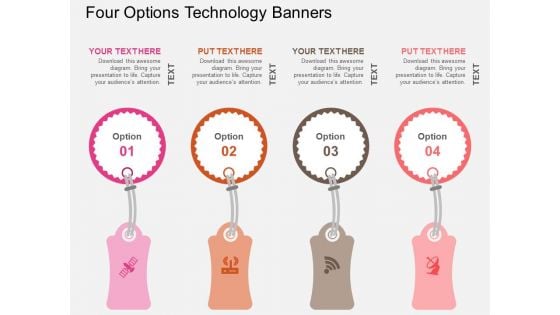
Four Options Technology Banners Powerpoint Templates
This business slide contains circular infographic. This diagram is suitable to present team plan for financial growth. Download this diagram for schematic representation of any information. Visual effect of this slide helps in maintaining the flow of the discussion and provides more clarity to the subject.
Six Steps Timeline For Business Research And Analysis Powerpoint Slides
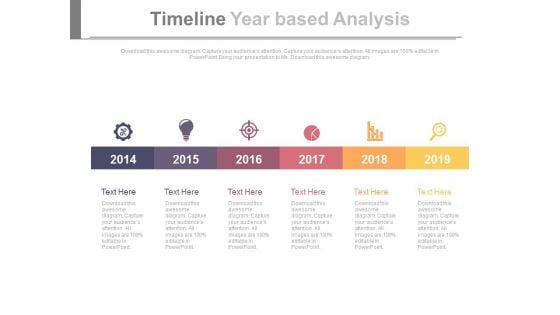
This timeline slide design can be used to display yearly business growth. It contains linear steps with icons. This timeline template can be used in presentations where you need to display research and analysis or it may be used for business target analysis.
Linear Timeline Year Based Infographic Powerpoint Slides
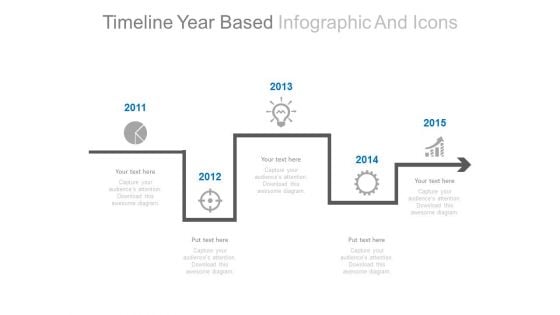
This timeline slide design can be used to display yearly business growth. It contains zigzag business roadmap with icons. This timeline template can be used in presentations where you need to display a roadmap or it may be used for business target analysis.
Linear Year Based Tags With Icons Powerpoint Slides
This timeline slide design can be used for business milestones, growth and progress. It contains linear years tags with icons. This timeline template can be used in presentations where you need to display future planning or it may be used for financial target analysis.

Timeline Infographic Chart For Business Agenda Powerpoint Slides
This timeline slide design can be used to display yearly business growth. It contains zigzag business roadmap with icons. This timeline template can be used in presentations where you need to display a roadmap or it may be used for business target analysis.
Six Staged Pie Chart And Icons Diagram Powerpoint Template
Our above PPT slide has been designed with graphics of pie chart and icons. This PowerPoint template is suitable to present strategic management for business growth. Use this business diagram to present your work in a more smart and precise manner.

Developing Marketing Strategies And Plan Example Of Ppt
This is a developing marketing strategies and plan example of ppt. This is a eight stage process. The stages in this process are creating long term growth, developing marketing strategies, capturing marketing insights, connecting with customers, building strong brands, shaping the market offerings, delivering value, communicating value.

Small Business Working Capital Powerpoint Show
This is a small business working capital powerpoint show. This is a one stage process. The stages in this process are purchase equipment, support a new contract, purchase commercial real estate, fund business growth, complete product development, start a new business, purchase, expand your business, finance a new product launch.
Business Capital Network Alliance Powerpoint Show
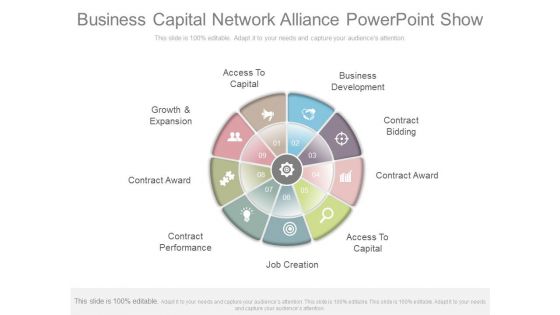
This is a business capital network alliance powerpoint show. This is a nine stage process. The stages in this process are access to capital, growth and expansion, contract award, contract performance, job creation, access to capital, contract award, contract bidding, business development.
Building The Franchise Powerpoint Slides Background
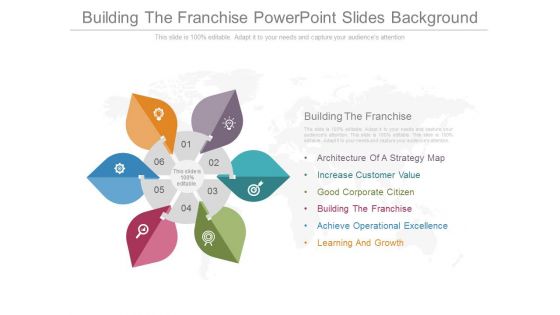
This is a building the franchise powerpoint slides background. This is a six stage process. The stages in this process are architecture of a strategy map, increase customer value, good corporate citizen, building the franchise, achieve operational excellence, learning and growth.
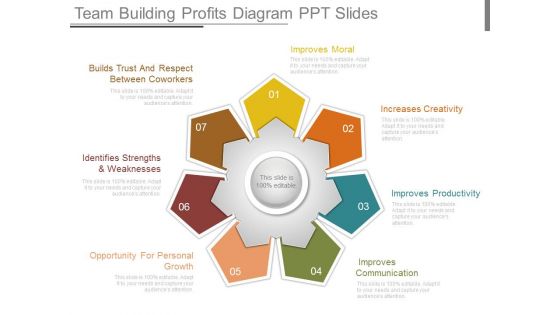
Team Building Profits Diagram Ppt Slides
This is a team building profits diagram ppt slides. This is a seven stage process. The stages in this process are improves moral, increases creativity, improves productivity, improves communication, builds trust and respect between coworkers, identifies strengths and weaknesses, opportunity for personal growth.
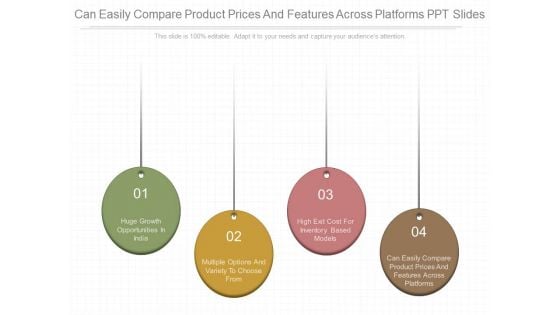
Can Easily Compare Product Prices And Features Across Platforms Ppt Slides
This is a can easily compare product prices and features across platforms ppt slides. This is a four stage process. The stages in this process are huge growth opportunities in india, multiple options and variety to choose from, high exit cost for inventory based models, can easily compare product prices and features across platforms.
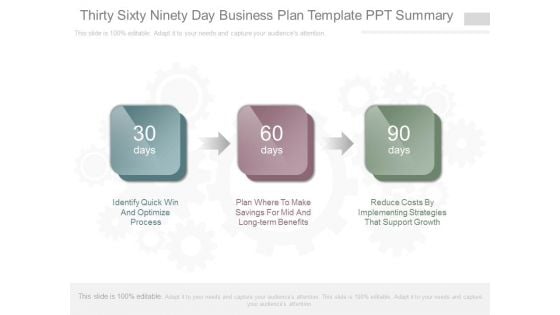
Thirty Sixty Ninety Day Business Plan Template Ppt Summary
This is a thirty sixty ninety day business plan template ppt summary. This is a three stage process. The stages in this process are identify quick wins and optimized process, plan where to make savings for mid and long term benefits, reduce costs by implementing strategies that support growth.
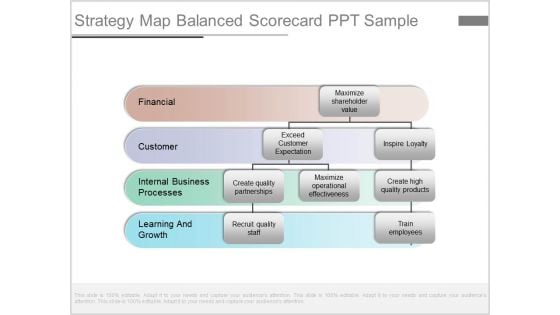
Strategy Map Balanced Scorecard Ppt Sample
This is a strategy map balanced scorecard ppt sample. This is a one stage process. The stages in this process are maximize shareholder value, exceed customer expectation, inspire loyalty, create quality partnerships, maximize operational effectiveness, create high quality products, recruit quality staff, train employees, train employees, financial, customer, internal business processes, learning and growth.
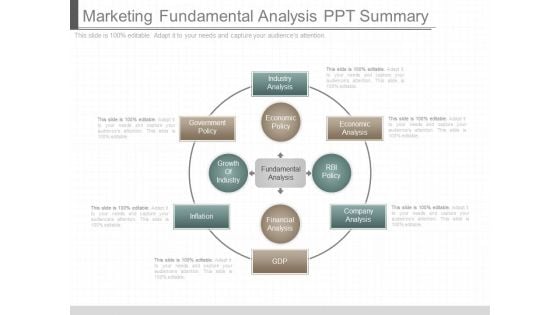
Marketing Fundamental Analysis Ppt Summary
This is a marketing fundamental analysis ppt summary. This is a one stage process. The stages in this process are industry analysis, economic policy, fundamental analysis, financial analysis, gdp, economic analysis, rbi policy, company analysis, government policy, growth of industry, inflation.
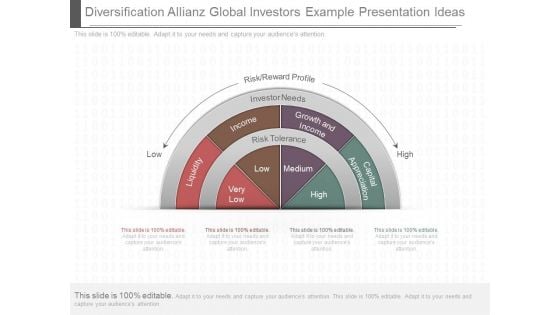
Diversification Allianz Global Investors Example Presentation Ideas
This is a diversification allianz global investors example presentation ideas. This is a four stage process. The stages in this process are risk reward profile, low, high, liquidity, income, growth and income, capital appreciation, risk tolerance, very low, low, medium, high.
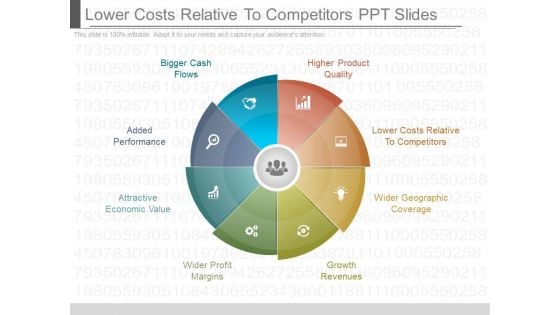
Lower Costs Relative To Competitors Ppt Slides
This is a lower costs relative to competitors ppt slides. This is a eight stage process. The stages in this process are bigger cash flows, added performance, attractive economic value, wider profit margins, growth revenues, wider geographic coverage, lower costs relative to competitors, higher product quality.


 Continue with Email

 Home
Home


