Audience

0814 Stock Photo Dollar On Top Of Books Graph PowerPoint Slide
The above image represent concept of financial growth. Adjust the above image of dollar currency symbol on top of books graph in order to show financial growth. Dazzle the audience with your thoughts.
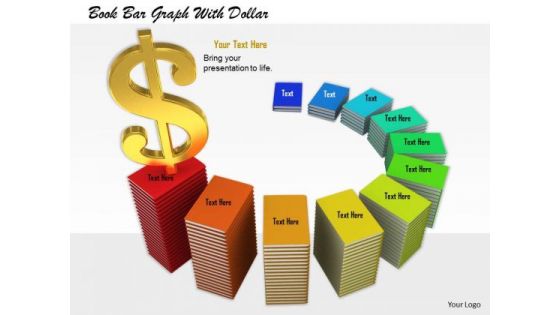
0814 Stock Photo Growth Graph Of Books With Dollar Symbol PowerPoint Slide
The above image represent concept of financial growth. Adjust the above image of dollar currency symbol on top of books graph in order to show financial growth. Dazzle the audience with your thoughts.

Stock Photo Chess King In Golden Color PowerPoint Slide
This image shows graphic of chess king. Our professional image will link your ideas into a chain of thought. Increase the strength of your overall concept. Audience also understands the concepts easily when you show clear picture of the topic.
Stock Photo Graphics Of Red Shiny Bulb PowerPoint Slide
Define the concept of business idea with this unique image. This image is designed with graphics of red shiny bulb. Make a quality presentation for your audience with this professional image.

Stock Photo 3d Alarm Clock With Time Up Text PowerPoint Slide
This image has a design of 3d alarm clock with times up text. This professional image helps you to describe concept of time management. Deliver amazing presentations to mesmerize your audience using this image.
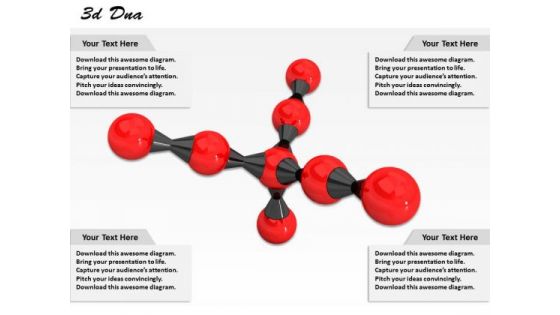
Stock Photo 3d Molecular Design With Red Molecules PowerPoint Slide
Captivate the attention of your audience with the help of professionally designed theme molecular structure. This slide displays graphics of molecules attached to each other forming a structure. This image gives a nice look to your presentations.
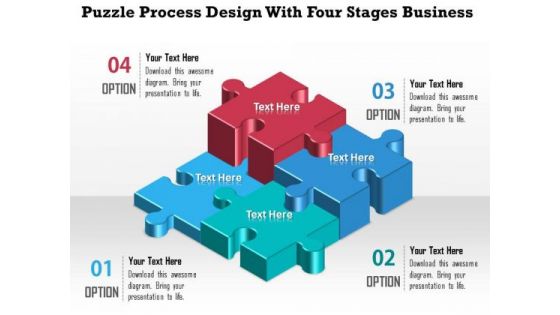
Consulting Slides Puzzle Process Design With Four Stages Business Presentation
This interconnected puzzle pieces diagram make your audience understands essential elements of your overall strategy and also shows an organized view of business steps and processes. This diagram will enhance the quality of your presentations.

Stock Photo Heart And Brain On Scale PowerPoint Slide
Our unique image is designed with 3d models of heart and human brain on balancing scale. This image clearly defines balance between logic and emotion. Special effects of this image will surely interest the audience

Stock Photo Billboard With Roads For Marketing PowerPoint Slide
Make your presentations and more interactive with this image of billboard with roads. You can easily impress your audience and add a special appeal to your presentations with this image slide.
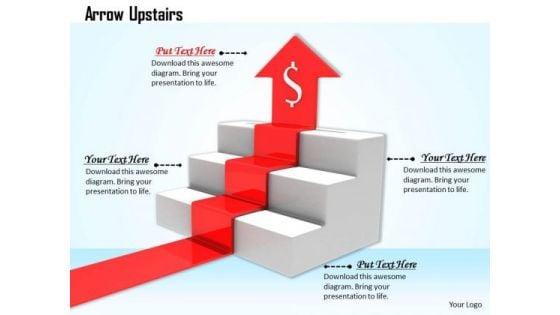
Stock Photo Red Arrow Moving Upwards In Stairs PowerPoint Slide
This image has been designed with red arrow moving upward on stairs with dollar symbol. This Image clearly relates to concept of financial growth. Use our image to drive the point to your audience and constantly attract their attention.

Stock Photo Red Growth Arrow With Percentage Symbol PowerPoint Slide
This image has been designed with red growth arrow with percentage symbol. This Image clearly relates to concept of financial growth. Use our image to drive the point to your audience and constantly attract their attention.
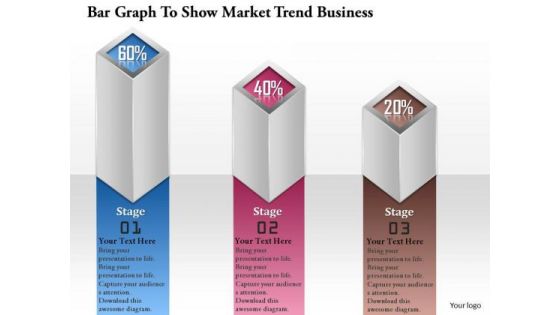
Consulting Slides Bar Graph To Show Market Trend Business Presentation
This bar graph can be very useful in presentations where you need to market trend. This can be used as a visualization tool because the audience can get a better view about what you want to show.

Stock Photo Back To School Books With Alarm Clock PowerPoint Slide
This image has a design of 3d alarm clock with back to school books. Use this this professional image to make presentations on back to school. Deliver amazing presentations to mesmerize your audience using this image.

Stock Photo Back To School Theme With Books And Alarm Clock PowerPoint Slide
This image has a design of 3d alarm clock with back to school books. Use this this professional image to make presentations on back to school. Deliver amazing presentations to mesmerize your audience using this image.

Stock Photo Blue Plug Leading White Plugs PowerPoint Slide
This is an innovative image containg graphics of blue plug leading white plugs. Use this image for teamwork and leadership related topics.. Deliver amazing presentations to mesmerize your audience using this image.
Stock Photo Molecule 3d Icon PowerPoint Slide
Captivate the attention of your audience with the help of professionally designed theme molecular structure. This slide displays graphics of molecules attached to each other forming a structure. This image gives a nice look to your presentations.

Stock Photo Molecule Structure PowerPoint Slide
Captivate the attention of your audience with the help of professionally designed image of molecular structure. Use this professional image of yellow and black molecules to make medical presentations.
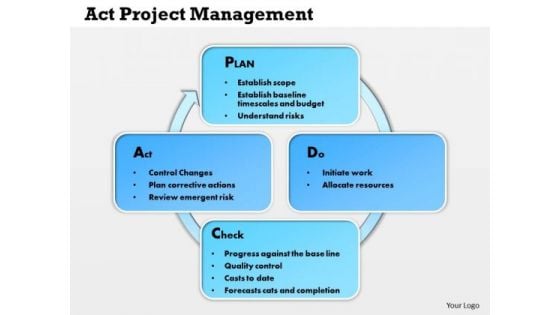
Business Framework Act Project Management PowerPoint Presentation
This act project diagram make your audience understands essential elements of your overall strategy and also shows an organized view of business processes. This unique diagram makes your presentations more professional.
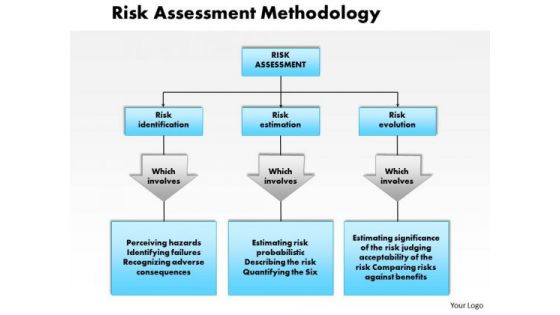
Business Framework Risk Assessment Methodology PowerPoint Presentation
Use this diagram to explain the methods of risk assessment. This diagram is very useful in risk management topics or risk analysis. This diagram will help you catch your audience
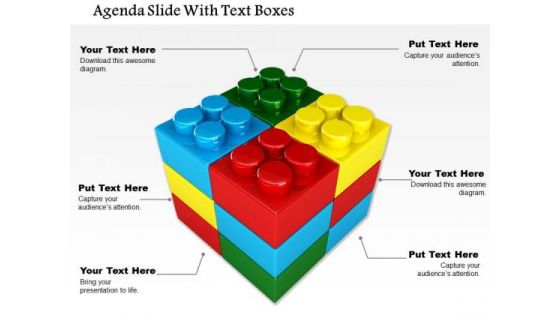
Business Diagram Agenda Slide With Text Boxes PowerPoint Ppt Presentation
Captivate the attention of your audience with the help of professionally designed diagram of business agenda. This diagram contains graphics of colorful Lego blocks. Use this professional and customized business diagram in your PowerPoint presentations.
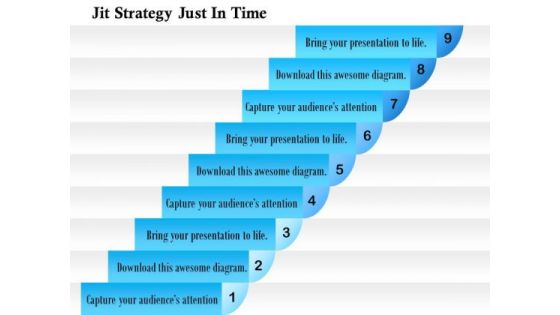
Business Diagram Jit Strategy Just In Time PowerPoint Ppt Presentation
Captivate the attention of your audience with the help of professionally designed diagram of just in time strategy. This diagram contains stairs diagram depicting nine stages of JIT strategy. Use this professional and customized business diagram in your PowerPoint presentations.
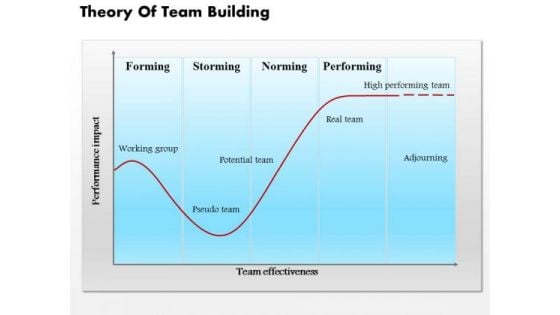
Business Diagram Theory Of Team Building PowerPoint Ppt Presentation
This slide depicts theory of tem building. It contains graph of performance impact and team effectiveness. It reflects steps of team building forming, storming, norming and performing. Download this awesome diagram to capture your audience
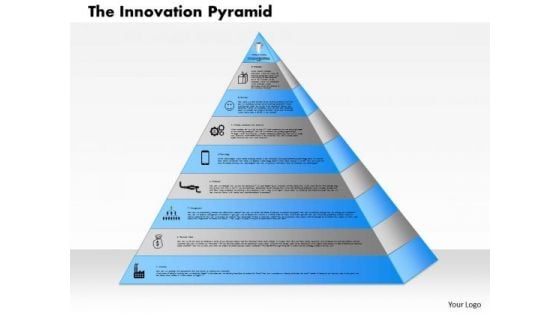
Business Framework The Innovation Pyramid PowerPoint Presentation
Captivate the attention of your audience with the help of professionally designed diagram of innovation pyramid. This diagram contains graphics of pyramid with innovative icons. Use this professional and customized business diagram in your PowerPoint presentations.

Business Diagram Arrow Going Up Showing 2015 Target Presentation Template
This slide is an excellent backdrop for you to enlighten your audience on the process you have gone through and the vision you have for the future. It helps to focus the thoughts of your listeners.
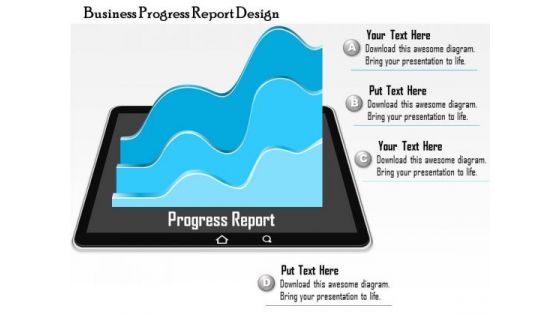
Business Diagram Business Progress Report Design Presentation Template
Come forth with the plans you have so carefully laid out. Use this business consulting diagram to inject values into your group and see them bond to achieve success. Excite your audience with the brilliance of your thoughts
Business Diagram 3d World Globe With Location Icon And Pins Presentation Template
Display the exact location of any place in your business presentations with this exclusive power point template. We have used graphic of 3d world globe and location icons with pins. Get attention of your audience with this exclusive image.

Business Diagram Business Bar Graph For Data Analysis Presentation Template
This business slide displays pie charts with percentage ratios. This diagram is a data visualization tool that gives you a simple way to present statistical information. This slide helps your audience examines and interprets the data you present.
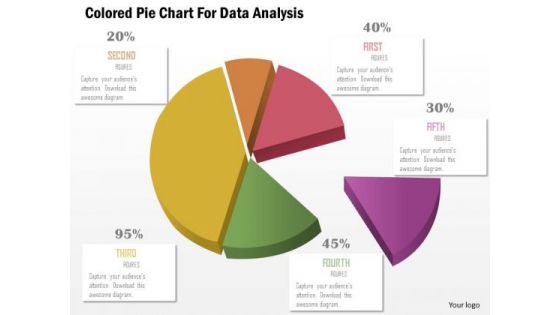
Business Diagram Colored Pie Chart For Data Analysis Presentation Template
This business slide displays pie chart. This diagram is a data visualization tool that gives you a simple way to present statistical information. This slide helps your audience examine and interpret the data you present.
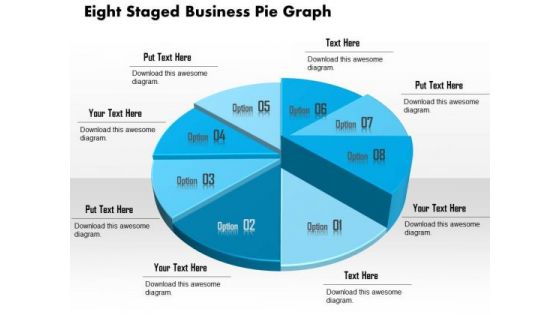
Business Diagram Eight Staged Business Pie Graph Presentation Template
This business slide displays eight staged pie chart. This diagram is a data visualization tool that gives you a simple way to present statistical information. This slide helps your audience examine and interpret the data you present.
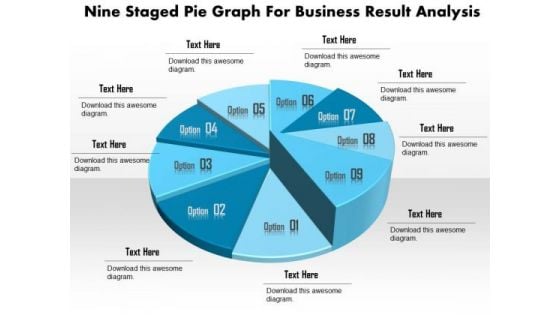
Business Diagram Nine Staged Pie Graph For Business Result Analysis Presentation Template
This business slide displays nine staged pie chart. This diagram is a data visualization tool that gives you a simple way to present statistical information. This slide helps your audience examine and interpret the data you present.
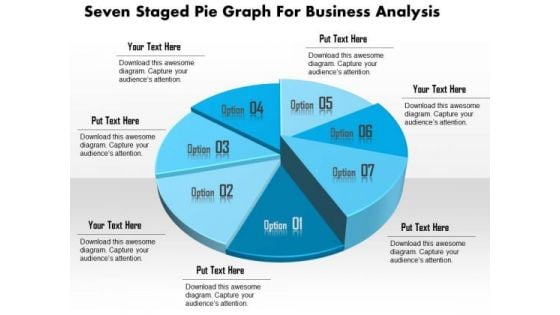
Business Diagram Seven Staged Pie Graph For Business Analysis Presentation Template
This business slide displays seven staged pie chart. This diagram is a data visualization tool that gives you a simple way to present statistical information. This slide helps your audience examine and interpret the data you present.
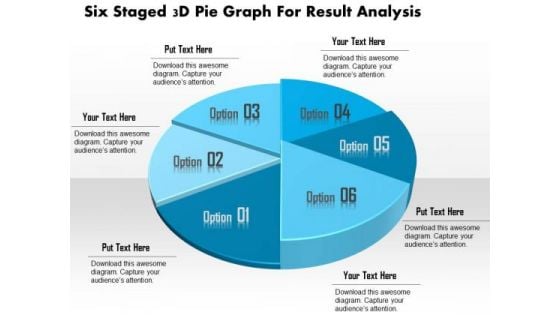
Business Diagram Six Staged 3d Pie Graph For Result Analysis Presentation Template
This business slide displays six staged pie chart. This diagram is a data visualization tool that gives you a simple way to present statistical information. This slide helps your audience examine and interpret the data you present.
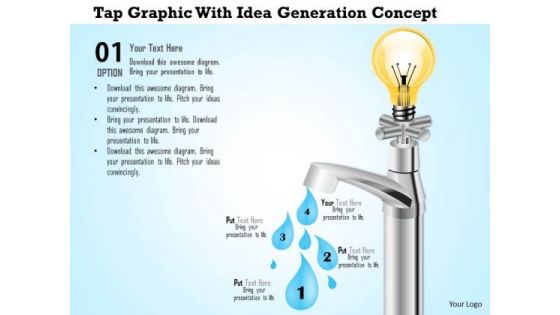
Business Diagram Tap Graphic With Idea Generation Concept Presentation Template
Graphic of water tap has been used to design this business diagram. It contains water tap with light bulb depicting ideas to save water. This professional diagram helps in clearly conveying your message to clients and audience

Business Diagram Hands With Water Drop For Water Protection Presentation Template
Graphic of hands with water drop used to design this business diagram. It contains water drop failing in hands depicting ideas to save water. This professional diagram helps in clearly conveying your message to clients and audience
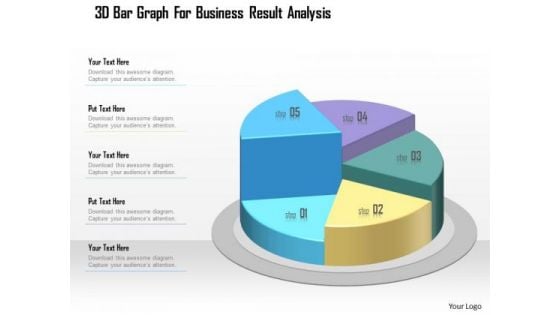
Business Diagram 3d Bar Graph For Business Result Analysis Presentation Template
This business slide displays five staged pie chart. This diagram is a data visualization tool that gives you a simple way to present statistical information. This slide helps your audience examine and interpret the data you present.
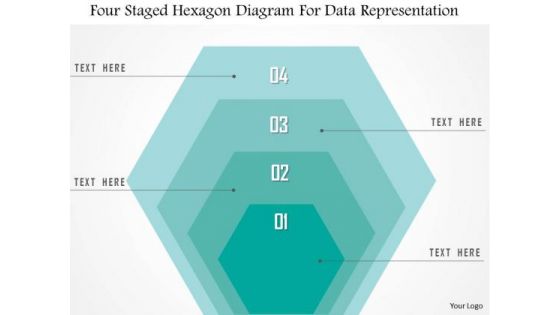
Business Diagram Four Staged Hexagon Diagram For Data Representation Presentation Template
This pre-designed and appealing process and workflow graphics for Microsoft PowerPoint offer an optimized possibility to illustrate your business strategy. Your audience will easily understand all key benefits. This Diagram is editable and can be easily adjusted.
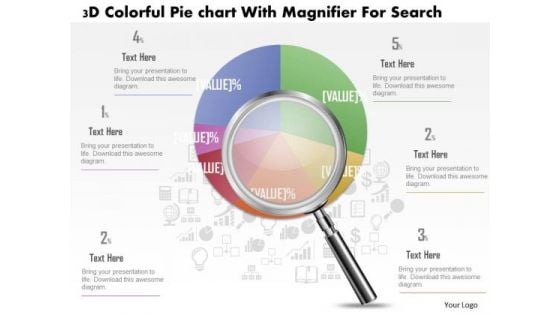
Business Diagram 3d Colorful Pie Graph With Magnifier Data Search PowerPoint Slide
This business slide displays 3d colorful pie graph with magnifier. This diagram is a data visualization tool that gives you a simple way to present statistical information. This slide helps your audience examine and interpret the data you present.
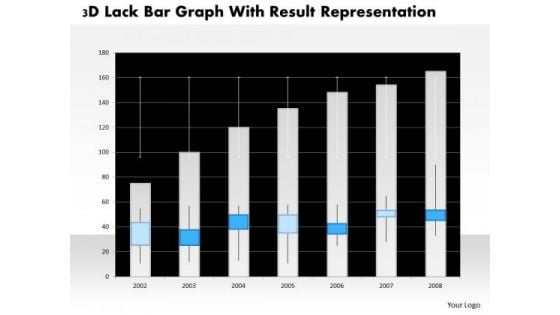
Business Diagram 3d Lack Bar Graph With Result Representation PowerPoint Slide
This business diagram has graphic of 3d lack bar graph. This diagram is a data visualization tool that gives you a simple way to present statistical information. This slide helps your audience examine and interpret the data you present.
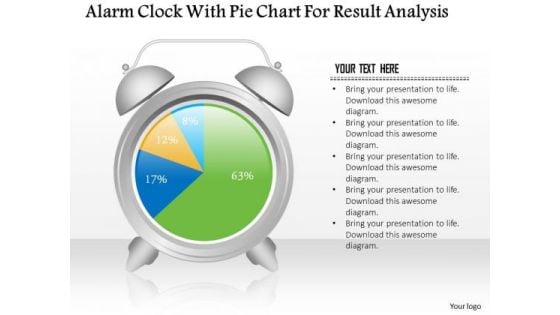
Business Diagram Alarm Clock With Pie Chart For Result Analysis PowerPoint Slide
This business slide displays alarm clock with pie chart. This diagram is a data visualization tool that gives you a simple way to present statistical information. This slide helps your audience examine and interpret the data you present.
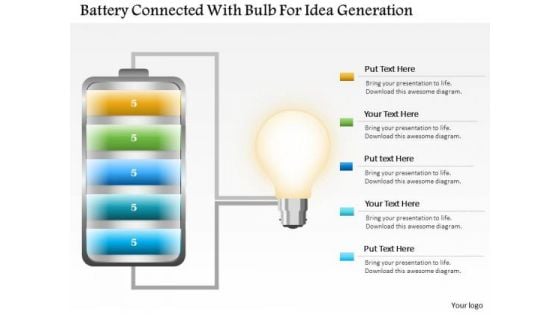
Business Diagram Battery Connected With Bulb For Idea Generation PowerPoint Slide
This business slide displays battery icon connected with bulb. This diagram is a data visualization tool that gives you a simple way to present statistical information. This slide helps your audience examine and interpret the data you present.

Business Diagram Data Driven Pie Chart Inside The Magnifier PowerPoint Slide
This business slide displays 3d colorful pie graph with magnifier. This diagram is a data visualization tool that gives you a simple way to present statistical information. This slide helps your audience examine and interpret the data you present.
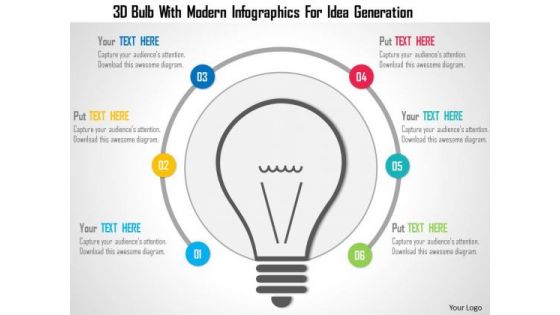
Business Diagram 3d Bulb With Modern Infographics For Idea Generation Presentation Template
Our above slide displays 3d bulb with modern infographic. Download our above diagram to express information in a visual way. This diagram offers a way for your audience to visually conceptualize the process.
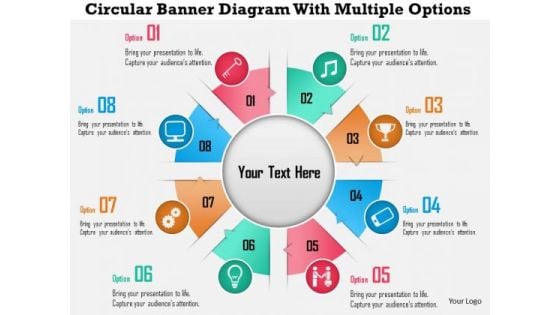
Business Diagram Circular Banner Diagram With Multiple Options Presentation Template
Graphic of circular banner diagram has been used to design this business diagram. Download our above diagram to express information in a visual way. This diagram offers a way for your audience to visually conceptualize the process.
Business Diagram Colorful Pyramid Design With Multiple Icons Presentation Template
This business diagram has been designed with graphic of colorful pyramid. Download this diagram to analyze the key points. This diagram offers a way for your audience to visually conceptualize the process.
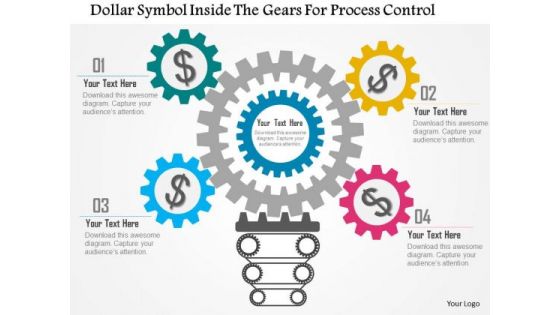
Business Diagram Dollar Symbol Inside The Gears For Process Control Presentation Template
This business diagram has been designed with graphic of dollar symbol and gears. Download this diagram to analyze the key points. This diagram offers a way for your audience to visually conceptualize the process.
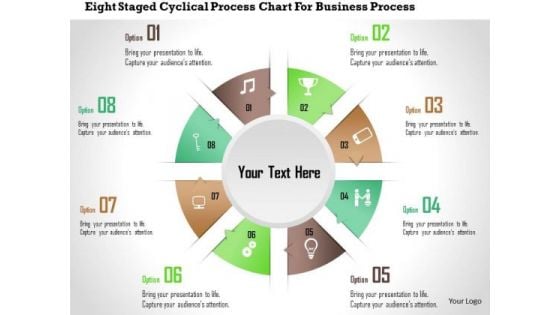
Business Diagram Eight Staged Cyclical Process Chart For Business Process Presentation Template
Our above slide displays eight staged cyclical process chart. It helps to depict workflow or a process. This diagram offers a way for your audience to visually conceptualize the process.
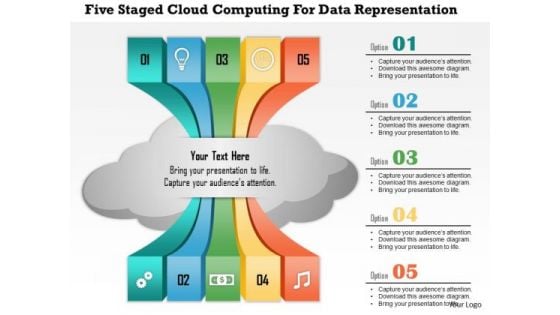
Business Diagram Five Staged Cloud Computing For Data Representation Presentation Template
Our above slide displays five steps with cloud icon. Download our above diagram to express information in a visual way. This diagram offers a way for your audience to visually conceptualize the process.
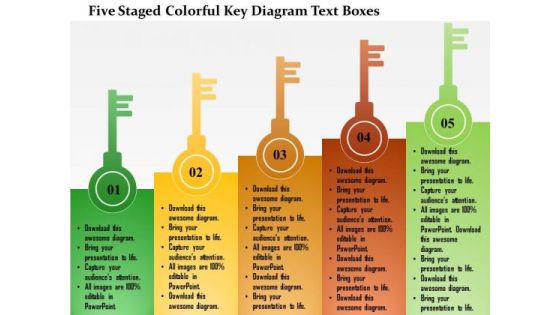
Business Diagram Five Staged Colorful Key Diagram Text Boxes Presentation Template
This business diagram has been designed with graphic of five staged keys and text boxes. Download this diagram to analyze the key points. This diagram offers a way for your audience to visually conceptualize the process.
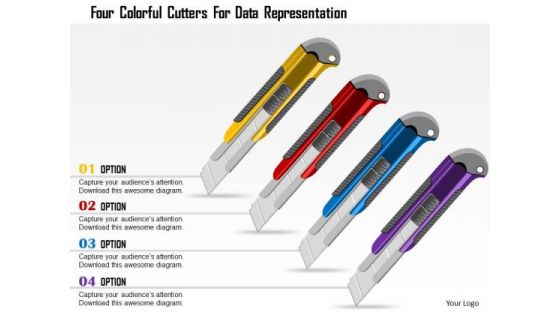
Business Diagram Four Colorful Cutters For Data Representation Presentation Template
This diagram is designed with four colorful cutters style text boxes. Download this diagram to analyze the key points. This diagram offers a way for your audience to visually conceptualize the process.
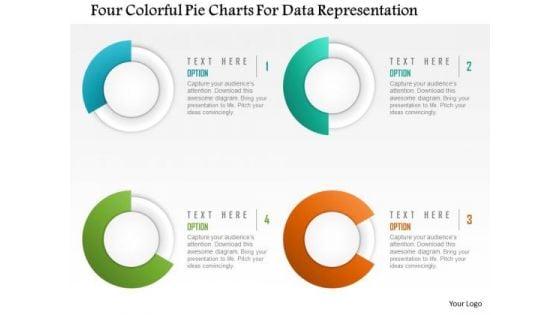
Business Diagram Four Colorful Pie Charts For Data Representation Presentation Template
This diagram is designed with four colorful pie charts. Download this diagram to analyze the key points. This diagram offers a way for your audience to visually conceptualize the process.
Business Diagram Infographics With Multiple Icons For Data Representation Presentation Template
This business diagram has been designed with graphic of multiple icons info graphics. Download this diagram to analyze the key points. This diagram offers a way for your audience to visually conceptualize the process.

Business Diagram Smiley With Check Box And Pencil For Data Representation Presentation Template
This business diagram has been designed with smiley with check box and pencil. Download this diagram to analyze the key points. This diagram offers a way for your audience to visually conceptualize the process.
Business Diagram Studio Light With Multiple Icons Of Process Presentation Template
This business diagram has been designed with studio light with multiple icons. Download this diagram to analyze the key points. This diagram offers a way for your audience to visually conceptualize the process.

Business Diagram Three Colorful Bulbs For Idea Generation Presentation Template
This business diagram has been designed with graphic of three colorful bulbs. Download this diagram to analyze the key points. This diagram offers a way for your audience to visually conceptualize the process.

Business Diagram Three Colorful Bulbs With Socket For Idea Generation Presentation Template
This business diagram has been designed with graphic of three colorful bulbs with socket. Download this diagram to analyze the key points. This diagram offers a way for your audience to visually conceptualize the process.
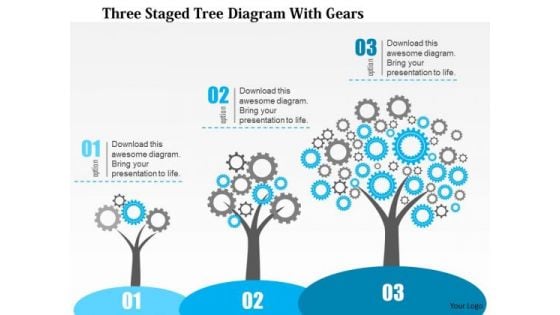
Business Diagram Three Staged Tree Diagram With Gears Presentation Template
This business diagram has been designed with graphic of three staged tree diagram with gears. Download this diagram to analyze the key points. This diagram offers a way for your audience to visually conceptualize the process.
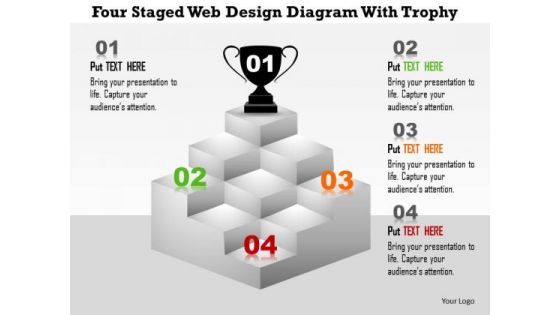
Business Diagram Four Staged Web Design Diagram With Trophy Presentation Template
This business diagram has been designed with graphic of four staged web design diagram with trophy. Download this diagram to depict success and victory concepts. This diagram offers a way for your audience to visually conceptualize the process.
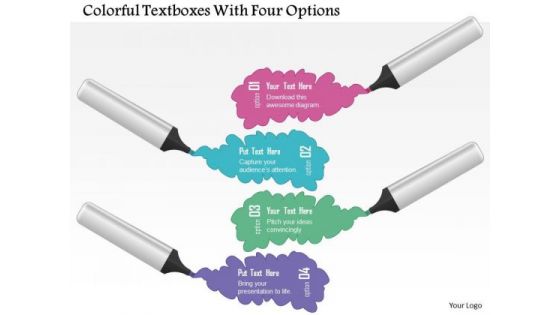
Business Diagram Colorful Textboxes With Four Options Presentation Template
Our above diagram has been designed with graphics of colorful text boxes with pencils. It helps to depict four stages or steps of a process. This diagram offers a way for your audience to visually conceptualize the process.
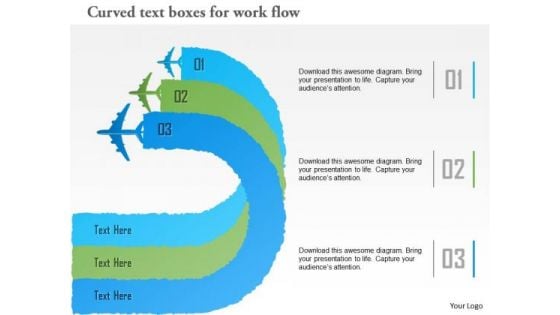
Business Diagram Curved Text Boxes For Work Flow Presentation Template
Our above diagram has been designed with graphics of curved text boxes. It helps to depict workflow or a process. This diagram offers a way for your audience to visually conceptualize the process.
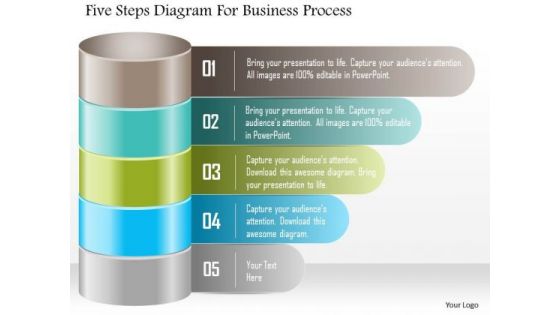
Business Diagram Five Steps Diagram For Business Process Presentation Template
Our above slide displays five steps diagram for business process. It helps to depict workflow or a process. This diagram offers a way for your audience to visually conceptualize the process.


 Continue with Email

 Home
Home


