Availability Icon
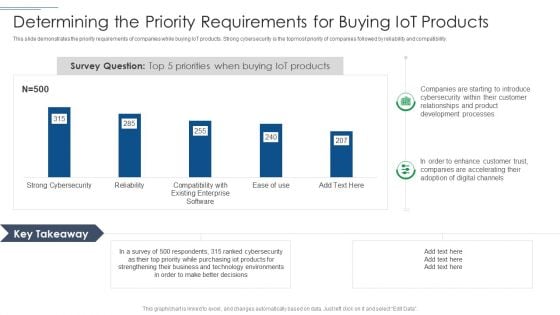
IT Security Risk Management Approach Introduction Determining The Priority Requirements Diagrams PDF
This slide demonstrates the priority requirements of companies while buying IoT products. Strong cybersecurity is the topmost priority of companies followed by reliability and compatibility. Deliver an awe inspiring pitch with this creative IT Security Risk Management Approach Introduction Determining The Priority Requirements Diagrams PDF bundle. Topics like Development Processes, Technology Environments, Purchasing Iot Products can be discussed with this completely editable template. It is available for immediate download depending on the needs and requirements of the user.
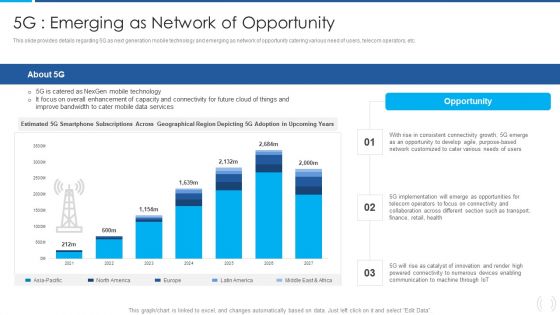
Proactive Method For 5G Deployment By Telecom Companies 5G Emerging As Network Of Opportunity Diagrams PDF
This slide provides details regarding 5G as next generation mobile technology and emerging as network of opportunity catering various need of users, telecom operators, etc. Deliver an awe inspiring pitch with this creative Proactive Method For 5G Deployment By Telecom Companies 5G Emerging As Network Of Opportunity Diagrams PDF bundle. Topics like Consistent Connectivity, Overall Enhancement, Across Geographical can be discussed with this completely editable template. It is available for immediate download depending on the needs and requirements of the user.
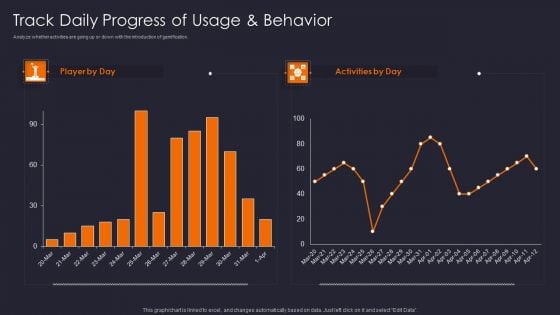
Implementing Gamification Marketing Plan To Increase Conversions Track Daily Progress Of Usage Diagrams PDF
Analyze whether activities are going up or down with the introduction of gamification.Deliver an awe inspiring pitch with this creative Implementing Gamification Marketing Plan To Increase Conversions Track Daily Progress Of Usage Diagrams PDF bundle. Topics like Track Daily, Progress Usage, Behavior can be discussed with this completely editable template. It is available for immediate download depending on the needs and requirements of the user.

Tour Agency Business Profile Operating Profit 2018 To 2022 Diagrams PDF
This slide covers the operating profit of travel agency for last five years from 2018 to 2022 which shows increase in operating profits year after year due to more efficient use of resources.Deliver an awe inspiring pitch with this creative Tour Agency Business Profile Operating Profit 2018 To 2022 Diagrams PDF bundle. Topics like Operating Profit, Primary Reason, Improved Operating can be discussed with this completely editable template. It is available for immediate download depending on the needs and requirements of the user.
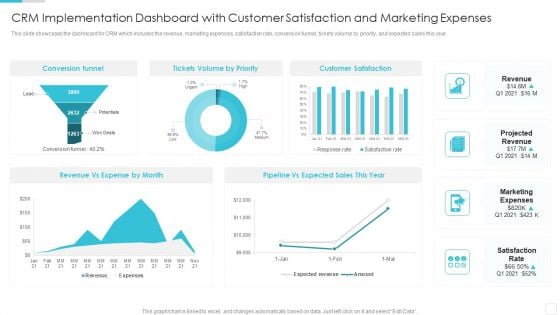
Sales CRM Cloud Solutions Deployment CRM Implementation Dashboard With Customer Diagrams PDF
This slide showcases the dashboard for CRM which includes the revenue, marketing expenses, satisfaction rate, conversion funnel, tickets volume by priority, and expected sales this year.Deliver an awe inspiring pitch with this creative Sales CRM Cloud Solutions Deployment CRM Implementation Dashboard With Customer Diagrams PDF bundle. Topics like Conversion Funnel, Customer Satisfaction, Expected Sales can be discussed with this completely editable template. It is available for immediate download depending on the needs and requirements of the user.
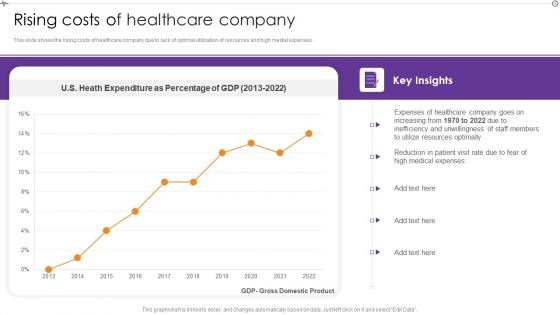
Advances In Healthcare Management System Rising Costs Of Healthcare Company Diagrams PDF
This slide shows the rising costs of healthcare company due to lack of optimal utilization of resources and high medial expenses. Deliver an awe inspiring pitch with this creative Advances In Healthcare Management System Rising Costs Of Healthcare Company Diagrams PDF bundle. Topics like Resources Optimally, Patient Visit Rate, Medical Expenses can be discussed with this completely editable template. It is available for immediate download depending on the needs and requirements of the user.
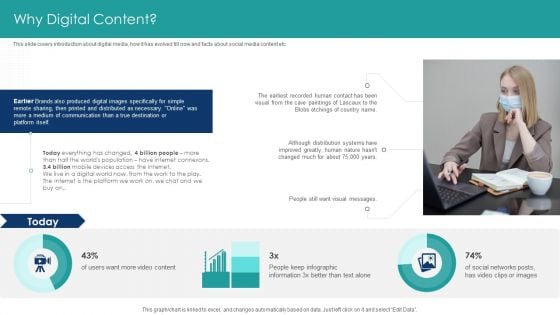
How To Develop Branding And Storytelling With DAM Why Digital Content Diagrams PDF
This slide covers introduction about digital media, how it has evolved till now and facts about social media content etc. Deliver an awe inspiring pitch with this creative How To Develop Branding And Storytelling With DAM Why Digital Content Diagrams PDF bundle. Topics like Produced Digital, Printed And Distributed, Medium Of Communication can be discussed with this completely editable template. It is available for immediate download depending on the needs and requirements of the user.
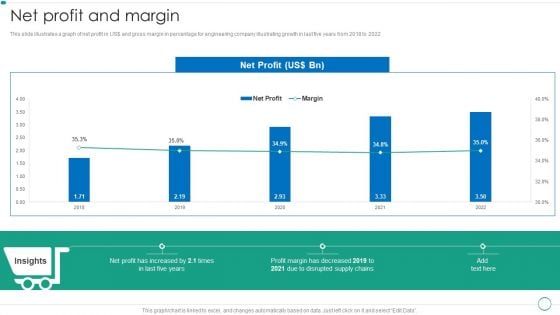
Real Estate Construction And Engineering Company Profile Net Profit And Margin Diagrams PDF
This slide illustrates a graph of net profit in US and gross margin in percentage for engineering company illustrating growth in last five years from 2018 to 2022.Deliver an awe inspiring pitch with this creative Real Estate Construction And Engineering Company Profile Net Profit And Margin Diagrams PDF bundle. Topics like Disrupted Supply, Profit Margin, Increased can be discussed with this completely editable template. It is available for immediate download depending on the needs and requirements of the user.
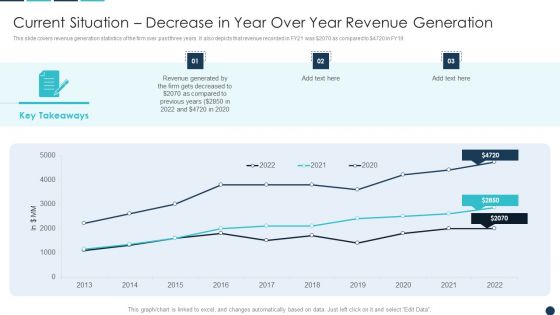
Current Situation Decrease In Year Over Year Revenue Generation Diagrams PDF
This slide covers revenue generation statistics of the firm over past three years. It also depicts that revenue recorded in FY21 was dollar2070 as compared to dollar4720 in FY19.Deliver an awe inspiring pitch with this creative Current Situation Decrease In Year Over Year Revenue Generation Diagrams PDF bundle. Topics like Revenue Generated, Gets Decreased, Key Takeaways can be discussed with this completely editable template. It is available for immediate download depending on the needs and requirements of the user.

Top Cyber Risks Faced By The Real Estate Company Diagrams PDF
The following slide exhibits four cyber risks which are faced by the real estate organization. It provides key information about the ransomware, phishing, web-based attack and email fraud attack. Deliver an awe inspiring pitch with this creative Top Cyber Risks Faced By The Real Estate Company Diagrams PDF bundle. Topics like Ransomware Business Compromise, Businesses Currently can be discussed with this completely editable template. It is available for immediate download depending on the needs and requirements of the user.
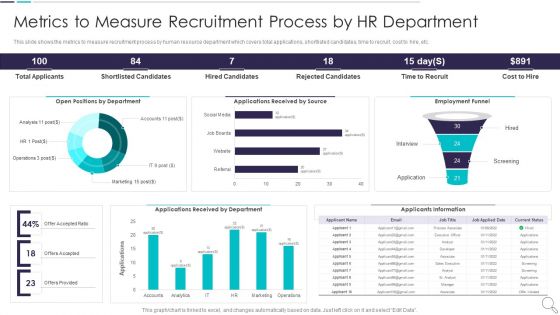
Strategies To Enhance Recruitment Metrics To Measure Recruitment Process By Hr Department Diagrams PDF
This slide shows the metrics to measure recruitment process by human resource department which covers total applications, shortlisted candidates, time to recruit, cost to hire, etc. Deliver an awe inspiring pitch with this creative Strategies To Enhance Recruitment Metrics To Measure Recruitment Process By Hr Department Diagrams PDF bundle. Topics like Total Applicants, Shortlisted Candidates, Hired Candidates can be discussed with this completely editable template. It is available for immediate download depending on the needs and requirements of the user.
Computer Simulation Human Thinking Tracking Essential Virtual Agents Activities Dashboard Diagrams PDF
This slide provides information regarding virtual agents essential activities dashboard in terms of daily number of new conversation, unique users weekly conversations by channel, etc. Deliver an awe inspiring pitch with this creative Computer Simulation Human Thinking Tracking Essential Virtual Agents Activities Dashboard Diagrams PDF bundle. Topics like Unique Users, Weekly Conversations Channel, Weekly Conversations Topic can be discussed with this completely editable template. It is available for immediate download depending on the needs and requirements of the user.
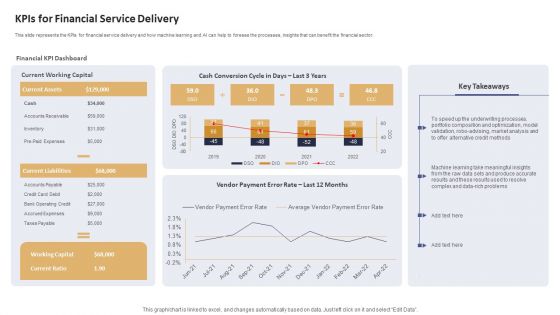
Data Processing Services Delivery Kpis For Financial Service Delivery Diagrams PDF
This slide represents the KPIs for financial service delivery and how machine learning and AI can help to foresee the processes, insights that can benefit the financial sector. Deliver an awe inspiring pitch with this creative Data Processing Services Delivery Kpis For Financial Service Delivery Diagrams PDF bundle. Topics like Financial KPI Dashboard, Current Working Capital, Cash Conversion can be discussed with this completely editable template. It is available for immediate download depending on the needs and requirements of the user.
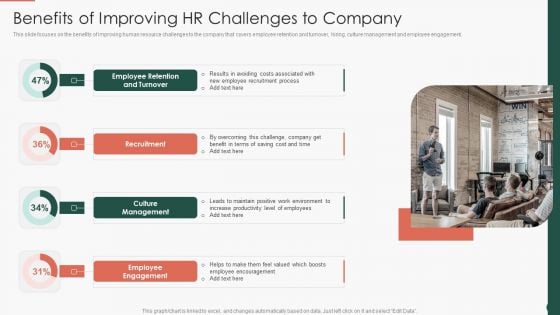
Developing HR Process Flow Benefits Of Improving HR Challenges To Company Diagrams PDF
This slide focuses on the benefits of improving human resource challenges to the company that covers employee retention and turnover, hiring, culture management and employee engagement.Deliver an awe inspiring pitch with this creative Developing HR Process Flow Benefits Of Improving HR Challenges To Company Diagrams PDF bundle. Topics like Recruitment Culture, Management Employee, Engagement can be discussed with this completely editable template. It is available for immediate download depending on the needs and requirements of the user.
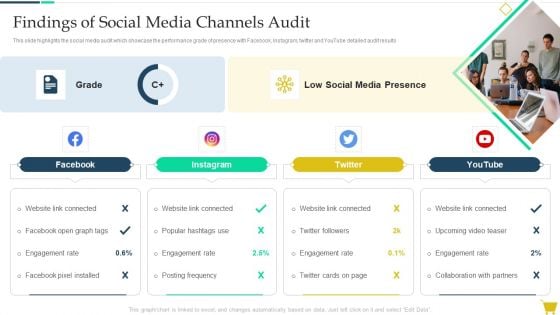
Complete Online Marketing Audit Guide Findings Of Social Media Channels Audit Diagrams PDF
This slide highlights the social media audit which showcase the performance grade of presence with Facebook, Instagram, twitter and YouTube detailed audit results, Deliver an awe inspiring pitch with this creative Complete Online Marketing Audit Guide Findings Of Social Media Channels Audit Diagrams PDF bundle. Topics like Engagement Rate, Social Media Presence can be discussed with this completely editable template. It is available for immediate download depending on the needs and requirements of the user.
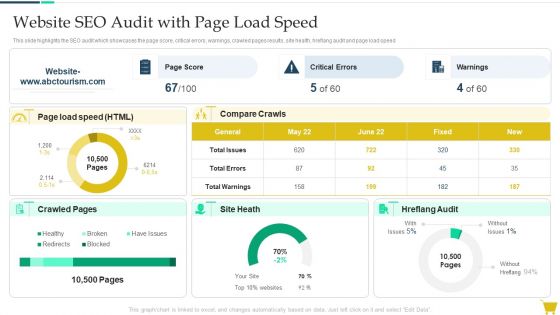
Complete Online Marketing Audit Guide Website Seo Audit With Page Load Speed Diagrams PDF
This slide highlights the SEO audit which showcases the page score, critical errors, warnings, crawled pages results, site health, hreflang audit and page load speed. Deliver an awe inspiring pitch with this creative Complete Online Marketing Audit Guide Website Seo Audit With Page Load Speed Diagrams PDF bundle. Topics like Website SEO Audit can be discussed with this completely editable template. It is available for immediate download depending on the needs and requirements of the user.
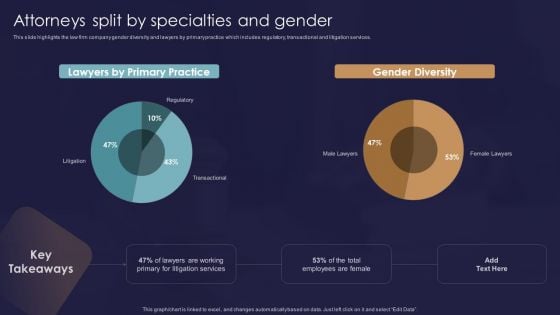
Legal And Law Assistance LLP Business Attorneys Split By Specialties And Gender Diagrams PDF
This slide highlights the law firm company gender diversity and lawyers by primary practice which includes regulatory, transactional and litigation services. Deliver an awe inspiring pitch with this creative Legal And Law Assistance LLP Business Attorneys Split By Specialties And Gender Diagrams PDF bundle. Topics like Primary Practice, Gender Diversity, Transactional can be discussed with this completely editable template. It is available for immediate download depending on the needs and requirements of the user.
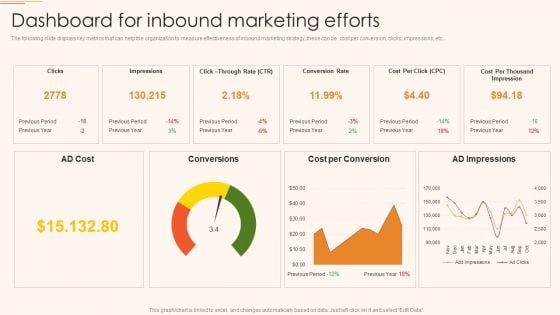
B2C And B2B Business Promotion Strategy Dashboard For Inbound Marketing Efforts Diagrams PDF
The following slide displays key metrics that can help the organization to measure effectiveness of inbound marketing strategy, these can be cost per conversion, clicks, impressions, etc. Deliver an awe inspiring pitch with this creative B2C And B2B Business Promotion Strategy Dashboard For Inbound Marketing Efforts Diagrams PDF bundle. Topics like Conversion Rate, Cost per Conversion, AD Impressions can be discussed with this completely editable template. It is available for immediate download depending on the needs and requirements of the user.
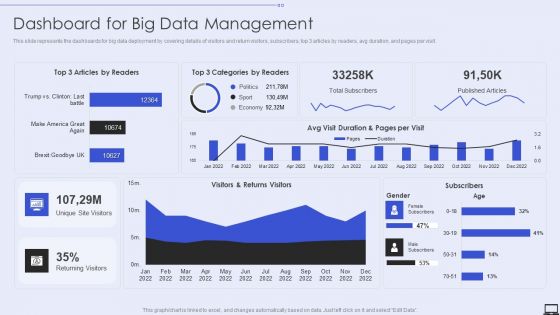
Dashboard For Big Data Management Ppt PowerPoint Presentation File Diagrams PDF
This slide represents the dashboards for big data deployment by covering details of visitors and return visitors, subscribers, top 3 articles by readers, avg duration, and pages per visit. Deliver an awe inspiring pitch with this creative Dashboard For Big Data Management Ppt PowerPoint Presentation File Diagrams PDF bundle. Topics like Dashboard, Big Data Management can be discussed with this completely editable template. It is available for immediate download depending on the needs and requirements of the user.
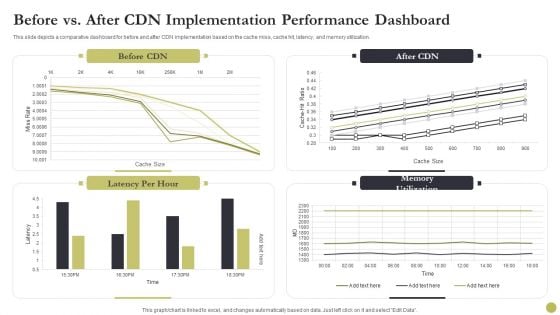
Content Delivery Network Edge Server Before Vs After CDN Implementation Performance Dashboard Diagrams PDF
This slide depicts a comparative dashboard for before and after CDN implementation based on the cache miss, cache hit, latency, and memory utilization. Deliver an awe inspiring pitch with this creative Content Delivery Network Edge Server Before Vs After CDN Implementation Performance Dashboard Diagrams PDF bundle. Topics like After Cdn Implementation, Performance Dashboard can be discussed with this completely editable template. It is available for immediate download depending on the needs and requirements of the user.
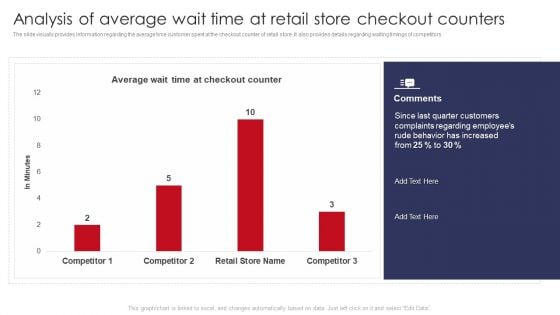
Analysis Of Average Wait Time At Retail Store Checkout Counters Retail Outlet Operations Diagrams PDF
The slide visually provides information regarding the average time customer spent at the checkout counter of retail store. It also provides details regarding waiting timings of competitors.Deliver an awe inspiring pitch with this creative Analysis Of Average Wait Time At Retail Store Checkout Counters Retail Outlet Operations Diagrams PDF bundle. Topics like Quarter Customers, Complaints Regarding, Behavior Increased can be discussed with this completely editable template. It is available for immediate download depending on the needs and requirements of the user.
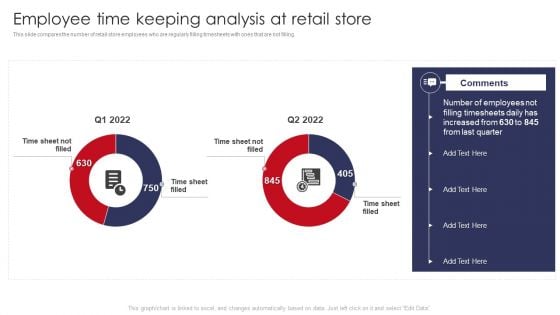
Employee Time Keeping Analysis At Retail Store Retail Outlet Operations Performance Evaluation Diagrams PDF
This slide compares the number of retail store employees who are regularly filling timesheets with ones that are not filling.Deliver an awe inspiring pitch with this creative Employee Time Keeping Analysis At Retail Store Retail Outlet Operations Performance Evaluation Diagrams PDF bundle. Topics like Filling Timesheets, Increased, Last Quarter can be discussed with this completely editable template. It is available for immediate download depending on the needs and requirements of the user.
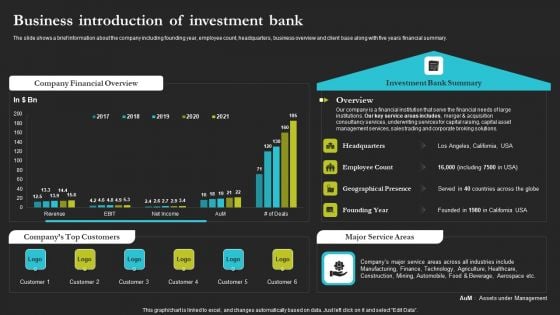
Sell Side Merger And Acquisition Business Introduction Of Investment Bank Diagrams PDF
The slide shows a brief information about the company including founding year, employee count, headquarters, business overview and client base along with five years financial summary. Deliver an awe inspiring pitch with this creative Sell Side Merger And Acquisition Business Introduction Of Investment Bank Diagrams PDF bundle. Topics like Company Financial Overview, Companys Top Customers, Major Service Areas can be discussed with this completely editable template. It is available for immediate download depending on the needs and requirements of the user.
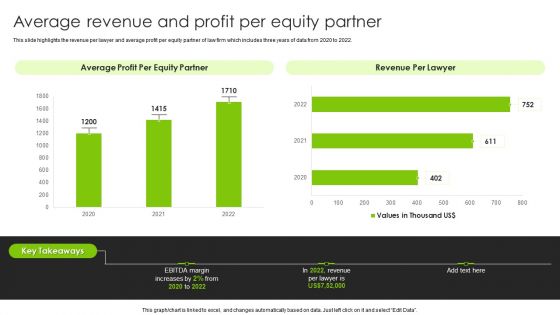
International Legal And Business Services Company Profile Average Revenue And Profit Per Equity Partner Diagrams PDF
This slide highlights the revenue per lawyer and average profit per equity partner of law firm which includes three years of data from 2020 to 2022. Deliver an awe inspiring pitch with this creative International Legal And Business Services Company Profile Average Revenue And Profit Per Equity Partner Diagrams PDF bundle. Topics like Revenue Per Lawyer, Average Profit, Equity Partner can be discussed with this completely editable template. It is available for immediate download depending on the needs and requirements of the user.
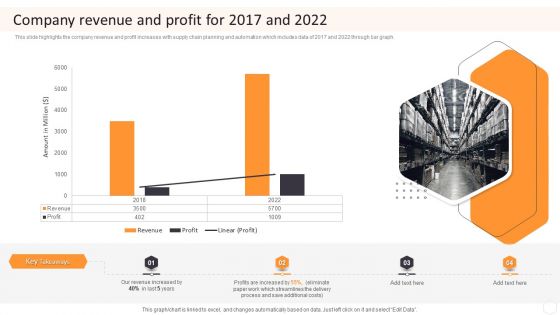
Cargo Logistics Company Profile Company Revenue And Profit For 2017 And 2022 Diagrams PDF
This slide highlights the company revenue and profit increases with supply chain planning and automation which includes data of 2017 and 2022 through bar graph. Deliver an awe inspiring pitch with this creative Cargo Logistics Company Profile Company Revenue And Profit For 2017 And 2022 Diagrams PDF bundle. Topics like Revenue, Profits, Additional Costs can be discussed with this completely editable template. It is available for immediate download depending on the needs and requirements of the user.
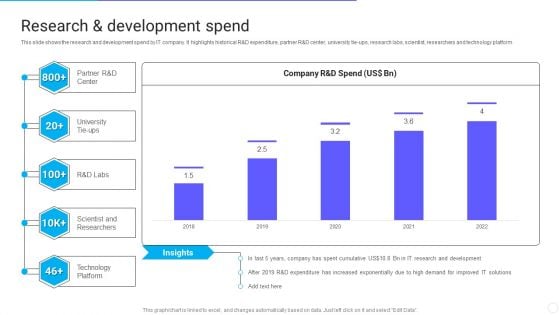
IT Application Services Company Outline Research And Development Spend Diagrams PDF
This slide shows the research and development spend by IT company. It highlights historical R and D expenditure, partner R and D center, university tie ups, research labs, scientist, researchers and technology platform. Deliver an awe inspiring pitch with this creative IT Application Services Company Outline Research And Development Spend Diagrams PDF bundle. Topics like Expenditure, Demand, Development can be discussed with this completely editable template. It is available for immediate download depending on the needs and requirements of the user.
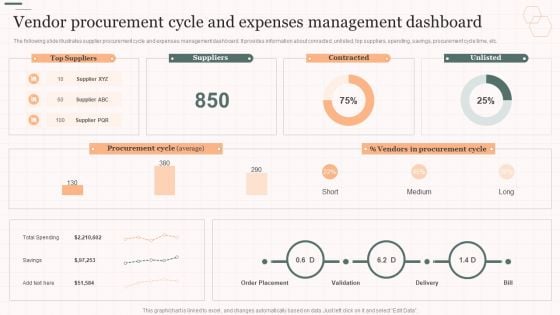
Vendor Procurement Cycle And Expenses Management Dashboard Vendor Management Strategies Diagrams PDF
The following slide illustrates supplier procurement cycle and expenses management dashboard. It provides information about conracted, unlisted, top suppliers, spending, savings, procurement cycle time, etc.Deliver an awe inspiring pitch with this creative Vendor Procurement Cycle And Expenses Management Dashboard Vendor Management Strategies Diagrams PDF bundle. Topics like Contracted, Unlisted, Vendors Procurement can be discussed with this completely editable template. It is available for immediate download depending on the needs and requirements of the user.
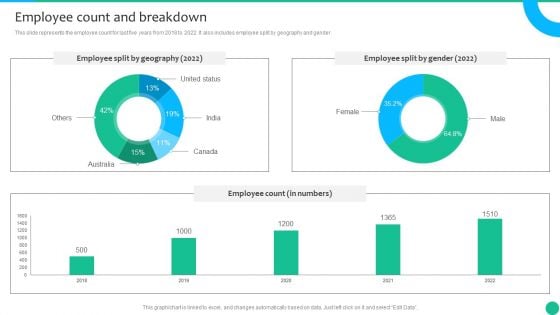
Strategic Management Consultancy Business Profile Employee Count And Breakdown Diagrams PDF
This slide represents the employee count for last five years from 2018 to 2022. It also includes employee split by geography and gender. Deliver an awe inspiring pitch with this creative Strategic Management Consultancy Business Profile Employee Count And Breakdown Diagrams PDF bundle. Topics like Employee Split By Gender, Employee Split By Geography, Employee Count can be discussed with this completely editable template. It is available for immediate download depending on the needs and requirements of the user.
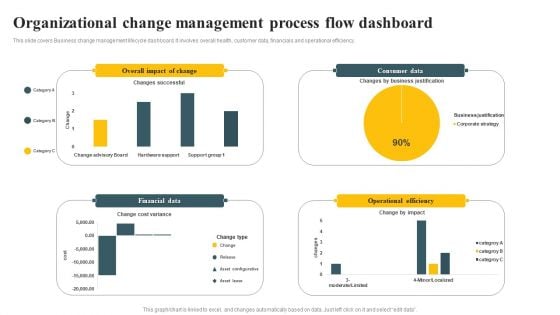
Organizational Change Management Process Flow Dashboard Ppt PowerPoint Presentation Diagram PDF
This slide covers Business change management lifecycle dashboard. It involves overall health, customer data, financials and operational efficiency. Pitch your topic with ease and precision using this Organizational Change Management Process Flow Dashboard Ppt PowerPoint Presentation Diagram PDF. This layout presents information on Financial Data, Operational Efficiency, Consumer Data. It is also available for immediate download and adjustment. So, changes can be made in the color, design, graphics or any other component to create a unique layout.
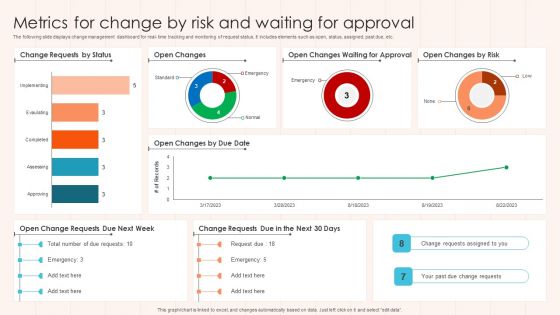
Metrics For Change By Risk And Waiting For Approval Diagrams PDF
The following slide displays change management dashboard for real- time tracking and monitoring of request status. It includes elements such as open, status, assigned, past due, etc. Pitch your topic with ease and precision using this Metrics For Change By Risk And Waiting For Approval Diagrams PDF This layout presents information on Approval, Risk, Status. It is also available for immediate download and adjustment. So, changes can be made in the color, design, graphics or any other component to create a unique layout.
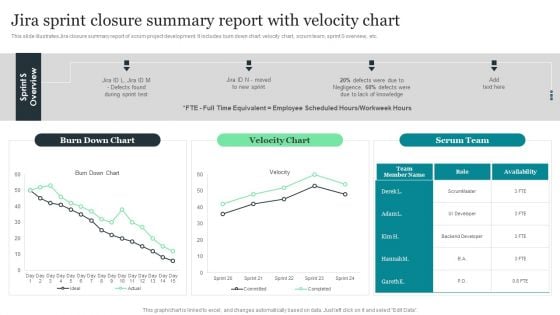
Jira Sprint Closure Summary Report With Velocity Chart Designs PDF
This slide illustrates Jira closure summary report of scrum project development. It includes burn down chart, velocity chart, scrum team, sprint S overview, etc. Pitch your topic with ease and precision using this Jira Sprint Closure Summary Report With Velocity Chart Designs PDF. This layout presents information on Jira Sprint Closure, Summary Report, Velocity Chart. It is also available for immediate download and adjustment. So, changes can be made in the color, design, graphics or any other component to create a unique layout.
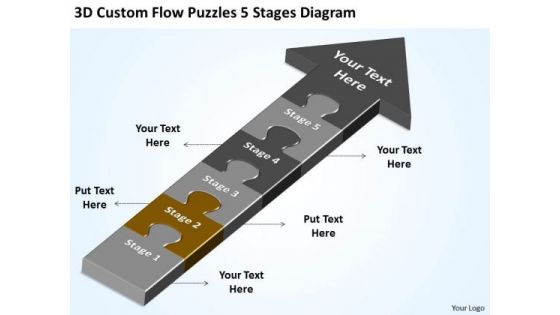
3d Custom Flow Puzzles 5 Stages Diagram Business Continuity Plan Software PowerPoint Slides
We present our 3d custom flow puzzles 5 stages diagram business continuity plan software PowerPoint Slides.Present our Symbol PowerPoint Templates because so that you can Lead the way to spread good cheer to one and all. Download our Flow charts PowerPoint Templates because you have the basic goal in mind. Use our Arrows PowerPoint Templates because honesty is the best policy has an ardent follower in you. Present our Puzzles or Jigsaws PowerPoint Templates because generation of sales is the core of any business. Download our Business PowerPoint Templates because watch the excitement levels rise as they realise their worth.Use these PowerPoint slides for presentations relating to 3d, Puzzle, Process, Arrow, Arrows, Block, Business, Chart, Design, Development, Diagram, Direction, Element, Flow, Flowchart, Graph, Linear, Management, Organization, Process, Program, Section, Sign, Solution, Symbol. The prominent colors used in the PowerPoint template are Brown, Gray, Black. Professionals tell us our 3d custom flow puzzles 5 stages diagram business continuity plan software PowerPoint Slides are Multicolored. We assure you our Arrows PowerPoint templates and PPT Slides are Spectacular. People tell us our 3d custom flow puzzles 5 stages diagram business continuity plan software PowerPoint Slides are Magnificent. Customers tell us our Process PowerPoint templates and PPT Slides are Tranquil. Use our 3d custom flow puzzles 5 stages diagram business continuity plan software PowerPoint Slides are readymade to fit into any presentation structure. We assure you our Chart PowerPoint templates and PPT Slides are effectively colour coded to prioritise your plans They automatically highlight the sequence of events you desire. Avail of the many facets of our 3d Custom Flow Puzzles 5 Stages Diagram Business Continuity Plan Software PowerPoint Slides. Approach issues in all their aspects.
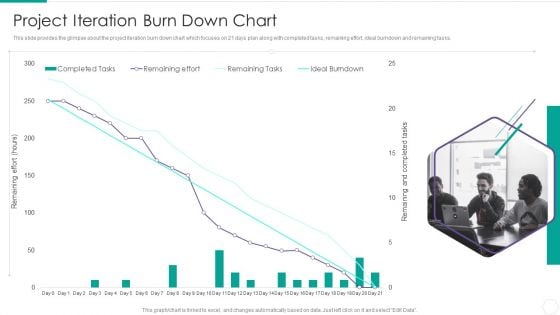
Quantitative Risk Assessment Project Iteration Burn Down Chart Sample PDF
This slide provides the glimpse about the project iteration burn down chart which focuses on 21 days plan along with completed tasks, remaining effort, ideal burndown and remaining tasks. Deliver an awe inspiring pitch with this creative Quantitative Risk Assessment Project Iteration Burn Down Chart Sample PDF bundle. Topics like Project Iteration Burn Down Chart can be discussed with this completely editable template. It is available for immediate download depending on the needs and requirements of the user.
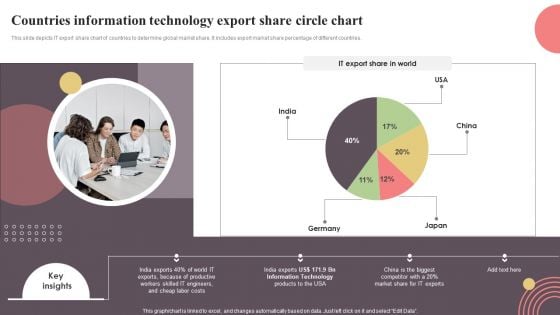
Countries Information Technology Export Share Circle Chart Inspiration PDF
This slide depicts IT export share chart of countries to determine global market share. It includes export market share percentage of different countries. Pitch your topic with ease and precision using this Countries Information Technology Export Share Circle Chart Inspiration PDF. This layout presents information on Countries Information Technology, Export Share Circle Chart. It is also available for immediate download and adjustment. So, changes can be made in the color, design, graphics or any other component to create a unique layout.
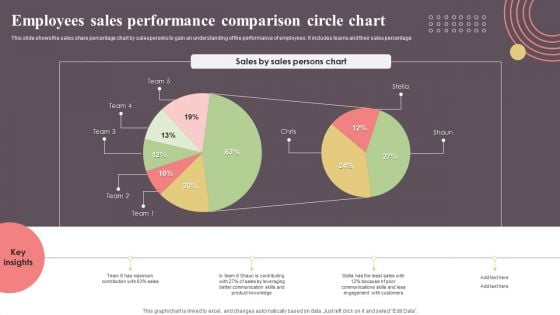
Employees Sales Performance Comparison Circle Chart Topics PDF
This slide shows the sales share percentage chart by salespersons to gain an understanding of the performance of employees. It includes teams and their sales percentage. Pitch your topic with ease and precision using this Employees Sales Performance Comparison Circle Chart Topics PDF. This layout presents information on Employees Sales Performance, Comparison Circle Chart. It is also available for immediate download and adjustment. So, changes can be made in the color, design, graphics or any other component to create a unique layout.
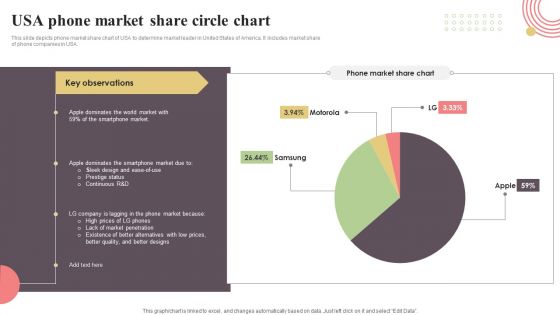
USA Phone Market Share Circle Chart Sample PDF
This slide depicts phone market share chart of USA to determine market leader in United States of America. It includes market share of phone companies in USA. Pitch your topic with ease and precision using this USA Phone Market Share Circle Chart Sample PDF. This layout presents information on USA Phone Market, Share Circle Chart. It is also available for immediate download and adjustment. So, changes can be made in the color, design, graphics or any other component to create a unique layout.
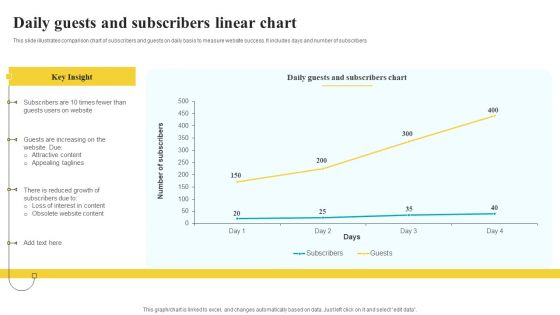
Daily Guests And Subscribers Linear Chart Clipart PDF
This slide illustrates comparison chart of subscribers and guests on daily basis to measure website success. It includes days and number of subscribers Pitch your topic with ease and precision using this Daily Guests And Subscribers Linear Chart Clipart PDF. This layout presents information on Key Insight, Website, Subscribers Chart. It is also available for immediate download and adjustment. So, changes can be made in the color, design, graphics or any other component to create a unique layout.
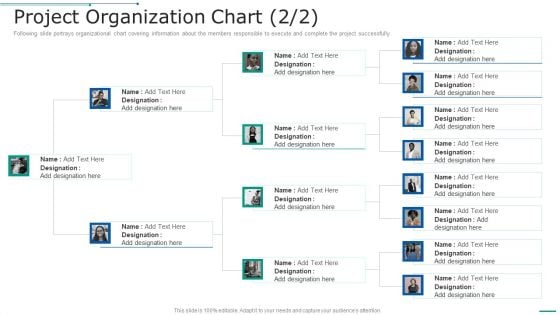
PMP Toolkit Project Organization Chart Project Ppt Pictures Tips PDF
This slide illustrates organizational chart covering information about the members responsible to execute and complete the project successfully. Presenting pmp toolkit project organization chart project ppt pictures tips pdf to provide visual cues and insights. Share and navigate important information on two stages that need your due attention. This template can be used to pitch topics like project organization chart. In addtion, this PPT design contains high resolution images, graphics, etc, that are easily editable and available for immediate download.

Microsoft Corporations Revenue Growth Graph Strategic Advancements By Microsofts Diagrams Pdf
This slide represents graph which ca be used to calculate the revenue growth of Microsoft in last twenty years. Microsofts revenue has been growing continuously over the past 5 years since. Presenting this PowerPoint presentation, titled Microsoft Corporations Revenue Growth Graph Strategic Advancements By Microsofts Diagrams Pdf, with topics curated by our researchers after extensive research. This editable presentation is available for immediate download and provides attractive features when used. Download now and captivate your audience. Presenting this Microsoft Corporations Revenue Growth Graph Strategic Advancements By Microsofts Diagrams Pdf. Our researchers have carefully researched and created these slides with all aspects taken into consideration. This is a completely customizable Microsoft Corporations Revenue Growth Graph Strategic Advancements By Microsofts Diagrams Pdf that is available for immediate downloading. Download now and make an impact on your audience. Highlight the attractive features available with our PPTs. This slide represents graph which ca be used to calculate the revenue growth of Microsoft in last twenty years. Microsofts revenue has been growing continuously over the past 5 years since.
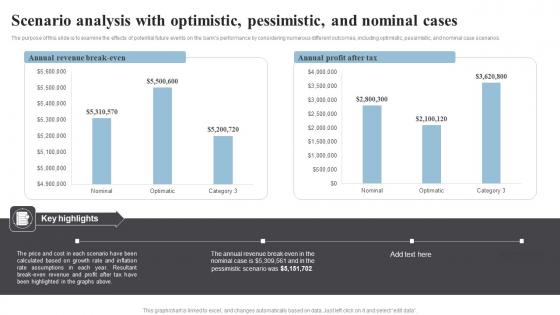
Scenario Analysis With Optimistic Pessimistic Banking Start Up B Plan Go To Market Strategy Diagrams Pdf
The purpose of this slide is to examine the effects of potential future events on the banks performance by considering numerous different outcomes, including optimistic, pessimistic, and nominal case scenarios. Presenting this PowerPoint presentation, titled Scenario Analysis With Optimistic Pessimistic Banking Start Up B Plan Go To Market Strategy Diagrams Pdf, with topics curated by our researchers after extensive research. This editable presentation is available for immediate download and provides attractive features when used. Download now and captivate your audience. Presenting this Scenario Analysis With Optimistic Pessimistic Banking Start Up B Plan Go To Market Strategy Diagrams Pdf. Our researchers have carefully researched and created these slides with all aspects taken into consideration. This is a completely customizable Scenario Analysis With Optimistic Pessimistic Banking Start Up B Plan Go To Market Strategy Diagrams Pdf that is available for immediate downloading. Download now and make an impact on your audience. Highlight the attractive features available with our PPTs. The purpose of this slide is to examine the effects of potential future events on the banks performance by considering numerous different outcomes, including optimistic, pessimistic, and nominal case scenarios.
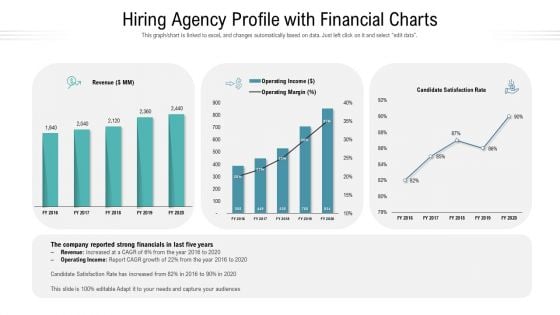
Hiring Agency Profile With Financial Charts Ppt Model Example PDF
This graph or chart is linked to excel, and changes automatically based on data. Just left click on it and select edit data. Pitch your topic with ease and precision using this hiring agency profile with financial charts ppt model example pdf. This layout presents information on revenue, operating income, operating margin, satisfaction rate. It is also available for immediate download and adjustment. So, changes can be made in the color, design, graphics or any other component to create a unique layout.
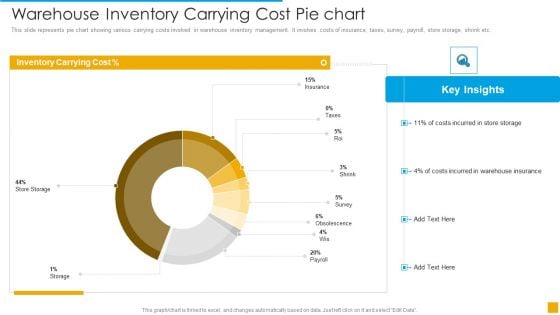
Warehouse Inventory Carrying Cost Pie Chart Demonstration PDF
This slide represents pie chart showing various carrying costs involved in warehouse inventory management. It involves costs of insurance, taxes, survey, payroll, store storage, shrink etc.Pitch your topic with ease and precision using this Warehouse Inventory Carrying Cost Pie Chart Demonstration PDF. This layout presents information on Cost, Inventory, Storage. It is also available for immediate download and adjustment. So, changes can be made in the color, design, graphics or any other component to create a unique layout.
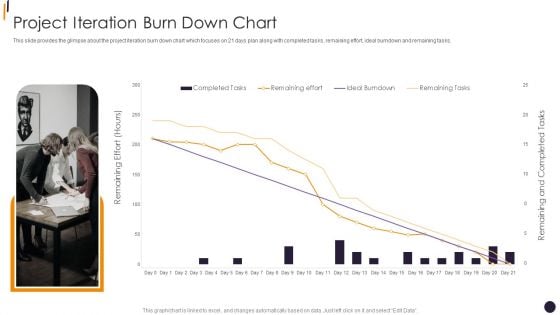
PMP Tools Project Iteration Burn Down Chart Slides PDF
This slide provides the glimpse about the project iteration burn down chart which focuses on 21 days plan along with completed tasks, remaining effort, ideal burndown and remaining tasks.Deliver an awe inspiring pitch with this creative PMP Tools Project Iteration Burn Down Chart Slides PDF bundle. Topics like Remaining Effort, Remaining Tasks, Completed Tasks can be discussed with this completely editable template. It is available for immediate download depending on the needs and requirements of the user.
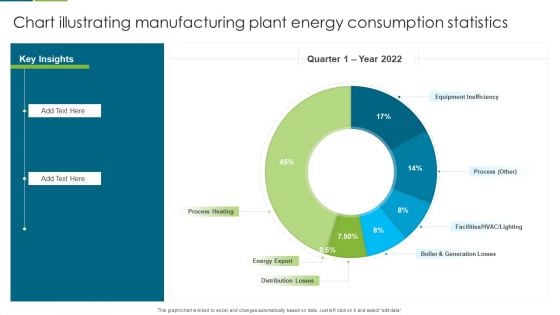
Chart Illustrating Manufacturing Plant Energy Consumption Statistics Slides PDF
This graph or chart is linked to excel, and changes automatically based on data. Just left click on it and select edit data. Pitch your topic with ease and precision using this Chart Illustrating Manufacturing Plant Energy Consumption Statistics Slides PDF. This layout presents information on Equipment Inefficiency, Process Heating, Energy Export. It is also available for immediate download and adjustment. So, changes can be made in the color, design, graphics or any other component to create a unique layout.
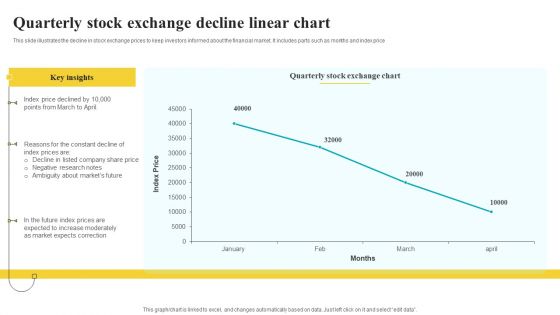
Quarterly Stock Exchange Decline Linear Chart Inspiration PDF
This slide illustrates the decline in stock exchange prices to keep investors informed about the financial market. It includes parts such as months and index price Pitch your topic with ease and precision using this Quarterly Stock Exchange Decline Linear Chart Inspiration PDF. This layout presents information on Key Insights, Exchange Chart, Correction. It is also available for immediate download and adjustment. So, changes can be made in the color, design, graphics or any other component to create a unique layout.
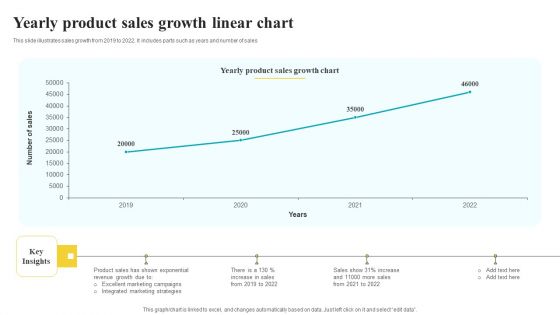
Yearly Product Sales Growth Linear Chart Pictures PDF
This slide illustrates sales growth from 2019 to 2022. It includes parts such as years and number of sales Pitch your topic with ease and precision using this Yearly Product Sales Growth Linear Chart Pictures PDF. This layout presents information on Sales Growth Chart, Key Insights, Strategies. It is also available for immediate download and adjustment. So, changes can be made in the color, design, graphics or any other component to create a unique layout.
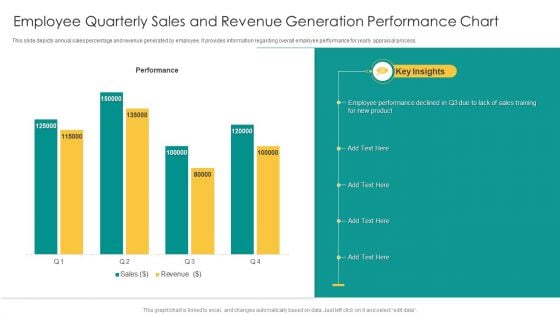
Employee Quarterly Sales And Revenue Generation Performance Chart Mockup PDF
This slide depicts annual sales percentage and revenue generated by employee. It provides information regarding overall employee performance for yearly appraisal process. Pitch your topic with ease and precision using this Employee Quarterly Sales And Revenue Generation Performance Chart Mockup PDF. This layout presents information on Performance, Sales, Revenue. It is also available for immediate download and adjustment. So, changes can be made in the color, design, graphics or any other component to create a unique layout.
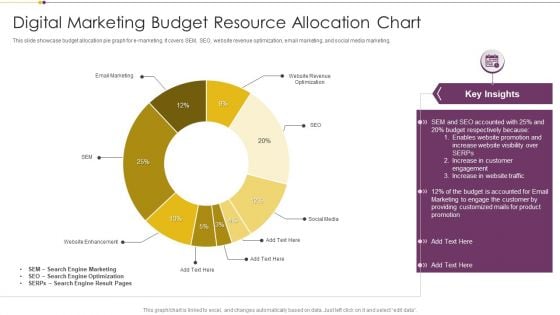
Digital Marketing Budget Resource Allocation Chart Download PDF
This slide showcase budget allocation pie graph for e marketing. It covers SEM, SEO, website revenue optimization, email marketing, and social media marketing. Pitch your topic with ease and precision using this Digital Marketing Budget Resource Allocation Chart Download PDF. This layout presents information on Search Engine Marketing, Search Engine Optimization, Budget. It is also available for immediate download and adjustment. So, changes can be made in the color, design, graphics or any other component to create a unique layout.
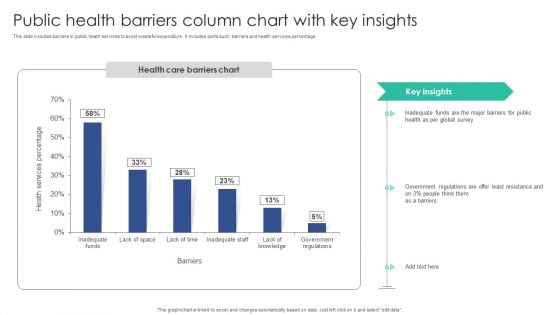
Public Health Barriers Column Chart With Key Insights Portrait PDF
This slide includes barriers in public heath services to avoid wasteful expenditure . It includes parts such barriers and health services percentage.Pitch your topic with ease and precision using this Public Health Barriers Column Chart With Key Insights Portrait PDF. This layout presents information on Inadequate Funds, Global Survey, Government Regulations. It is also available for immediate download and adjustment. So, changes can be made in the color, design, graphics or any other component to create a unique layout.
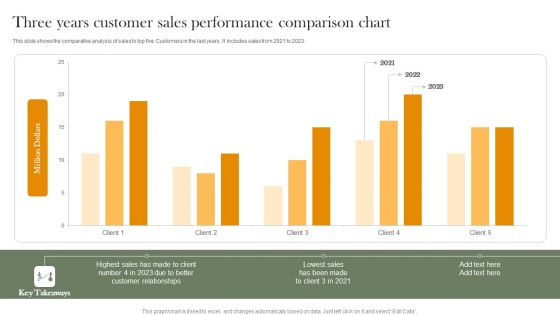
Three Years Customer Sales Performance Comparison Chart Professional PDF
This slide shows the comparative analysis of sales to top five Customers in the last years. It includes sales from 2021 to 2023. Pitch your topic with ease and precision using this Three Years Customer Sales Performance Comparison Chart Professional PDF. This layout presents information on Highest Sales, Customer Relationships, Lowest Sales. It is also available for immediate download and adjustment. So, changes can be made in the color, design, graphics or any other component to create a unique layout.
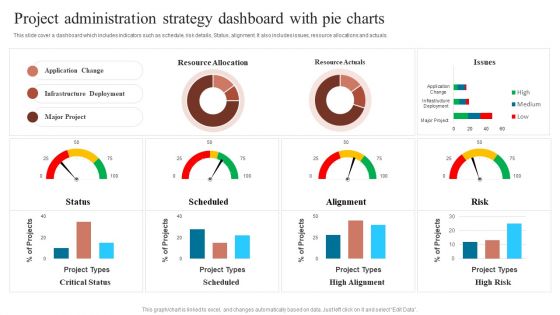
Project Administration Strategy Dashboard With Pie Charts Sample PDF
This slide cover a dashboard which includes indicators such as schedule, risk details, Status, alignment. It also includes issues, resource allocations and actuals. Pitch your topic with ease and precision using this Project Administration Strategy Dashboard With Pie Charts Sample PDF. This layout presents information on Communication Goal, Communication Tool, Increase Revenue. It is also available for immediate download and adjustment. So, changes can be made in the color, design, graphics or any other component to create a unique layout.
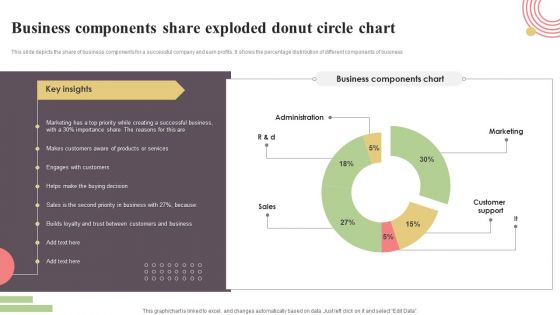
Business Components Share Exploded Donut Circle Chart Elements PDF
This slide depicts the share of business components for a successful company and earn profits. It shows the percentage distribution of different components of business. Pitch your topic with ease and precision using this Business Components Share Exploded Donut Circle Chart Elements PDF. This layout presents information on Administration, Marketing, Customer Support. It is also available for immediate download and adjustment. So, changes can be made in the color, design, graphics or any other component to create a unique layout.
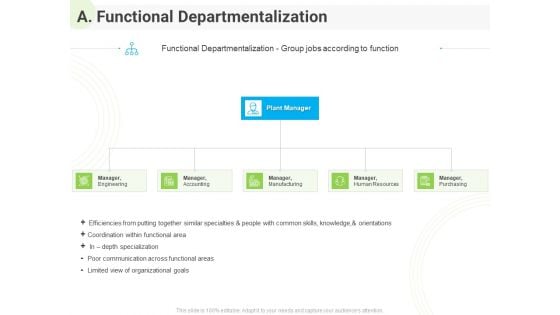
Developing Work Force Management Plan Model A Functional Departmentalization Diagrams PDF
Presenting developing work force management plan model a functional departmentalization diagrams pdf to provide visual cues and insights. Share and navigate important information on five stages that need your due attention. This template can be used to pitch topics like engineering, accounting, manufacturing, human resources, purchasing. In addition, this PPT design contains high-resolution images, graphics, etc, that are easily editable and available for immediate download.
Project Dashboard For Tracking Schedule Management Techniques PPT Presentation
This slide presents project dashboard for tracking task status or phases of project, that would help to monitor progress. It includes information on ongoing phase, budget, risks, pending tasks etc. Presenting this PowerPoint presentation, titled Project Dashboard For Tracking Schedule Management Techniques PPT Presentation, with topics curated by our researchers after extensive research. This editable presentation is available for immediate download and provides attractive features when used. Download now and captivate your audience. Presenting this Project Dashboard For Tracking Schedule Management Techniques PPT Presentation. Our researchers have carefully researched and created these slides with all aspects taken into consideration. This is a completely customizable Project Dashboard For Tracking Schedule Management Techniques PPT Presentation that is available for immediate downloading. Download now and make an impact on your audience. Highlight the attractive features available with our PPTs. This slide presents project dashboard for tracking task status or phases of project, that would help to monitor progress. It includes information on ongoing phase, budget, risks, pending tasks etc
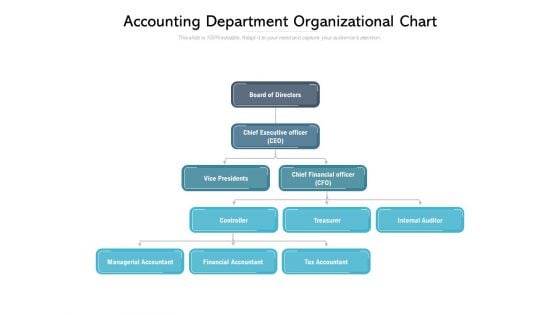
Accounting Department Organizational Chart Ppt PowerPoint Presentation Pictures Graphics
Presenting this set of slides with name accounting department organizational chart ppt powerpoint presentation pictures graphics. This is a five stage process. The stages in this process are board of directors, chief executive officer, vice presidents, chief financial officer, controller, treasurer, internal auditor, managerial accountant, financial accountant, tax accountant. This is a completely editable PowerPoint presentation and is available for immediate download. Download now and impress your audience.
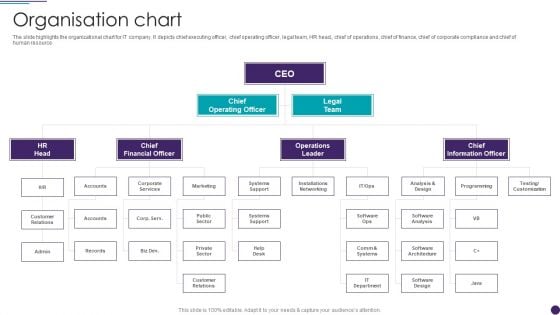
IT Services Business Profile Organisation Chart Download PDF
Presenting IT Services Business Profile Organisation Chart Download PDF to Chief O visual cues and insights. Share and navigate important information on two stages that need your due attention. This template can be used to pitch topics like Chief Operating Officer, Chief Financial Officer, Chief Information Officer. In addtion, this PPT design contains high resolution images, graphics, etc, that are easily editable and available for immediate download.
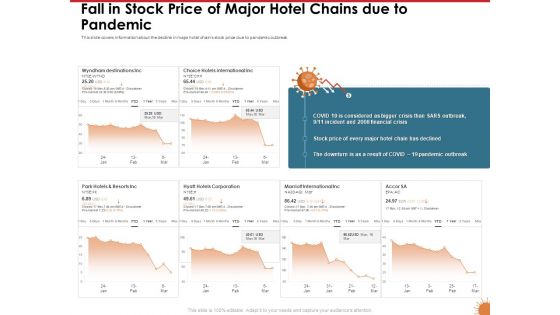
Impact Of COVID 19 On The Hospitality Industry Fall In Stock Price Of Major Hotel Chains Due To Pandemic Themes PDF
Presenting this set of slides with name impact of covid 19 on the hospitality industry fall in stock price of major hotel chains due to pandemic themes pdf. The topics discussed in these slides are wyndham destinations inc, choice hotels international inc, park hotels and resorts inc, hyatt hotels corporation, marriott international inc. This is a completely editable PowerPoint presentation and is available for immediate download. Download now and impress your audience.
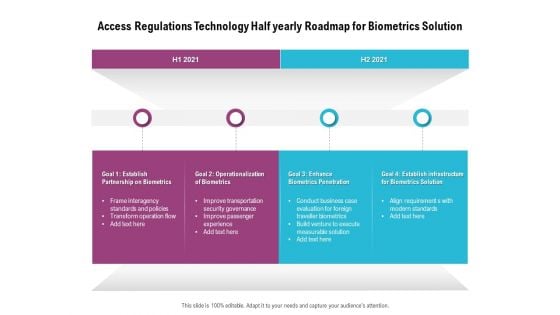
Access Regulations Technology Half Yearly Roadmap For Biometrics Solution Diagrams
Introducing our access regulations technology half yearly roadmap for biometrics solution diagrams. This PPT presentation is Google Slides compatible, therefore, you can share it easily with the collaborators for measuring the progress. Also, the presentation is available in both standard screen and widescreen aspect ratios. So edit the template design by modifying the font size, font type, color, and shapes as per your requirements. As this PPT design is fully editable it can be presented in PDF, JPG and PNG formats.

Bitcoin Digital Currency Investment Six Months Timeline Roadmap Diagrams
Introducing our bitcoin digital currency investment six months timeline roadmap diagrams. This PPT presentation is Google Slides compatible, therefore, you can share it easily with the collaborators for measuring the progress. Also, the presentation is available in both standard screen and widescreen aspect ratios. So edit the template design by modifying the font size, font type, color, and shapes as per your requirements. As this PPT design is fully editable it can be presented in PDF, JPG and PNG formats.
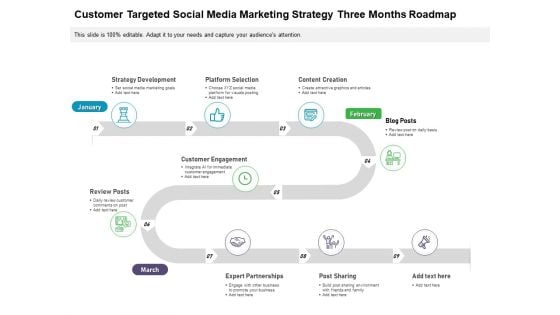
Customer Targeted Social Media Marketing Strategy Three Months Roadmap Diagrams
Presenting our jaw-dropping customer targeted social media marketing strategy three months roadmap diagrams. You can alternate the color, font size, font type, and shapes of this PPT layout according to your strategic process. This PPT presentation is compatible with Google Slides and is available in both standard screen and widescreen aspect ratios. You can also download this well-researched PowerPoint template design in different formats like PDF, JPG, and PNG. So utilize this visually-appealing design by clicking the download button given below.

 Home
Home