Availability Icon
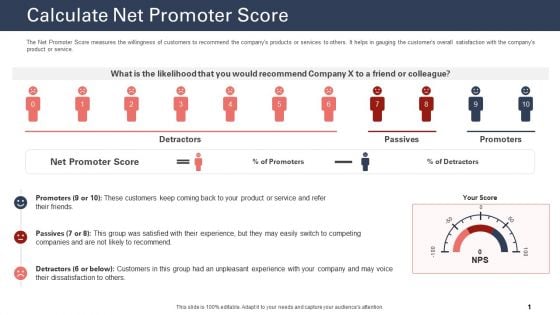
Techniques To Increase Customer Satisfaction Calculate Net Promoter Score Diagrams PDF
The Net Promoter Score measures the willingness of customers to recommend the companys products or services to others. It helps in gauging the customers overall satisfaction with the companys product or service. Deliver an awe inspiring pitch with this creative techniques to increase customer satisfaction calculate net promoter score diagrams pdf bundle. Topics like calculate net promoter score, product or service, net promoter score can be discussed with this completely editable template. It is available for immediate download depending on the needs and requirements of the user.
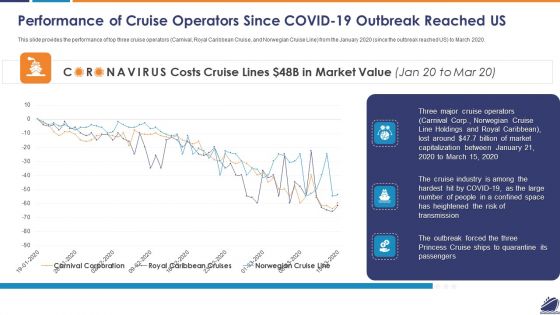
Performance Of Cruise Operators Since COVID 19 Outbreak Reached US Diagrams PDF
This slide provides the performance of top three cruise operators Carnival, Royal Caribbean Cruise, and Norwegian Cruise Line from the January 2020 since the outbreak reached US to March 2020. Deliver an awe inspiring pitch with this creative performance of cruise operators since covid 19 outbreak reached us diagrams pdf bundle. Topics like performance of cruise operators since covid 19 outbreak reached us can be discussed with this completely editable template. It is available for immediate download depending on the needs and requirements of the user.
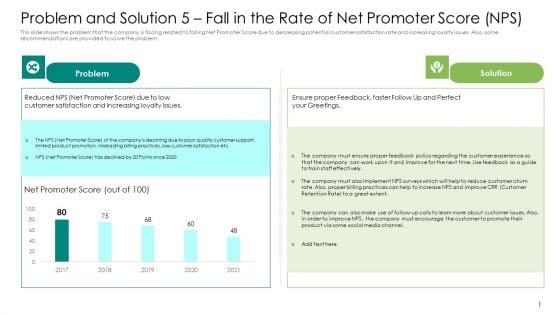
Problem And Solution 5 Fall In The Rate Of Net Promoter Score NPS Diagrams PDF
This slide shows the problem that the company is facing related to falling Net Promoter Score due to decreasing potential customer satisfaction rate and increasing loyalty issues. Also, some recommendations are provided to solve the problem. Deliver an awe-inspiring pitch with this creative problem and solution 5 fall in the rate of net promoter score nps diagrams pdf. bundle. Topics like net promoter score, 2017 to 2021 can be discussed with this completely editable template. It is available for immediate download depending on the needs and requirements of the user.
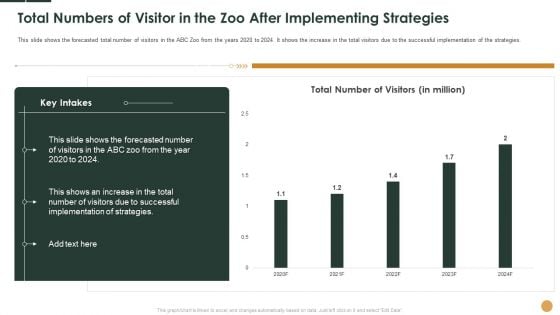
Total Numbers Of Visitor In The Zoo After Implementing Strategies Ppt Summary Diagrams PDF
This slide shows the forecasted total number of visitors in the ABC Zoo from the years 2020 to 2024. It shows the increase in the total visitors due to the successful implementation of the strategies.Deliver an awe-inspiring pitch with this creative total numbers of visitor in the zoo after implementing strategies ppt summary diagrams pdf. bundle. Topics like total number of visitors, 2020 to 2024 can be discussed with this completely editable template. It is available for immediate download depending on the needs and requirements of the user.
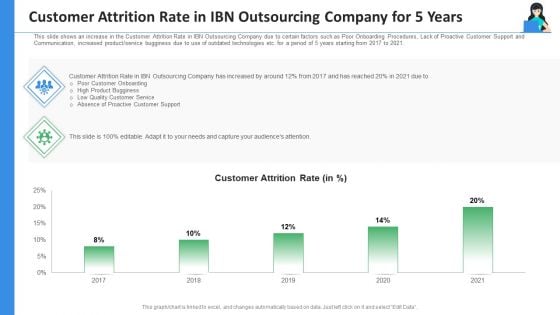
Customer Attrition Rate In IBN Outsourcing Company For 5 Years Ppt Styles Diagrams PDF
This slide shows an increase in the Customer Attrition Rate in IBN Outsourcing Company due to certain factors such as Poor Onboarding Procedures, Lack of Proactive Customer Support and Communication, increased product service bugginess due to use of outdated technologies etc. for a period of 5 years starting from 2017 to 2021. Deliver an awe inspiring pitch with this creative customer attrition rate in IBN outsourcing company for 5 years ppt styles diagrams pdf bundle. Topics like product bugginess, quality customer service, absence of proactive customer support, 2017 to 2021 can be discussed with this completely editable template. It is available for immediate download depending on the needs and requirements of the user.
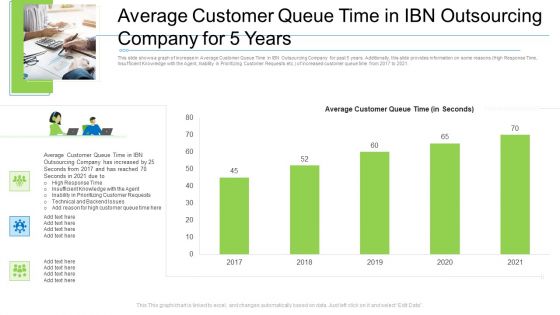
Average Customer Queue Time In Ibn Outsourcing Company For 5 Years Diagrams PDF
This slide shows a graph of increase in Average Customer Queue Time in IBN Outsourcing Company for past 5 years. Additionally, this slide provides information on some reasons High Response Time, Insufficient Knowledge with the Agent, Inability in Prioritizing Customer Requests etc. of increased customer queue time from 2017 to 2021. Deliver an awe-inspiring pitch with this creative average customer queue time in ibn outsourcing company for 5 years diagrams pdf. bundle. Topics like average customer queue time in ibn outsourcing company for 5 years can be discussed with this completely editable template. It is available for immediate download depending on the needs and requirements of the user.
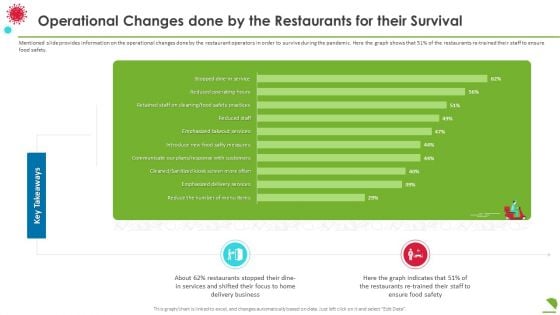
Operational Changes Done By The Restaurants For Their Survival Diagrams PDF
Mentioned slide provides information on the operational changes done by the restaurant operators in order to survive during the pandemic. Here the graph shows that 51 percentage of the restaurants re trained their staff to ensure food safety. Deliver an awe inspiring pitch with this creative operational changes done by the restaurants for their survival diagrams pdf bundle. Topics like business, services, key takeaways can be discussed with this completely editable template. It is available for immediate download depending on the needs and requirements of the user.
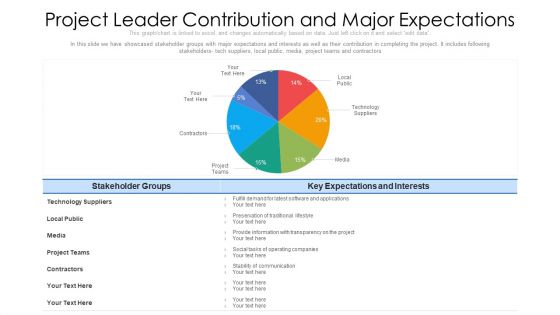
Project Leader Contribution And Major Expectations Ppt PowerPoint Presentation File Diagrams PDF
In this slide we have showcased stakeholder groups with major expectations and interests as well as their contribution in completing the project. It includes following stakeholders- tech suppliers, local public, media, project teams and contractors. Pitch your topic with ease and precision using this project leader contribution and major expectations ppt powerpoint presentation file diagrams pdf. This layout presents information on technology, media, contractors. It is also available for immediate download and adjustment. So, changes can be made in the color, design, graphics or any other component to create a unique layout.
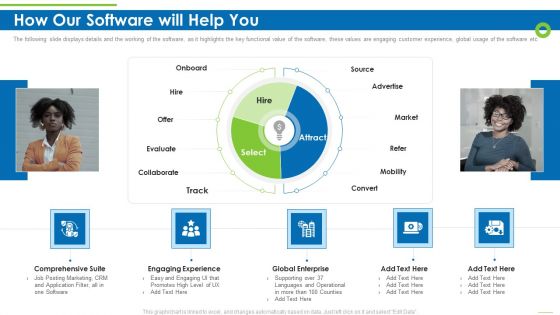
Enterprise Recruitment Industries Investor Fund Raising How Our Software Will Help You Diagrams PDF
The following slide displays details and the working of the software, as it highlights the key functional value of the software, these values are engaging customer experience, global usage of the software etc Deliver an awe inspiring pitch with this creative enterprise recruitment industries investor fund raising how our software will help you diagrams pdf bundle. Topics like comprehensive suite, engaging experience, global enterprise can be discussed with this completely editable template. It is available for immediate download depending on the needs and requirements of the user.
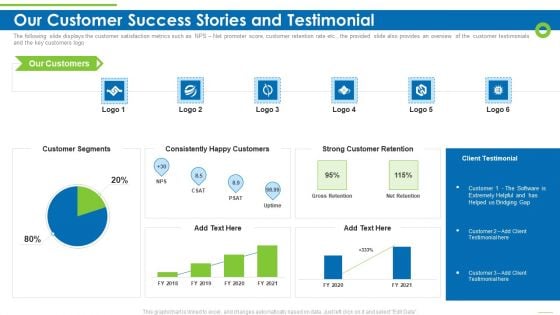
Enterprise Recruitment Industries Investor Fund Raising Our Customer Success Stories And Testimonial Diagrams PDF
The following slide displays the customer satisfaction metrics such as NPS Net promoter score, customer retention rate etc., the provided slide also provides an overview of the customer testimonials and the key customers logo Deliver an awe inspiring pitch with this creative enterprise recruitment industries investor fund raising our customer success stories and testimonial diagrams pdf bundle. Topics like customer segments, consistently happy customers, strong customer retention can be discussed with this completely editable template. It is available for immediate download depending on the needs and requirements of the user.
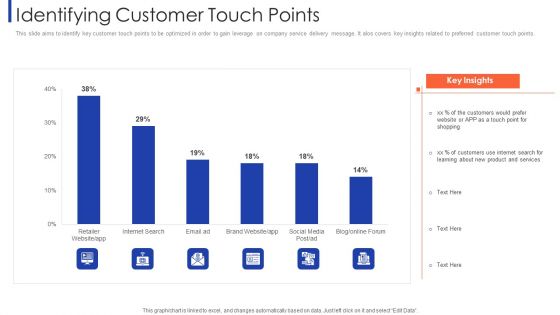
Customer Relationship Strategy For Building Loyalty Identifying Customer Touch Points Diagrams PDF
This slide aims to identify key customer touch points to be optimized in order to gain leverage on company service delivery message. It alos covers key insights related to preferred customer touch points. Deliver an awe inspiring pitch with this creative customer relationship strategy for building loyalty identifying customer touch points diagrams pdf bundle. Topics like retailer website, internet search, brand website, social media can be discussed with this completely editable template. It is available for immediate download depending on the needs and requirements of the user.
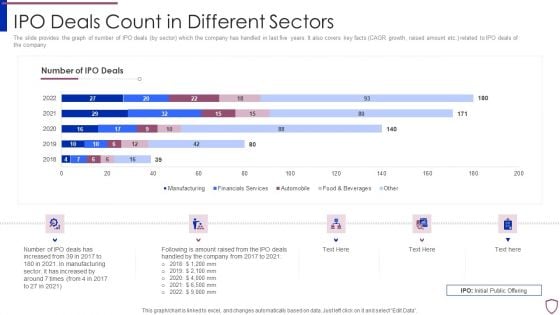
Financing Catalogue For Security Underwriting Agreement IPO Deals Count In Different Sectors Diagrams PDF
The slide provides the graph of number of IPO deals by sector which the company has handled in last five years. It also covers key facts CAGR growth, raised amount etc. related to IPO deals of the company. Deliver an awe inspiring pitch with this creative financing catalogue for security underwriting agreement ipo deals count in different sectors diagrams pdf bundle. Topics like manufacturing, financial services, automobile, food and beverages can be discussed with this completely editable template. It is available for immediate download depending on the needs and requirements of the user.
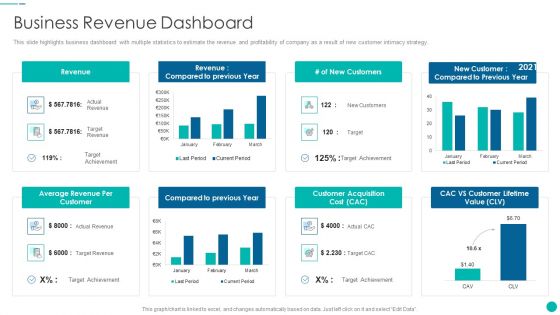
Tactical Procedure For Increasing Customer Intimacy Business Revenue Dashboard Diagrams PDF
This slide highlights business dashboard with multiple statistics to estimate the revenue and profitability of company as a result of new customer intimacy strategy. Deliver an awe inspiring pitch with this creative tactical procedure for increasing customer intimacy business revenue dashboard diagrams pdf bundle. Topics like average revenue per customer, compared to previous year, customer acquisition cost, cac vs customer lifetime value, revenue can be discussed with this completely editable template. It is available for immediate download depending on the needs and requirements of the user.
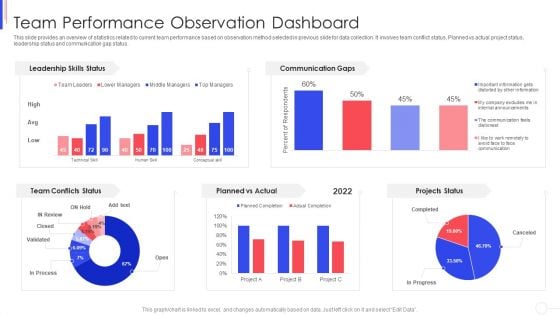
Strategy To Improve Team Proficiency Team Performance Observation Dashboard Diagrams PDF
This slide provides an overview of statistics related to current team performance based on observation method selected in previous slide for data collection. It involves team conflict status, Planned vs actual project status, leadership status and communication gap status. Deliver an awe inspiring pitch with this creative proficiency team performance observation dashboard diagrams pdf bundle. Topics like team performance observation dashboard can be discussed with this completely editable template. It is available for immediate download depending on the needs and requirements of the user.
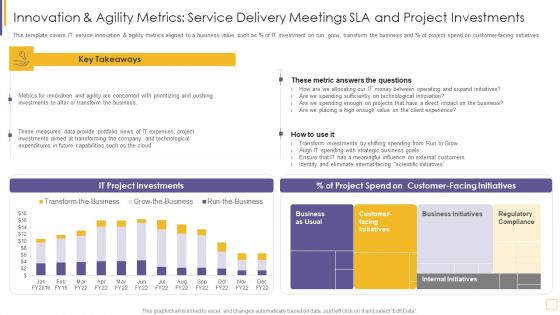
Guidelines For Exhibiting Business Value Of Information And Technology Innovation And Agility Metrics Diagrams PDF
This template covers IT service innovation and agility metrics aligned to a business value such as percentage of IT investment on run, grow, transform the business and percentage of project spend on customer facing initiatives. Deliver an awe inspiring pitch with this creative guidelines for exhibiting business value of information and technology innovation and agility metrics diagrams pdf bundle. Topics like measures, investments, expenses, technological, capabilities can be discussed with this completely editable template. It is available for immediate download depending on the needs and requirements of the user.
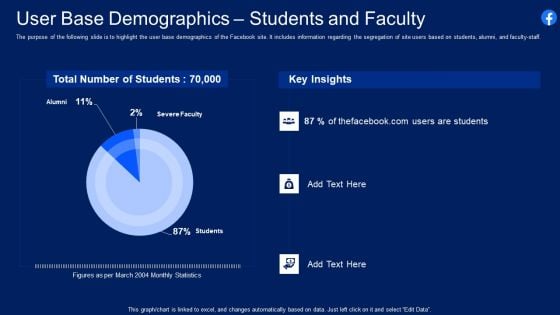
Facebook Original Capital Funding User Base Demographics Students And Faculty Diagrams PDF
The purpose of the following slide is to highlight the user base demographics of the Facebook site. It includes information regarding the segregation of site users based on students, alumni, and faculty staff. Deliver an awe inspiring pitch with this creative facebook original capital funding user base demographics students and faculty diagrams pdf bundle. Topics like user base demographics students and faculty can be discussed with this completely editable template. It is available for immediate download depending on the needs and requirements of the user.
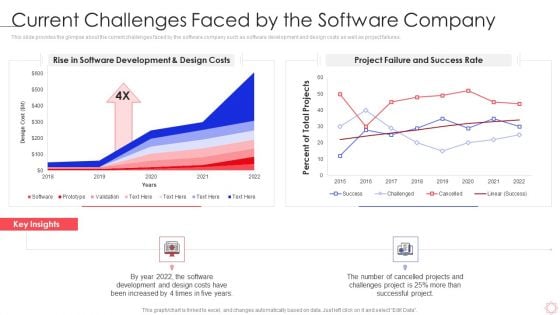
SPI Methodology Current Challenges Faced By The Software Company Ppt PowerPoint Presentation Diagram Templates PDF
This slide provides the glimpse about the current challenges faced by the software company such as software development and design costs as well as project failures. Deliver an awe inspiring pitch with this creative spi methodology current challenges faced by the software company ppt powerpoint presentation diagram templates pdf bundle. Topics like project failure and success rate, rise in software development can be discussed with this completely editable template. It is available for immediate download depending on the needs and requirements of the user.
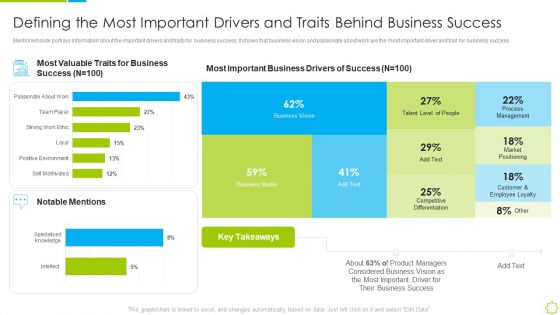
Launch New Sales Enablement Program Lead Generation Defining The Most Important Drivers Diagrams PDF
Mentioned slide portrays information about the important drivers and traits for business success. It shows that business vision and passionate about work are the most important driver and trait for business success. Deliver an awe inspiring pitch with this creative launch new sales enablement program lead generation defining the most important drivers diagrams pdf bundle. Topics like defining the most important drivers and traits behind business success can be discussed with this completely editable template. It is available for immediate download depending on the needs and requirements of the user.
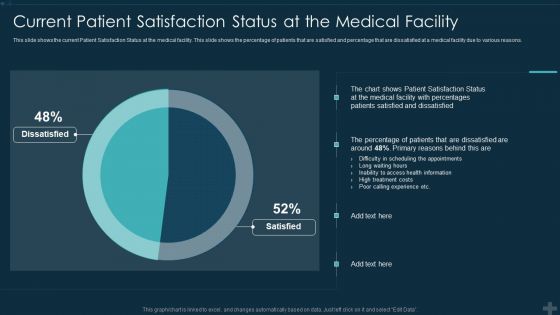
Application Patient Satisfaction Tactics Enhance Clinical Results Current Patient Satisfaction Status Diagrams PDF
This slide shows the current Patient Satisfaction Status at the medical facility. This slide shows the percentage of patients that are satisfied and percentage that are dissatisfied at a medical facility due to various reasons. Deliver an awe inspiring pitch with this creative application patient satisfaction tactics enhance clinical results current patient satisfaction status diagrams pdf bundle. Topics like current patient satisfaction status at the medical facility can be discussed with this completely editable template. It is available for immediate download depending on the needs and requirements of the user.
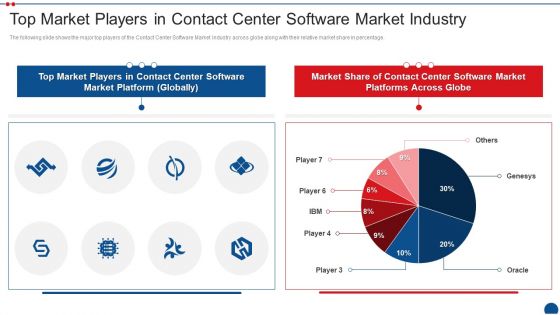
Call Center Application Market Industry Top Market Players In Contact Center Software Market Industry Diagrams PDF
The following slide shows the major top players of the Contact Center Software Market Industry across globe along with their relative market share in percentage. Deliver an awe inspiring pitch with this creative call center application market industry top market players in contact center software market industry diagrams pdf bundle. Topics like top market players in contact center software market industry can be discussed with this completely editable template. It is available for immediate download depending on the needs and requirements of the user.
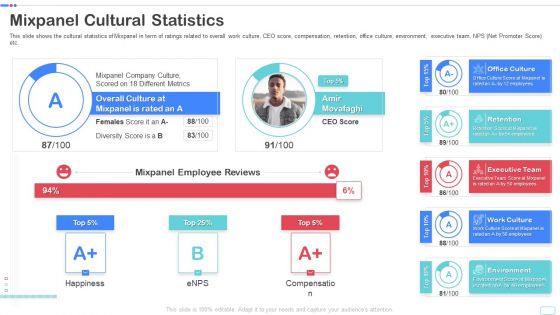
Mixpanel Capital Raising Pitch Deck Mixpanel Cultural Statistics Topics PDF Diagrams PDF
This slide shows the cultural statistics of Mixpanel in term of ratings related to overall work culture, CEO score, compensation, retention, office culture, environment, executive team, NPS Net Promoter Score etc. Deliver an awe inspiring pitch with this creative mixpanel capital raising pitch deck mixpanel cultural statistics topics pdf diagrams pdf bundle. Topics like office culture, retention, executive team, work culture, environment can be discussed with this completely editable template. It is available for immediate download depending on the needs and requirements of the user.
Retail Trading Platform Dashboard Tracking Essential Kpis For Ecommerce Performance Diagrams PDF
This slide provides information regarding essential KPIs for ecommerce performance dashboard tracking average bounce rate, new vs. old customers, channel revenue vs. channel acquisitions costs, channel revenue vs. sales, average conversion rate, etc. Deliver an awe inspiring pitch with this creative retail trading platform dashboard tracking essential kpis for ecommerce performance diagrams pdf bundle. Topics like average bounce rate, average conversion rate, bounce rate, channel revenue sales can be discussed with this completely editable template. It is available for immediate download depending on the needs and requirements of the user.
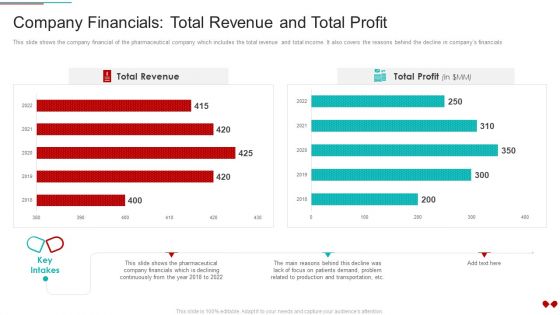
Environmental Impact Analysis For A Pharmaceutical Company Financials Total Revenue And Total Profit Diagrams PDF
This slide shows the company financial of the pharmaceutical company which includes the total revenue and total income. It also covers the reasons behind the decline in companys financialsDeliver an awe inspiring pitch with this creative Environmental Impact Analysis For A Pharmaceutical Company Financials Total Revenue And Total Profit Diagrams PDF bundle. Topics like Company Financials Total Revenue And Total Profit can be discussed with this completely editable template. It is available for immediate download depending on the needs and requirements of the user.
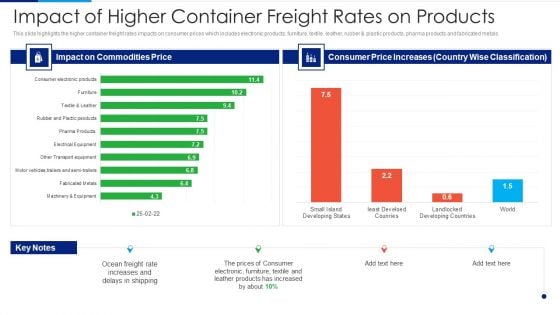
Russia Ukraine Conflict Effect Impact Of Higher Container Freight Rates On Products Diagrams PDF
This slide highlights the higher container freight rates impacts on consumer prices which includes electronic products, furniture, textile, leather, rubber and plastic products, pharma products and fabricated metals. Deliver an awe inspiring pitch with this creative Russia Ukraine Conflict Effect Impact Of Higher Container Freight Rates On Products Diagrams PDF bundle. Topics like Impact On Commodities Price, Consumer Price Increases, Ocean Freight Rate, Prices Of Consumer can be discussed with this completely editable template. It is available for immediate download depending on the needs and requirements of the user.
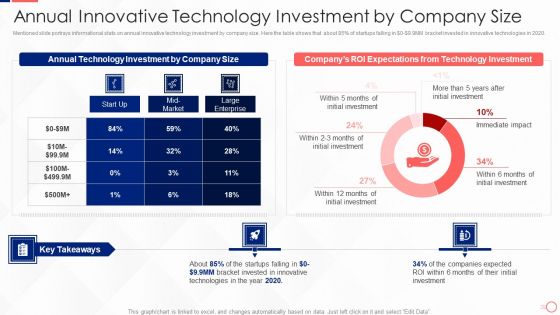
Investing In Tech Innovation Annual Innovative Technology Investment By Company Size Diagrams PDF
Mentioned slide portrays informational stats on annual innovative technology investment by company size. Here the table shows that about 85 percent of startups falling in Dollar 0- Dollar 9.9MM bracket invested in innovative technologies in 2020. Deliver an awe inspiring pitch with this creative Investing In Tech Innovation Annual Innovative Technology Investment By Company Size Diagrams PDF bundle. Topics like Annual Technology Investment, Company Size, ROI Expectations Technology, Initial Investment can be discussed with this completely editable template. It is available for immediate download depending on the needs and requirements of the user.
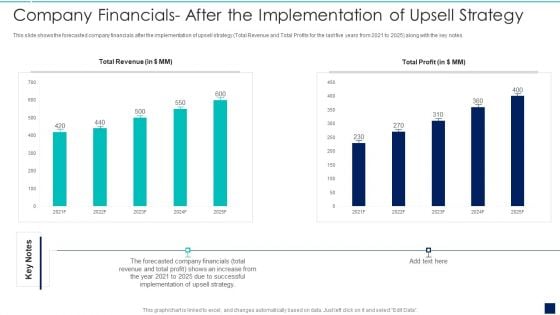
Influence Buyers To Purchase Additional High Company Financials After The Implementation Diagrams PDF
This slide shows the forecasted company financials after the implementation of upsell strategy total Revenue and Total Profits for the last five years from 2021 to 2025 along with the key notes.Deliver an awe inspiring pitch with this creative Influence Buyers To Purchase Additional High Company Financials After The Implementation Diagrams PDF bundle. Topics like Company Financials After The Implementation Of Upsell Strategy can be discussed with this completely editable template. It is available for immediate download depending on the needs and requirements of the user.
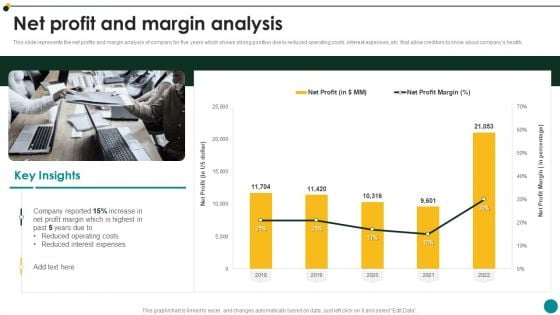
IT Services And Consulting Company Profile Net Profit And Margin Analysis Diagrams PDF
This slide represents the net profits and margin analysis of company for five years which shows strong position due to reduced operating costs, interest expenses, etc. that allow creditors to know about companys health.Deliver an awe inspiring pitch with this creative IT Services And Consulting Company Profile Net Profit And Margin Analysis Diagrams PDF bundle. Topics like Reduced Expenses, Reduced Operating Costs, Profit Highest can be discussed with this completely editable template. It is available for immediate download depending on the needs and requirements of the user.
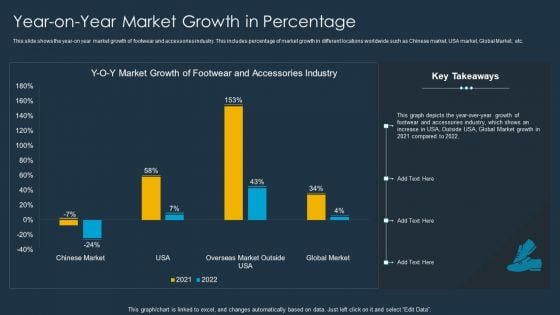
Shoe Firm Investor Pitch Deck Year On Year Market Growth In Percentage Diagrams PDF
This slide shows the year-on year market growth of footwear and accessories industry. This includes percentage of market growth in different locations worldwide such as Chinese market, USA market, Global Market, etc. Deliver an awe inspiring pitch with this creative Shoe Firm Investor Pitch Deck Year On Year Market Growth In Percentage Diagrams PDF bundle. Topics like Market Growth, Accessories Industry, Global Merket can be discussed with this completely editable template. It is available for immediate download depending on the needs and requirements of the user.
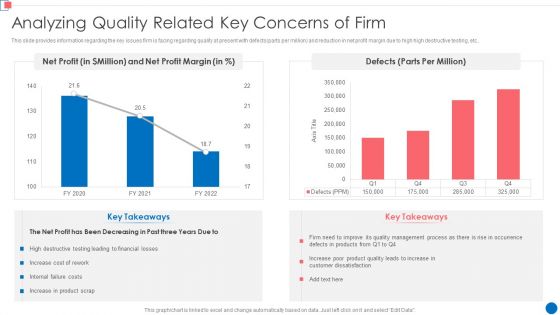
Optimize Enterprise Core Analyzing Quality Related Key Concerns Of Firm Diagrams PDF
This slide provides information regarding the key issues firm is facing regarding quality at present with defects parts per million and reduction in net profit margin due to high high destructive testing, etc. Deliver an awe inspiring pitch with this creative Optimize Enterprise Core Analyzing Quality Related Key Concerns Of Firm Diagrams PDF bundle. Topics like Net Profit, Net Profit Margin, 2020 To 2022 can be discussed with this completely editable template. It is available for immediate download depending on the needs and requirements of the user.
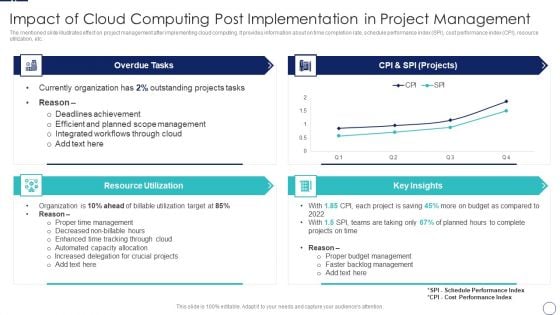
How To Implement Cloud Collaboration Impact Of Cloud Computing Post Implementation Diagrams PDF
The mentioned slide illustrates effect on project management after implementing cloud computing. It provides information about on time completion rate, schedule performance index SPI, cost performance index CPI, resource utilization, etc. Deliver an awe inspiring pitch with this creative How To Implement Cloud Collaboration Impact Of Cloud Computing Post Implementation Diagrams PDF bundle. Topics like Overdue Tasks, Resource Utilization, CPI And SPI can be discussed with this completely editable template. It is available for immediate download depending on the needs and requirements of the user.
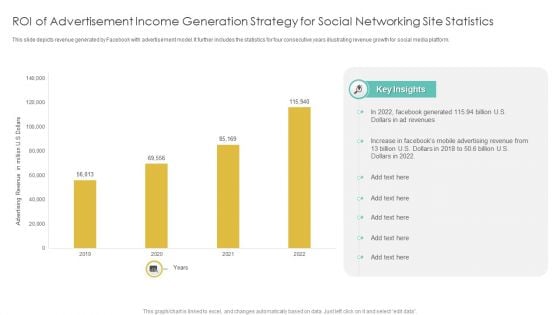
Roi Of Advertisement Income Generation Strategy For Social Networking Site Statistics Diagrams PDF
This slide depicts revenue generated by Facebook with advertisement model. It further includes the statistics for four consecutive years illustrating revenue growth for social media platform. Pitch your topic with ease and precision using this Roi Of Advertisement Income Generation Strategy For Social Networking Site Statistics Diagrams PDF. This layout presents information on Advertisement Income, Generation Strategy, Social Networking Site Statistics. It is also available for immediate download and adjustment. So, changes can be made in the color, design, graphics or any other component to create a unique layout.
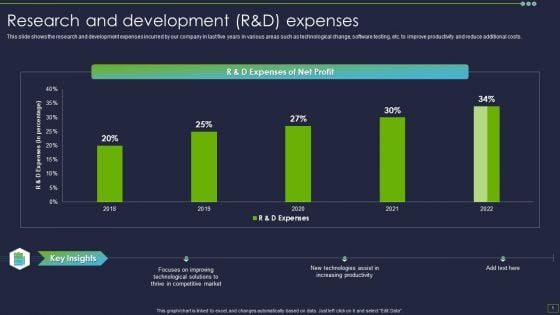
IT Consultancy Services Company Profile Research And Development Randd Expenses Diagrams PDF
This slide shows the research and development expenses incurred by our company in last five years in various areas such as technological change, software testing, etc. to improve productivity and reduce additional costs.Deliver an awe inspiring pitch with this creative IT Consultancy Services Company Profile Research And Development Randd Expenses Diagrams PDF bundle. Topics like Focuses Improving, Technological Solutions, Competitive Market can be discussed with this completely editable template. It is available for immediate download depending on the needs and requirements of the user.
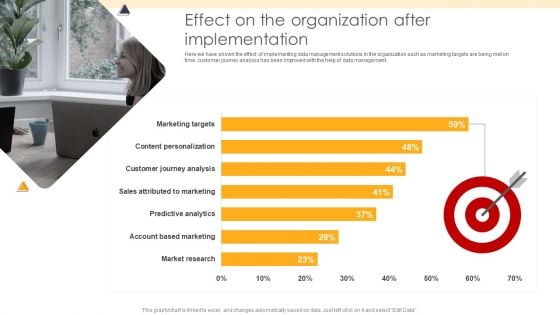
ETL Repository Effect On The Organization After Implementation Ppt PowerPoint Presentation Portfolio Diagrams PDF
Here we have shown the effect of implementing data management solutions in the organization such as marketing targets are being met on time, customer journey analysis has been improved with the help of data management. Deliver an awe inspiring pitch with this creative ETL Repository Effect On The Organization After Implementation Ppt PowerPoint Presentation Portfolio Diagrams PDF bundle. Topics like Market Research, Account Based, Sales Attributed can be discussed with this completely editable template. It is available for immediate download depending on the needs and requirements of the user.
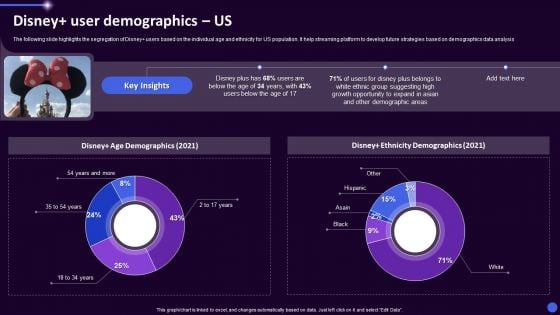
Disney Plus OTT Platform Company Summary Disney User Demographics Us Ppt Gallery Diagrams PDF
The following slide highlights the segregation of Disney users based on the individual age and ethnicity for US population. It help streaming platform to develop future strategies based on demographics data analysis. Deliver an awe inspiring pitch with this creative Disney Plus OTT Platform Company Summary Disney User Demographics Us Ppt Gallery Diagrams PDF bundle. Topics like Disney Ethnicity Demographics, Disney Age Demographics, 2021 can be discussed with this completely editable template. It is available for immediate download depending on the needs and requirements of the user.
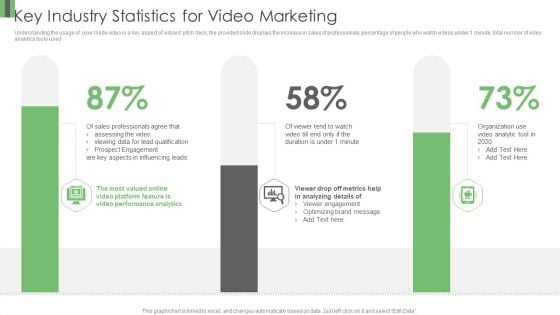
Vidyard Elevator Funding Key Industry Statistics For Video Marketing Ppt Show Diagrams PDF
Understanding the usage of user made video is a key aspect of vidyard pitch deck, the provided slide displays the increase in sales of professionals, percentage of people who watch videos under 1 minute, total number of video analytics tools used . Deliver an awe inspiring pitch with this creative Vidyard Elevator Funding Key Industry Statistics For Video Marketing Ppt Show Diagrams PDF bundle. Topics like Sales Professionals Agree, Prospect Engagement, Valued Online can be discussed with this completely editable template. It is available for immediate download depending on the needs and requirements of the user.
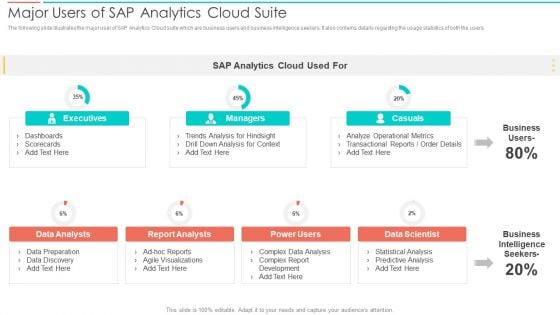
SAC Planning And Implementation Major Users Of SAP Analytics Cloud Suite Diagrams PDF
The following slide illustrates the major user of SAP Analytics Cloud suite which are business users and business intelligence seekers. It also contains details regarding the usage statistics of both the users. Deliver an awe inspiring pitch with this creative SAC Planning And Implementation Major Users Of SAP Analytics Cloud Suite Diagrams PDF bundle. Topics like Executives, Casuals, Business Intelligence Seekers, Data Scientist can be discussed with this completely editable template. It is available for immediate download depending on the needs and requirements of the user.
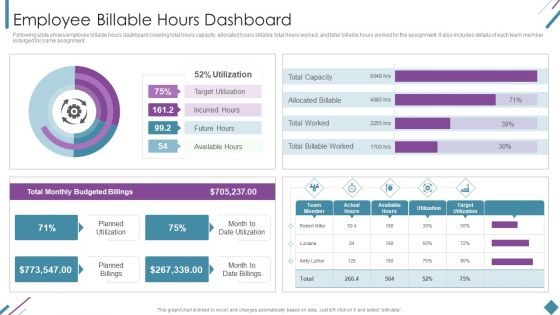
Metrics To Measure Business Performance Employee Billable Hours Dashboard Diagrams PDF
Following slide shows employee billable hours dashboard covering total hours capacity, allocated hours billable, total hours worked, and total billable hours worked for the assignment. It also includes details of each team member indulged for same assignment. Deliver an awe inspiring pitch with this creative Metrics To Measure Business Performance Employee Billable Hours Dashboard Diagrams PDF bundle. Topics like Total Monthly, Budgeted Billings, Planned Utilization can be discussed with this completely editable template. It is available for immediate download depending on the needs and requirements of the user.
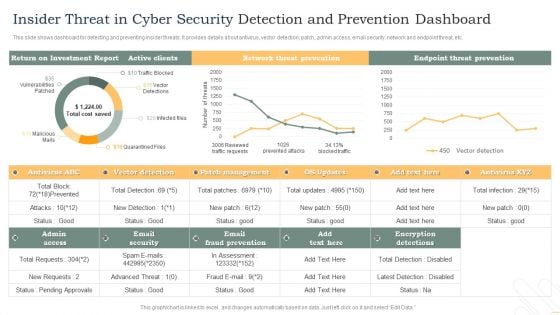
Insider Threat In Cyber Security Detection And Prevention Dashboard Diagrams PDF
This slide shows dashboard for detecting and preventing insider threats. It provides details about antivirus, vector detection, patch, admin access, email security, network and endpoint threat, etc. Pitch your topic with ease and precision using this Insider Threat In Cyber Security Detection And Prevention Dashboard Diagrams PDF. This layout presents information on Active Clients, Network Threat Prevention, Endpoint Threat Prevention. It is also available for immediate download and adjustment. So, changes can be made in the color, design, graphics or any other component to create a unique layout.
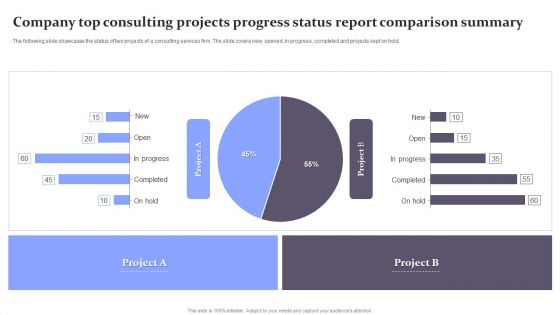
Company Top Consulting Projects Progress Status Report Comparison Summary Diagrams PDF
The following slide showcases the status of two projects of a consulting services firm. The slide covers new, opened, in progress, completed and projects kept on hold. Pitch your topic with ease and precision using this Company Top Consulting Projects Progress Status Report Comparison Summary Diagrams PDF. This layout presents information on Company Top Consulting Projects Progress, Status Report Comparison Summary. It is also available for immediate download and adjustment. So, changes can be made in the color, design, graphics or any other component to create a unique layout.
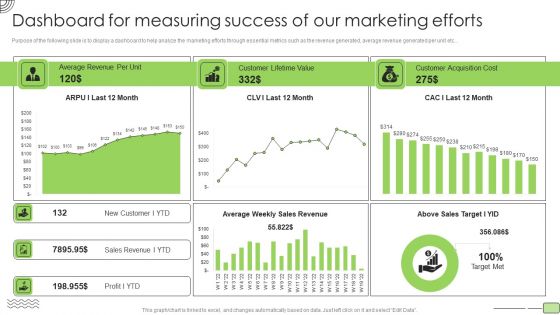
Organic Business Growth Strategies Dashboard For Measuring Success Of Our Marketing Efforts Diagrams PDF
Purpose of the following slide is to display a dashboard to help analyze the marketing efforts through essential metrics such as the revenue generated, average revenue generated per unit etc. Deliver an awe inspiring pitch with this creative Organic Business Growth Strategies Dashboard For Measuring Success Of Our Marketing Efforts Diagrams PDF bundle. Topics like Average Revenue, Customer Lifetime Value, Customer Acquisition Cost can be discussed with this completely editable template. It is available for immediate download depending on the needs and requirements of the user.
Precooked Food Industry Analysis KPI Dashboard For Tracking Supply Chain Costs Diagrams PDF
This slide represents the KPI dashboard to track the multiple cost associated with supply chain in food manufacturing industry. It includes information regarding cash to cash cycle in days, carry cost of inventory along with details of net sales.Deliver an awe inspiring pitch with this creative Precooked Food Industry Analysis KPI Dashboard For Tracking Supply Chain Costs Diagrams PDF bundle. Topics like Processing Industry, Food Processing, Manufacturing Industry can be discussed with this completely editable template. It is available for immediate download depending on the needs and requirements of the user.
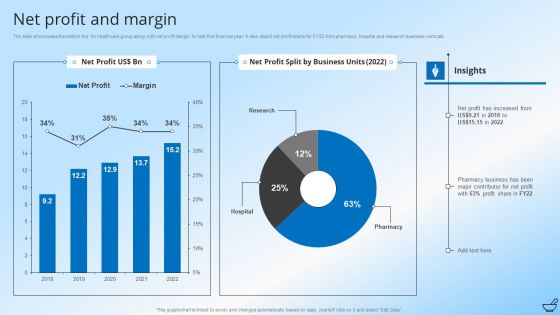
Pharmaceutical And Clinical Research Summary Net Profit And Margin Diagrams PDF
The slide showcases the bottom line for healthcare group along with net profit margin for last five financial year. It also depict net profit share for FY22 from pharmacy, hospital and research business verticals. Deliver an awe inspiring pitch with this creative Pharmaceutical And Clinical Research Summary Net Profit And Margin Diagrams PDF bundle. Topics like Pharmacy Business, Profit Share, Business Units can be discussed with this completely editable template. It is available for immediate download depending on the needs and requirements of the user.

Performance Analysis Using Operating Revenue Business Operational Expenditure And Income Metrics Diagrams PDF
This slide illustrates performance analysis using operating revenue, operating expenditure opex and income metrics which can be referred by organizations to evaluate their inflows and outflows to make relevant decisions for increasing profitability. It includes information about operating revenue, operating expense and income before taxes. Pitch your topic with ease and precision using this Performance Analysis Using Operating Revenue Business Operational Expenditure And Income Metrics Diagrams PDF. This layout presents information on Taxes, Highest Operating, Recorded. It is also available for immediate download and adjustment. So, changes can be made in the color, design, graphics or any other component to create a unique layout.
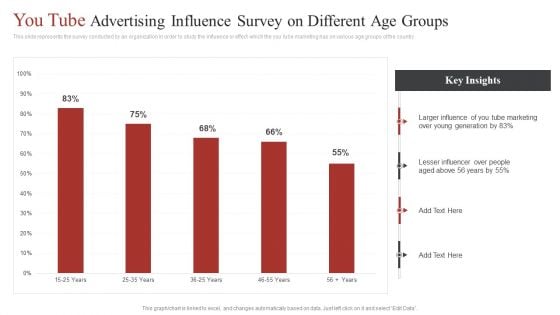
You Tube Advertising Influence Survey On Different Age Groups Ppt Diagram Ppt PDF
This slide represents the survey conducted by an organization in order to study the influence or effect which the you tube marketing has on various age groups of the country. Pitch your topic with ease and precision using this You Tube Advertising Influence Survey On Different Age Groups Ppt Diagram Ppt PDF. This layout presents information on Larger Influence, You Tube Marketing, Young Generation. It is also available for immediate download and adjustment. So, changes can be made in the color, design, graphics or any other component to create a unique layout.
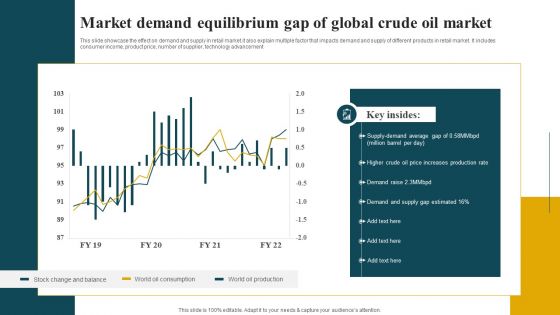
Market Demand Equilibrium Gap Of Global Crude Oil Market Diagrams PDF
This slide showcase the effect on demand and supply in retail market.it also explain multiple factor that impacts demand and supply of different products in retail market. It includes consumer income, product price, number of supplier, technology advancement. Pitch your topic with ease and precision using this Market Demand Equilibrium Gap Of Global Crude Oil Market Diagrams PDF. This layout presents information on Demand And Supply, Production Rate, Average. It is also available for immediate download and adjustment. So, changes can be made in the color, design, graphics or any other component to create a unique layout.
Glucometer Reading Chart In Powerpoint And Google Slides Cpb
Presenting our innovatively-designed set of slides titled Glucometer Reading Chart In Powerpoint And Google Slides Cpb. This completely editable PowerPoint graphic exhibits Glucometer Reading Chart that will help you convey the message impactfully. It can be accessed with Google Slides and is available in both standard screen and widescreen aspect ratios. Apart from this, you can download this well-structured PowerPoint template design in different formats like PDF, JPG, and PNG. So, click the download button now to gain full access to this PPT design. Our Glucometer Reading Chart In Powerpoint And Google Slides Cpb are topically designed to provide an attractive backdrop to any subject. Use them to look like a presentation pro.
Antihistamine Comparison Chart In Powerpoint And Google Slides Cpb
Presenting our innovatively-designed set of slides titled Antihistamine Comparison Chart In Powerpoint And Google Slides Cpb. This completely editable PowerPoint graphic exhibits Antihistamine Comparison Chart that will help you convey the message impactfully. It can be accessed with Google Slides and is available in both standard screen and widescreen aspect ratios. Apart from this, you can download this well-structured PowerPoint template design in different formats like PDF, JPG, and PNG. So, click the download button now to gain full access to this PPT design. Our Antihistamine Comparison Chart In Powerpoint And Google Slides Cpb are topically designed to provide an attractive backdrop to any subject. Use them to look like a presentation pro.
Morse Code Chart In Powerpoint And Google Slides Cpb
Presenting our innovatively-designed set of slides titled Morse Code Chart In Powerpoint And Google Slides Cpb. This completely editable PowerPoint graphic exhibits Morse Code Chart that will help you convey the message impactfully. It can be accessed with Google Slides and is available in both standard screen and widescreen aspect ratios. Apart from this, you can download this well-structured PowerPoint template design in different formats like PDF, JPG, and PNG. So, click the download button now to gain full access to this PPT design. Our Morse Code Chart In Powerpoint And Google Slides Cpb are topically designed to provide an attractive backdrop to any subject. Use them to look like a presentation pro.
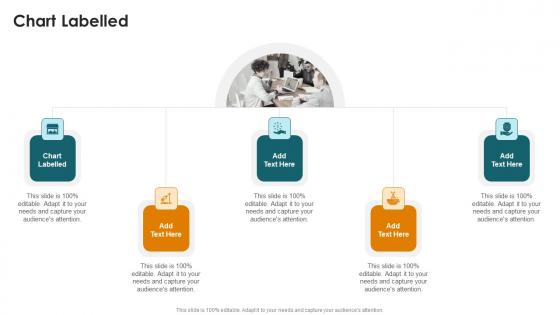
Chart Labelled In Powerpoint And Google Slides Cpb
Presenting our innovatively-designed set of slides titled Chart Labelled In Powerpoint And Google Slides Cpb. This completely editable PowerPoint graphic exhibits Chart Labelled that will help you convey the message impactfully. It can be accessed with Google Slides and is available in both standard screen and widescreen aspect ratios. Apart from this, you can download this well-structured PowerPoint template design in different formats like PDF, JPG, and PNG. So, click the download button now to gain full access to this PPT design. Our Chart Labelled In Powerpoint And Google Slides Cpb are topically designed to provide an attractive backdrop to any subject. Use them to look like a presentation pro.
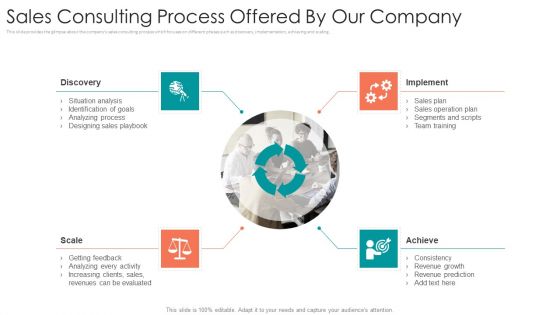
B2B Sales Procedure Counselling Sales Consulting Process Offered By Our Company Themes PDF
This slide provides the glimpse about the companys sales consulting process which focuses on different phases such as discovery, implementation, achieving and scaling. Presenting b2b sales procedure counselling sales consulting process offered by our company themes pdf to provide visual cues and insights. Share and navigate important information on four stages that need your due attention. This template can be used to pitch topics like scale, discovery, implement, achieve. In addition, this PPT design contains high-resolution images, graphics, etc, that are easily editable and available for immediate download.
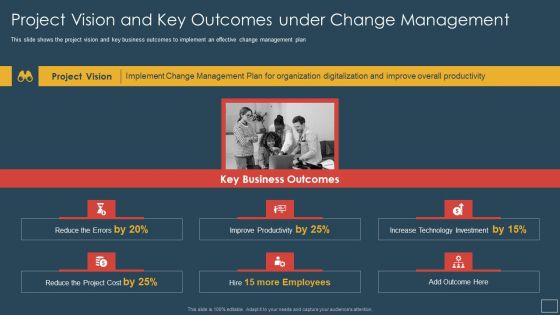
Responsibility Project Management Office Team Support Digital Company Project Vision And Key Themes PDF
This slide shows the three phases of portfolio management maturity model Project Management, Program Management, and Portfolio Management. Presenting responsibility project management office team support digital company project vision and key themes pdf to provide visual cues and insights. Share and navigate important information on three stages that need your due attention. This template can be used to pitch topics like program management, portfolio management, cost, organizational. In addtion, this PPT design contains high resolution images, graphics, etc, that are easily editable and available for immediate download.
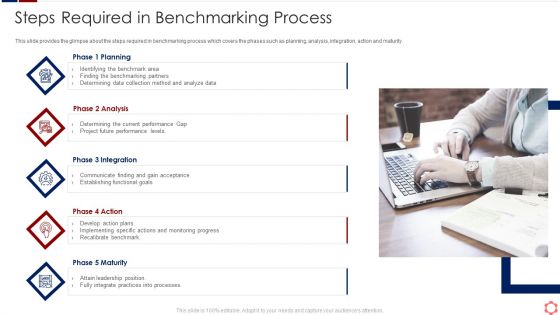
Business Operation Modeling Approaches Steps Required In Benchmarking Process Themes PDF
This slide provides the glimpse about the steps required in benchmarking process which covers the phases such as planning, analysis, integration, action and maturity.Presenting business operation modeling approaches steps required in benchmarking process themes pdf to provide visual cues and insights. Share and navigate important information on five stages that need your due attention. This template can be used to pitch topics like communicate finding, establishing functional goals, implementing specific actions In addtion, this PPT design contains high resolution images, graphics, etc, that are easily editable and available for immediate download.

Internet Security Threat Analysis Report Chart Introduction PDF
Following slide exhibits security and data breach report chart it includes major statistics such as- loss or theft of data, failure to redirect data and data posting to incorrect recipient. Pitch your topic with ease and precision using this internet security threat analysis report chart introduction pdf. This layout presents information on internet security threat analysis report chart. It is also available for immediate download and adjustment. So, changes can be made in the color, design, graphics or any other component to create a unique layout.
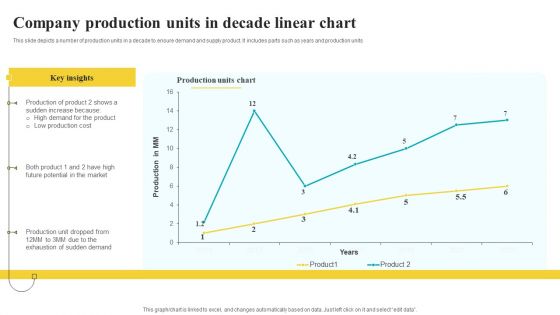
Company Production Units In Decade Linear Chart Designs PDF
This slide depicts a number of production units in a decade to ensure demand and supply product. It includes parts such as years and production units Pitch your topic with ease and precision using this Company Production Units In Decade Linear Chart Designs PDF. This layout presents information on Key Insights, Production Units Chart, Linear Chart. It is also available for immediate download and adjustment. So, changes can be made in the color, design, graphics or any other component to create a unique layout.
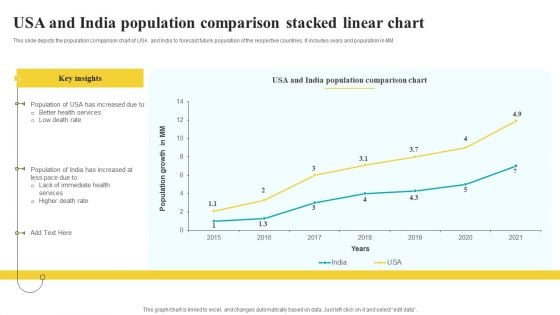
Usa And India Population Comparison Stacked Linear Chart Guidelines PDF
This slide depicts the population comparison chart of USA and India to forecast future population of the respective countries. It includes years and population in MM Pitch your topic with ease and precision using this Usa And India Population Comparison Stacked Linear Chart Guidelines PDF. This layout presents information on Key Insights, Population Growth, Comparison Chart. It is also available for immediate download and adjustment. So, changes can be made in the color, design, graphics or any other component to create a unique layout.
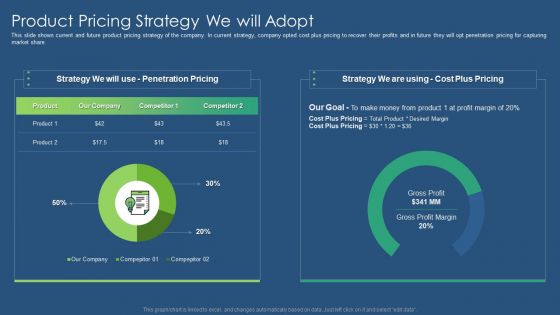
Sustainability Calculation With KPI Product Pricing Strategy We Will Adopt Information PDF Diagrams PDF
This slide shows current and future product pricing strategy of the company. In current strategy, company opted cost plus pricing to recover their profits and in future they will opt penetration pricing for capturing market share. Deliver an awe inspiring pitch with this creative sustainability calculation with kpi product pricing strategy we will adopt information pdf bundle. Topics like gross profit margin, cost plus pricing, penetration pricing can be discussed with this completely editable template. It is available for immediate download depending on the needs and requirements of the user.
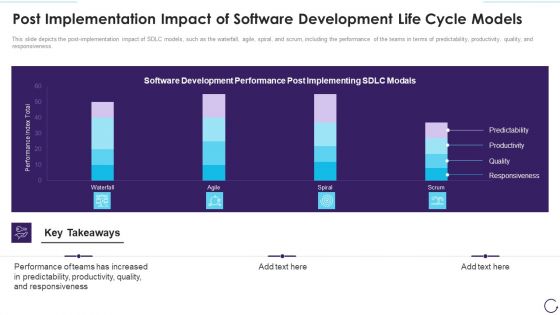
Post Implementation Impact Of Software Development Life Cycle Models Diagrams PDF
This slide depicts the post-implementation impact of SDLC models, such as the waterfall, agile, spiral, and scrum, including the performance of the teams in terms of predictability, productivity, quality, and responsiveness. Deliver an awe inspiring pitch with this creative overview of the software development life cycle company demonstration pdf bundle. Topics like maintenance of the product, requirement gathering and analysis, deployment in the market can be discussed with this completely editable template. It is available for immediate download depending on the needs and requirements of the user.
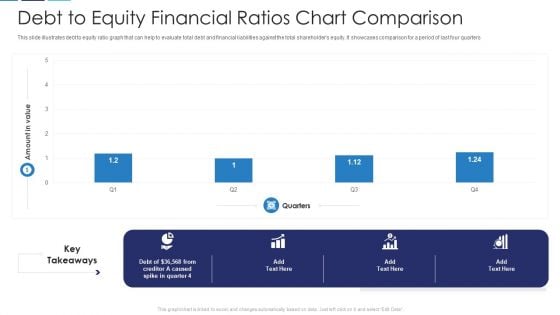
Debt To Equity Financial Ratios Chart Comparison Download PDF
This slide illustrates debt to equity ratio graph that can help to evaluate total debt and financial liabilities against the total shareholders equity. It showcases comparison for a period of last four quarters Pitch your topic with ease and precision using this debt to equity financial ratios chart comparison download pdf. This layout presents information on debt to equity financial ratios chart comparison. It is also available for immediate download and adjustment. So, changes can be made in the color, design, graphics or any other component to create a unique layout.
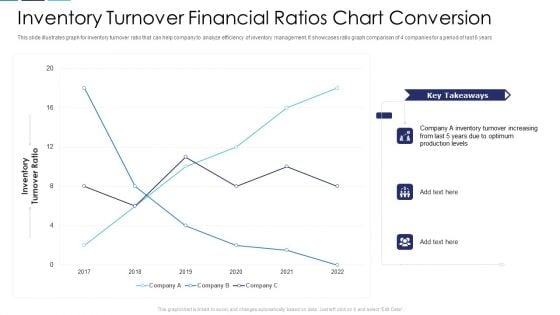
Inventory Turnover Financial Ratios Chart Conversion Portrait PDF
This slide illustrates graph for inventory turnover ratio that can help company to analyze efficiency of inventory management. It showcases ratio graph comparison of 4 companies for a period of last 6 years Pitch your topic with ease and precision using this inventory turnover financial ratios chart conversion portrait pdf. This layout presents information on inventory turnover financial ratios chart conversion. It is also available for immediate download and adjustment. So, changes can be made in the color, design, graphics or any other component to create a unique layout.
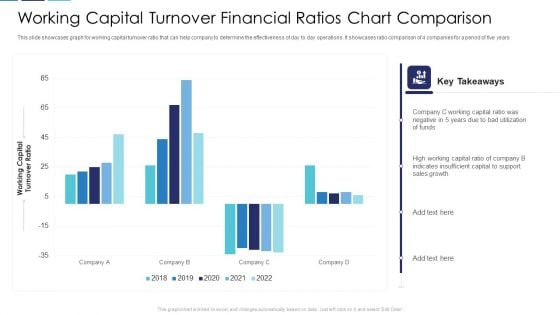
Working Capital Turnover Financial Ratios Chart Comparison Clipart PDF
This slide showcases graph for working capital turnover ratio that can help company to determine the effectiveness of day to day operations. It showcases ratio comparison of 4 companies for a period of five years Pitch your topic with ease and precision using this working capital turnover financial ratios chart comparison clipart pdf. This layout presents information on working capital turnover financial ratios chart comparison. It is also available for immediate download and adjustment. So, changes can be made in the color, design, graphics or any other component to create a unique layout.

 Home
Home