Availability Icon
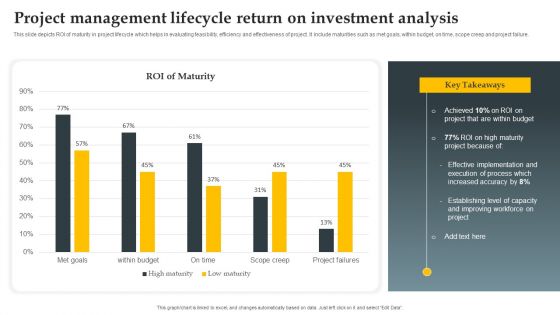
Project Management Lifecycle Return On Investment Analysis Demonstration PDF
This slide depicts ROI of maturity in project lifecycle which helps in evaluating feasibility, efficiency and effectiveness of project. It include maturities such as met goals, within budget, on time, scope creep and project failure. Pitch your topic with ease and precision using this Project Management Lifecycle Return On Investment Analysis Demonstration PDF. This layout presents information on Implementation, Execution Of Process, Budget. It is also available for immediate download and adjustment. So, changes can be made in the color, design, graphics or any other component to create a unique layout.
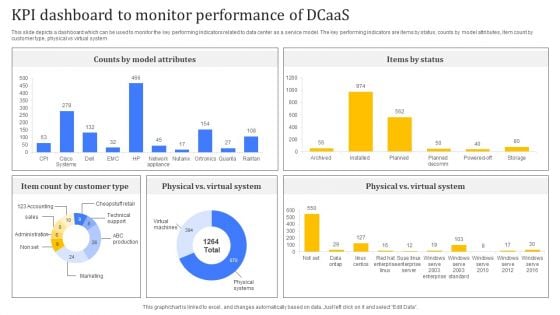
KPI Dashboard To Monitor Performance Of Dcaas Pictures PDF
Following slide highlights major benefits of applying data center as a service to business operations which can be used by businesses looking to modernize their IT infrastructure. Major benefits are in terms of scalability, flexibility, cost effectiveness, and security. Pitch your topic with ease and precision using this KPI Dashboard To Monitor Performance Of Dcaas Pictures PDF. This layout presents information on Customer Type, Counts By Model Attributes, Items By Status. It is also available for immediate download and adjustment. So, changes can be made in the color, design, graphics or any other component to create a unique layout.
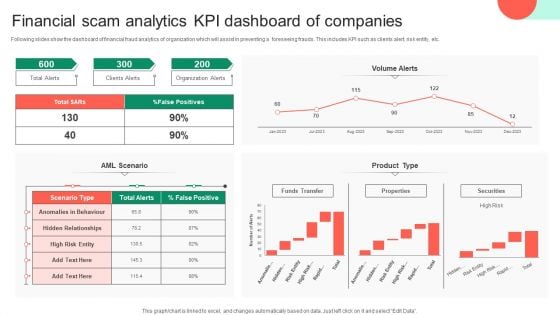
Financial Scam Analytics KPI Dashboard Of Companies Clipart PDF
Following slides show the dashboard of financial fraud analytics of organization which will assist in preventing a foreseeing frauds. This includes KPI such as clients alert, risk entity, etc. Pitch your topic with ease and precision using this Financial Scam Analytics KPI Dashboard Of Companies Clipart PDF. This layout presents information on Financial Scam Analytics, Kpi Dashboard Of Companies. It is also available for immediate download and adjustment. So, changes can be made in the color, design, graphics or any other component to create a unique layout.
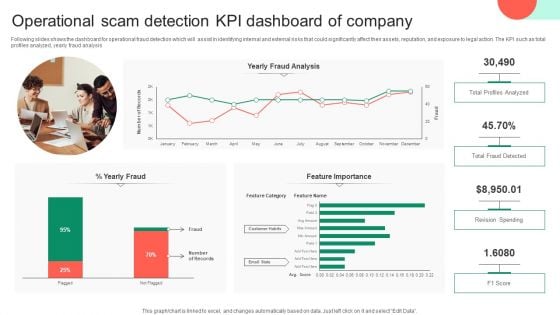
Operational Scam Detection KPI Dashboard Of Company Topics PDF
Following slides shows the dashboard for operational fraud detection which will assist in identifying internal and external risks that could significantly affect their assets, reputation, and exposure to legal action. The KPI such as total profiles analyzed, yearly fraud analysis. Pitch your topic with ease and precision using this Operational Scam Detection KPI Dashboard Of Company Topics PDF. This layout presents information on Profiles Analyzed, Operational Scam Detection, Kpi Dashboard Of Company. It is also available for immediate download and adjustment. So, changes can be made in the color, design, graphics or any other component to create a unique layout.
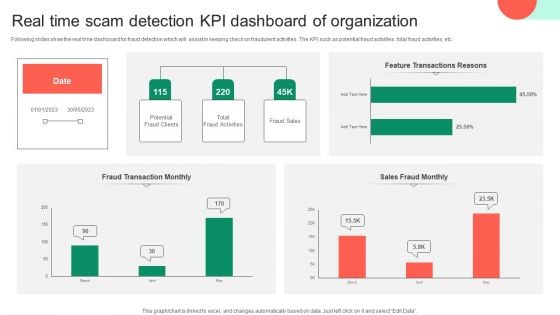
Real Time Scam Detection KPI Dashboard Of Organization Information PDF
Following slides show the real time dashboard for fraud detection which will assist in keeping check on fraudulent activities. The KPI such as potential fraud activities, total fraud activities, etc. Pitch your topic with ease and precision using this Real Time Scam Detection KPI Dashboard Of Organization Information PDF. This layout presents information on Real Time Scam Detection, Kpi Dashboard Of Organization. It is also available for immediate download and adjustment. So, changes can be made in the color, design, graphics or any other component to create a unique layout.
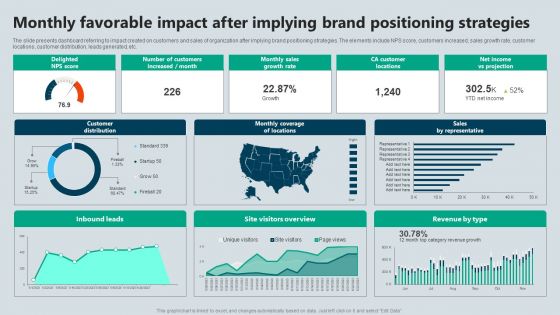
Monthly Favorable Impact After Implying Brand Positioning Strategies Demonstration PDF
The slide presents dashboard referring to impact created on customers and sales of organization after implying brand positioning strategies. The elements include NPS score, customers increased, sales growth rate, customer locations, customer distribution, leads generated, etc. Pitch your topic with ease and precision using this Monthly Favorable Impact After Implying Brand Positioning Strategies Demonstration PDF. This layout presents information on Strategies, Projection, Growth Rate. It is also available for immediate download and adjustment. So, changes can be made in the color, design, graphics or any other component to create a unique layout.
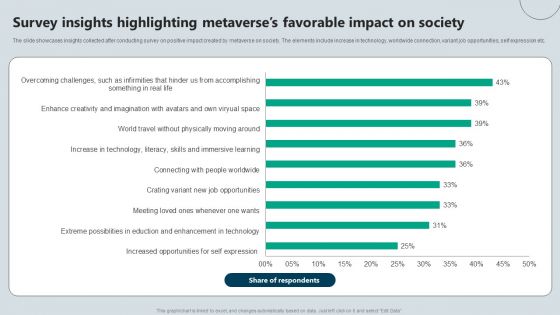
Survey Insights Highlighting Metaverses Favorable Impact On Society Background PDF
The slide showcases insights collected after conducting survey on positive impact created by metaverse on society. The elements include increase in technology, worldwide connection, variant job opportunities, self expression etc. Pitch your topic with ease and precision using this Survey Insights Highlighting Metaverses Favorable Impact On Society Background PDF. This layout presents information on Respondents, Society, Survey. It is also available for immediate download and adjustment. So, changes can be made in the color, design, graphics or any other component to create a unique layout.
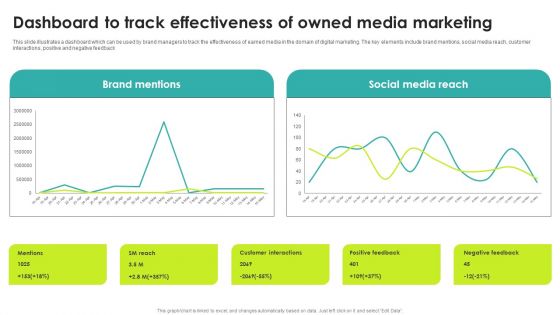
Dashboard To Track Effectiveness Of Owned Media Marketing Structure PDF
This slide illustrates a dashboard which can be used by brand managers to track the effectiveness of earned media in the domain of digital marketing. The key elements include brand mentions, social media reach, customer interactions, positive and negative feedback Pitch your topic with ease and precision using this Dashboard To Track Effectiveness Of Owned Media Marketing Structure PDF. This layout presents information on Brand Mentions, Social Media, Marketing. It is also available for immediate download and adjustment. So, changes can be made in the color, design, graphics or any other component to create a unique layout.
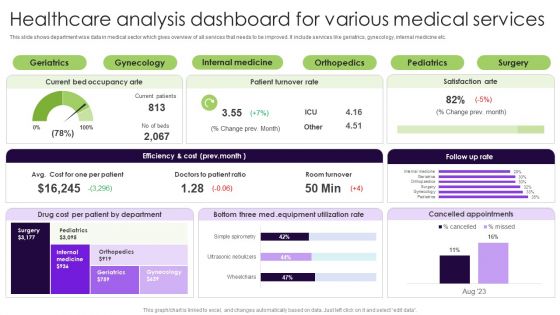
Healthcare Analysis Dashboard For Various Medical Services Ideas PDF
This slide shows department wise data in medical sector which gives overview of all services that needs to be improved. It include services like geriatrics, gynecology, internal medicine etc. Pitch your topic with ease and precision using this Healthcare Analysis Dashboard For Various Medical Services Ideas PDF. This layout presents information on Equipment Utilization Rate, Drug Cost Per Patient, Internal Medicine. It is also available for immediate download and adjustment. So, changes can be made in the color, design, graphics or any other component to create a unique layout.
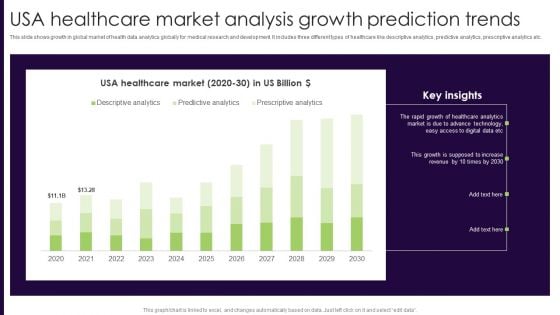
USA Healthcare Market Analysis Growth Prediction Trends Inspiration PDF
This slide shows growth in global market of health data analytics globally for medical research and development. It includes three different types of healthcare like descriptive analytics, predictive analytics, prescriptive analytics etc. Pitch your topic with ease and precision using this USA Healthcare Market Analysis Growth Prediction Trends Inspiration PDF. This layout presents information on USA Healthcare Market Analysis, Growth Prediction Trends. It is also available for immediate download and adjustment. So, changes can be made in the color, design, graphics or any other component to create a unique layout.

SAP Robotic Process Automation Impact On Business Growth Template PDF
Mentioned slide showcases statistics of SAP robotic process automation impact on business to determine organisational growth. It includes key components such as business productivity, cost effectiveness, process efficiency, operational excellence, workflow optimization, etc. Pitch your topic with ease and precision using this SAP Robotic Process Automation Impact On Business Growth Template PDF. This layout presents information on Productivity, Process Completion, Resource Investment. It is also available for immediate download and adjustment. So, changes can be made in the color, design, graphics or any other component to create a unique layout.
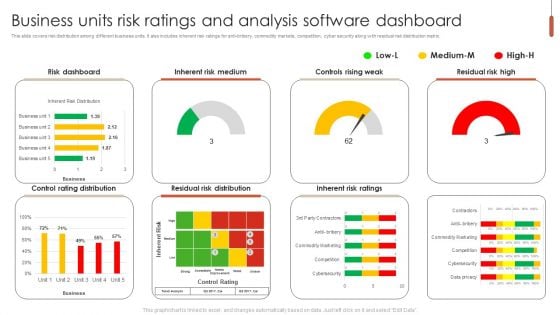
Business Units Risk Ratings And Analysis Software Dashboard Ideas PDF
This slide covers risk distribution among different business units. It also includes inherent risk ratings for anti-bribery, commodity markets, competition, cyber security along with residual risk distribution matrix. Pitch your topic with ease and precision using this Business Units Risk Ratings And Analysis Software Dashboard Ideas PDF. This layout presents information on Risk Dashboard, Inherent Risk Medium, Controls Rising Weak. It is also available for immediate download and adjustment. So, changes can be made in the color, design, graphics or any other component to create a unique layout.
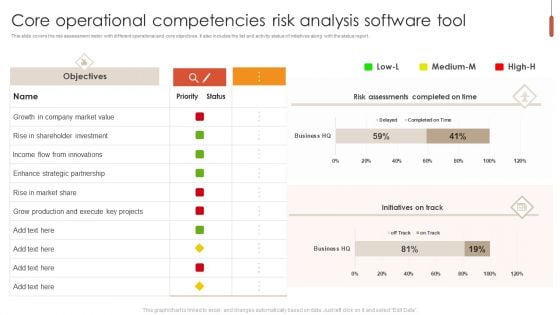
Core Operational Competencies Risk Analysis Software Tool Graphics PDF
This slide covers the risk assessment meter with different operational and core objectives. It also includes the list and activity status of initiatives along with the status report. Pitch your topic with ease and precision using this Core Operational Competencies Risk Analysis Software Tool Graphics PDF. This layout presents information on Strategic Partnership, Market Value, Shareholder Investment. It is also available for immediate download and adjustment. So, changes can be made in the color, design, graphics or any other component to create a unique layout.
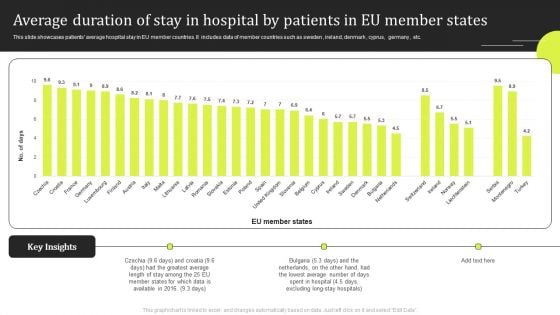
Average Duration Of Stay In Hospital By Patients In EU Member States Slides PDF
This slide showcases patients average hospital stay in EU member countries. It includes data of member countries such as sweden , ireland, denmark , cyprus, germany , etc. Pitch your topic with ease and precision using this Average Duration Of Stay In Hospital By Patients In EU Member States Slides PDF. This layout presents information on Greatest Average, Key Insights. It is also available for immediate download and adjustment. So, changes can be made in the color, design, graphics or any other component to create a unique layout.
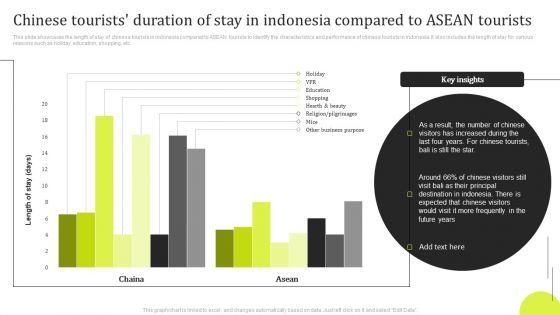
Chinese Tourists Duration Of Stay In Indonesia Compared To ASEAN Tourists Brochure PDF
This slide showcases the length of stay of chinese tourists in indonesia compared to ASEAN tourists to identify the characteristics and performance of chinese tourists in indonesia. It also includes the length of stay for various reasons such as holiday, education, shopping, etc. Pitch your topic with ease and precision using this Chinese Tourists Duration Of Stay In Indonesia Compared To ASEAN Tourists Brochure PDF. This layout presents information on Chinese Tourists Duration, Indonesia Compared, Asean Tourists. It is also available for immediate download and adjustment. So, changes can be made in the color, design, graphics or any other component to create a unique layout.
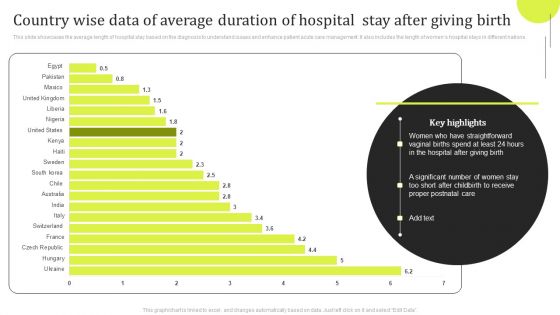
Country Wise Data Of Average Duration Of Hospital Stay After Giving Birth Designs PDF
This slide showcases the average length of hospital stay based on the diagnosis to understand issues and enhance patient acute care management. It also includes the length of womens hospital stays in different nations. Pitch your topic with ease and precision using this Country Wise Data Of Average Duration Of Hospital Stay After Giving Birth Designs PDF. This layout presents information on Country Wise Data, Average Duration. It is also available for immediate download and adjustment. So, changes can be made in the color, design, graphics or any other component to create a unique layout.
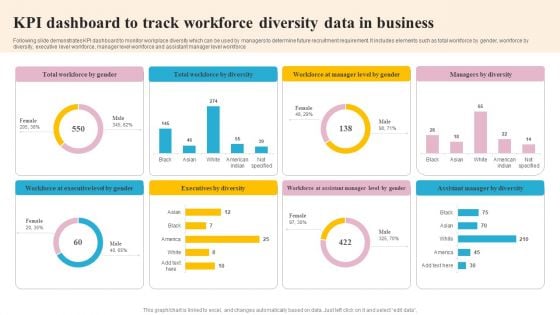
KPI Dashboard To Track Workforce Diversity Data In Business Mockup PDF
Following slide demonstrates KPI dashboard to monitor workplace diversity which can be used by managers to determine future recruitment requirement. It includes elements such as total workforce by gender, workforce by diversity, executive level workforce, manager level workforce and assistant manager level workforce. Pitch your topic with ease and precision using this KPI Dashboard To Track Workforce Diversity Data In Business Mockup PDF. This layout presents information on Executives By Diversity, Workforce By Diversity, Executive Level By Gender. It is also available for immediate download and adjustment. So, changes can be made in the color, design, graphics or any other component to create a unique layout.
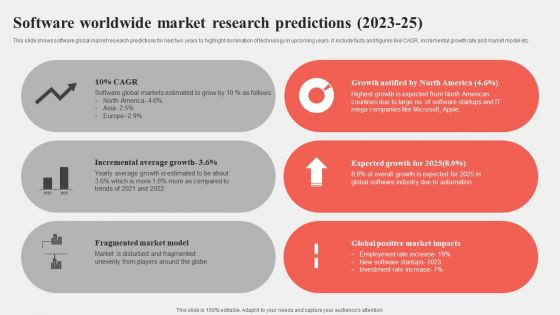
Software Worldwide Market Research Predictions 2023 25 Graphics PDF
This slide shows software global market research predictions for next two years to highlight domination of technology in upcoming years. It include facts and figures like CAGR, incremental growth rate and market model etc Pitch your topic with ease and precision using this Software Worldwide Market Research Predictions 2023 25 Graphics PDF. This layout presents information on Average Growth, Market Model, Market Impacts. It is also available for immediate download and adjustment. So, changes can be made in the color, design, graphics or any other component to create a unique layout.
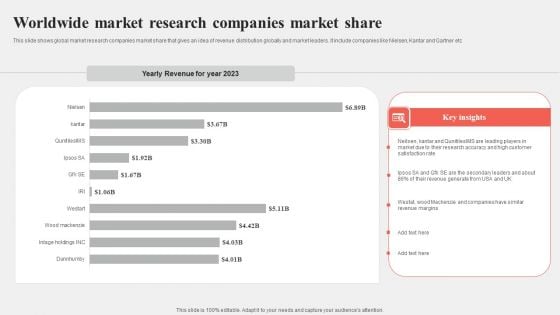
Worldwide Market Research Companies Market Share Portrait PDF
This slide shows global market research companies market share that gives an idea of revenue distribution globally and market leaders. It include companies like Nielsen, Kantar and Gartner etc Pitch your topic with ease and precision using this Worldwide Market Research Companies Market Share Portrait PDF. This layout presents information on Market Share, Key Insights, Worldwide. It is also available for immediate download and adjustment. So, changes can be made in the color, design, graphics or any other component to create a unique layout.
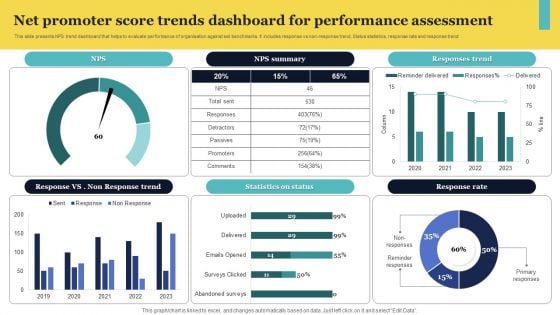
Net Promoter Score Trends Dashboard For Performance Assessment Elements PDF
This slide presents NPS trend dashboard that helps to evaluate performance of organisation against set benchmarks. It includes response vs non-response trend, Status statistics, response rate and response trend Pitch your topic with ease and precision using this Net Promoter Score Trends Dashboard For Performance Assessment Elements PDF. This layout presents information on Response Trend, Summary, Status. It is also available for immediate download and adjustment. So, changes can be made in the color, design, graphics or any other component to create a unique layout.
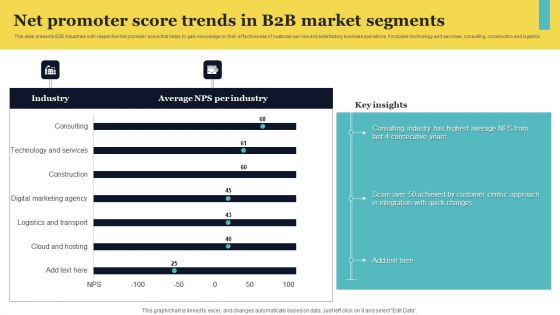
Net Promoter Score Trends In B2b Market Segments Pictures PDF
This slide presents B2B industries with respective Net promoter score that helps to gain knowledge on their effectiveness of customer service and satisfactory business operations. It includes technology and services, consulting, construction and logistics Pitch your topic with ease and precision using this Net Promoter Score Trends In B2b Market Segments Pictures PDF. This layout presents information on Key Insights, Segments, Promoter. It is also available for immediate download and adjustment. So, changes can be made in the color, design, graphics or any other component to create a unique layout.
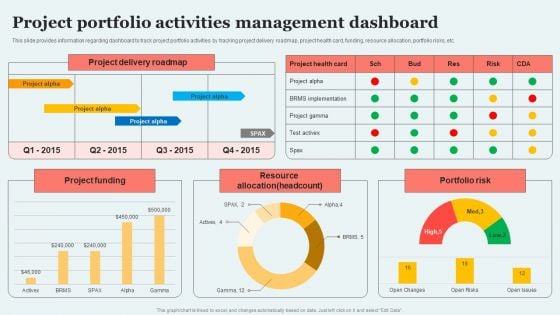
Project Portfolio Activities Management Dashboard Introduction PDF
This slide provides information regarding dashboard to track project portfolio activities by tracking project delivery roadmap, project health card, funding, resource allocation, portfolio risks, etc. This Project Portfolio Activities Management Dashboard Introduction PDF from Slidegeeks makes it easy to present information on your topic with precision. It provides customization options, so you can make changes to the colors, design, graphics, or any other component to create a unique layout. It is also available for immediate download, so you can begin using it right away. Slidegeeks has done good research to ensure that you have everything you need to make your presentation stand out. Make a name out there for a brilliant performance.
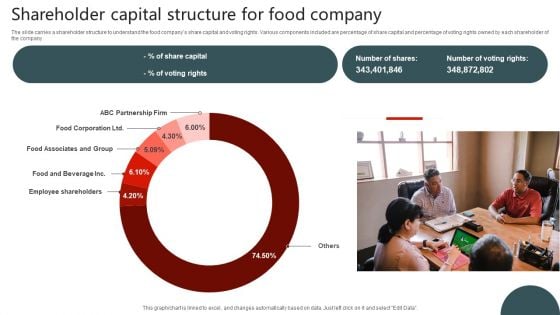
Shareholder Capital Structure For Food Company Inspiration PDF
The slide carries a shareholder structure to understand the food companys share capital and voting rights. Various components included are percentage of share capital and percentage of voting rights owned by each shareholder of the company. Pitch your topic with ease and precision using this Shareholder Capital Structure For Food Company Inspiration PDF. This layout presents information on Shareholder Capital Structure, Food Company. It is also available for immediate download and adjustment. So, changes can be made in the color, design, graphics or any other component to create a unique layout.
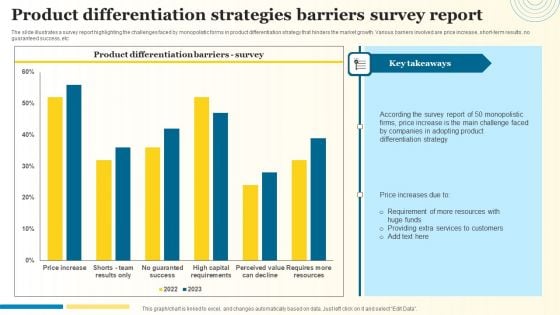
Product Differentiation Strategies Barriers Survey Report Introduction PDF
The slide illustrates a survey report highlighting the challenges faced by monopolistic forms in product differentiation strategy that hinders the market growth. Various barriers involved are price increase, short-term results, no guaranteed success, etc. Pitch your topic with ease and precision using this Product Differentiation Strategies Barriers Survey Report Introduction PDF. This layout presents information on Differentiation Strategy, Adopting Product, Price Increase. It is also available for immediate download and adjustment. So, changes can be made in the color, design, graphics or any other component to create a unique layout.
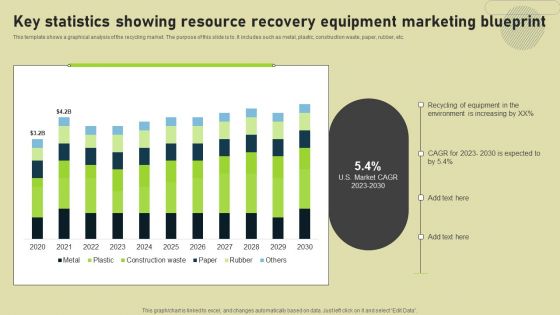
Key Statistics Showing Resource Recovery Equipment Marketing Blueprint Graphics PDF
This template shows a graphical analysis of the recycling market. The purpose of this slide is to. It includes such as metal, plastic, construction waste, paper, rubber, etc. Pitch your topic with ease and precision using this Key Statistics Showing Resource Recovery Equipment Marketing Blueprint Graphics PDF. This layout presents information on Equipment, Environment, Marketing Blueprint. It is also available for immediate download and adjustment. So, changes can be made in the color, design, graphics or any other component to create a unique layout.
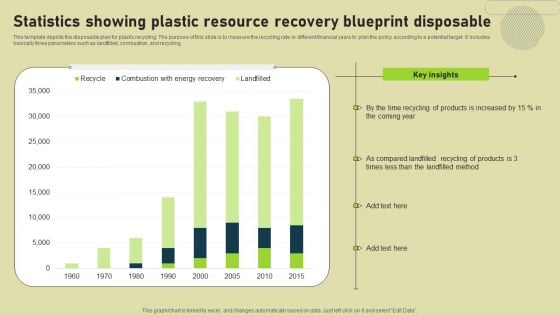
Statistics Showing Plastic Resource Recovery Blueprint Disposable Elements PDF
This template depicts the disposable plan for plastic recycling. The purpose of this slide is to measure the recycling rate in different financial years to plan the policy according to a potential target. It includes basically three parameters such as landfilled, combustion, and recycling. Pitch your topic with ease and precision using this Statistics Showing Plastic Resource Recovery Blueprint Disposable Elements PDF. This layout presents information on Products, Key Insights, Resource Recovery Blueprint Disposable. It is also available for immediate download and adjustment. So, changes can be made in the color, design, graphics or any other component to create a unique layout.
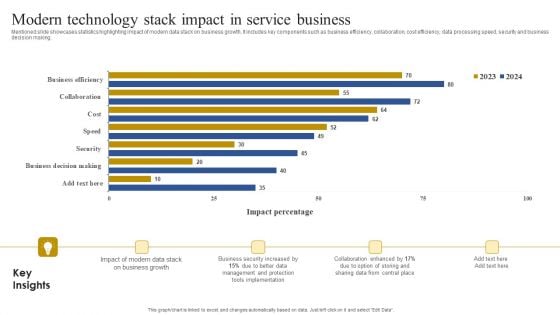
Modern Technology Stack Impact In Service Business Clipart PDF
Mentioned slide showcases statistics highlighting impact of modern data stack on business growth. It includes key components such as business efficiency, collaboration, cost efficiency, data processing speed, security and business decision making. Pitch your topic with ease and precision using this Modern Technology Stack Impact In Service Business Clipart PDF. This layout presents information on Business Security, Implementation, Management And Protection. It is also available for immediate download and adjustment. So, changes can be made in the color, design, graphics or any other component to create a unique layout.
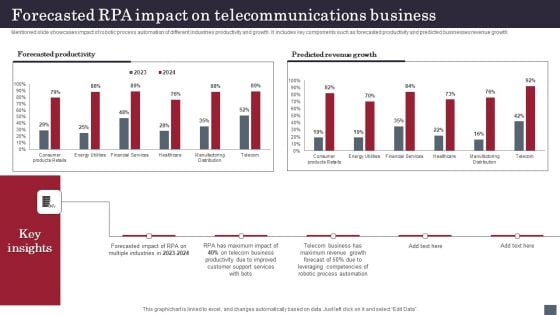
Forecasted RPA Impact On Telecommunications Business Professional PDF
Mentioned slide showcases impact of robotic process automation of different industries productivity and growth. It includes key components such as forecasted productivity and predicted businesses revenue growth. Pitch your topic with ease and precision using this Forecasted RPA Impact On Telecommunications Business Professional PDF. This layout presents information on Forecasted Productivity, Predicted Revenue Growth, Telecom Business. It is also available for immediate download and adjustment. So, changes can be made in the color, design, graphics or any other component to create a unique layout.
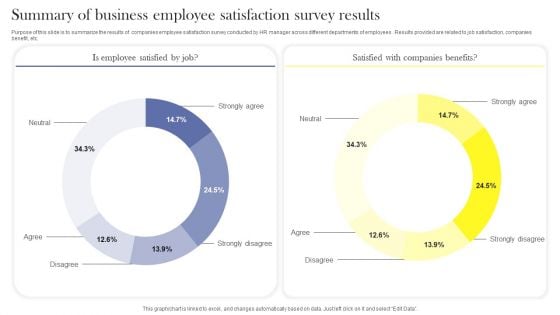
Summary Of Business Employee Satisfaction Survey Results Survey SS
Purpose of this slide is to summarize the results of companies employee satisfaction survey conducted by HR manager across different departments of employees . Results provided are related to job satisfaction, companies benefit, etc. Pitch your topic with ease and precision using this Summary Of Business Employee Satisfaction Survey Results Survey SS. This layout presents information on Neutral, Strongly Agree, Strongly Disagree, Disagree, Agree. It is also available for immediate download and adjustment. So, changes can be made in the color, design, graphics or any other component to create a unique layout.
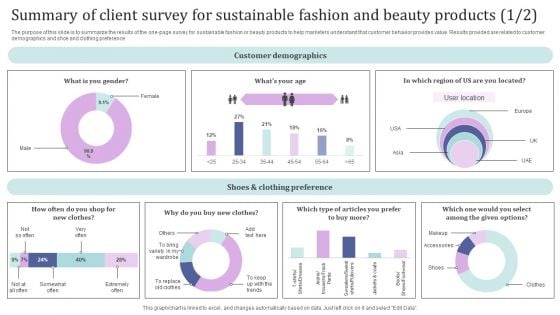
Summary Of Client Survey For Sustainable Fashion And Beauty Products Survey SS
The purpose of this slide is to summarize the results of the one-page survey for sustainable fashion or beauty products to help marketers understand that customer behavior provides value. Results provided are related to customer demographics and shoe and clothing preference. Pitch your topic with ease and precision using this Summary Of Client Survey For Sustainable Fashion And Beauty Products Survey SS. This layout presents information on Customer Demographics, Shoes And Clothing Preference, User Location. It is also available for immediate download and adjustment. So, changes can be made in the color, design, graphics or any other component to create a unique layout.
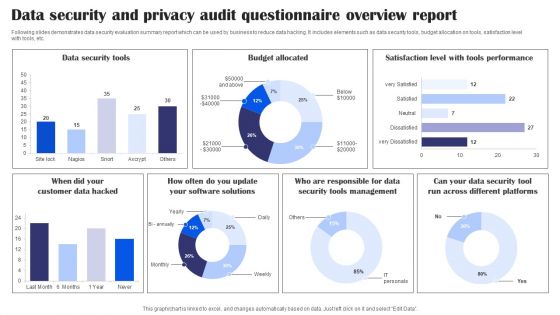
Data Security And Privacy Audit Questionnaire Overview Report Survey SS
Following slides demonstrates data security evaluation summary report which can be used by business to reduce data hacking. It includes elements such as data security tools, budget allocation on tools, satisfaction level with tools, etc. Pitch your topic with ease and precision using this Data Security And Privacy Audit Questionnaire Overview Report Survey SS. This layout presents information on Data Security Tools, Budget Allocated, Tools Performance, Data Security Tools Management. It is also available for immediate download and adjustment. So, changes can be made in the color, design, graphics or any other component to create a unique layout.
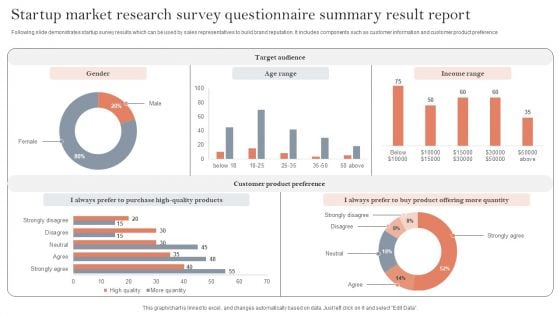
Startup Market Research Survey Questionnaire Summary Result Report Survey SS
Following slide demonstrates startup survey results which can be used by sales representatives to build brand reputation. It includes components such as customer information and customer product preference. Pitch your topic with ease and precision using this Startup Market Research Survey Questionnaire Summary Result Report Survey SS. This layout presents information on Target Audience, Customer Product Preference, Income Range, Purchase High-Quality Products. It is also available for immediate download and adjustment. So, changes can be made in the color, design, graphics or any other component to create a unique layout.
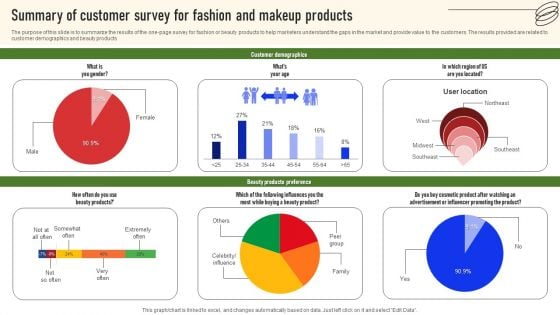
Summary Of Customer Survey For Fashion And Makeup Products Survey SS
The purpose of this slide is to summarize the results of the one-page survey for fashion or beauty products to help marketers understand the gaps in the market and provide value to the customers. The results provided are related to customer demographics and beauty products. Pitch your topic with ease and precision using this Summary Of Customer Survey For Fashion And Makeup Products Survey SS. This layout presents information on Customer Demographics, Beauty Products Preference. It is also available for immediate download and adjustment. So, changes can be made in the color, design, graphics or any other component to create a unique layout.
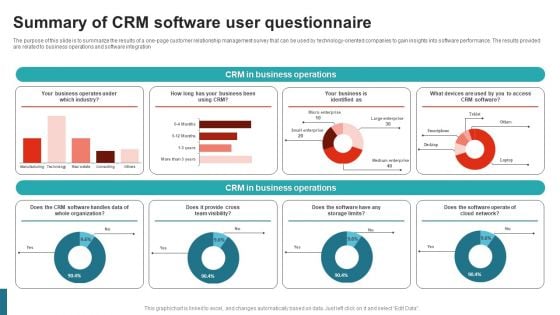
Summary Of CRM Software User Questionnaire Survey SS
The purpose of this slide is to summarize the results of a one-page customer relationship management survey that can be used by technology-oriented companies to gain insights into software performance. The results provided are related to business operations and software integration. Pitch your topic with ease and precision using this Summary Of CRM Software User Questionnaire Survey SS. This layout presents information on CRM In Business Operations, Industry, Cloud Network, Team Visibility. It is also available for immediate download and adjustment. So, changes can be made in the color, design, graphics or any other component to create a unique layout.
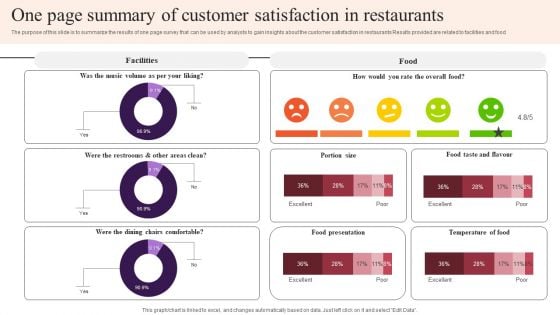
One Page Summary Of Customer Satisfaction In Restaurants Survey SS
The purpose of this slide is to summarize the results of one page survey that can be used by analysts to gain insights about the customer satisfaction in restaurants Results provided are related to facilities and food. Pitch your topic with ease and precision using this One Page Summary Of Customer Satisfaction In Restaurants Survey SS. This layout presents information on Facilities, Food Presentation, Temperature Of Food, Food Taste And Flavour. It is also available for immediate download and adjustment. So, changes can be made in the color, design, graphics or any other component to create a unique layout.
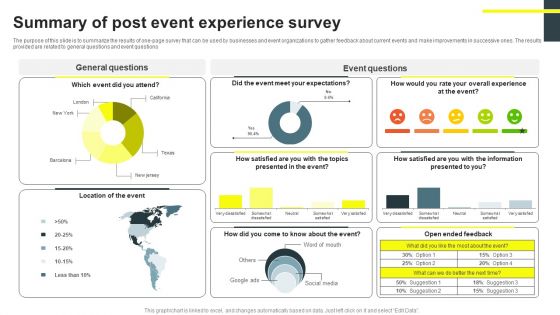
Summary Of Post Event Experience Survey Survey SS
The purpose of this slide is to summarize the results of one-page survey that can be used by businesses and event organizations to gather feedback about current events and make improvements in successive ones. The results provided are related to general questions and event questions. Pitch your topic with ease and precision using this Summary Of Post Event Experience Survey Survey SS. This layout presents information on General Questions, Event Questions, Location Of The Event, Social Media. It is also available for immediate download and adjustment. So, changes can be made in the color, design, graphics or any other component to create a unique layout.
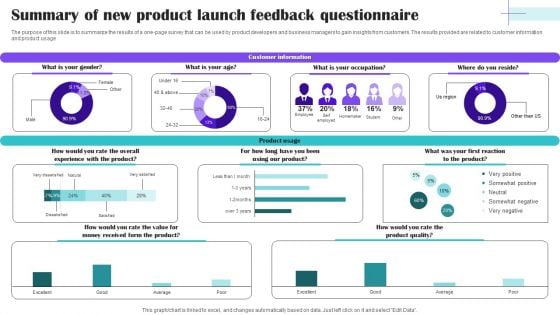
Summary Of New Product Launch Feedback Questionnaire Survey SS
The purpose of this slide is to summarize the results of a one-page survey that can be used by product developers and business managers to gain insights from customers. The results provided are related to customer information and product usage. Pitch your topic with ease and precision using this Summary Of New Product Launch Feedback Questionnaire Survey SS. This layout presents information on Customer Information, Product Usage, Occupation, Value For Money, Product Quality. It is also available for immediate download and adjustment. So, changes can be made in the color, design, graphics or any other component to create a unique layout.
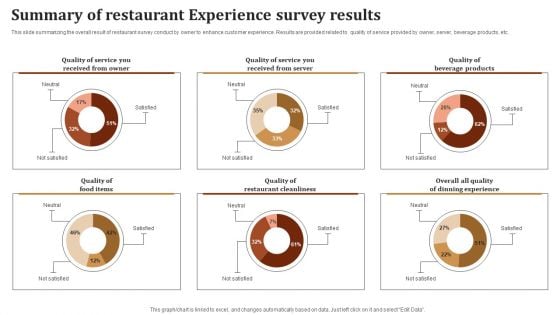
Summary Of Restaurant Experience Survey Results Survey SS
This slide summarizing the overall result of restaurant survey conduct by owner to enhance customer experience. Results are provided related to quality of service provided by owner, server, beverage products, etc. Pitch your topic with ease and precision using this Summary Of Restaurant Experience Survey Results Survey SS. This layout presents information on Quality Of Food Items, Quality Of Restaurant Cleanliness, Quality Of Beverage Products. It is also available for immediate download and adjustment. So, changes can be made in the color, design, graphics or any other component to create a unique layout.
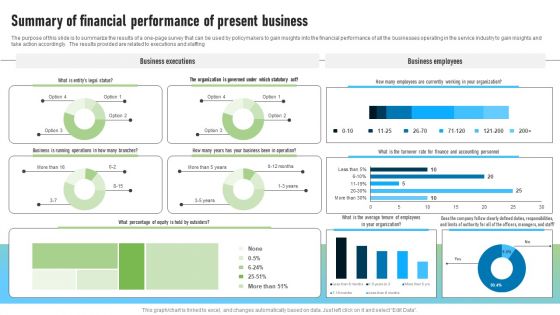
Summary Of Financial Performance Of Present Business Survey SS
The purpose of this slide is to summarize the results of a one-page survey that can be used by policymakers to gain insights into the financial performance of all the businesses operating in the service industry to gain insights and take action accordingly. The results provided are related to executions and staffing. Pitch your topic with ease and precision using this Summary Of Financial Performance Of Present Business Survey SS. This layout presents information on Business Executions, Business Employees, Organization, Officers, Managers, Staff. It is also available for immediate download and adjustment. So, changes can be made in the color, design, graphics or any other component to create a unique layout.
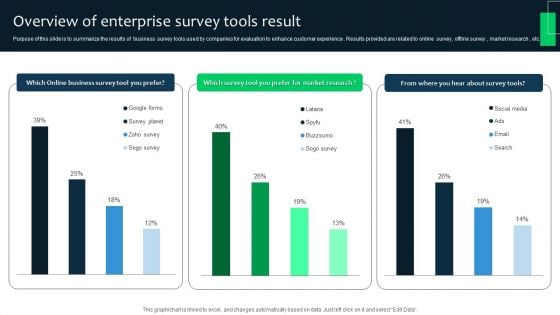
Overview Of Enterprise Survey Tools Result Survey SS
Purpose of this slide is to summarize the results of business survey tools used by companies for evaluation to enhance customer experience . Results provided are related to online survey, offline survey , market research , etc. Pitch your topic with ease and precision using this Overview Of Enterprise Survey Tools Result Survey SS. This layout presents information on Online Business Survey Tool, Market Research, Survey Tools, Social Media. It is also available for immediate download and adjustment. So, changes can be made in the color, design, graphics or any other component to create a unique layout.
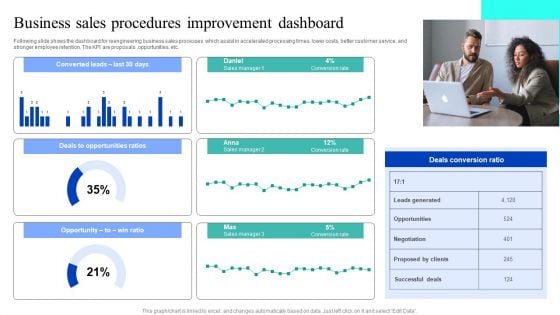
Business Sales Procedures Improvement Dashboard Designs PDF
Following slide shows the dashboard for reengineering business sales processes which assist in accelerated processing times, lower costs, better customer service, and stronger employee retention. The KPI are proposals ,opportunities, etc. Pitch your topic with ease and precision using this Business Sales Procedures Improvement Dashboard Designs PDF. This layout presents information on Deals Opportunities Ratios, Opportunity, Deals Conversion Ratio. It is also available for immediate download and adjustment. So, changes can be made in the color, design, graphics or any other component to create a unique layout.
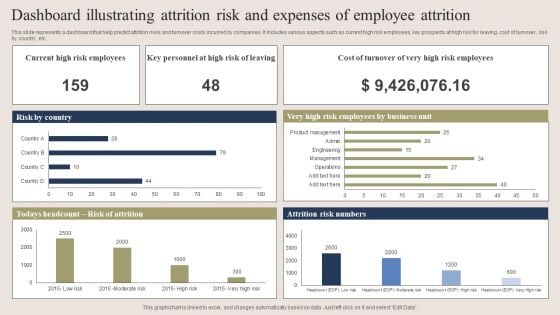
Dashboard Illustrating Attrition Risk And Expenses Of Employee Attrition Clipart PDF
This slide represents a dashboard that help predict attrition risks and turnover costs incurred by companies. It includes various aspects such as current high risk employees, key prospects at high risk for leaving, cost of turnover, risk by country, etc. Pitch your topic with ease and precision using this Dashboard Illustrating Attrition Risk And Expenses Of Employee Attrition Clipart PDF. This layout presents information on Dashboard Illustrating Attrition Risk, Expenses Of Employee Attrition . It is also available for immediate download and adjustment. So, changes can be made in the color, design, graphics or any other component to create a unique layout.
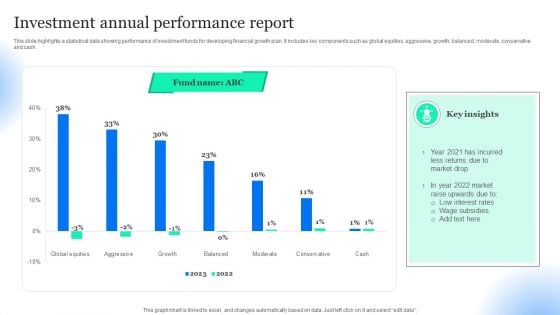
Investment Annual Performance Report Pictures PDF
This slide highlights a statistical data showing performance of investment funds for developing financial growth plan. It includes key components such as global equities, aggressive, growth, balanced, moderate, conservative and cash. Pitch your topic with ease and precision using this Investment Annual Performance Report Pictures PDF. This layout presents information on Low Interest Rates, Wage Subsidies, Returns Due Market Drop. It is also available for immediate download and adjustment. So, changes can be made in the color, design, graphics or any other component to create a unique layout.
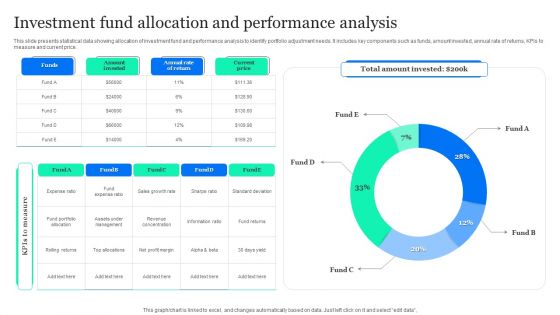
Investment Fund Allocation And Performance Analysis Designs PDF
This slide presents statistical data showing allocation of investment fund and performance analysis to identify portfolio adjustment needs. It includes key components such as funds, amount invested, annual rate of returns, KPIs to measure and current price. Pitch your topic with ease and precision using this Investment Fund Allocation And Performance Analysis Designs PDF. This layout presents information on Amount Invested, Annual Rate Return, Current Price. It is also available for immediate download and adjustment. So, changes can be made in the color, design, graphics or any other component to create a unique layout.
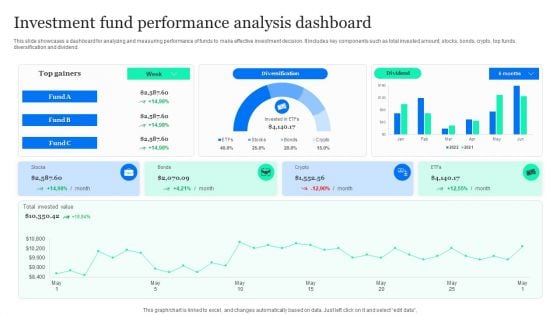
Investment Fund Performance Analysis Dashboard Professional PDF
This slide showcases a dashboard for analyzing and measuring performance of funds to make effective investment decision. It includes key components such as total invested amount, stocks, bonds, crypto, top funds, diversification and dividend. Pitch your topic with ease and precision using this Investment Fund Performance Analysis Dashboard Professional PDF. This layout presents information on Diversification, Invested Value, Bonds. It is also available for immediate download and adjustment. So, changes can be made in the color, design, graphics or any other component to create a unique layout.
Investment Fund Performance Tracking Dashboard Microsoft PDF
This slide showcases a dashboard to track and supervise funds performance for portfolio balancing . it includes key components such as amount invested in funds, number of invested funds, rate of return, annual investments and rating wise investments. Pitch your topic with ease and precision using this Investment Fund Performance Tracking Dashboard Microsoft PDF. This layout presents information on Amount Invented Funds, Rate Return, Rating Wise Investments. It is also available for immediate download and adjustment. So, changes can be made in the color, design, graphics or any other component to create a unique layout.
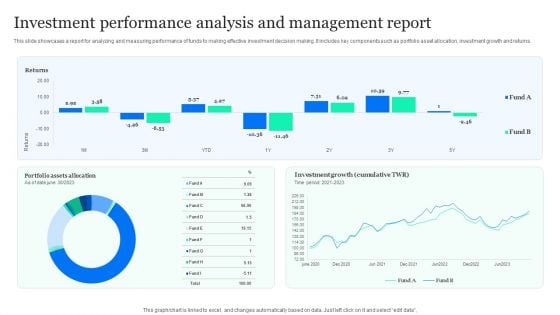
Investment Performance Analysis And Management Report Sample PDF
This slide showcases a report for analyzing and measuring performance of funds to making effective investment decision making. It includes key components such as portfolio asset allocation, investment growth and returns. Pitch your topic with ease and precision using this Investment Performance Analysis And Management Report Sample PDF. This layout presents information on Portfolio Assets Allocation, Investment Growth, Returns. It is also available for immediate download and adjustment. So, changes can be made in the color, design, graphics or any other component to create a unique layout.
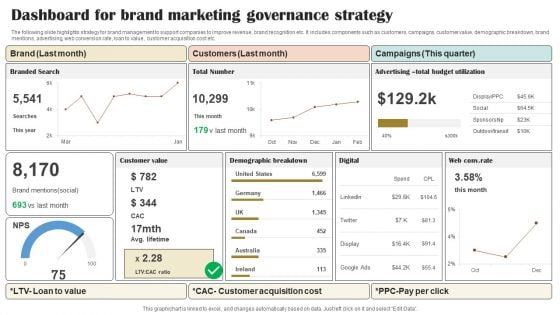
Dashboard For Brand Marketing Governance Strategy Portrait PDF
The following slide highlights strategy for brand management to support companies to improve revenue, brand recognition etc. It includes components such as customers, campaigns, customer value, demographic breakdown, brand mentions, advertising, web conversion rate, loan to value, customer acquisition cost etc. Pitch your topic with ease and precision using this Dashboard For Brand Marketing Governance Strategy Portrait PDF. This layout presents information on Brand, Customers, Campaigns. It is also available for immediate download and adjustment. So, changes can be made in the color, design, graphics or any other component to create a unique layout.
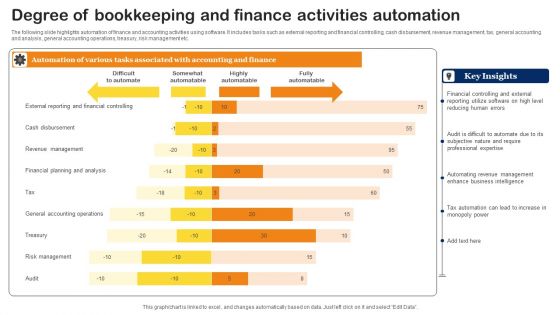
Degree Of Bookkeeping And Finance Activities Automation Graphics PDF
The following slide highlights automation of finance and accounting activities using software. It includes tasks such as external reporting and financial controlling, cash disbursement, revenue management, tax, general accounting and analysis, general accounting operations, treasury, risk management etc. Pitch your topic with ease and precision using this Degree Of Bookkeeping And Finance Activities Automation Graphics PDF. This layout presents information on Tax Automation, Business Intelligence, Revenue Management. It is also available for immediate download and adjustment. So, changes can be made in the color, design, graphics or any other component to create a unique layout.
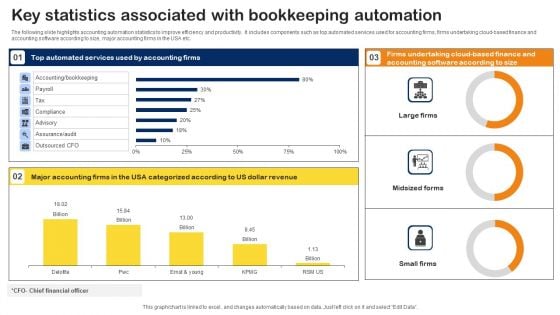
Key Statistics Associated With Bookkeeping Automation Demonstration PDF
The following slide highlights accounting automation statistics to improve efficiency and productivity. It includes components such as top automated services used for accounting firms, firms undertaking cloud-based finance and accounting software according to size, major accounting firms in the USA etc. Pitch your topic with ease and precision using this Key Statistics Associated With Bookkeeping Automation Demonstration PDF. This layout presents information on Key Statistics Associated, Bookkeeping Automation. It is also available for immediate download and adjustment. So, changes can be made in the color, design, graphics or any other component to create a unique layout.
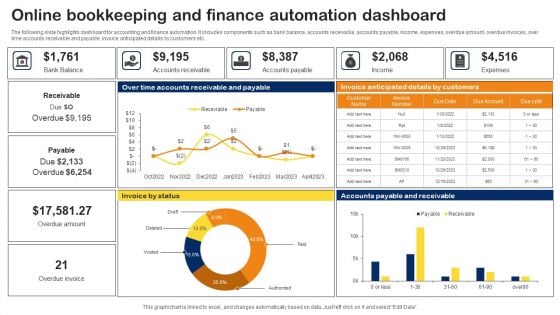
Online Bookkeeping And Finance Automation Dashboard Topics PDF
The following slide highlights dashboard for accounting and finance automation. It includes components such as bank balance, accounts receivable, accounts payable, income, expenses, overdue amount, overdue invoices, over time accounts receivable and payable, invoice anticipated details by customers etc. Pitch your topic with ease and precision using this Online Bookkeeping And Finance Automation Dashboard Topics PDF. This layout presents information on Online Bookkeeping, Finance Automation Dashboard. It is also available for immediate download and adjustment. So, changes can be made in the color, design, graphics or any other component to create a unique layout.
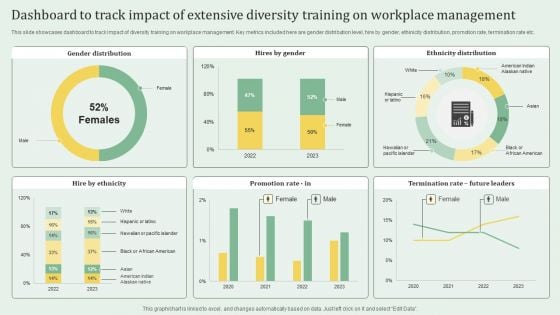
Dashboard To Track Impact Of Extensive Diversity Training On Workplace Management Portrait PDF
This slide showcases dashboard to track impact of diversity training on workplace management. Key metrics included here are gender distribution level, hire by gender, ethinicity distribution, promotion rate, termination rate etc. Pitch your topic with ease and precision using this Dashboard To Track Impact Of Extensive Diversity Training On Workplace Management Portrait PDF. This layout presents information on Dashboard To Track Impact, Extensive Diversity Training, Workplace Management. It is also available for immediate download and adjustment. So, changes can be made in the color, design, graphics or any other component to create a unique layout.
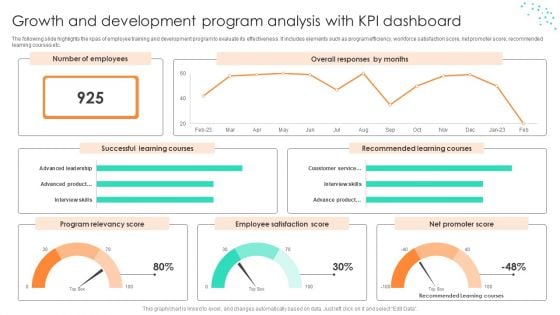
Growth And Development Program Analysis With KPI Dashboard Structure PDF
The following slide highlights the kpas of employee training and development program to evaluate its effectiveness. It includes elements such as program efficiency, workforce satisfaction score, net promoter score, recommended learning courses etc. Pitch your topic with ease and precision using this Growth And Development Program Analysis With KPI Dashboard Structure PDF. This layout presents information on Analysis With KPI Dashboard, Growth And Development Program. It is also available for immediate download and adjustment. So, changes can be made in the color, design, graphics or any other component to create a unique layout.
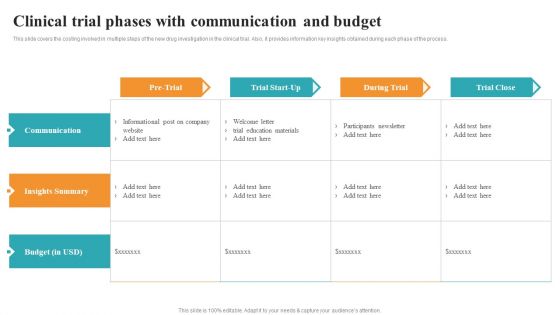
Clinical Trial Phases With Communication And Budget Medical Research Phases For Clinical Tests Designs PDF
This slide covers the costing involved in multiple steps of the new drug investigation in the clinical trial. Also, it provides information key insights obtained during each phase of the process. This Clinical Trial Phases With Communication And Budget Medical Research Phases For Clinical Tests Designs PDF from Slidegeeks makes it easy to present information on your topic with precision. It provides customization options, so you can make changes to the colors, design, graphics, or any other component to create a unique layout. It is also available for immediate download, so you can begin using it right away. Slidegeeks has done good research to ensure that you have everything you need to make your presentation stand out. Make a name out there for a brilliant performance.
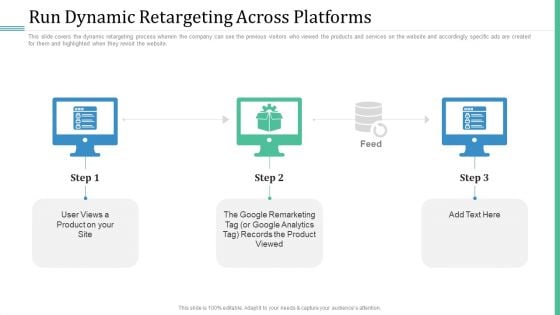
Alternative Distribution Advertising Platform Run Dynamic Retargeting Across Platforms Diagrams PDF
This slide covers the dynamic retargeting process wherein the company can see the previous visitors who viewed the products and services on the website and accordingly specific ads are created for them and highlighted when they revisit the website. Presenting multi channel marketing to maximize brand exposure run dynamic retargeting across platforms graphics pdf to provide visual cues and insights. Share and navigate important information on three stages that need your due attention. This template can be used to pitch topics like run dynamic retargeting across platforms. In addtion, this PPT design contains high resolution images, graphics, etc, that are easily editable and available for immediate download.
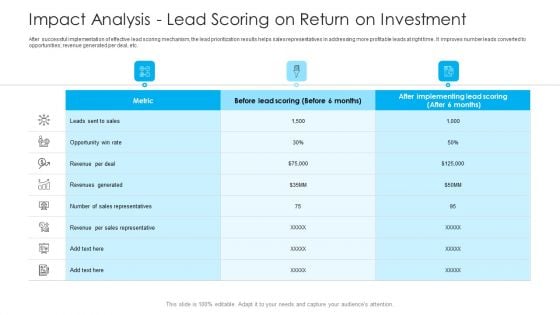
How To Build A Revenue Funnel Impact Analysis Lead Scoring On Return On Investment Diagrams PDF
After successful implementation of effective lead scoring mechanism, the lead prioritization results helps sales representatives in addressing more profitable leads at right time. It improves number leads converted to opportunities revenue generated per deal, etc. Deliver an awe inspiring pitch with this creative how to build a revenue funnel impact analysis increase in sales productivity pictures pdf bundle. Topics like revenue, opportunity, sales, implementing can be discussed with this completely editable template. It is available for immediate download depending on the needs and requirements of the user.
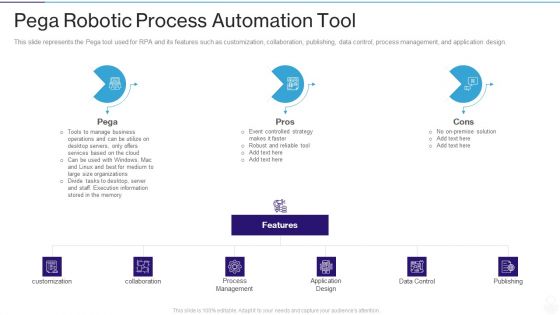
RPA IT Pega Robotic Process Automation Tool Ppt Portfolio Diagrams PDF
This slide depicts the inflectra rapise tool of the robotic process automation by covering the features such as scriptless testing, automatic recording, intelligent playback, and test validation. Presenting rpa it inflectra rpaise robotic process automation tool ppt outline show pdf to provide visual cues and insights. Share and navigate important information on four stages that need your due attention. This template can be used to pitch topics like automatic recording, test validation, intelligent playback, script less testing. In addtion, this PPT design contains high resolution images, graphics, etc, that are easily editable and available for immediate download.
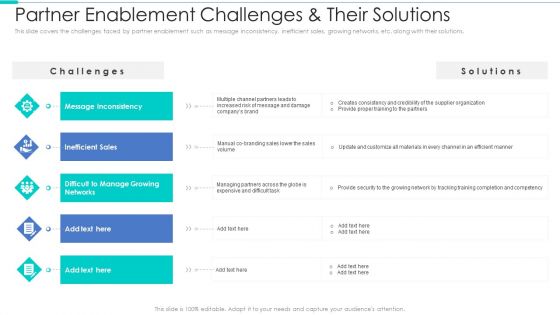
Business Relationship Management Tool Partner Enablement Challenges And Their Solutions Diagrams PDF
This slide covers the challenges faced by partner enablement such as message inconsistency, inefficient sales, growing networks, etc. along with their solutions. Presenting This slide provides the reasons for introducing partner enablement in the company such as decreasing sales, lack of knowledge and training for selling products and services, etc. to provide visual cues and insights. Share and navigate important information on five stages that need your due attention. This template can be used to pitch topics like consistency, credibility, organization. In addtion, this PPT design contains high resolution images, graphics, etc, that are easily editable and available for immediate download.
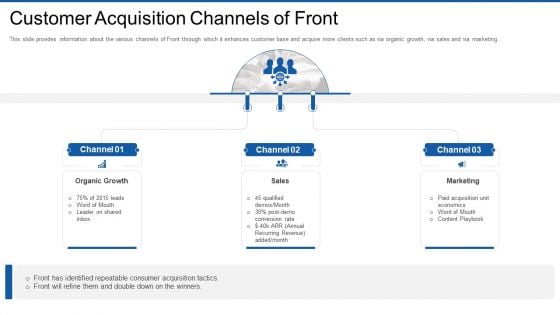
Front Series Venture Capital Funding Customer Acquisition Channels Of Front Diagrams PDF
This slide provides information about the various channels of Front through which it enhances customer base and acquire more clients such as via organic growth, via sales and via marketing. Presenting front series venture capital funding competitive landscape of front background pdf to provide visual cues and insights. Share and navigate important information on three stages that need your due attention. This template can be used to pitch topics like organic growth, sales, marketing. In addtion, this PPT design contains high resolution images, graphics, etc, that are easily editable and available for immediate download.
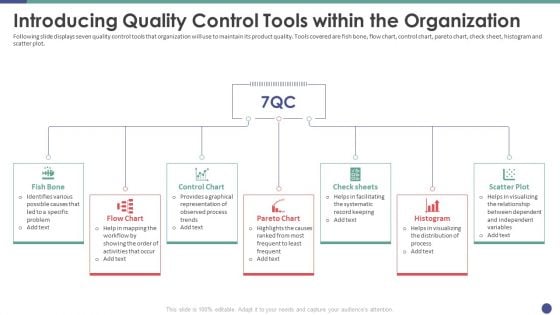
QC Engineering Introducing Quality Control Tools Within The Organization Ppt Infographic Template Design Templates PDF
Following slide displays seven quality control tools that organization will use to maintain its product quality. Tools covered are fish bone, flow chart, control chart, pareto chart, check sheet, histogram and scatter plot. Presenting qc engineering introducing quality control tools within the organization ppt infographic template design templates pdf to provide visual cues and insights. Share and navigate important information on seven stages that need your due attention. This template can be used to pitch topics like fish bone, flow chart, control chart, pareto chart, check sheets. In addtion, this PPT design contains high resolution images, graphics, etc, that are easily editable and available for immediate download.


 Continue with Email

 Home
Home


