Average
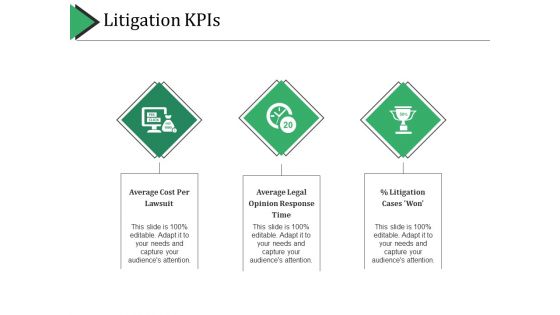
Litigation Kpis Ppt PowerPoint Presentation Styles Aids
This is a litigation kpis ppt powerpoint presentation styles aids. This is a three stage process. The stages in this process are average cost per lawsuit, average legal opinion response time.
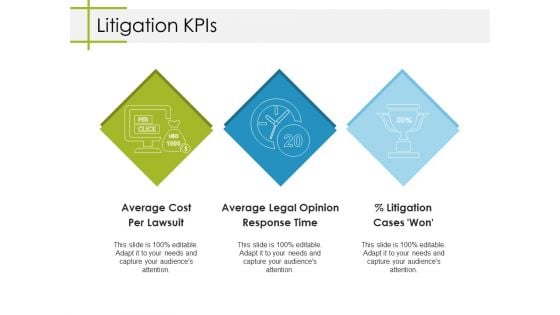
Litigation Kpis Ppt PowerPoint Presentation Model Aids
This is a litigation kpis ppt powerpoint presentation model aids. This is a three stage process. The stages in this process are average cost per lawsuit, average legal opinion response time, litigation cases won, business, marketing.
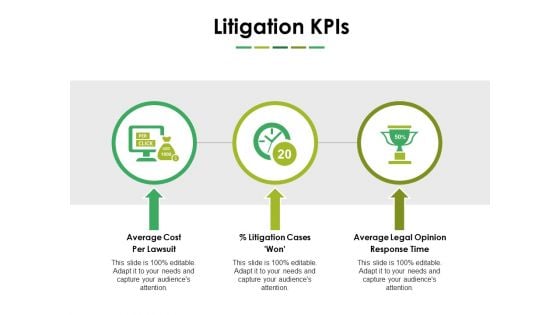
Litigation Kpis Ppt PowerPoint Presentation Model Portrait
This is a litigation kpis ppt powerpoint presentation model portrait. This is a three stage process. The stages in this process are average cost per lawsuit, litigation cases won, average legal opinion response time, business, marketing.
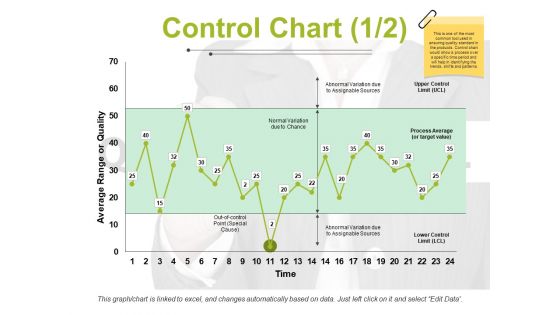
Control Chart Template 1 Ppt PowerPoint Presentation Ideas Images
This is a control chart template 1 ppt powerpoint presentation ideas images. This is a two stage process. The stages in this process are average range or quality, upper control limit, lower control limit, time, process average.
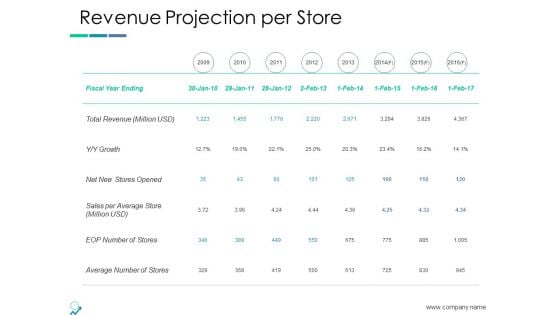
Revenue Projection Per Store Ppt PowerPoint Presentation Show Slides
This is a revenue projection per store ppt powerpoint presentation show slides. This is a eight stage process. The stages in this process are revenue projection per store, average number of stores, eop number of stores, sales per average store.
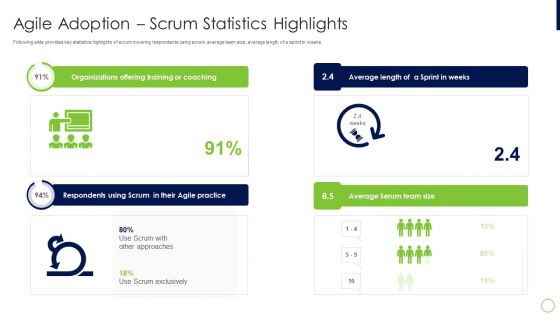
Agile Professional Certification PMI IT Agile Adoption Scrum Statistics Highlights Mockup PDF
Following slide provides key statistics highlights of scrum covering respondents using scrum, average team size, average length of a sprint in weeks Deliver and pitch your topic in the best possible manner with this agile professional certification pmi it agile adoption scrum statistics highlights mockup pdf Use them to share invaluable insights on organizations offering training, average length, average serum team and impress your audience. This template can be altered and modified as per your expectations. So, grab it now.
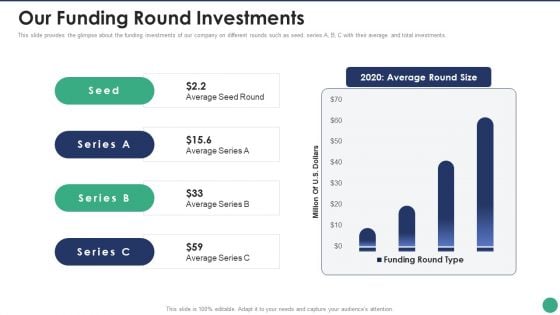
Company Pitch Deck Our Funding Round Investments Elements PDF
This slide provides the glimpse about the funding investments of our company on different rounds such as seed, series A, B, C with their average and total investments.Deliver an awe inspiring pitch with this creative Company Pitch Deck Our Funding Round Investments Elements PDF bundle. Topics like Average Round, Average Series, Average Seed can be discussed with this completely editable template. It is available for immediate download depending on the needs and requirements of the user.
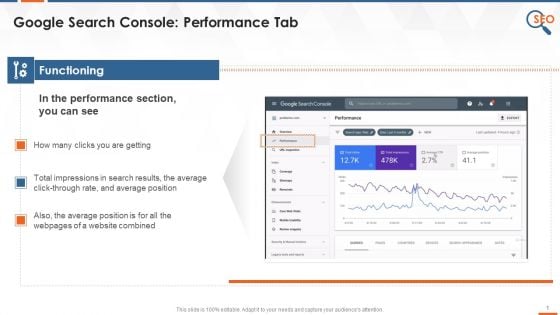
Understanding Performance Tab In Google Search Console Training Ppt
This slide covers google search console performance section details such as total clicks, impressions, average CTR, positioning, etc.
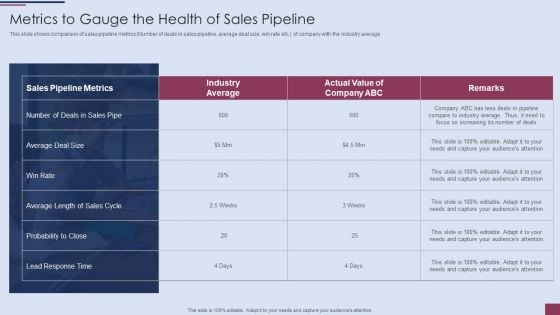
Sales Process Management To Boost Business Effectiveness Metrics To Gauge The Health Of Sales Pipeline Formats PDF
This slide shows comparison of sales pipeline metrics Number of deals in sales pipeline, average deal size, win rate etc. of company with the industry average.Deliver an awe inspiring pitch with this creative Sales Process Management To Boost Business Effectiveness Metrics To Gauge The Health Of Sales Pipeline Formats PDF bundle. Topics like Probability To Close, Average Length, Average Deal can be discussed with this completely editable template. It is available for immediate download depending on the needs and requirements of the user.
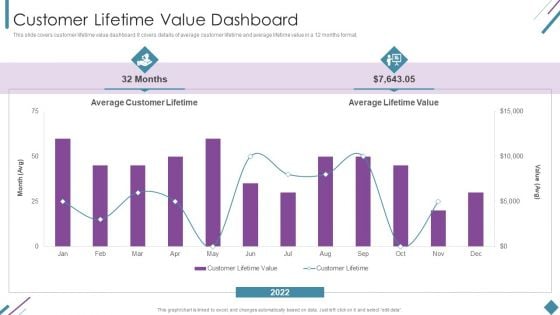
Metrics To Measure Business Performance Customer Lifetime Value Dashboard Slides PDF
This slide covers customer lifetime value dashboard. It covers details of average customer lifetime and average lifetime value in a 12 months format. Deliver and pitch your topic in the best possible manner with this Metrics To Measure Business Performance Customer Lifetime Value Dashboard Slides PDF. Use them to share invaluable insights on Average Customer Lifetime, Average Lifetime Value, 2022 and impress your audience. This template can be altered and modified as per your expectations. So, grab it now.
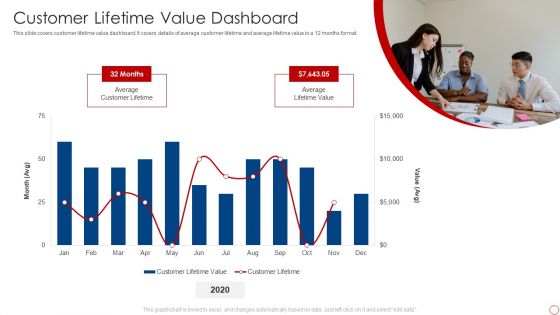
Kpis For Evaluating Business Sustainability Customer Lifetime Value Dashboard Clipart PDF
This slide covers customer lifetime value dashboard. It covers details of average customer lifetime and average lifetime value in a 12 months format. Deliver and pitch your topic in the best possible manner with this Kpis For Evaluating Business Sustainability Customer Lifetime Value Dashboard Clipart PDF. Use them to share invaluable insights on Average Customer Lifetime, Average Lifetime Value and impress your audience. This template can be altered and modified as per your expectations. So, grab it now.

Metrics To Gauge The Health Of Sales Pipeline Sales Funnel Management Strategies To Increase Sales Elements PDF
This slide shows comparison of sales pipeline metrics Number of deals in sales pipeline, average deal size, win rate etc.of company with the industry average.Deliver an awe inspiring pitch with this creative Metrics To Gauge The Health Of Sales Pipeline Sales Funnel Management Strategies To Increase Sales Elements PDF bundle. Topics like Probability Close, Average Length, Average Deal can be discussed with this completely editable template. It is available for immediate download depending on the needs and requirements of the user.
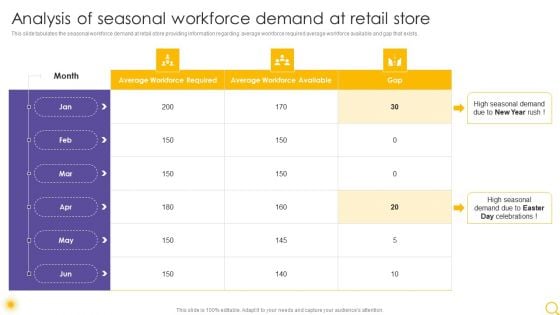
Retail Outlet Operational Efficiency Analytics Analysis Of Seasonal Workforce Demand Professional PDF
This slide tabulates the seasonal workforce demand at retail store providing information regarding average workforce required average workforce available and gap that exists. Deliver an awe inspiring pitch with this creative Retail Outlet Operational Efficiency Analytics Analysis Of Seasonal Workforce Demand Professional PDF bundle. Topics like High Seasonal Demand, Average Workforce Required, Average Workforce Available can be discussed with this completely editable template. It is available for immediate download depending on the needs and requirements of the user.
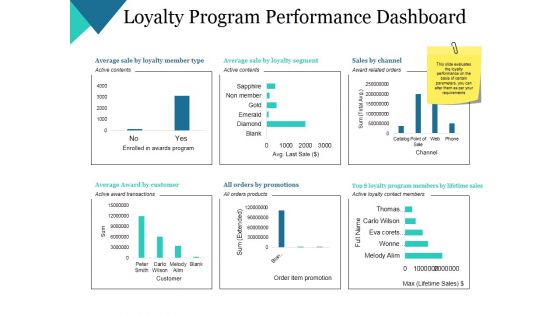
Loyalty Program Performance Dashboard Ppt PowerPoint Presentation Summary Grid
This is a loyalty program performance dashboard ppt powerpoint presentation summary grid. This is a six stage process. The stages in this process are average sale by loyalty member type, average award by customer, all orders by promotions, average sale by loyalty segment, sales by channel.
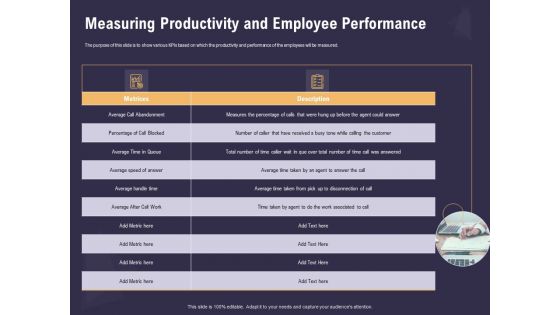
Effective Workforce Management Measuring Productivity And Employee Performance Ppt PowerPoint Presentation Ideas Visuals PDF
Presenting this set of slides with name effective workforce management measuring productivity and employee performance ppt powerpoint presentation ideas visuals pdf. The topics discussed in these slides are average call abandonment, average time queue, average handle time, measures. This is a completely editable PowerPoint presentation and is available for immediate download. Download now and impress your audience.
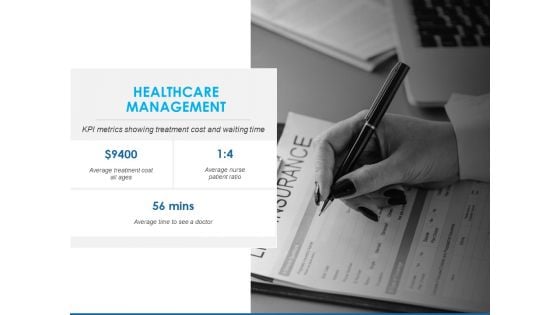
Overview Healthcare Business Management Healthcare Management Cost Diagrams PDF
Presenting this set of slides with name overview healthcare business management healthcare management cost diagrams pdf. This is a one stage process. The stages in this process are average treatment cost all ages, average time to see a doctor, average nurse patient ratio. This is a completely editable PowerPoint presentation and is available for immediate download. Download now and impress your audience.
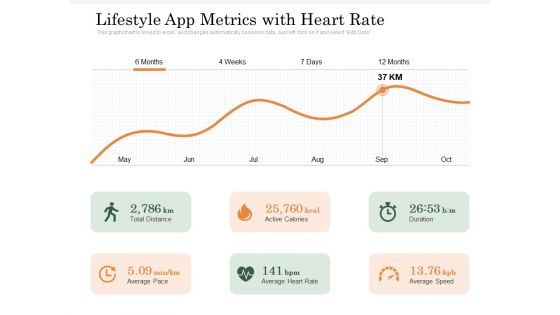
Lifestyle App Metrics With Heart Rate Ppt PowerPoint Presentation Infographic Template Inspiration PDF
Presenting this set of slides with name lifestyle app metrics with heart rate ppt powerpoint presentation infographic template inspiration pdf. The topics discussed in these slides are active calories, total distance, duration, average pace, average heart rate, average speed. This is a completely editable PowerPoint presentation and is available for immediate download. Download now and impress your audience.
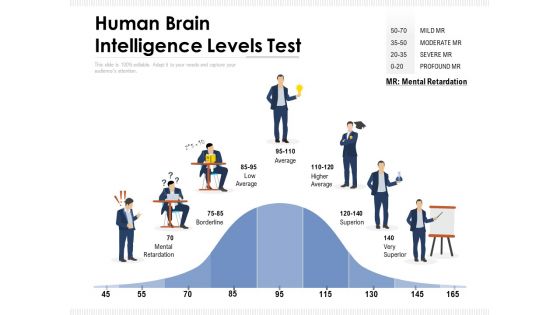
Human Brain Intelligence Levels Test Ppt PowerPoint Presentation Portfolio Outfit PDF
Presenting this set of slides with name human brain intelligence levels test ppt powerpoint presentation portfolio outfit pdf. This is a one stage process. The stages in this process are mental retardation, borderline low average, average higher, average superion, very superior. This is a completely editable PowerPoint presentation and is available for immediate download. Download now and impress your audience.
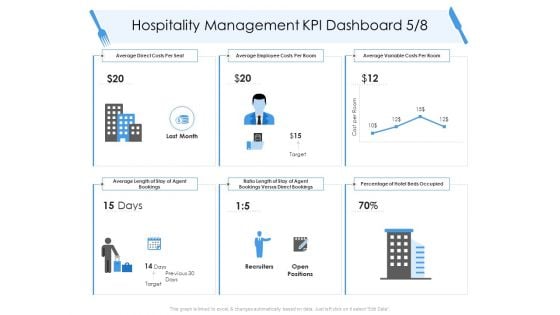
Tourism And Hospitality Industry Hospitality Management KPI Dashboard Agent Information PDF
Deliver and pitch your topic in the best possible manner with this tourism and hospitality industry hospitality management kpi dashboard agent information pdf. Use them to share invaluable insights on average direct costs, average employee costs, average variable costs, agent bookings and impress your audience. This template can be altered and modified as per your expectations. So, grab it now.
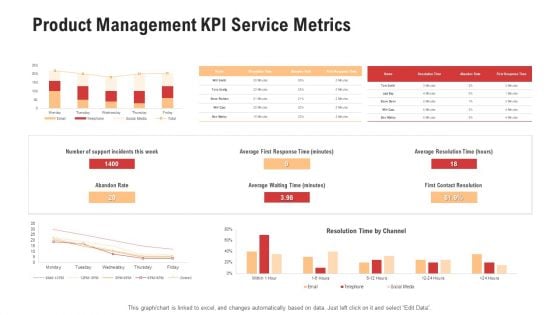
Competitor Assessment In Product Development Product Management KPI Service Metrics Topics PDF
Deliver an awe-inspiring pitch with this creative competitor assessment in product development product management kpi service metrics topics pdf. bundle. Topics like number of support incidents this week, average first response time, average waiting time, average resolution time can be discussed with this completely editable template. It is available for immediate download depending on the needs and requirements of the user.
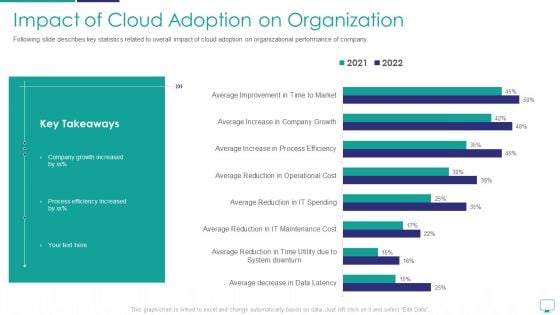
Impact Of Cloud Adoption On Organization Information PDF
Following slide describes key statistics related to overall impact of cloud adoption on organizational performance of company.Deliver an awe inspiring pitch with this creative impact of cloud adoption on organization information pdf bundle. Topics like average decrease, average reduction, average reduction can be discussed with this completely editable template. It is available for immediate download depending on the needs and requirements of the user.
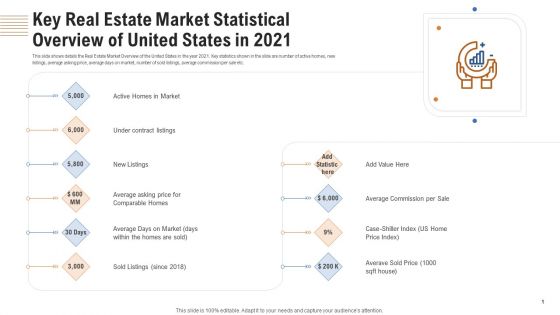
Key Real Estate Market Statistical Overview Of United States In 2021 Ppt Gallery Designs Download PDF
This slide shows details the Real Estate Market Overview of the United States in the year 2021. Key statistics shown in the slide are number of active homes, new listings, average asking price, average days on market, number of sold listings, average commission per sale etc. Deliver and pitch your topic in the best possible manner with this key real estate market statistical overview of united states in 2021 ppt gallery designs download pdf. Use them to share invaluable insights on active homes in market, average commission per sale, average days on market and impress your audience. This template can be altered and modified as per your expectations. So, grab it now.
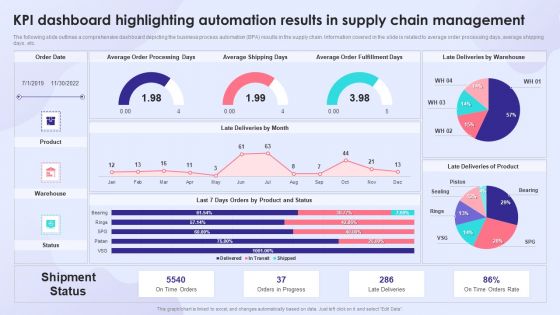
KPI Dashboard Highlighting Automation Results In Supply Chain Management Rules PDF
The following slide outlines a comprehensive dashboard depicting the business process automation BPA results in the supply chain. Information covered in the slide is related to average order processing days, average shipping days, etc. Deliver and pitch your topic in the best possible manner with this KPI Dashboard Highlighting Automation Results In Supply Chain Management Rules PDF. Use them to share invaluable insights on Average Order Fulfillment Days, Average Shipping Days, Average Order Processing Days and impress your audience. This template can be altered and modified as per your expectations. So, grab it now.
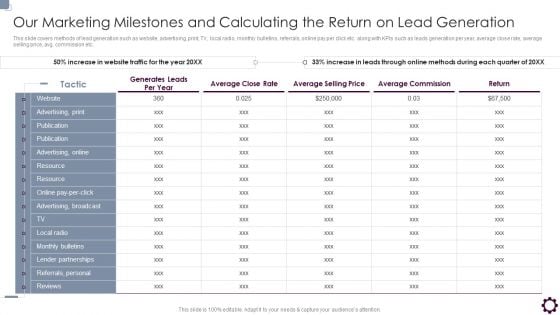
Our Marketing Milestones And Calculating The Return On Lead Generation Brochure PDF
This slide covers methods of lead generation such as website, advertising, print, TV, local radio, monthly bulletins, referrals, online pay per click etc. along with KPIs such as leads generation per year, average close rate, average selling price, avg. commission etc.Deliver an awe inspiring pitch with this creative Our Marketing Milestones And Calculating The Return On Lead Generation Brochure PDF bundle. Topics like Average Commission, Average Close, Average Selling can be discussed with this completely editable template. It is available for immediate download depending on the needs and requirements of the user.
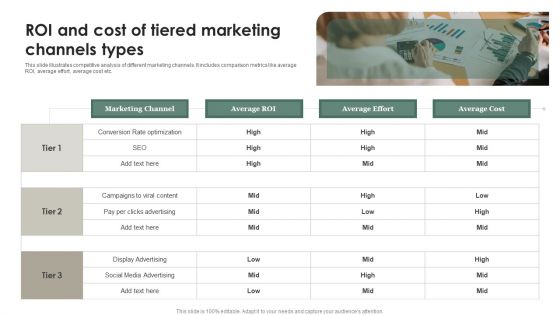
ROI And Cost Of Tiered Marketing Channels Types Professional PDF
This slide illustrates competitive analysis of different marketing channels. It includes comparison metrics like average ROI, average effort, average cost etc. Persuade your audience using this ROI And Cost Of Tiered Marketing Channels Types Professional PDF. This PPT design covers four stages, thus making it a great tool to use. It also caters to a variety of topics including Marketing Channel, Average ROI, Average Effort. Download this PPT design now to present a convincing pitch that not only emphasizes the topic but also showcases your presentation skills.
Dashboard For Tracking Sales Target Metrics Introduction PDF
This slide presents KPI dashboard for tracking Sales Target Metrics achievement monthly and region wise helpful in adjusting activities as per ongoing performance. It includes average weekly sales revenue, average sales target, annual sales growth, regional sales performance and average revenue per unit that should be regularly tracked. Showcasing this set of slides titled Dashboard For Tracking Sales Target Metrics Introduction PDF. The topics addressed in these templates are Average Revenue, Per Unit, Average Weekly, Sales Revenue. All the content presented in this PPT design is completely editable. Download it and make adjustments in color, background, font etc. as per your unique business setting.
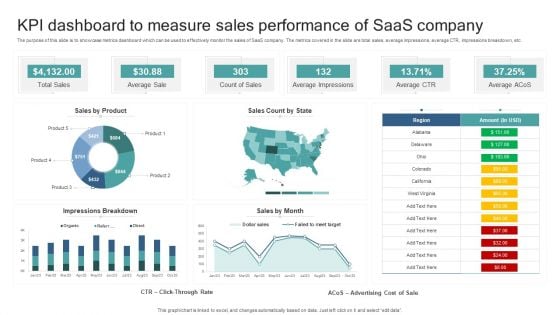
KPI Dashboard To Measure Sales Performance Of Saas Company Summary PDF
The purpose of this slide is to showcase metrics dashboard which can be used to effectively monitor the sales of SaaS company. The metrics covered in the slide are total sales, average impressions, average CTR, impressions breakdown, etc. Showcasing this set of slides titled KPI Dashboard To Measure Sales Performance Of Saas Company Summary PDF. The topics addressed in these templates are Total Sales, Average Sale, Count Of Sales, Average Impressions, Average Ctr. All the content presented in this PPT design is completely editable. Download it and make adjustments in color, background, font etc. as per your unique business setting.
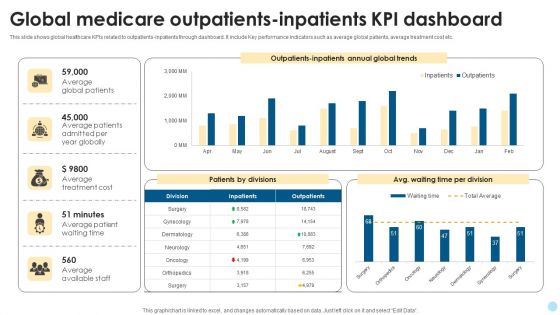
Global Medicare Outpatients Inpatients Kpi Dashboard Template PDF
This slide shows global healthcare KPIs related to outpatients-inpatients through dashboard. It include Key performance indicators such as average global patients, average treatment cost etc. Pitch your topic with ease and precision using this Global Medicare Outpatients Inpatients Kpi Dashboard Template PDF. This layout presents information on Average Treatment Cost, Average Global Patients, Average Available Staff. It is also available for immediate download and adjustment. So, changes can be made in the color, design, graphics or any other component to create a unique layout.
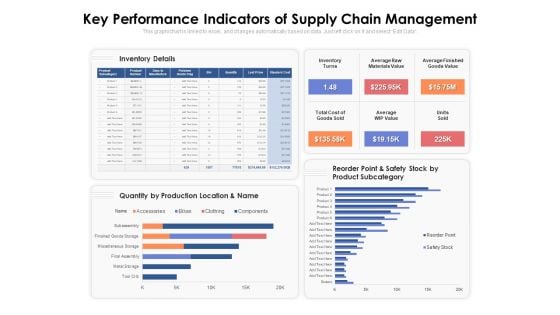
Key Performance Indicators Of Supply Chain Management Ppt PowerPoint Presentation Model Portfolio PDF
Presenting this set of slides with name key performance indicators of supply chain management ppt powerpoint presentation model portfolio pdf. The topics discussed in these slides are inventory details, inventory turns, average raw materials value, average finished goods value, total cost of goods sold, average wip value, units sold. This is a completely editable PowerPoint presentation and is available for immediate download. Download now and impress your audience.
Real Estate Development Real Estate Market Snapshot Price Ppt PowerPoint Presentation Show Icon PDF
Presenting this set of slides with name real estate development real estate market snapshot price ppt powerpoint presentation show icon pdf. This is a four stage process. The stages in this process are average asking price, average sold price, average days market, homes sale, size available. This is a completely editable PowerPoint presentation and is available for immediate download. Download now and impress your audience.
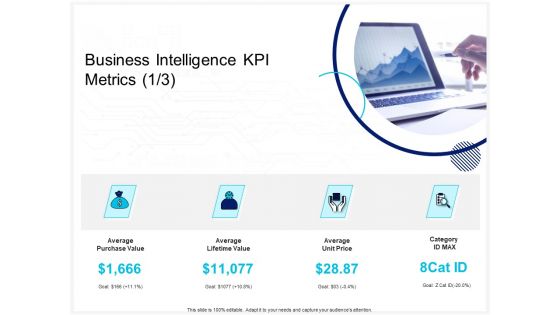
Enterprise Problem Solving And Intellect Business Intelligence KPI Metrics Price Ppt PowerPoint Presentation Gallery Graphics PDF
Presenting this set of slides with name enterprise problem solving and intellect business intelligence kpi metrics price ppt powerpoint presentation gallery graphics pdf. This is a four stage process. The stages in this process are average purchase value, average lifetime value, average unit price, category id max. This is a completely editable PowerPoint presentation and is available for immediate download. Download now and impress your audience.
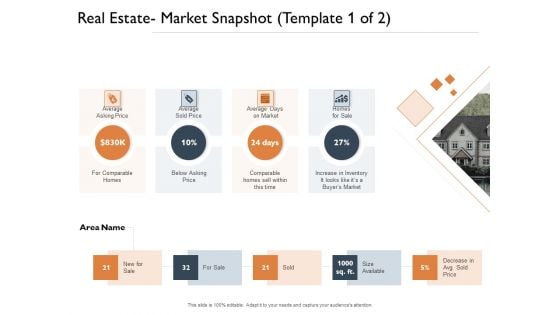
Freehold Property Business Plan Real Estate Market Snapshot Ppt PowerPoint Presentation Show Design Templates PDF
Presenting this set of slides with name freehold property business plan real estate market snapshot ppt powerpoint presentation show design templates pdf. This is a four stage process. The stages in this process are average asking price, average sold price, average days market, homes sale, size available. This is a completely editable PowerPoint presentation and is available for immediate download. Download now and impress your audience.
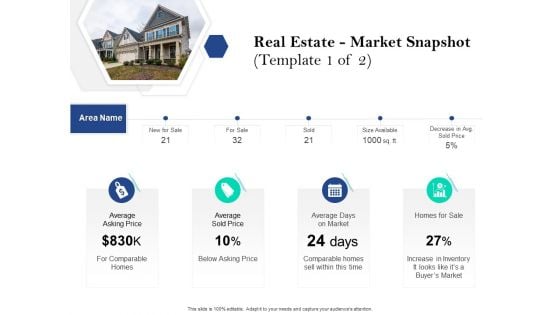
Property Investment Strategies Real Estate Market Snapshot Template Sale Ppt PowerPoint Presentation Gallery Graphics Design PDF
Presenting property investment strategies real estate market snapshot template sale ppt powerpoint presentation gallery graphics design pdf. to provide visual cues and insights. Share and navigate important information on four stages that need your due attention. This template can be used to pitch topics like average asking price, average sold price, average days on market, homes for sale, for comparable homes. In addtion, this PPT design contains high resolution images, graphics, etc, that are easily editable and available for immediate download.
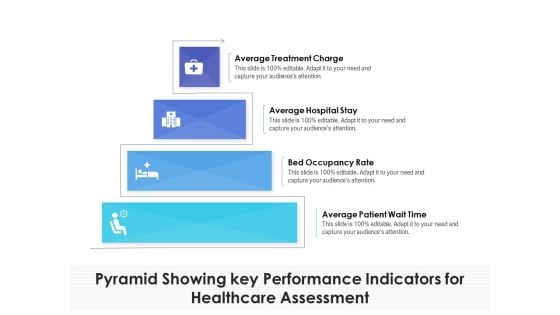
Pyramid Showing Key Performance Indicators For Healthcare Assessment Ppt PowerPoint Presentation Show Background Image PDF
Presenting pyramid showing key performance indicators for healthcare assessment ppt powerpoint presentation show background image pdf to dispense important information. This template comprises four stages. It also presents valuable insights into the topics including average treatment charge, average hospital stay, bed occupancy rate, average patient wait time. This is a completely customizable PowerPoint theme that can be put to use immediately. So, download it and address the topic impactfully.
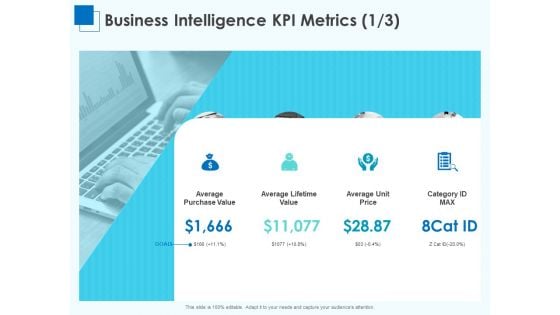
Corporate Intelligence Business Analysis Business Intelligence KPI Metrics Value Sample PDF
Presenting corporate intelligence business analysis business intelligence kpi metrics value sample pdf to provide visual cues and insights. Share and navigate important information on four stages that need your due attention. This template can be used to pitch topics like average purchase value, average lifetime value, average unit price. In addition, this PPT design contains high-resolution images, graphics, etc, that are easily editable and available for immediate download.
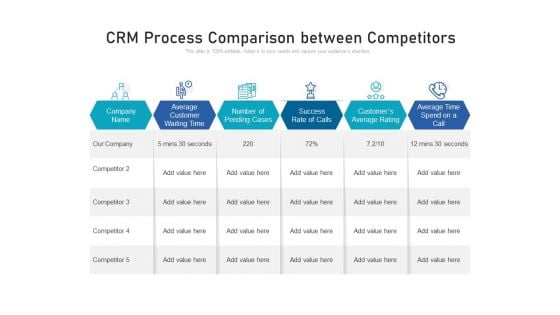
CRM Process Comparison Between Competitors Ppt PowerPoint Presentation Portfolio Themes PDF
Pitch your topic with ease and precision using this crm process comparison between competitors ppt powerpoint presentation portfolio themes pdf. This layout presents information on average customer waiting time, number of pending cases, success rate of calls, customers average rating, average time spend on a call. It is also available for immediate download and adjustment. So, changes can be made in the color, design, graphics or any other component to create a unique layout.
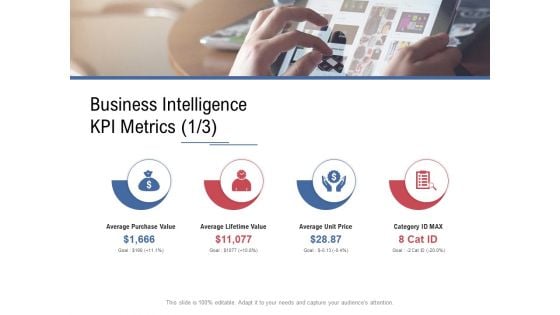
Data Assimilation Business Intelligence KPI Metrics Unit Ppt Pictures Graphics Download PDF
This is a data assimilation business intelligence kpi metrics unit ppt pictures graphics download pdf template with various stages. Focus and dispense information on four stages using this creative set, that comes with editable features. It contains large content boxes to add your information on topics like average purchase value, average lifetime value, average unit price. You can also showcase facts, figures, and other relevant content using this PPT layout. Grab it now.
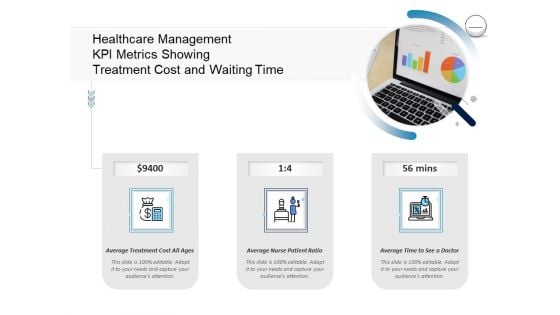
Pharmaceutical Management Healthcare Management KPI Metrics Showing Treatment Cost And Waiting Time Portrait PDF
This is a pharmaceutical management healthcare management kpi metrics showing treatment cost and waiting time portrait pdf template with various stages. Focus and dispense information on three stages using this creative set, that comes with editable features. It contains large content boxes to add your information on topics like average treatment cost ages, average nurse patient ratio, average time see doctor. You can also showcase facts, figures, and other relevant content using this PPT layout. Grab it now.
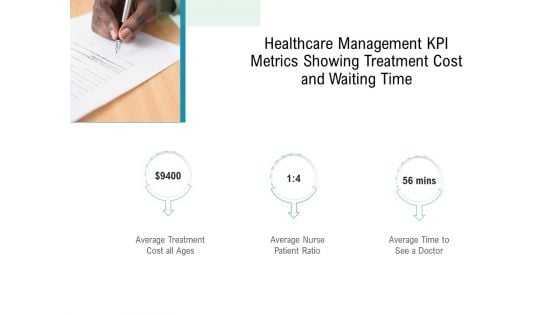
Hospital Management Healthcare Management KPI Metrics Showing Treatment Cost And Waiting Time Ppt Inspiration PDF
Presenting hospital management healthcare management kpi metrics showing treatment cost and waiting time ppt inspiration pdf to provide visual cues and insights. Share and navigate important information on three stages that need your due attention. This template can be used to pitch topics like average treatment cost all ages, average nurse patient ratio, average time to see a doctor. In addtion, this PPT design contains high resolution images, graphics, etc, that are easily editable and available for immediate download.
Health Centre Management Business Plan Healthcare Management KPI Metrics Showing Treatment Cost And Waiting Time Portrait PDF
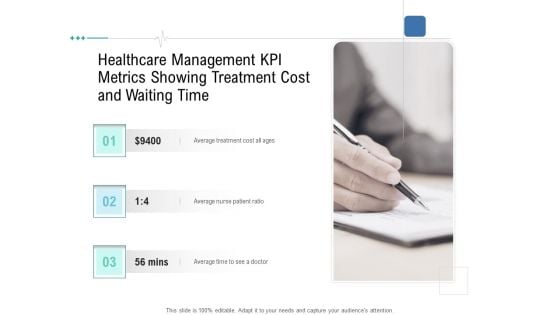
Presenting health centre management business plan healthcare management kpi metrics showing treatment cost and waiting time portrait pdf to provide visual cues and insights. Share and navigate important information on three stages that need your due attention. This template can be used to pitch topics like average treatment cost all ages, average nurse patient ratio, average time to see a doctor. In addtion, this PPT design contains high resolution images, graphics, etc, that are easily editable and available for immediate download.
Nursing Administration Healthcare Management KPI Metrics Showing Treatment Cost And Waiting Time Ppt Gallery Slides PDF
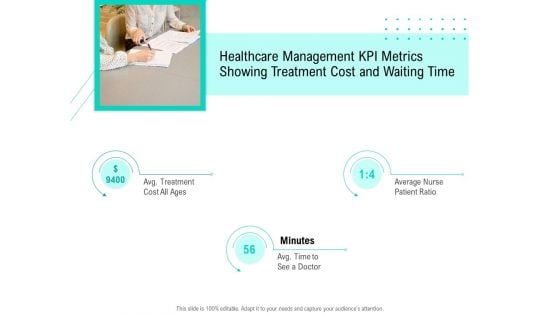
Presenting nursing administration healthcare management kpi metrics showing treatment cost and waiting time ppt gallery slides pdf to provide visual cues and insights. Share and navigate important information on three stages that need your due attention. This template can be used to pitch topics like average treatment cost all ages, average nurse patient ratio, average time to see a doctor. In addtion, this PPT design contains high resolution images, graphics, etc, that are easily editable and available for immediate download.
E Healthcare Management System Healthcare Management KPI Metrics Showing Treatment Cost And Waiting Time Template PDF
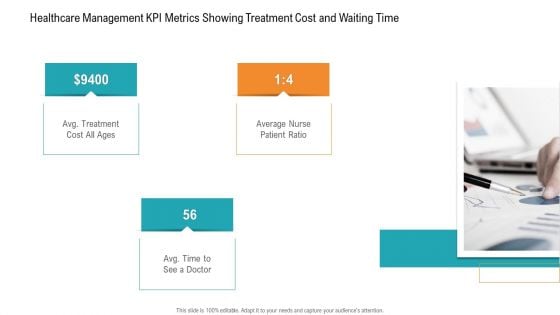
Presenting e healthcare management system healthcare management kpi metrics showing treatment cost and waiting time template pdf to provide visual cues and insights. Share and navigate important information on three stages that need your due attention. This template can be used to pitch topics like average treatment cost all ages, average nurse patient ratio, average time to see a doctor. In addtion, this PPT design contains high resolution images, graphics, etc, that are easily editable and available for immediate download.

Healthcare Management Healthcare Management KPI Metrics Showing Treatment Cost And Waiting Time Ppt Infographics Example PDF
Presenting healthcare management healthcare management kpi metrics showing treatment cost and waiting time ppt infographics example pdf to provide visual cues and insights. Share and navigate important information on three stages that need your due attention. This template can be used to pitch topics like average treatment cost all ages, average nurse patient ratio, average time to see a doctor. In addtion, this PPT design contains high resolution images, graphics, etc, that are easily editable and available for immediate download.
Hospital Administration Healthcare Management KPI Metrics Showing Treatment Cost And Waiting Time Ppt Layouts Example PDF
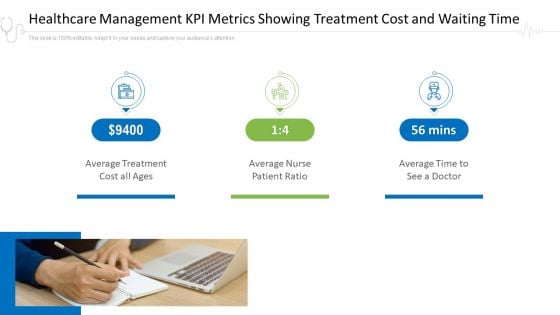
Presenting hospital administration healthcare management kpi metrics showing treatment cost and waiting time ppt layouts example pdf to provide visual cues and insights. Share and navigate important information on three stages that need your due attention. This template can be used to pitch topics like average treatment cost all ages, average nurse patient ratio, average time to see a doctor. In addtion, this PPT design contains high resolution images, graphics, etc, that are easily editable and available for immediate download.
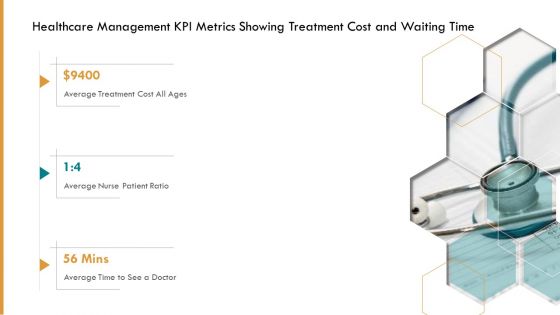
Pharmaceutical Management Healthcare Management KPI Metrics Showing Treatment Cost And Waiting Time Ppt Ideas Format PDF
Presenting pharmaceutical management healthcare management kpi metrics showing treatment cost and waiting time ppt ideas format pdf to provide visual cues and insights. Share and navigate important information on three stages that need your due attention. This template can be used to pitch topics like average treatment cost all ages, average nurse patient ratio, average time to see a doctor. In addtion, this PPT design contains high resolution images, graphics, etc, that are easily editable and available for immediate download.
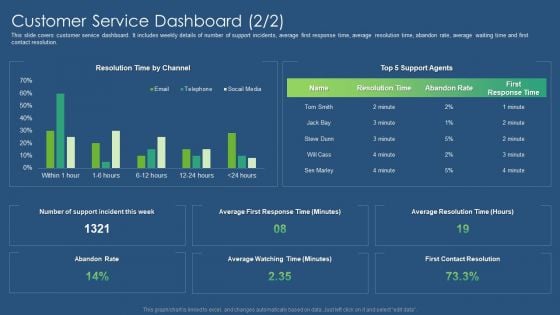
Sustainability Calculation With KPI Customer Service Dashboard Microsoft PDF Slides PDF
This slide covers customer service dashboard. It includes weekly details of number of support incidents, average first response time, average resolution time, abandon rate, average waiting time and first contact resolution. Deliver an awe inspiring pitch with this creative sustainability calculation with kpi customer service dashboard revenue ideas pdf bundle. Topics like customer service dashboard can be discussed with this completely editable template. It is available for immediate download depending on the needs and requirements of the user.
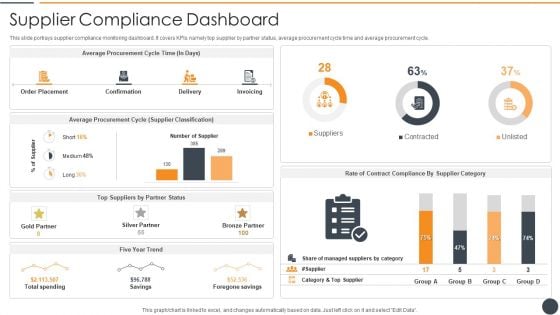
Effective Initiation Of Information Technology Project Supplier Compliance Dashboard Topics PDF
This slide portrays supplier compliance monitoring dashboard. It covers KPIs namely top supplier by partner status, average procurement cycle time and average procurement cycle. Deliver an awe inspiring pitch with this creative effective initiation of information technology project supplier compliance dashboard topics pdf bundle. Topics like order placement, confirmation, delivery, invoicing, average procurement cycle time can be discussed with this completely editable template. It is available for immediate download depending on the needs and requirements of the user.
Horizontal Scaling Technique For Information Existing Data Repository Performance Metrics Icons PDF
This slide presents the information regarding organizations current data repository system performance metrices such as throughput rate, response time, count of open connections etc.Deliver an awe inspiring pitch with this creative Horizontal Scaling Technique For Information Existing Data Repository Performance Metrics Icons PDF bundle. Topics like Average Response, Average Response, Average Database can be discussed with this completely editable template. It is available for immediate download depending on the needs and requirements of the user.
Product Portfolio Management For New Target Region Determining The Lifetime Value Icons PDF
This slide shows the details about average customer lifetime and average lifetime value for a specific year. Here the graph depicts that average lifetime value recorded in 2020 was dollar7,556.Deliver an awe inspiring pitch with this creative Product Portfolio Management For New Target Region Determining The Lifetime Value Icons PDF bundle. Topics like Determining the Lifetime Value of Product Portfolios can be discussed with this completely editable template. It is available for immediate download depending on the needs and requirements of the user.
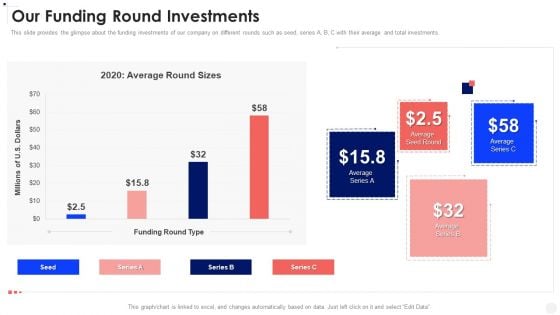
Corporate Business Our Funding Round Investments Ppt PowerPoint Presentation Gallery Slide PDF
This slide provides the glimpse about the funding investments of our company on different rounds such as seed, series A, B, C with their average and total investments. Deliver an awe inspiring pitch with this creative Corporate Business Our Funding Round Investments Ppt PowerPoint Presentation Gallery Slide PDF bundle. Topics like 2020 Average Round, Sizes Funding Round, Type Average Series can be discussed with this completely editable template. It is available for immediate download depending on the needs and requirements of the user.
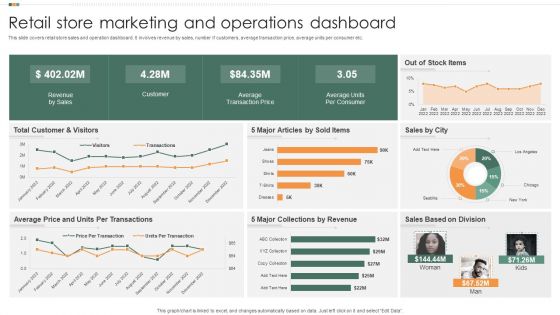
Retail Store Marketing And Operations Dashboard Mockup PDF
This slide covers retail store sales and operation dashboard. It involves revenue by sales, number if customers, average transaction price, average units per consumer etc. Pitch your topic with ease and precision using this Retail Store Marketing And Operations Dashboard Mockup PDF. This layout presents information on Revenue By Sales, Customer, Average Transaction Price. It is also available for immediate download and adjustment. So, changes can be made in the color, design, graphics or any other component to create a unique layout.
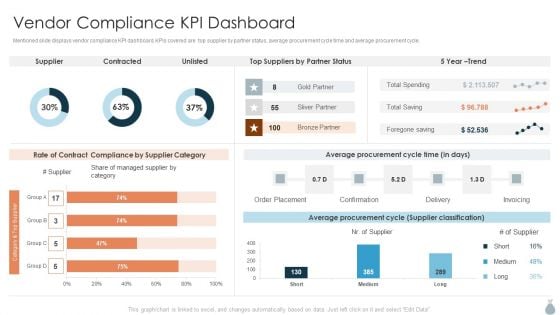
Real Estate Development Project Financing Vendor Compliance KPI Dashboard Elements PDF Formats PDF
Mentioned slide displays vendor compliance KPI dashboard. KPIs covered are top supplier by partner status, average procurement cycle time and average procurement cycle.Deliver and pitch your topic in the best possible manner with this Real Estate Development Project Financing Vendor Compliance KPI Dashboard Elements PDF Formats PDF. Use them to share invaluable insights on Average Procurement, Supplier Category, Contracted and impress your audience. This template can be altered and modified as per your expectations. So, grab it now.
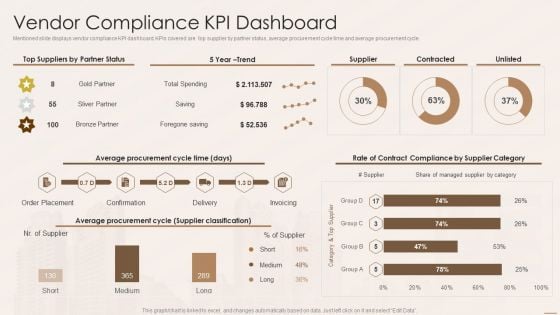
Real Estate Developers Funding Alternatives Vendor Compliance Kpi Dashboard Infographics PDF
Mentioned slide displays vendor compliance KPI dashboard. KPIs covered are top supplier by partner status, average procurement cycle time and average procurement cycle. Deliver and pitch your topic in the best possible manner with this Real Estate Developers Funding Alternatives Vendor Compliance Kpi Dashboard Infographics PDF. Use them to share invaluable insights on Average Procurement Cycle, Supplier Classification and impress your audience. This template can be altered and modified as per your expectations. So, grab it now.
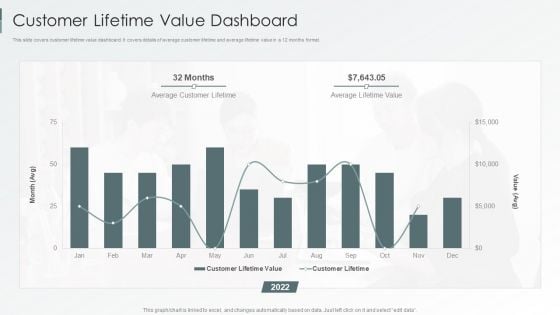
Enterprise Sustainability Performance Metrics Customer Lifetime Value Dashboard Graphics PDF
This slide covers customer lifetime value dashboard. It covers details of average customer lifetime and average lifetime value in a 12 months format.Deliver and pitch your topic in the best possible manner with this Enterprise Sustainability Performance Metrics Customer Lifetime Value Dashboard Graphics PDF. Use them to share invaluable insights on Average Customer, Lifetime Value, Customer Lifetime and impress your audience. This template can be altered and modified as per your expectations. So, grab it now.
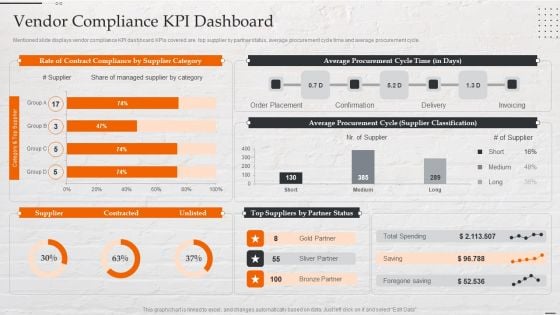
Capital Investment Options Vendor Compliance Kpi Dashboard Designs PDF
Mentioned slide displays vendor compliance KPI dashboard. KPIs covered are top supplier by partner status, average procurement cycle time and average procurement cycle. Deliver an awe inspiring pitch with this creative Capital Investment Options Vendor Compliance Kpi Dashboard Designs PDF bundle. Topics like Average Procurement, Cycle Time, Confirmation, Order Placement can be discussed with this completely editable template. It is available for immediate download depending on the needs and requirements of the user.
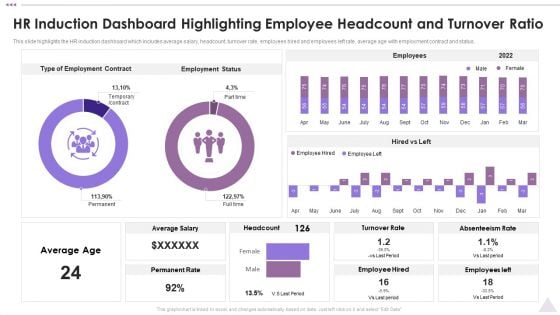
New Staff Orientation Session HR Induction Dashboard Highlighting Employee Headcount Background PDF
This slide highlights the HR induction dashboard which includes average salary, headcount, turnover rate, employees hired and employees left rate, average age with employment contract and status. Deliver an awe inspiring pitch with this creative New Staff Orientation Session HR Induction Dashboard Highlighting Employee Headcount Background PDF bundle. Topics like Employment Status, Employees, Average Salary can be discussed with this completely editable template. It is available for immediate download depending on the needs and requirements of the user.
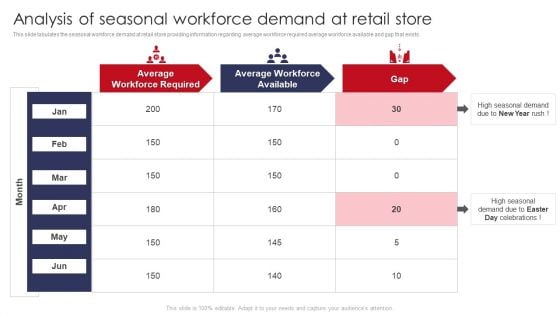
Analysis Of Seasonal Workforce Demand At Retail Store Retail Outlet Operations Performance Structure PDF
This slide tabulates the seasonal workforce demand at retail store providing information regarding average workforce required average workforce available and gap that exists.Deliver an awe inspiring pitch with this creative Analysis Of Seasonal Workforce Demand At Retail Store Retail Outlet Operations Performance Structure PDF bundle. Topics like Workforce Required, Average Workforce, Seasonal Demand can be discussed with this completely editable template. It is available for immediate download depending on the needs and requirements of the user.
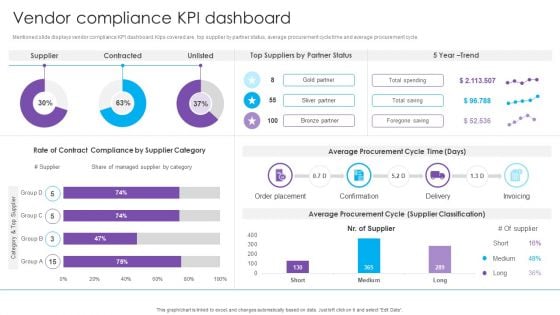
Vendor Compliance KPI Dashboard Real Estate Project Funding Inspiration PDF
Mentioned slide displays vendor compliance KPI dashboard. Kips covered are top supplier by partner status, average procurement cycle time and average procurement cycle.Deliver and pitch your topic in the best possible manner with this Vendor Compliance KPI Dashboard Real Estate Project Funding Inspiration PDF. Use them to share invaluable insights on Contract Compliance, Average Procurement, Order Placement and impress your audience. This template can be altered and modified as per your expectations. So, grab it now.
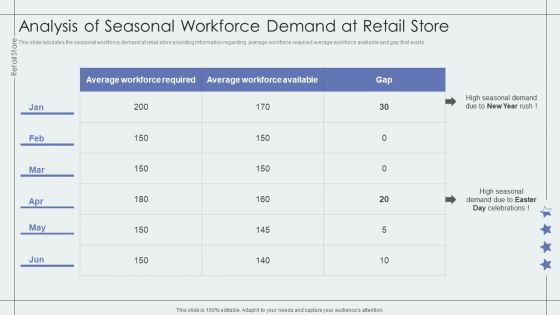
Analysis Of Seasonal Workforce Demand At Retail Store Retail Outlet Performance Assessment Formats PDF
This slide tabulates the seasonal workforce demand at retail store providing information regarding average workforce required average workforce available and gap that exists.Deliver and pitch your topic in the best possible manner with this Analysis Of Seasonal Workforce Demand At Retail Store Retail Outlet Performance Assessment Formats PDF. Use them to share invaluable insights on Average Workforce, Seasonal Demand, Day Celebrations and impress your audience. This template can be altered and modified as per your expectations. So, grab it now.
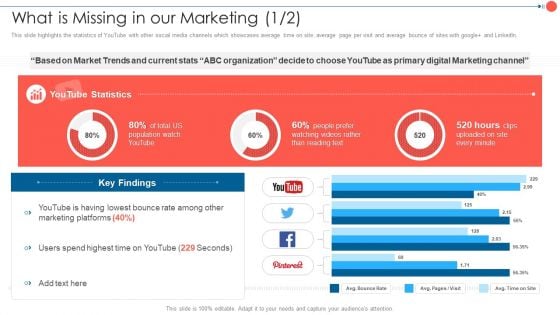
Youtube Advertising Techniques What Is Missing In Our Marketing Professional PDF
This slide highlights the statistics of YouTube with other social media channels which showcases average time on site, average page per visit and average bounce of sites with google and LinkedIn. Deliver an awe inspiring pitch with this creative Youtube Advertising Techniques What Is Missing In Our Marketing Professional PDF bundle. Topics like Watching Videos, People Prefer, Population Watch can be discussed with this completely editable template. It is available for immediate download depending on the needs and requirements of the user.

 Home
Home