Bank Dashboard
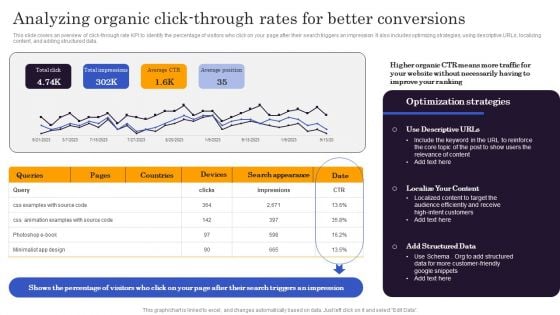
Marketers Guide To Data Analysis Optimization Analyzing Organic Click Through Rates For Better Conversions Structure PDF
This slide covers an overview of click-through rate KPI to identify the percentage of visitors who click on your page after their search triggers an impression. It also includes optimizing strategies, using descriptive URLs, localizing content, and adding structured data. Find highly impressive Marketers Guide To Data Analysis Optimization Analyzing Organic Click Through Rates For Better Conversions Structure PDF on Slidegeeks to deliver a meaningful presentation. You can save an ample amount of time using these presentation templates. No need to worry to prepare everything from scratch because Slidegeeks experts have already done a huge research and work for you. You need to download Marketers Guide To Data Analysis Optimization Analyzing Organic Click Through Rates For Better Conversions Structure PDF for your upcoming presentation. All the presentation templates are 100 percent editable and you can change the color and personalize the content accordingly. Download now.
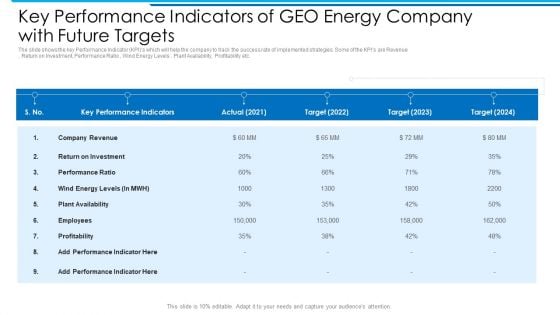
Key Performance Indicators Of GEO Energy Company With Future Targets Topics PDF
The slide shows the key Performance Indicator KPIs which will help the company to track the success rate of implemented strategies. Some of the KPIs are Revenue , Return on Investment, Performance Ratio , Wind Energy Levels , Plant Availability, Profitability etc.Deliver and pitch your topic in the best possible manner with this key performance indicators of geo energy company with future targets topics pdf. Use them to share invaluable insights on return on investment, plant availability, key performance indicators and impress your audience. This template can be altered and modified as per your expectations. So, grab it now.
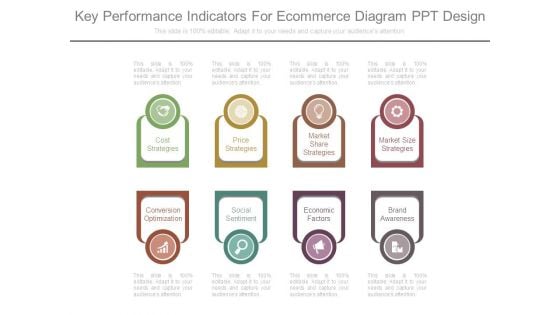
Key Performance Indicators For Ecommerce Diagram Ppt Design
This is a key performance indicators for ecommerce diagram ppt design. This is a eight stage process. The stages in this process are cost strategies, price strategies, market share strategies, market size strategies, conversion optimization, social sentiment, economic factors, brand awareness.
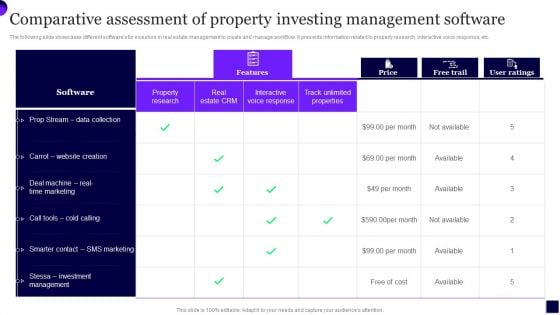
Comparative Assessment Of Property Investing Management Software Template PDF
The following slide showcases different softwares for investors in real estate management to create and manage workflow. It presents information related to property research, interactive voice response, etc. Showcasing this set of slides titled Comparative Assessment Of Property Investing Management Software Template PDF. The topics addressed in these templates are Data Collection, Marketing, Investment. All the content presented in this PPT design is completely editable. Download it and make adjustments in color, background, font etc. as per your unique business setting.
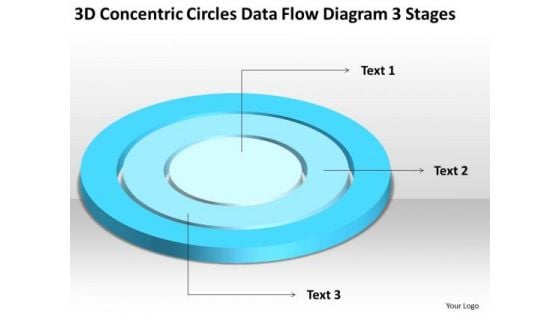
Concentric Circles Data Flow Diagram 3 Stages Business Plan For Non Profit PowerPoint Slides
We present our concentric circles data flow diagram 3 stages business plan for non profit PowerPoint Slides.Present our Circle Charts PowerPoint Templates because Our PowerPoint Templates and Slides team portray an attitude of elegance. Personify this quality by using them regularly. Download our Shapes PowerPoint Templates because You will get more than you ever bargained for. Download our Signs PowerPoint Templates because Timeline crunches are a fact of life. Meet all deadlines using our PowerPoint Templates and Slides. Use our Maketing PowerPoint Templates because you can Add colour to your speech with our PowerPoint Templates and Slides. Your presentation will leave your audience speechless. Use our Metaphors-Visual Concepts PowerPoint Templates because Our PowerPoint Templates and Slides are like the strings of a tennis racquet. Well strung to help you serve aces.Use these PowerPoint slides for presentations relating to diagram, circular, market, bar, advertise, interface, business, concept, vector, sign, success, presentation, symbol, template, circle, brochure, finance, data, description, report, marketing, title, label, abstract, management, graph, four, illustration, icon, pie, chart, strategy, catalog, research, web, design, growth, text, professional, banner, account, profit, information, background, info-graphic, analyze, financial, button, goals. The prominent colors used in the PowerPoint template are Blue, Blue light, White. Our Concentric Circles Data Flow Diagram 3 Stages Business Plan For Non Profit PowerPoint Slides are evidently advantageous. The balance will tilt in your favour.
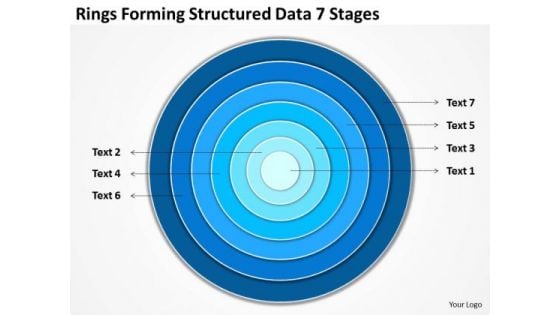
Rings Forming Structured Data 7 Stages Step By Business Plan Template PowerPoint Slides
We present our rings forming structured data 7 stages step by business plan template PowerPoint Slides.Use our Circle Charts PowerPoint Templates because They will Put your wonderful verbal artistry on display. Our PowerPoint Templates and Slides will provide you the necessary glam and glitter. Present our Shapes PowerPoint Templates because It will Give impetus to the hopes of your colleagues. Our PowerPoint Templates and Slides will aid you in winning their trust. Download and present our Signs PowerPoint Templates because Our PowerPoint Templates and Slides will let you Clearly mark the path for others to follow. Download and present our Maketing PowerPoint Templates because It will mark the footprints of your journey. Illustrate how they will lead you to your desired destination. Use our Metaphors-Visual Concepts PowerPoint Templates because Our PowerPoint Templates and Slides has conjured up a web of all you need with the help of our great team. Use them to string together your glistening ideas.Use these PowerPoint slides for presentations relating to diagram, circular, market, bar, advertise, interface, business, concept, vector, sign, success, presentation, symbol, template, circle, brochure, finance, data, description, report, marketing, title, label, abstract, management, graph, four, illustration, icon, pie, chart, strategy, catalog, research, web, design, growth, text, professional, banner, account, profit, information, background, info-graphic, analyze, financial, button, goals. The prominent colors used in the PowerPoint template are Blue, Blue light, White. Face your audience with our Rings Forming Structured Data 7 Stages Step By Business Plan Template PowerPoint Slides. You will come out on top.
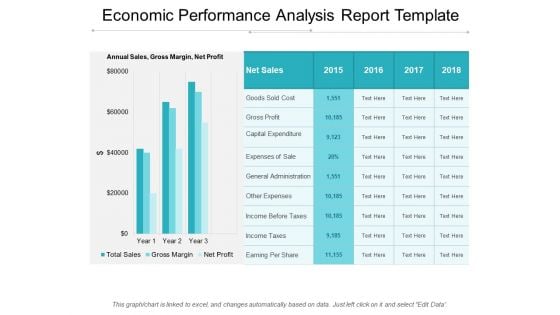
Economic Performance Analysis Report Template Ppt PowerPoint Presentation Infographic Template Portrait
Presenting this set of slides with name economic performance analysis report template ppt powerpoint presentation infographic template portrait. The topics discussed in these slides are annual performance review, process, business performance. This is a completely editable PowerPoint presentation and is available for immediate download. Download now and impress your audience.

Computer Mediated Reality Investor Funding Elevator Understanding Our Growth Potential In American Market Microsoft PDF
The following slide displays the key stats to evaluate and assess the American market as a potential place to launch the product and services, the following slide displays major states to invest in along with key industry segments and trends. Deliver and pitch your topic in the best possible manner with this computer mediated reality investor funding elevator understanding our growth potential in american market microsoft pdf. Use them to share invaluable insights on growth, market, technology and impress your audience. This template can be altered and modified as per your expectations. So, grab it now.
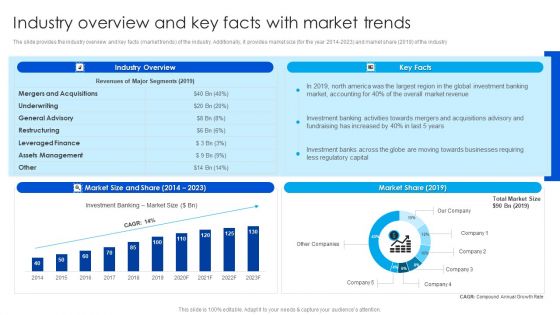
Strategy To Raise Funds Industry Overview And Key Facts With Market Trends Portrait PDF
The slide provides the industry overview and key facts market trends of the industry. Additionally, it provides market size for the year 2014 to 2023 and market share 2019 of the industry. Slidegeeks is here to make your presentations a breeze with Strategy To Raise Funds Industry Overview And Key Facts With Market Trends Portrait PDF With our easy-to-use and customizable templates, you can focus on delivering your ideas rather than worrying about formatting. With a variety of designs to choose from, youre sure to find one that suits your needs. And with animations and unique photos, illustrations, and fonts, you can make your presentation pop. So whether youre giving a sales pitch or presenting to the board, make sure to check out Slidegeeks first.
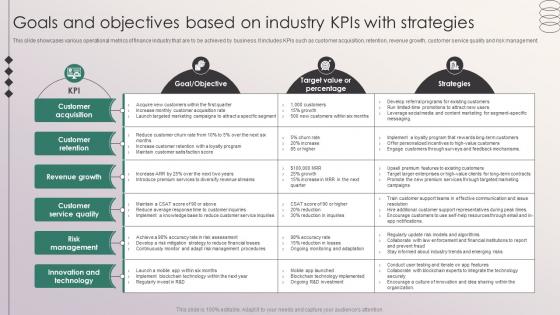
Goals And Objectives Based On Industry KPIs With Strategies Penetrating Markets With Financial Strategy SS V
This slide showcases various operational metrics of finance industry that are to be achieved by business. It includes KPIs such as customer acquisition, retention, revenue growth, customer service quality and risk management. Are you in need of a template that can accommodate all of your creative concepts This one is crafted professionally and can be altered to fit any style. Use it with Google Slides or PowerPoint. Include striking photographs, symbols, depictions, and other visuals. Fill, move around, or remove text boxes as desired. Test out color palettes and font mixtures. Edit and save your work, or work with colleagues. Download Goals And Objectives Based On Industry KPIs With Strategies Penetrating Markets With Financial Strategy SS V and observe how to make your presentation outstanding. Give an impeccable presentation to your group and make your presentation unforgettable. This slide showcases various operational metrics of finance industry that are to be achieved by business. It includes KPIs such as customer acquisition, retention, revenue growth, customer service quality and risk management.
Economic Trends Analysis Dollar Sign With Four Arrows Ppt PowerPoint Presentation Layouts Icons
This is a economic trends analysis dollar sign with four arrows ppt powerpoint presentation layouts icons. This is a four stage process. The stages in this process are stock market, financial markets, bull market.
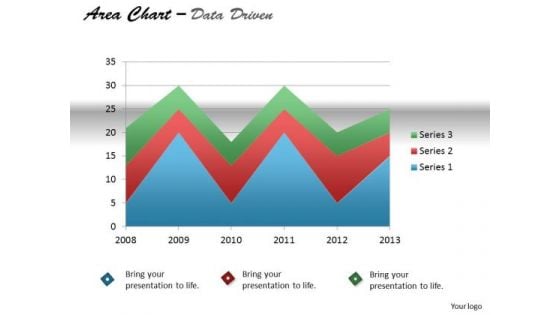
Quantitative Data Analysis Driven Display Series With Area Chart PowerPoint Slides Templates
Our quantitative data analysis driven display series with area chart powerpoint slides Templates Enjoy Drama. They Provide Entertaining Backdrops.
Marketers Guide To Data Analysis Optimization Tracking Social Media Engagement Rate For Improving Conversions Brochure PDF
This slide covers an overview of the social media engagement rate to identify if the content is reaching the target audience. It also includes improvement strategies such as having a consistent, authentic voice, knowing your algorithms, and creating shareable content. Do you have to make sure that everyone on your team knows about any specific topic I yes, then you should give Marketers Guide To Data Analysis Optimization Tracking Social Media Engagement Rate For Improving Conversions Brochure PDF a try. Our experts have put a lot of knowledge and effort into creating this impeccable Marketers Guide To Data Analysis Optimization Tracking Social Media Engagement Rate For Improving Conversions Brochure PDF. You can use this template for your upcoming presentations, as the slides are perfect to represent even the tiniest detail. You can download these templates from the Slidegeeks website and these are easy to edit. So grab these today.

Golden Key With Red Dollar Sign PowerPoint Templates Ppt Backgrounds For Slides 1212
We present our Golden Key With Red Dollar Sign PowerPoint Templates PPT Backgrounds For Slides 1212.Download and present our Future PowerPoint Templates because let this slide illustrates others piggyback on you to see well over the horizon. Present our Money PowerPoint Templates because you can Be the cynosure of all eyes with our template depicting . Present our Security PowerPoint Templates because it have all to represent to your viewers. Download and present our Business PowerPoint Templates because project your ideas to you colleagues and complete the full picture. Download and present our Finance PowerPoint Templates because they will Amplify your plans to have dedicated sub groups working on related but distinct tasks.Use these PowerPoint slides for presentations relating to Golden key with red dollar, finance, business, security, future, money. The prominent colors used in the PowerPoint template are Red, Yellow, Black. Customers tell us our Golden Key With Red Dollar Sign PowerPoint Templates PPT Backgrounds For Slides 1212 will help them to explain complicated concepts. Presenters tell us our finance PowerPoint templates and PPT Slides are Efficacious. Use our Golden Key With Red Dollar Sign PowerPoint Templates PPT Backgrounds For Slides 1212 are topically designed to provide an attractive backdrop to any subject. PowerPoint presentation experts tell us our business PowerPoint templates and PPT Slides are Precious. Customers tell us our Golden Key With Red Dollar Sign PowerPoint Templates PPT Backgrounds For Slides 1212 are Versatile. Presenters tell us our future PowerPoint templates and PPT Slides look good visually. Crunch the data with our Golden Key With Red Dollar Sign PowerPoint Templates Ppt Backgrounds For Slides 1212. Derive accurate conclusions with your ideas.
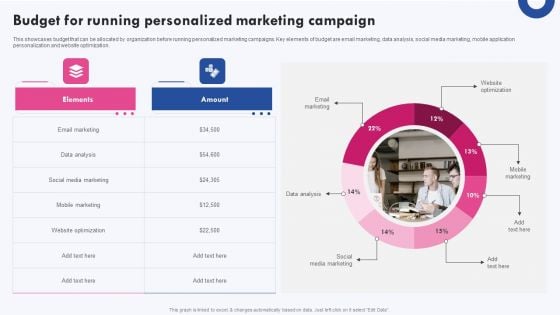
Targeted Marketing Campaigns To Improve Buyers Experience Budget For Running Personalized Marketing Information PDF
This showcases budget that can be allocated by organization before running personalized marketing campaigns. Key elements of budget are email marketing, data analysis, social media marketing, mobile application personalization and website optimization. Boost your pitch with our creative Targeted Marketing Campaigns To Improve Buyers Experience Budget For Running Personalized Marketing Information PDF. Deliver an awe-inspiring pitch that will mesmerize everyone. Using these presentation templates you will surely catch everyones attention. You can browse the ppts collection on our website. We have researchers who are experts at creating the right content for the templates. So you do not have to invest time in any additional work. Just grab the template now and use them.
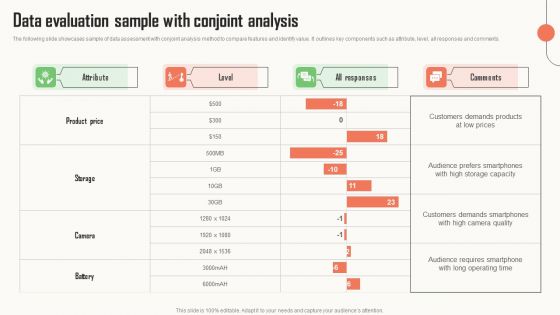
Strategic Market Insight Implementation Guide Data Evaluation Sample With Conjoint Analysis Background PDF
The following slide showcases sample of data assessment with conjoint analysis method to compare features and identify value. It outlines key components such as attribute, level, all responses and comments. Slidegeeks is here to make your presentations a breeze with Strategic Market Insight Implementation Guide Data Evaluation Sample With Conjoint Analysis Background PDF With our easy to use and customizable templates, you can focus on delivering your ideas rather than worrying about formatting. With a variety of designs to choose from, you are sure to find one that suits your needs. And with animations and unique photos, illustrations, and fonts, you can make your presentation pop. So whether you are giving a sales pitch or presenting to the board, make sure to check out Slidegeeks first.
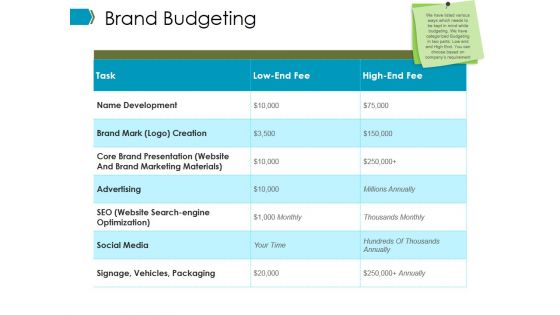
Brand Budgeting Ppt PowerPoint Presentation Pictures Slides
This is a brand budgeting ppt powerpoint presentation pictures slides. This is a seven stage process. The stages in this process are name development, brand mark, core brand presentation, advertising, social media.
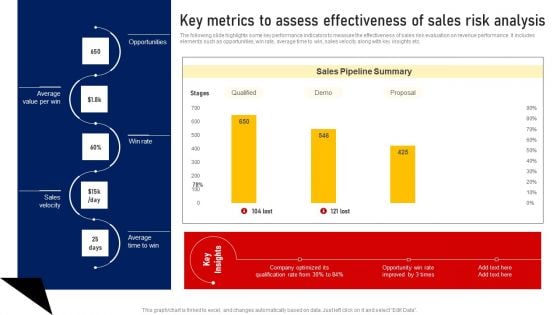
Performing Sales Risk Analysis Procedure Key Metrics To Assess Effectiveness Of Sales Risk Analysis Brochure PDF
The following slide highlights some key performance indicators to measure the effectiveness of sales risk evaluation on revenue performance. It includes elements such as opportunities, win rate, average time to win, sales velocity along with key insights etc. Get a simple yet stunning designed Performing Sales Risk Analysis Procedure Key Metrics To Assess Effectiveness Of Sales Risk Analysis Brochure PDF. It is the best one to establish the tone in your meetings. It is an excellent way to make your presentations highly effective. So, download this PPT today from Slidegeeks and see the positive impacts. Our easy to edit Performing Sales Risk Analysis Procedure Key Metrics To Assess Effectiveness Of Sales Risk Analysis Brochure PDF can be your go to option for all upcoming conferences and meetings. So, what are you waiting for Grab this template today.
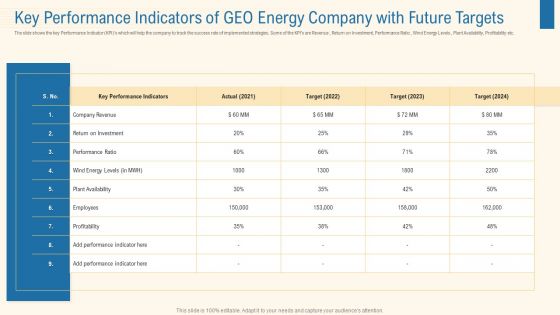
Key Performance Indicators Of Geo Energy Company With Future Targets Pictures PDF
The slide shows the key Performance Indicator KPIs which will help the company to track the success rate of implemented strategies. Some of the KPIs are Revenue , Return on Investment, Performance Ratio , Wind Energy Levels , Plant Availability, Profitability etc. Deliver an awe inspiring pitch with this creative key performance indicators of geo energy company with future targets pictures pdf bundle. Topics like company revenue, return on investment, performance ratio, plant availability, employees, profitability can be discussed with this completely editable template. It is available for immediate download depending on the needs and requirements of the user.
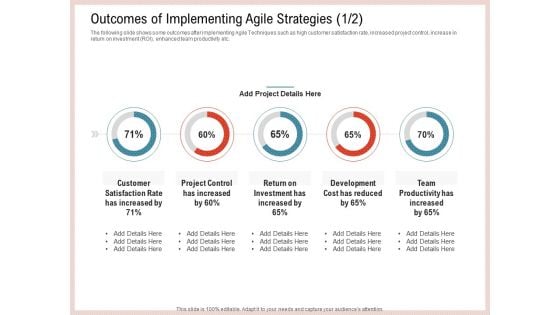
Agile Model Improve Task Team Performance Outcomes Of Implementing Agile Strategies Cost Infographics PDF
The following slide shows some outcomes after implementing Agile Techniques such as high customer satisfaction rate, increased project control, increase in return on investment ROI, enhanced team productivity etc. Deliver and pitch your topic in the best possible manner with this agile model improve task team performance outcomes of implementing agile strategies cost infographics pdf. Use them to share invaluable insights on investment, development cost, team productivity and impress your audience. This template can be altered and modified as per your expectations. So, grab it now.
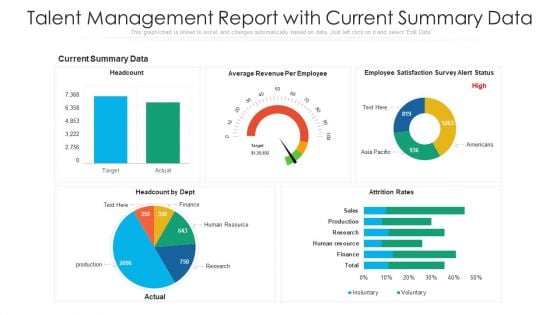
Talent Management Report With Current Summary Data Ppt Gallery Example Topics PDF
Showcasing this set of slides titled talent management report with current summary data ppt gallery example topics pdf. The topics addressed in these templates are human resource, research, production. All the content presented in this PPT design is completely editable. Download it and make adjustments in color, background, font etc. as per your unique business setting.
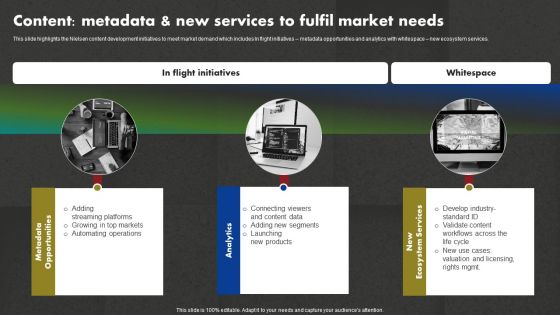
Data And Customer Analysis Company Outline Content Metadata And New Services Infographics PDF
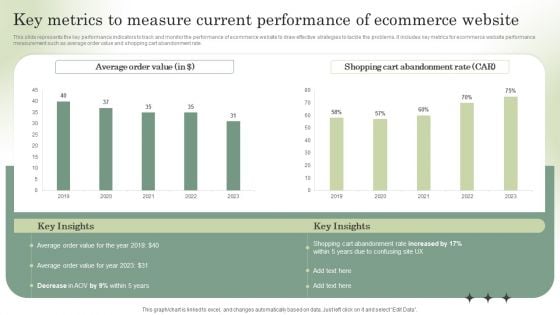
Optimizing Online Stores Key Metrics To Measure Current Performance Download PDF
This slide represents the key performance indicators to track and monitor the performance of ecommerce website to draw effective strategies to tackle the problems. It includes key metrics for ecommerce website performance measurement such as average order value and shopping cart abandonment rate. The Optimizing Online Stores Key Metrics To Measure Current Performance Download PDF is a compilation of the most recent design trends as a series of slides. It is suitable for any subject or industry presentation, containing attractive visuals and photo spots for businesses to clearly express their messages. This template contains a variety of slides for the user to input data, such as structures to contrast two elements, bullet points, and slides for written information. Slidegeeks is prepared to create an impression.
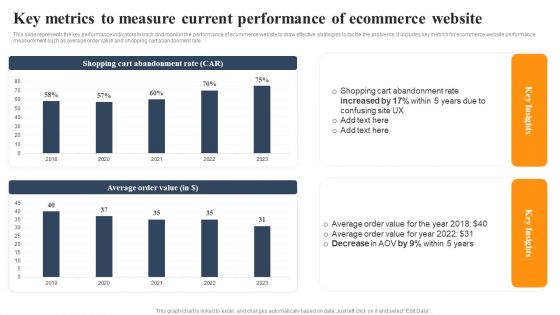
Implementing An Effective Ecommerce Management Framework Key Metrics Current Performance Of Ecommerce Website Slides PDF
This slide represents the key performance indicators to track and monitor the performance of ecommerce website to draw effective strategies to tackle the problems. It includes key metrics for ecommerce website performance measurement such as average order value and shopping cart abandonment rate. The Implementing An Effective Ecommerce Management Framework Key Metrics Current Performance Of Ecommerce Website Slides PDF is a compilation of the most recent design trends as a series of slides. It is suitable for any subject or industry presentation, containing attractive visuals and photo spots for businesses to clearly express their messages. This template contains a variety of slides for the user to input data, such as structures to contrast two elements, bullet points, and slides for written information. Slidegeeks is prepared to create an impression.
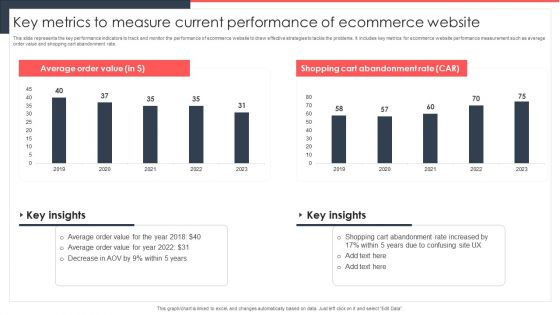
Implementing Management System To Enhance Ecommerce Processes Key Metrics To Measure Current Performance Themes PDF
This slide represents the key performance indicators to track and monitor the performance of ecommerce website to draw effective strategies to tackle the problems. It includes key metrics for ecommerce website performance measurement such as average order value and shopping cart abandonment rate. Do you know about Slidesgeeks Implementing Management System To Enhance Ecommerce Processes Key Metrics To Measure Current Performance Themes PDF. These are perfect for delivering any kind od presentation. Using it, create PowerPoint presentations that communicate your ideas and engage audiences. Save time and effort by using our pre designed presentation templates that are perfect for a wide range of topic. Our vast selection of designs covers a range of styles, from creative to business, and are all highly customizable and easy to edit. Download as a PowerPoint template or use them as Google Slides themes.
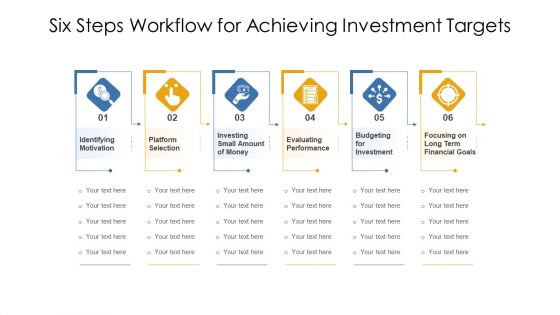
Six Steps Workflow For Achieving Investment Targets Ppt PowerPoint Presentation Infographic Template Portfolio PDF
Persuade your audience using this six steps workflow for achieving investment targets ppt powerpoint presentation infographic template portfolio pdf. This PPT design covers six stages, thus making it a great tool to use. It also caters to a variety of topics including budgeting for investment, focusing on long term financial goals, evaluating performance. Download this PPT design now to present a convincing pitch that not only emphasizes the topic but also showcases your presentation skills.
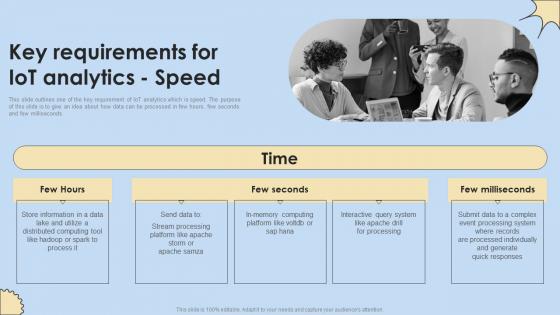
Key Requirements For IoT Analytics Speed Internet Of Things Analysis Slides Pdf
This slide outlines one of the key requirement of IoT analytics which is speed. The purpose of this slide is to give an idea about how data can be processed in few hours, few seconds and few milliseconds. The best PPT templates are a great way to save time, energy, and resources. Slidegeeks have 100 percent editable powerpoint slides making them incredibly versatile. With these quality presentation templates, you can create a captivating and memorable presentation by combining visually appealing slides and effectively communicating your message. Download Key Requirements For IoT Analytics Speed Internet Of Things Analysis Slides Pdf from Slidegeeks and deliver a wonderful presentation. This slide outlines one of the key requirement of IoT analytics which is speed. The purpose of this slide is to give an idea about how data can be processed in few hours, few seconds and few milliseconds.
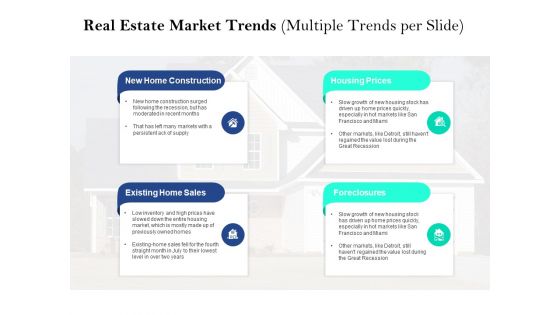
Property Investment Strategies Real Estate Market Trends Multiple Trends Per Slide Ppt PowerPoint Presentation Infographics Slides PDF
This is a new home construction, housing prices, existing home sales, foreclosures, construction. template with various stages. Focus and dispense information on four stages using this creative set, that comes with editable features. It contains large content boxes to add your information on topics like new home construction, housing prices, existing home sales, foreclosures, construction. You can also showcase facts, figures, and other relevant content using this PPT layout. Grab it now.
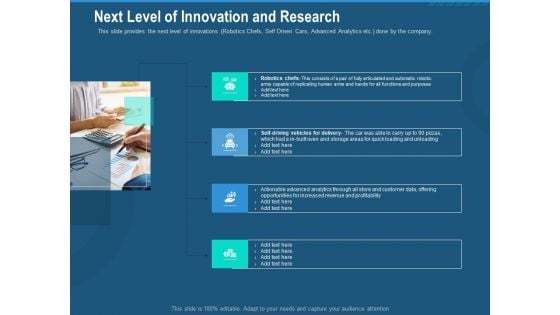
Investment Pitch To Generate Capital From Series B Venture Round Next Level Of Innovation And Research Professional PDF
This slide provides the next level of innovations Robotics Chefs, Self Driven Cars, Advanced Analytics etc. done by the company. This is a investment pitch to generate capital from series b venture round next level of innovation and research professional pdf template with various stages. Focus and dispense information on four stages using this creative set, that comes with editable features. It contains large content boxes to add your information on topics like robotics chefs, quick loading, store and customer data, offering opportunities, increased revenue and profitability. You can also showcase facts, figures, and other relevant content using this PPT layout. Grab it now.
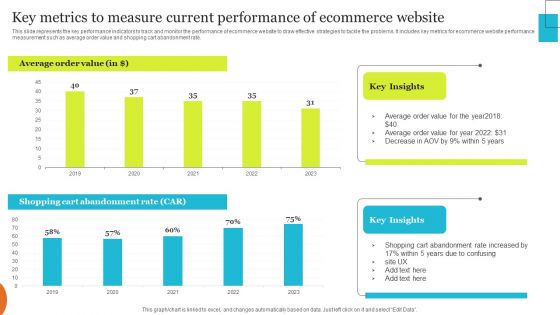
Implementing Effective Ecommerce Managemnet Platform Key Metrics To Measure Current Performance Clipart PDF
This slide represents the key performance indicators to track and monitor the performance of ecommerce website to draw effective strategies to tackle the problems. It includes key metrics for ecommerce website performance measurement such as average order value and shopping cart abandonment rate. Want to ace your presentation in front of a live audience Our Implementing Effective Ecommerce Managemnet Platform Key Metrics To Measure Current Performance Clipart PDF can help you do that by engaging all the users towards you. Slidegeeks experts have put their efforts and expertise into creating these impeccable powerpoint presentations so that you can communicate your ideas clearly. Moreover, all the templates are customizable, and easy to edit and downloadable. Use these for both personal and commercial use.
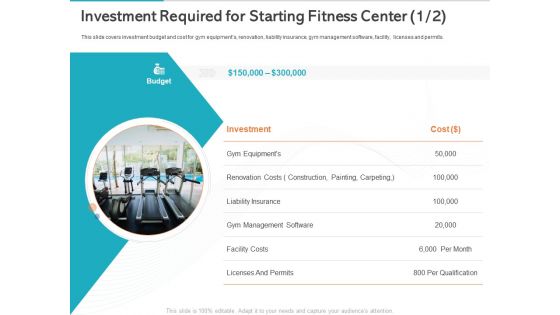
Gym Health And Fitness Market Industry Report Investment Required For Starting Fitness Center Insurance Ppt Show Deck PDF
Presenting this set of slides with name gym health and fitness market industry report investment required for starting fitness center insurance ppt show deck pdf. The topics discussed in these slides are investment, gym equipments, renovation costs, construction, painting, carpeting, liability insurance, gym management software, facility costs, licenses and permits. This is a completely editable PowerPoint presentation and is available for immediate download. Download now and impress your audience.
Data Analytics IT Timeline For Data Science Implementation In The Organization Ppt Portfolio Icons PDF
This slide represents the timeline for the data science projects and a list of tasks performed each month, from training to work on projects. This is a data analytics it timeline for data science implementation in the organization ppt portfolio icons pdf template with various stages. Focus and dispense information on four stages using this creative set, that comes with editable features. It contains large content boxes to add your information on topics like exploratory analysis, final analysis, data cleaning, conditioning and transformation, data gathering from different resources. You can also showcase facts, figures, and other relevant content using this PPT layout. Grab it now.
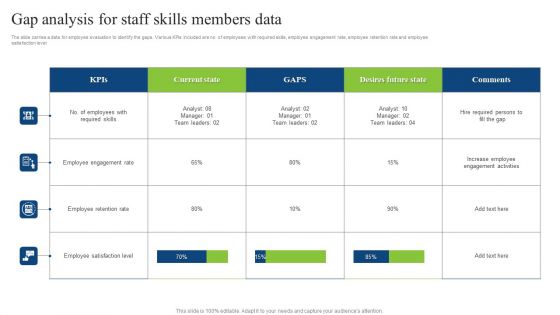
Gap Analysis For Staff Skills Members Data Guidelines PDF
The slide carries a data for employee evaluation to identify the gaps. Various KPIs included are no. of employees with required skills, employee engagement rate, employee retention rate and employee satisfaction level. Showcasing this set of slides titled Gap Analysis For Staff Skills Members Data Guidelines PDF. The topics addressed in these templates are Employee Engagement Rate, Employee Retention Rate. All the content presented in this PPT design is completely editable. Download it and make adjustments in color, background, font etc. as per your unique business setting.

Enterprise Problem Solving And Intellect Foundational Data Modelling Applications Ppt PowerPoint Presentation Inspiration Example Introduction PDF
Presenting this set of slides with name enterprise problem solving and intellect foundational data modelling applications ppt powerpoint presentation inspiration example introduction pdf. This is a one stage process. The stages in this process are sources systems, data cubes, healthcare, edw model, financial, cinical analytics and reporting, cost, charge, encounter. This is a completely editable PowerPoint presentation and is available for immediate download. Download now and impress your audience.
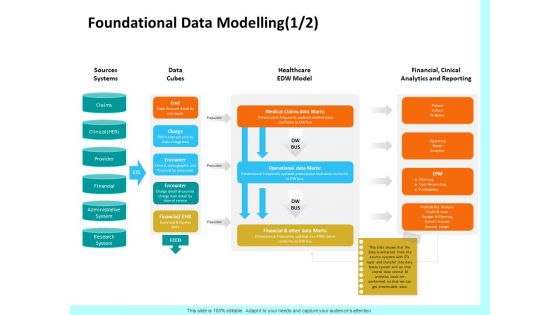
Firm Productivity Administration Foundational Data Modelling Sources Ppt PowerPoint Presentation Inspiration Designs Download PDF
Presenting this set of slides with name firm productivity administration foundational data modelling sources ppt powerpoint presentation inspiration designs download pdf. This is a one stage process. The stages in this process are sources systems, data cubes, healthcare, edw model, financial, cinical analytics and reporting, cost, charge, encounter. This is a completely editable PowerPoint presentation and is available for immediate download. Download now and impress your audience.
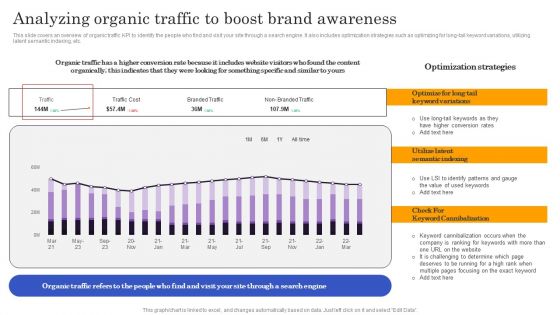
Marketers Guide To Data Analysis Optimization Analyzing Organic Traffic To Boost Brand Awareness Download PDF
This slide covers an overview of organic traffic KPI to identify the people who find and visit your site through a search engine. It also includes optimization strategies such as optimizing for long-tail keyword variations, utilizing latent semantic indexing, etc. If your project calls for a presentation, then Slidegeeks is your go to partner because we have professionally designed, easy to edit templates that are perfect for any presentation. After downloading, you can easily edit Marketers Guide To Data Analysis Optimization Analyzing Organic Traffic To Boost Brand Awareness Download PDF and make the changes accordingly. You can rearrange slides or fill them with different images. Check out all the handy templates
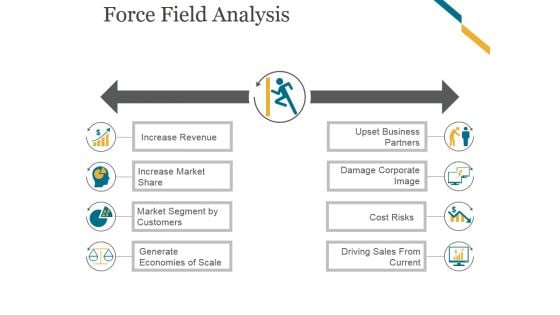
Force Field Analysis Template 1 Ppt PowerPoint Presentation Professional
This is a force field analysis template 1 ppt powerpoint presentation professional. This is a eight stage process. The stages in this process are increase revenue, increase market share, market segment by customers, generate economies of scale, upset business partners, damage corporate image, cost risks, driving sales from current.
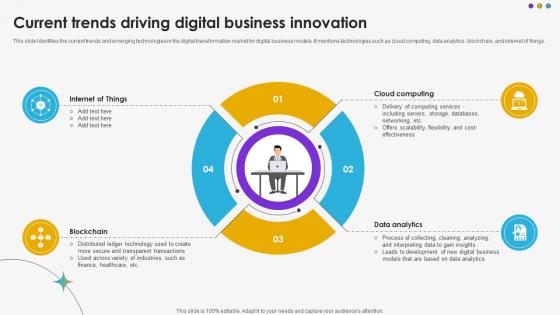
Current Trends Driving Digital Business Innovation DT SS V
This slide Identifies the current trends and emerging technologies in the digital transformation market for digital business models. It mentions technologies such as cloud computing, data analytics, blockchain, and internet of things.The best PPT templates are a great way to save time, energy, and resources. Slidegeeks have 100 percent editable powerpoint slides making them incredibly versatile. With these quality presentation templates, you can create a captivating and memorable presentation by combining visually appealing slides and effectively communicating your message. Download Current Trends Driving Digital Business Innovation DT SS V from Slidegeeks and deliver a wonderful presentation. This slide Identifies the current trends and emerging technologies in the digital transformation market for digital business models. It mentions technologies such as cloud computing, data analytics, blockchain, and internet of things.
Financial Consultant Creating Return On Investment Report Vector Icon Ppt PowerPoint Presentation Slides Show PDF
Presenting this set of slides with name financial consultant creating return on investment report vector icon ppt powerpoint presentation slides show pdf. This is a three stage process. The stages in this process are financial consultant creating return on investment report vector icon. This is a completely editable PowerPoint presentation and is available for immediate download. Download now and impress your audience.
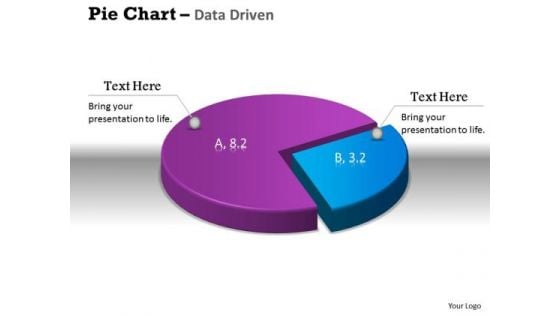
Data Analysis Excel 3d Pie Chart Shows Relative Size Of PowerPoint Templates
Get The Doers Into Action. Activate Them With Our data analysis excel 3d pie chart shows relative size of Powerpoint Templates.
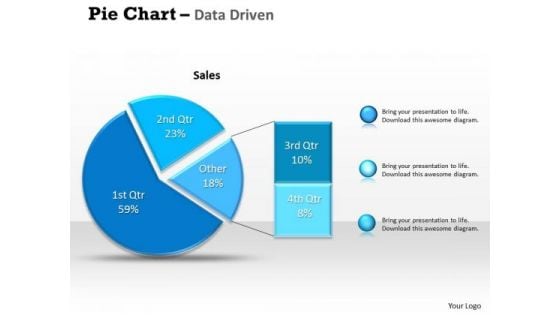
Data Analysis Excel Driven Percentage Breakdown Pie Chart PowerPoint Slides Templates
Be A Donor Of Great Ideas. Display Your Charity On Our data analysis excel driven percentage breakdown pie chart powerpoint slides Templates.
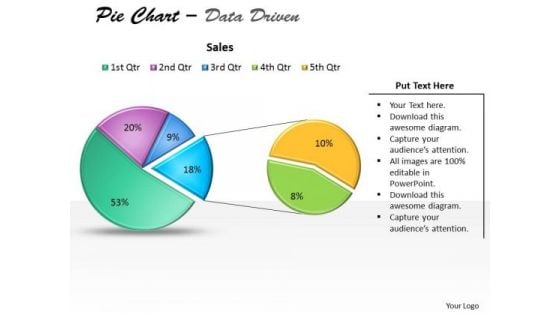
Data Analysis Excel Driven Pie Chart For Business Stratregy PowerPoint Slides Templates
Open Up Doors That Lead To Success. Our data analysis excel driven pie chart for business stratregy powerpoint slides Templates Provide The Handles.

Data Analysis Excel Driven Pie Chart For Easy Comparison PowerPoint Slides Templates
Our data analysis excel driven pie chart for easy comparison powerpoint slides Templates Abhor Doodling. They Never Let The Interest Flag.
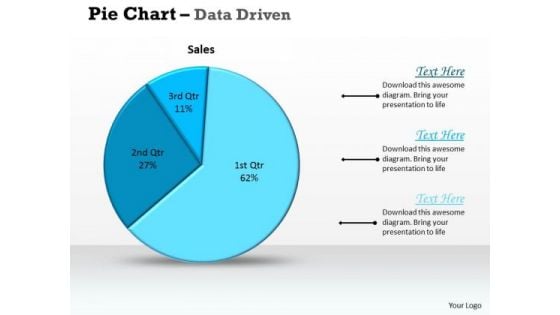
Data Analysis Excel Driven Pie Chart For Sales Process PowerPoint Slides Templates
Deliver The Right Dose With Our data analysis excel driven pie chart for sales process powerpoint slides Templates . Your Ideas Will Get The Correct Illumination.
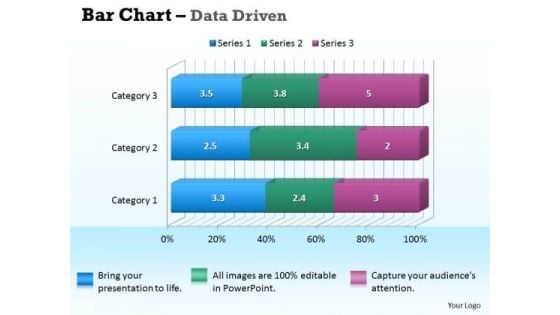
Data Analysis In Excel 3d Bar Chart For Business Information PowerPoint Templates
Our data analysis in excel 3d bar chart for business information Powerpoint Templates Deliver At Your Doorstep. Let Them In For A Wonderful Experience.
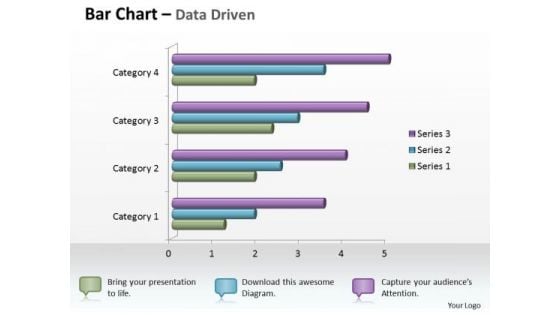
Data Analysis In Excel 3d Bar Chart For Business Statistics PowerPoint Templates
Knock On The Door To Success With Our data analysis in excel 3d bar chart for business statistics Powerpoint Templates . Be Assured Of Gaining Entry.
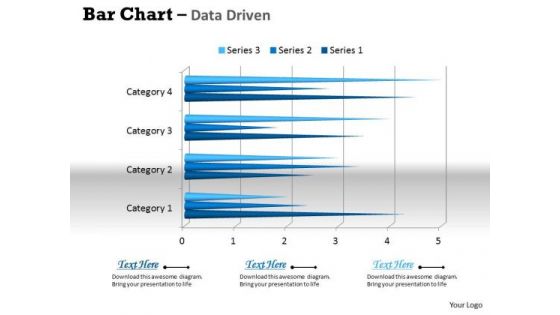
Data Analysis In Excel 3d Bar Chart For Business Trends PowerPoint Templates
Connect The Dots With Our data analysis in excel 3d bar chart for business trends Powerpoint Templates . Watch The Whole Picture Clearly Emerge.
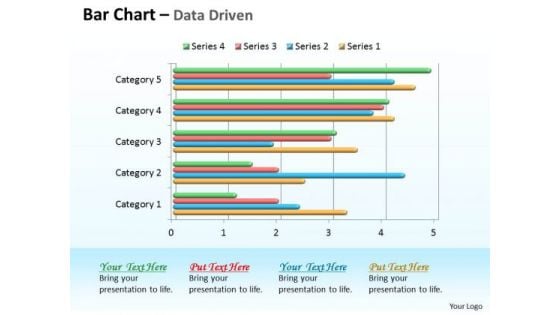
Data Analysis In Excel 3d Bar Chart For Comparison Of Time Series PowerPoint Templates
Double Your Chances With Our data analysis in excel 3d bar chart for comparison of time series Powerpoint Templates . The Value Of Your Thoughts Will Increase Two-Fold.
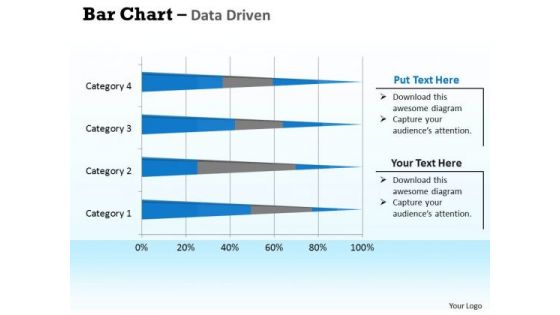
Data Analysis In Excel 3d Bar Chart For Interpretation PowerPoint Templates
Double Up Our data analysis in excel 3d bar chart for interpretation Powerpoint Templates With Your Thoughts. They Will Make An Awesome Pair.
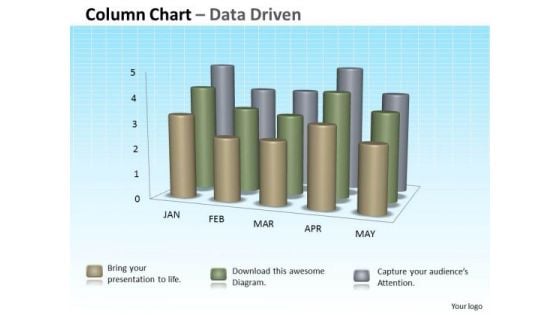
Data Analysis In Excel 3d Column Chart For Sets Of Information PowerPoint Templates
Double The Impact With Our data analysis in excel 3d column chart for sets of information Powerpoint Templates . Your Thoughts Will Have An Imposing Effect.
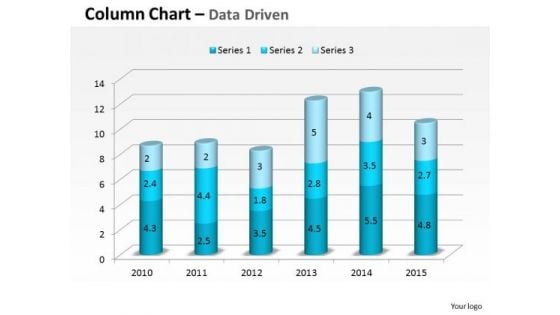
Data Analysis In Excel 3d Compare Yearly Business Performance PowerPoint Templates
Plan For All Contingencies With Our data analysis in excel 3d compare yearly business performance Powerpoint Templates . Douse The Fire Before It Catches.
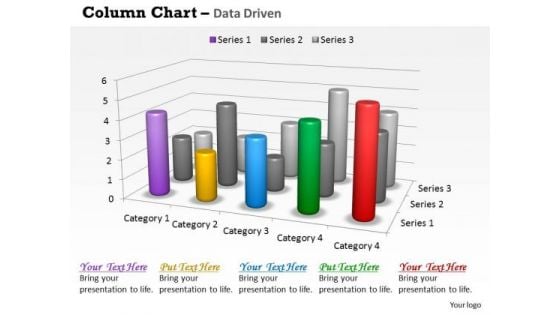
Data Analysis In Excel 3d Survey For Sales Chart PowerPoint Templates
Good Camaraderie Is A Key To Teamwork. Our data analysis in excel 3d survey for sales chart Powerpoint Templates Can Be A Cementing Force.
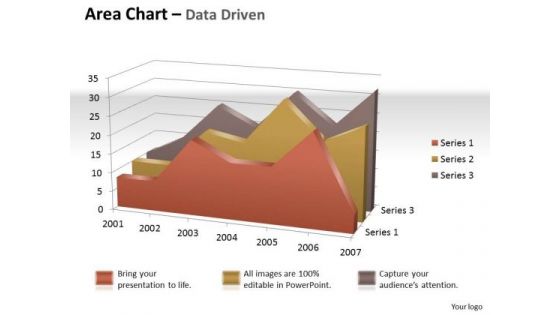
Data Analysis In Excel 3d Visual Display Of Area Chart PowerPoint Templates
Brace Yourself, Arm Your Thoughts. Prepare For The Hustle With Our data analysis in excel 3d visual display of area chart Powerpoint Templates .
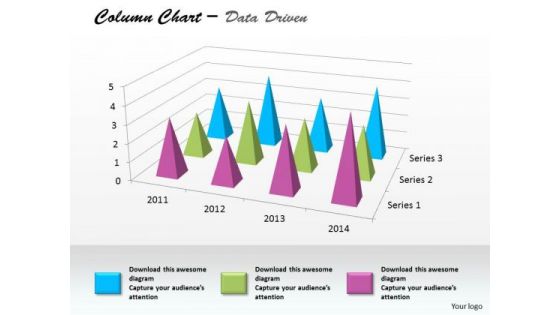
Data Analysis In Excel Column Chart For Business Project PowerPoint Templates
Edit Your Work With Our data analysis in excel column chart for business project Powerpoint Templates . They Will Help You Give The Final Form.
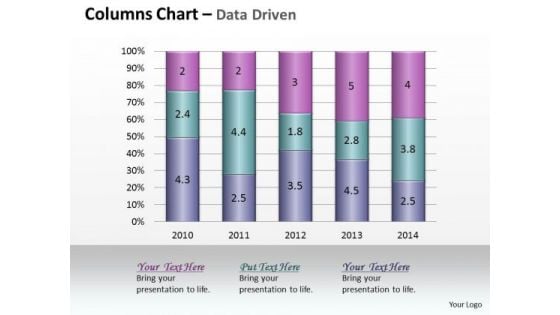
Data Analysis In Excel Column Chart Of Various Fields PowerPoint Templates
Land The Idea With Our data analysis in excel column chart of various fields Powerpoint Templates . Help It Grow With Your Thoughts.
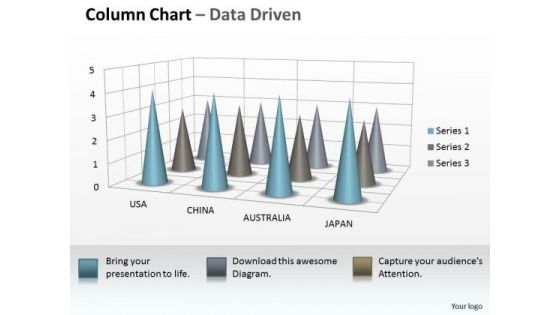
Data Analysis On Excel 3d Chart To Incorporate Business Information PowerPoint Templates
Our data analysis on excel 3d chart to incorporate business information Powerpoint Templates Allow You To Do It With Ease. Just Like Picking The Low Hanging Fruit.
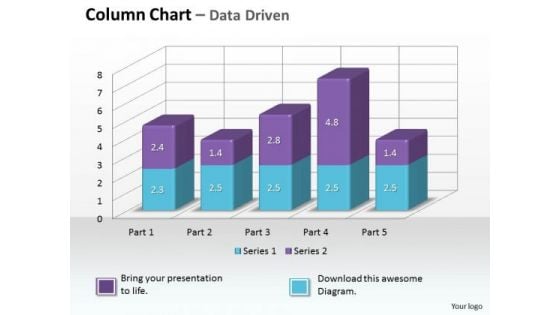
Data Analysis On Excel 3d Chart To Monitor Business Process PowerPoint Templates
Make Some Dough With Our data analysis on excel 3d chart to monitor business process Powerpoint Templates . Your Assets Will Rise Significantly.
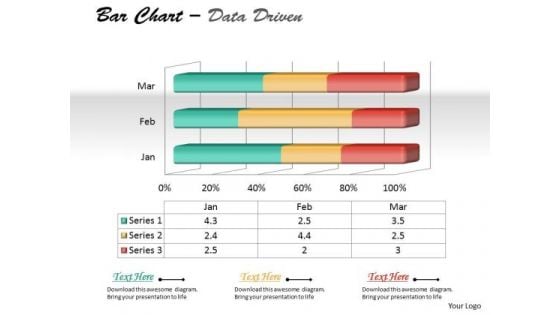
Data Analysis On Excel 3d Chart To Represent Quantitative Differences PowerPoint Templates
Draft It Out On Our data analysis on excel 3d chart to represent quantitative differences Powerpoint Templates . Give The Final Touches With Your Ideas.
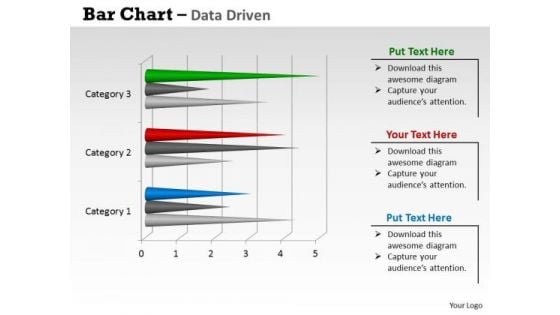
Data Analysis On Excel 3d Chart With Sets Of PowerPoint Templates
Reduce The Drag With Our data analysis on excel 3d chart with sets of Powerpoint Templates . Give More Lift To Your Thoughts.
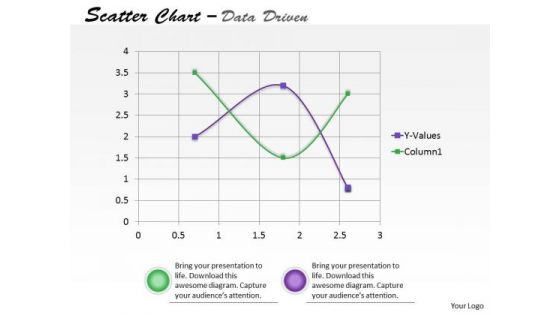
Data Analysis On Excel Driven Scatter Chart To Predict Future Movements PowerPoint Slides Templates
Our data analysis on excel driven scatter chart to predict future movements powerpoint slides Templates Enjoy Drama. They Provide Entertaining Backdrops.


 Continue with Email

 Home
Home


