Bank Dashboard
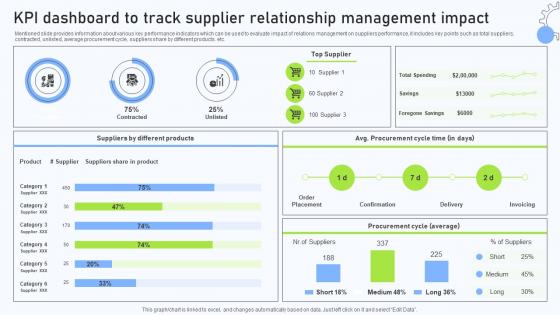
Relationship Management Automation KPI Dashboard To Track Supplier Relationship
Mentioned slide provides information about various key performance indicators which can be used to evaluate impact of relations management on suppliers performance, it includes key points such as total suppliers, contracted, unlisted, average procurement cycle, suppliers share by different products. etc. This Relationship Management Automation KPI Dashboard To Track Supplier Relationship is perfect for any presentation, be it in front of clients or colleagues. It is a versatile and stylish solution for organizing your meetings. The Relationship Management Automation KPI Dashboard To Track Supplier Relationship features a modern design for your presentation meetings. The adjustable and customizable slides provide unlimited possibilities for acing up your presentation. Slidegeeks has done all the homework before launching the product for you. So, do not wait, grab the presentation templates today Mentioned slide provides information about various key performance indicators which can be used to evaluate impact of relations management on suppliers performance, it includes key points such as total suppliers, contracted, unlisted, average procurement cycle, suppliers share by different products. etc.
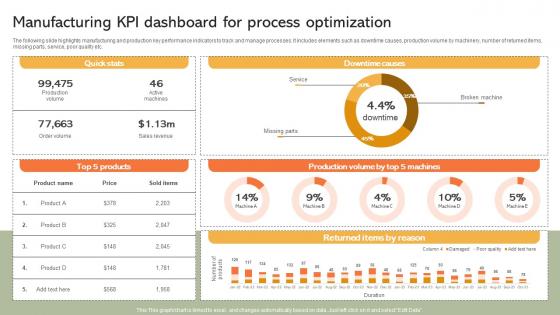
Manufacturing KPI Dashboard For Process Implementing Manufacturing Strategy SS V
The following slide highlights manufacturing and production key performance indicators to track and manage processes. It includes elements such as downtime causes, production volume by machinery, number of returned items, missing parts, service, poor quality etc. Formulating a presentation can take up a lot of effort and time, so the content and message should always be the primary focus. The visuals of the PowerPoint can enhance the presenters message, so our Manufacturing KPI Dashboard For Process Implementing Manufacturing Strategy SS V was created to help save time. Instead of worrying about the design, the presenter can concentrate on the message while our designers work on creating the ideal templates for whatever situation is needed. Slidegeeks has experts for everything from amazing designs to valuable content, we have put everything into Manufacturing KPI Dashboard For Process Implementing Manufacturing Strategy SS V The following slide highlights manufacturing and production key performance indicators to track and manage processes. It includes elements such as downtime causes, production volume by machinery, number of returned items, missing parts, service, poor quality etc.
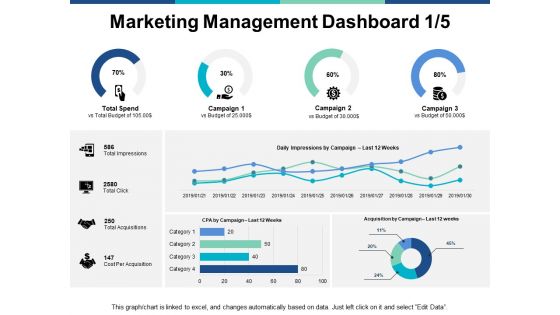
Marketing Management Dashboard Business Ppt PowerPoint Presentation Show Format
This is a marketing management dashboard business ppt powerpoint presentation show format. This is a four stage process. The stages in this process are finance, marketing, management, investment, analysis.

Marketing Management Dashboard Marketing Ppt PowerPoint Presentation Slides Graphics
This is a marketing management dashboard marketing ppt powerpoint presentation slides graphics. This is a three stage process. The stages in this process are finance, marketing, management, investment, analysis.
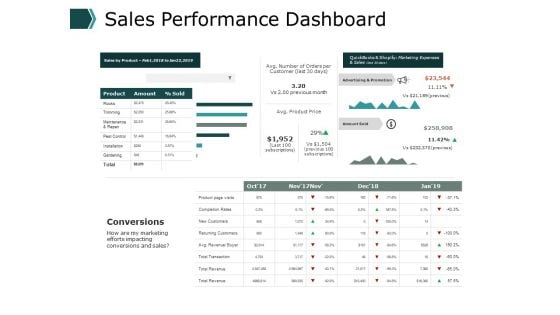
Sales Performance Dashboard Business Ppt PowerPoint Presentation Pictures Visuals
This is a sales performance dashboard business ppt powerpoint presentation pictures visuals . This is a three stage process. The stages in this process are finance, marketing, management, investment, analysis.

Inventory And Logistics Dashboard Ppt PowerPoint Presentation Gallery Clipart
This is a inventory and logistics dashboard ppt powerpoint presentation gallery clipart. This is a four stage process. The stages in this process are finance, marketing, management, investment, analysis.
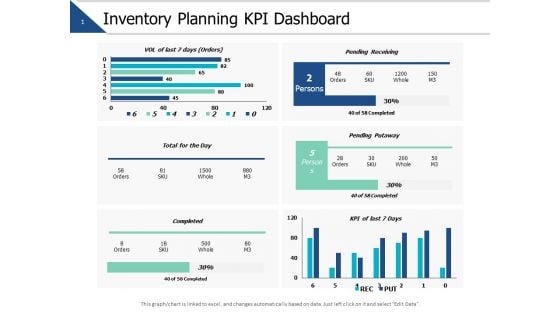
Inventory Planning Kpi Dashboard Ppt PowerPoint Presentation Model Show
This is a inventory planning kpi dashboard ppt powerpoint presentation model show. This is a four stage process. The stages in this process are finance, marketing, management, investment, analysis.
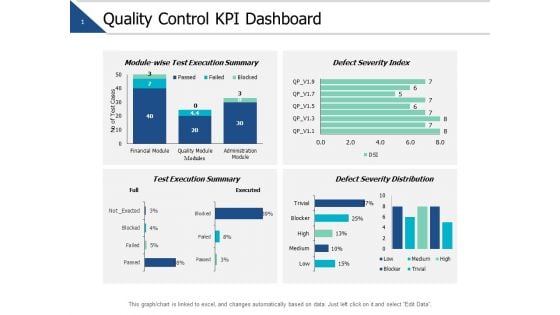
Quality Control Kpi Dashboard Ppt PowerPoint Presentation Show Portrait
This is a quality control kpi dashboard ppt powerpoint presentation show portrait. This is a four stage process. The stages in this process are finance, marketing, management, investment, analysis.
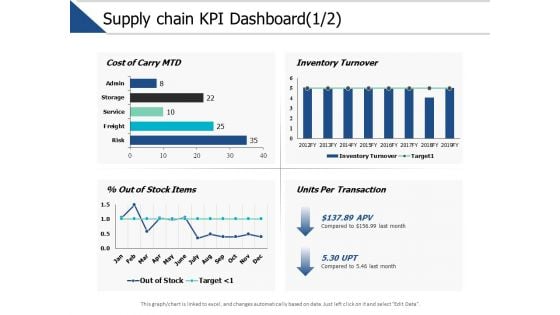
Supply Chain Kpi Dashboard Management Ppt PowerPoint Presentation Model Picture
This is a supply chain kpi dashboard management ppt powerpoint presentation model picture. This is a three stage process. The stages in this process are finance, marketing, management, investment, analysis.
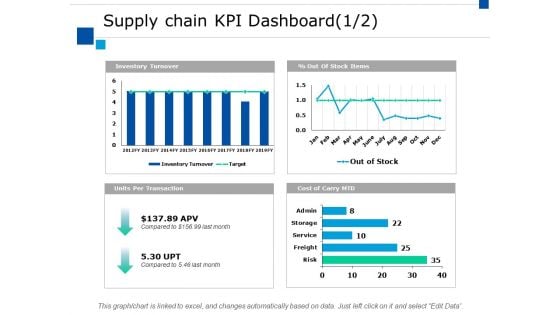
Supply Chain Kpi Dashboard Ppt PowerPoint Presentation Styles Clipart
This is a supply chain kpi dashboard ppt powerpoint presentation styles clipart. This is a four stage process. The stages in this process are finance, marketing, analysis, investment, million.
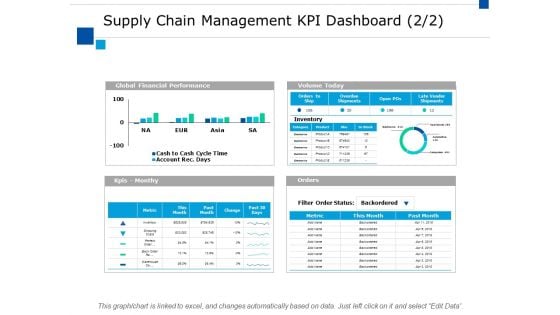
Supply Chain Management Kpi Dashboard Ppt PowerPoint Presentation File Slides
This is a supply chain management kpi dashboard ppt powerpoint presentation file slides. This is a four stage process. The stages in this process are finance, marketing, analysis, investment, million.
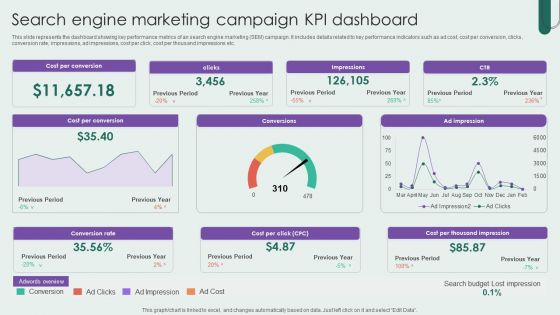
Search Engine Marketing Campaign KPI Dashboard Inspiration PDF
This slide represents the dashboard showing key performance metrics of an search engine marketing SEM campaign. It includes details related to key performance indicators such as ad cost, cost per conversion, clicks, conversion rate, impressions, ad impressions, cost per click, cost per thousand impressions etc. Showcasing this set of slides titled Search Engine Marketing Campaign KPI Dashboard Inspiration PDF. The topics addressed in these templates are Search Engine Marketing, Campaign KPI Dashboard. All the content presented in this PPT design is completely editable. Download it and make adjustments in color, background, font etc. as per your unique business setting.
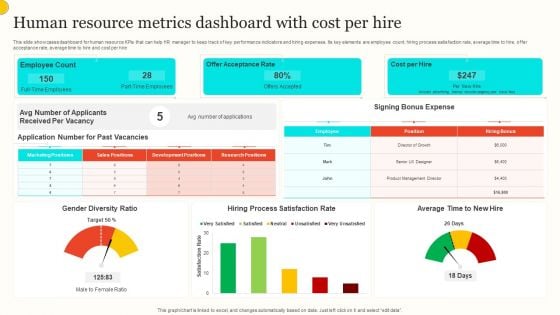
Human Resource Metrics Dashboard With Cost Per Hire Portrait PDF
This slide showcases dashboard for human resource KPIs that can help HR manager to keep track of key performance indicators and hiring expenses. Its key elements are employee count, hiring process satisfaction rate, average time to hire, offer acceptance rate, average time to hire and cost per hire. Showcasing this set of slides titled Human Resource Metrics Dashboard With Cost Per Hire Portrait PDF. The topics addressed in these templates are Employee Count, Offer Acceptance Rate, Cost Per Hire. All the content presented in this PPT design is completely editable. Download it and make adjustments in color, background, font etc. as per your unique business setting.
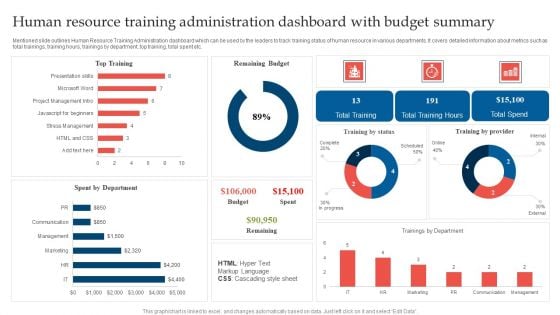
Human Resource Training Administration Dashboard With Budget Summary Microsoft PDF
Mentioned slide outlines Human Resource Training Administration dashboard which can be used by the leaders to track training status of human resource in various departments. It covers detailed information about metrics such as total trainings, training hours, trainings by department, top training, total spent etc. Showcasing this set of slides titled Human Resource Training Administration Dashboard With Budget Summary Microsoft PDF. The topics addressed in these templates are Remaining Budget, Top Training, Spent Department. All the content presented in this PPT design is completely editable. Download it and make adjustments in color, background, font etc. as per your unique business setting.
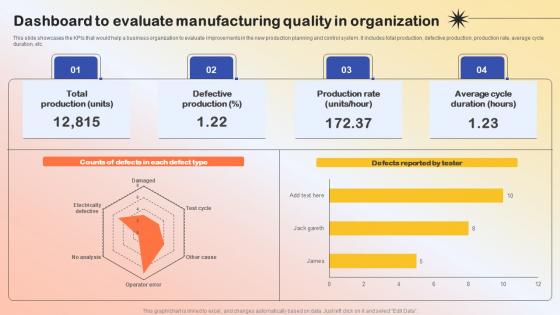
Dashboard To Evaluate Manufacturing Quality Production Quality Administration Portrait Pdf
This slide showcases the KPIs that would help a business organization to evaluate improvements in the new production planning and control system. It includes total production, defective production, production rate, average cycle duration, etc.Do you have to make sure that everyone on your team knows about any specific topic I yes, then you should give Dashboard To Evaluate Manufacturing Quality Production Quality Administration Portrait Pdf a try. Our experts have put a lot of knowledge and effort into creating this impeccable Dashboard To Evaluate Manufacturing Quality Production Quality Administration Portrait Pdf. You can use this template for your upcoming presentations, as the slides are perfect to represent even the tiniest detail. You can download these templates from the Slidegeeks website and these are easy to edit. So grab these today. This slide showcases the KPIs that would help a business organization to evaluate improvements in the new production planning and control system. It includes total production, defective production, production rate, average cycle duration, etc.
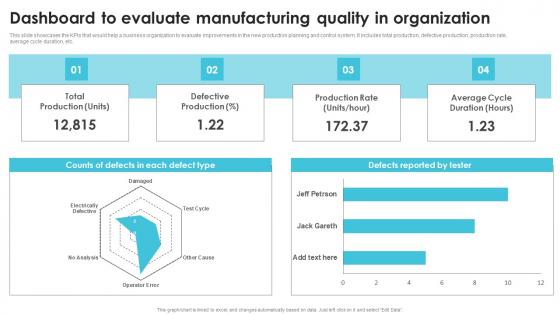
Dashboard To Evaluate Manufacturing Quality Streamlining Production Operational Professional PDF
This slide showcases the KPIs that would help a business organization to evaluate improvements in the new production planning and control system. It includes total production, defective production, production rate, average cycle duration, etc. Do you have to make sure that everyone on your team knows about any specific topic I yes, then you should give Dashboard To Evaluate Manufacturing Quality Streamlining Production Operational Professional PDF a try. Our experts have put a lot of knowledge and effort into creating this impeccable Dashboard To Evaluate Manufacturing Quality Streamlining Production Operational Professional PDF. You can use this template for your upcoming presentations, as the slides are perfect to represent even the tiniest detail. You can download these templates from the Slidegeeks website and these are easy to edit. So grab these today This slide showcases the KPIs that would help a business organization to evaluate improvements in the new production planning and control system. It includes total production, defective production, production rate, average cycle duration, etc.
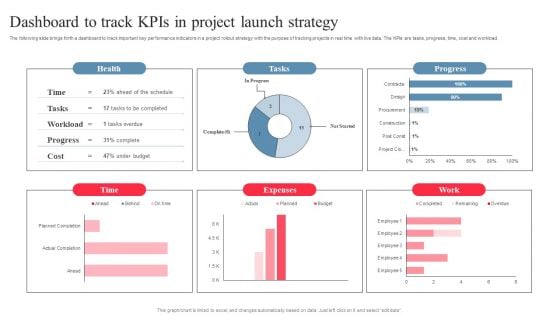
Dashboard To Track Kpis In Project Launch Strategy Pictures PDF
The following slide brings forth a dashboard to track important key performance indicators in a project rollout strategy with the purpose of tracking projects in real time with live data. The KPIs are tasks, progress, time, cost and workload. Showcasing this set of slides titled Dashboard To Track Kpis In Project Launch Strategy Pictures PDF. The topics addressed in these templates are Expenses, Project Launch Strategy, Dashboard To Track Kpis. All the content presented in this PPT design is completely editable. Download it and make adjustments in color, background, font etc. as per your unique business setting.
Tracking Expenditure Incurred On Cloud Deployment Dashboard Download PDF
The following slide highlights cloud implementation expenditure dashboard to determine overspend, unused resources, plan future costs, available discounts, customization options etc. It includes components such as cloud native, software, departments, cost centre etc. Pitch your topic with ease and precision using this Tracking Expenditure Incurred On Cloud Deployment Dashboard Download PDF. This layout presents information on Dashboard, Tracking, Deployment. It is also available for immediate download and adjustment. So, changes can be made in the color, design, graphics or any other component to create a unique layout.
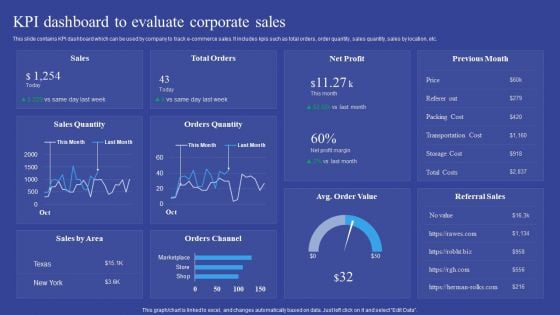
KPI Dashboard To Evaluate Corporate Sales Introduction PDF
This slide contains KPI dashboard which can be used by company to track e-commerce sales. It includes kpis such as total orders, order quantity, sales quantity, sales by location, etc. Pitch your topic with ease and precision using this KPI Dashboard To Evaluate Corporate Sales Introduction PDF. This layout presents information on KPI Dashboard, Evaluate Corporate Sales. It is also available for immediate download and adjustment. So, changes can be made in the color, design, graphics or any other component to create a unique layout.
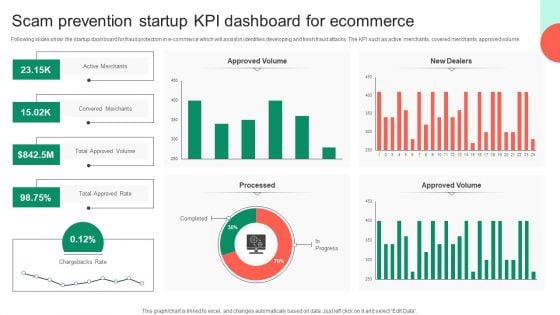
Scam Prevention Startup KPI Dashboard For Ecommerce Themes PDF
Following slides show the startup dashboard for fraud protection in e-commerce which will assist in identifies developing and fresh fraud attacks. The KPI such as active merchants, covered merchants, approved volume. Pitch your topic with ease and precision using this Scam Prevention Startup KPI Dashboard For Ecommerce Themes PDF. This layout presents information on Approved Volume, Chargebacks Rate, Kpi Dashboard For Ecommerce. It is also available for immediate download and adjustment. So, changes can be made in the color, design, graphics or any other component to create a unique layout.
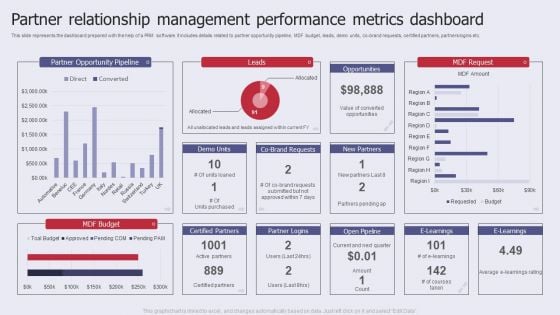
Partner Relationship Management Performance Metrics Dashboard Pictures PDF
This slide represents the dashboard prepared with the help of a PRM software. It includes details related to partner opportunity pipeline, MDF budget, leads, demo units, co brand requests, certified partners, partners logins etc. Showcasing this set of slides titled Partner Relationship Management Performance Metrics Dashboard Pictures PDF. The topics addressed in these templates are Partner Opportunity Pipeline, MDF Budget, Performance Metrics Dashboard. All the content presented in this PPT design is completely editable. Download it and make adjustments in color, background, font etc. as per your unique business setting.
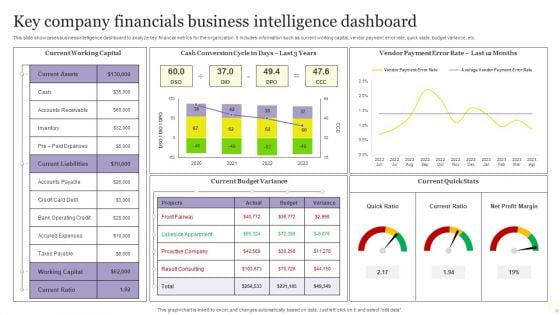
Key Company Financials Business Intelligence Dashboard Graphics PDF
This slide showcases business intelligence dashboard to analyze key financial metrics for the organization. It includes information such as current working capital, vendor payment error rate, quick stats, budget variance, etc. Showcasing this set of slides titled Key Company Financials Business Intelligence Dashboard Graphics PDF. The topics addressed in these templates are Key Company Financials, Business Intelligence Dashboard. All the content presented in this PPT design is completely editable. Download it and make adjustments in color, background, font etc. as per your unique business setting.
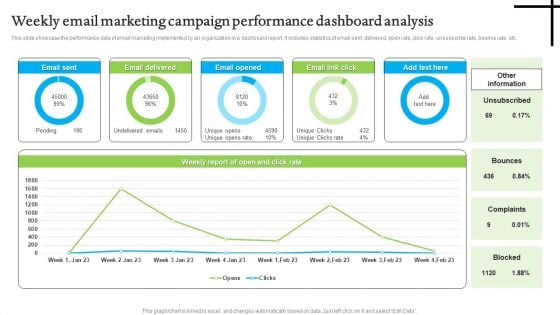
Weekly Email Marketing Campaign Performance Dashboard Analysis Structure PDF
This slide showcase the performance data of email marketing implemented by an organization in a dashboard report. It includes statistics of email sent, delivered, open rate, click rate, unsubscribe rate, bounce rate, etc. Pitch your topic with ease and precision using this Weekly Email Marketing Campaign Performance Dashboard Analysis Structure PDF. This layout presents information on Weekly Email Marketing, Campaign Performance Dashboard Analysis. It is also available for immediate download and adjustment. So, changes can be made in the color, design, graphics or any other component to create a unique layout.
Online Ad Campaign Performance Tracking Dashboard Demonstration PDF
This slide covers the KPI dashboard for measuring digital campaign results. It includes metrics such as Ad cost, clicks, impressions, CTR, cost per click, conversions, conversion rate, cost per click, cost per thousand impressions, etc. Deliver and pitch your topic in the best possible manner with this Online Ad Campaign Performance Tracking Dashboard Demonstration PDF. Use them to share invaluable insights on Online Ad Campaign Performance, Tracking Dashboard and impress your audience. This template can be altered and modified as per your expectations. So, grab it now.
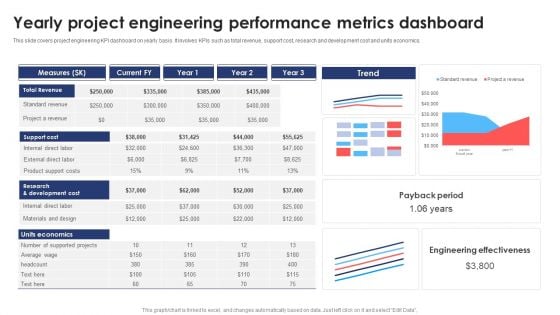
Yearly Project Engineering Performance Metrics Dashboard Information PDF
This slide covers project engineering KPI dashboard on yearly basis. It involves KPIs such as total revenue, support cost, research and development cost and units economics. Pitch your topic with ease and precision using this Yearly Project Engineering Performance Metrics Dashboard Information PDF. This layout presents information on Support Cost, Revenue, Measures. It is also available for immediate download and adjustment. So, changes can be made in the color, design, graphics or any other component to create a unique layout.
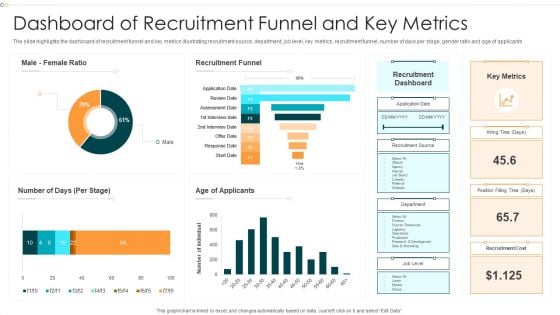
Dashboard Of Recruitment Funnel And Key Metrics Information PDF
The slide highlights the dashboard of recruitment funnel and key metrics illustrating recruitment source, department, job level, key metrics, recruitment funnel, number of days per stage, gender ratio and age of applicants.Pitch your topic with ease and precision using this Dashboard Of Recruitment Funnel And Key Metrics Information PDF This layout presents information on Recruitment Funnel, Recruitment Dashboard, Recruitment Cost It is also available for immediate download and adjustment. So, changes can be made in the color, design, graphics or any other component to create a unique layout.
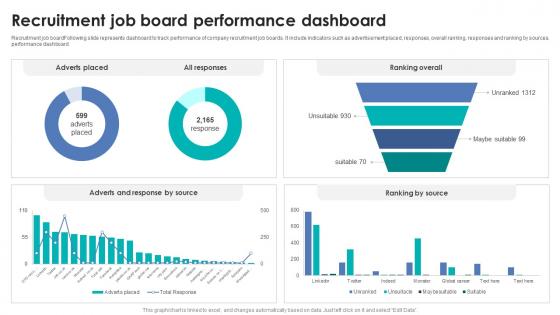
Integrating Automation For Effective Business Recruitment Job Board Performance Dashboard
Recruitment job boardFollowing slide represents dashboard to track performance of company recruitment job boards. It include indicators such as advertisement placed, responses, overall ranking, responses and ranking by sources performance dashboard. Presenting this PowerPoint presentation, titled Integrating Automation For Effective Business Recruitment Job Board Performance Dashboard, with topics curated by our researchers after extensive research. This editable presentation is available for immediate download and provides attractive features when used. Download now and captivate your audience. Presenting this Integrating Automation For Effective Business Recruitment Job Board Performance Dashboard. Our researchers have carefully researched and created these slides with all aspects taken into consideration. This is a completely customizable Integrating Automation For Effective Business Recruitment Job Board Performance Dashboard that is available for immediate downloading. Download now and make an impact on your audience. Highlight the attractive features available with our PPTs. Recruitment job boardFollowing slide represents dashboard to track performance of company recruitment job boards. It include indicators such as advertisement placed, responses, overall ranking, responses and ranking by sources performance dashboard.
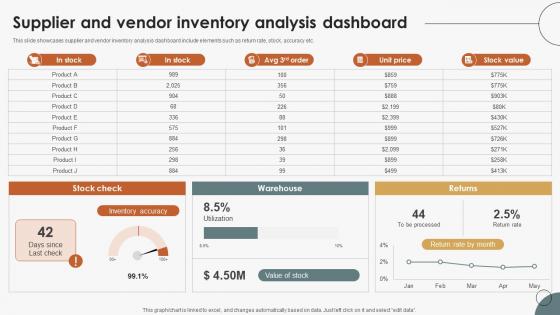
Boosting Efficiency In Inventory Supplier And Vendor Inventory Analysis Dashboard
This slide showcases supplier and vendor inventory analysis dashboard include elements such as return rate, stock, accuracy etc. The best PPT templates are a great way to save time, energy, and resources. Slidegeeks have 100 percent editable powerpoint slides making them incredibly versatile. With these quality presentation templates, you can create a captivating and memorable presentation by combining visually appealing slides and effectively communicating your message. Download Boosting Efficiency In Inventory Supplier And Vendor Inventory Analysis Dashboard from Slidegeeks and deliver a wonderful presentation. This slide showcases supplier and vendor inventory analysis dashboard include elements such as return rate, stock, accuracy etc.
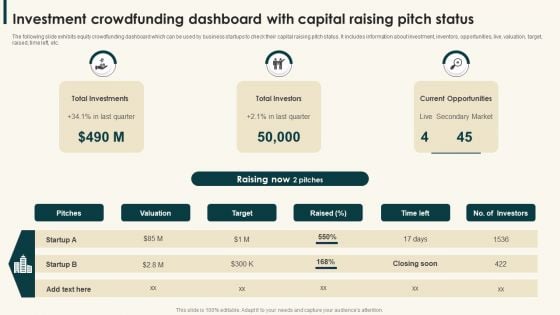
Investment Crowdfunding Dashboard With Capital Raising Pitch Status Sample PDF
The following slide exhibits equity crowdfunding dashboard which can be used by business startups to check their capital raising pitch status. It includes information about investment, inventors, opportunities, live, valuation, target, raised, time left, etc.Presenting Investment Crowdfunding Dashboard With Capital Raising Pitch Status Sample PDF to dispense important information. This template comprises three stages. It also presents valuable insights into the topics including Total Investments, Total Investors, Current Opportunities. This is a completely customizable PowerPoint theme that can be put to use immediately. So, download it and address the topic impactfully.
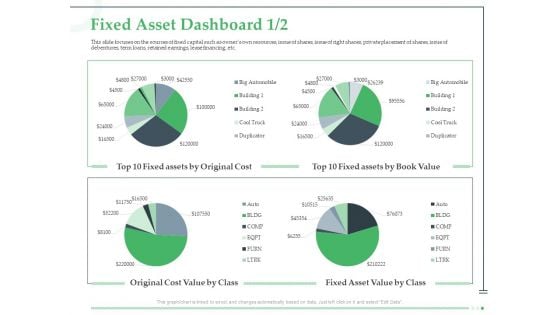
Funds Requisite Evaluation Fixed Asset Dashboard Cost Elements PDF
Presenting this set of slides with name funds requisite evaluation fixed asset dashboard cost elements pdf. The topics discussed in these slides are cost, value, original, fixed asset. This is a completely editable PowerPoint presentation and is available for immediate download. Download now and impress your audience.
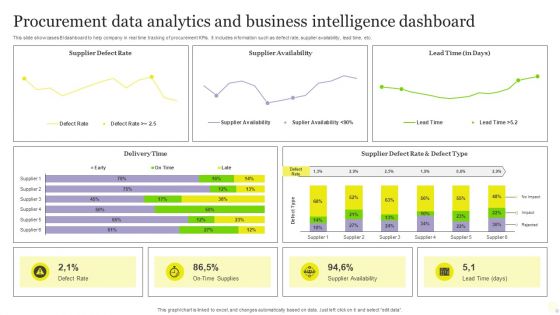
Procurement Data Analytics And Business Intelligence Dashboard Pictures PDF
This slide showcases BI dashboard to help company in real time tracking of procurement KPIs. It includes information such as defect rate, supplier availability, lead time, etc. Pitch your topic with ease and precision using this Procurement Data Analytics And Business Intelligence Dashboard Pictures PDF. This layout presents information on Procurement Data Analytics, Business Intelligence Dashboard. It is also available for immediate download and adjustment. So, changes can be made in the color, design, graphics or any other component to create a unique layout.
Employee Training And Development Plan Performance Tracking Dashboard Portrait PDF
Mentioned slide outlines key performance indicator KPI dashboard which can be used by organization to monitor training and development strategies. The major metrics covered in the template are cost per participant, per hour, number of trainees , etc. Showcasing this set of slides titled Employee Training And Development Plan Performance Tracking Dashboard Portrait PDF. The topics addressed in these templates are Employee Training, Development Plan Performance, Tracking Dashboard. All the content presented in this PPT design is completely editable. Download it and make adjustments in color, background, font etc. as per your unique business setting.
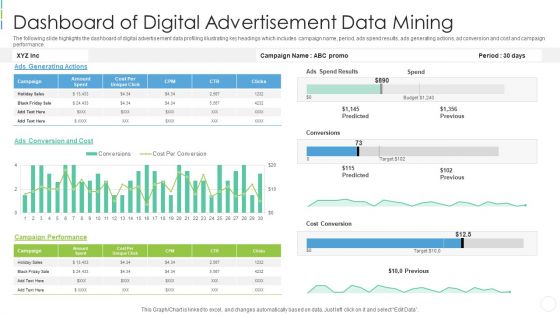
Dashboard Of Digital Advertisement Data Mining Professional PDF
The following slide highlights the dashboard of digital advertisement data profiling illustrating key headings which includes campaign name, period, ads spend results, ads generating actions, ad conversion and cost and campaign performance. Pitch your topic with ease and precision using this dashboard of digital advertisement data mining professional pdf . This layout presents information on dashboard of digital advertisement data mining . It is also available for immediate download and adjustment. So, changes can be made in the color, design, graphics or any other component to create a unique layout.

HR Framework Dashboard Indicating Kpis Of Employees Introduction PDF
This slide represents human resource HR structure dashboard indicating key performance indicators KPIs of employees. it provides information regarding absenteeism, overtime hours, training costs etc.Pitch your topic with ease and precision using this HR Framework Dashboard Indicating Kpis Of Employees Introduction PDF. This layout presents information on Absenteeism Rate, Costs, Average. It is also available for immediate download and adjustment. So, changes can be made in the color, design, graphics or any other component to create a unique layout.
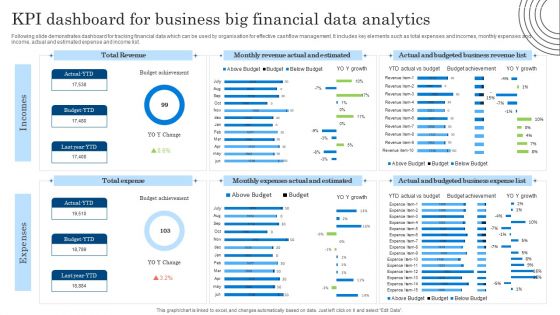
KPI Dashboard For Business Big Financial Data Analytics Diagrams PDF
Following slide demonstrates dashboard for tracking financial data which can be used by organisation for effective cashflow management. It includes key elements such as total expenses and incomes, monthly expenses and income, actual and estimated expense and income list. Showcasing this set of slides titled KPI Dashboard For Business Big Financial Data Analytics Diagrams PDF. The topics addressed in these templates are KPI Dashboard, Business Big Financial, Data Analytics. All the content presented in this PPT design is completely editable. Download it and make adjustments in color, background, font etc. as per your unique business setting.
Determine IT Project Portfolio Management Tracking Dashboard Clipart PDF
This slide provides information regarding IT project portfolio management tracking dashboard including details about allocated budget across portfolios, used budget percentage, estimated vs. actual cost, etc. Deliver an awe inspiring pitch with this creative Determine IT Project Portfolio Management Tracking Dashboard Clipart PDF bundle. Topics like Financials, Estimated Cost Across Portfolios, Actual Cost Across Portfolios can be discussed with this completely editable template. It is available for immediate download depending on the needs and requirements of the user.
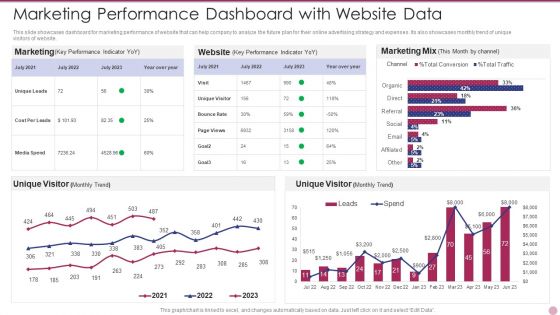
Marketing Performance Dashboard With Website Data Elements PDF
This slide showcases dashboard for marketing performance of website that can help company to analyze the future plan for their online advertising strategy and expenses. Its also showcases monthly trend of unique visitors of website. Pitch your topic with ease and precision using this Marketing Performance Dashboard With Website Data Elements PDF. This layout presents information on Marketing Performance Dashboard With Website Data. It is also available for immediate download and adjustment. So, changes can be made in the color, design, graphics or any other component to create a unique layout.
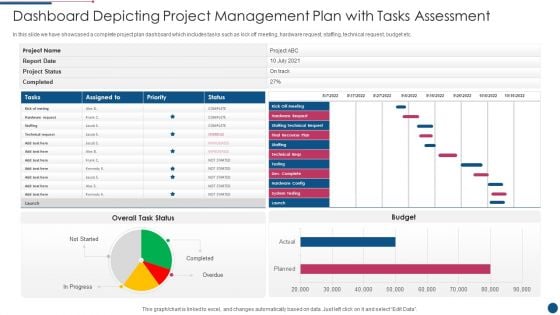
Dashboard Depicting Project Management Plan With Tasks Assessment Elements PDF
In this slide we have showcased a complete project plan dashboard which includes tasks such as kick off meeting, hardware request, staffing, technical request, budget etc. Showcasing this set of slides titled Dashboard Depicting Project Management Plan With Tasks Assessment Elements PDF. The topics addressed in these templates are Dashboard Depicting Project Management Plan With Tasks Assessment. All the content presented in this PPT design is completely editable. Download it and make adjustments in color, background, font etc. as per your unique business setting.
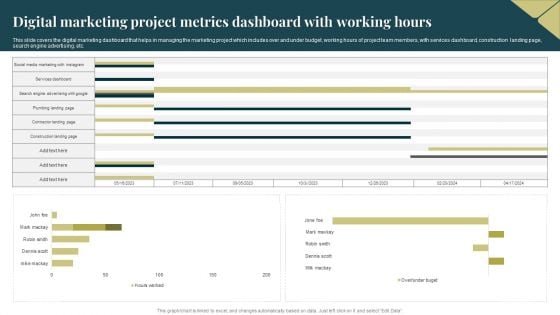
Digital Marketing Project Metrics Dashboard With Working Hours Download PDF
This slide covers the digital marketing dashboard that helps in managing the marketing project which includes over and under budget, working hours of project team members, with services dashboard, construction landing page, search engine advertising, etc. Showcasing this set of slides titled Digital Marketing Project Metrics Dashboard With Working Hours Download PDF. The topics addressed in these templates are Advertising, Social Media Marketing. All the content presented in this PPT design is completely editable. Download it and make adjustments in color, background, font etc. as per your unique business setting.
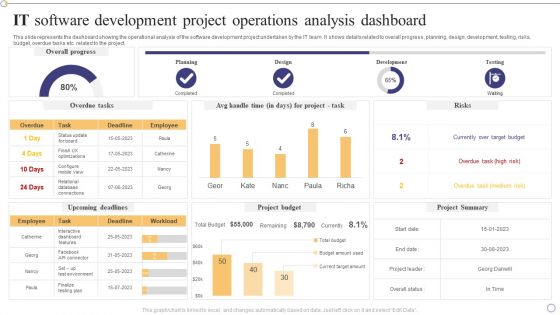
IT Software Development Project Operations Analysis Dashboard Pictures PDF
This slide represents the dashboard showing the operational analysis of the software development project undertaken by the IT team. It shows details related to overall progress, planning, design, development, testing, risks, budget, overdue tasks etc. related to the project.Pitch your topic with ease and precision using this IT Software Development Project Operations Analysis Dashboard Pictures PDF. This layout presents information on Interactive Dashboard, Currently Over Target, Overdue Task. It is also available for immediate download and adjustment. So, changes can be made in the color, design, graphics or any other component to create a unique layout.
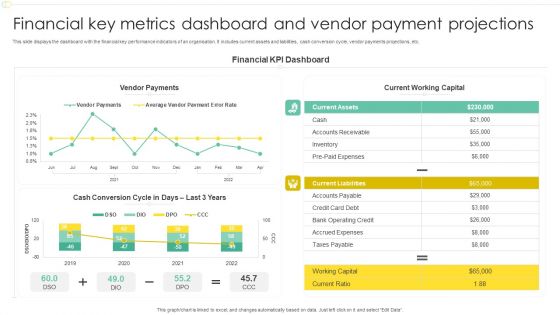
Financial Key Metrics Dashboard And Vendor Payment Projections Professional PDF
This slide displays the dashboard with the financial key performance indicators of an organisation. It includes current assets and liabilities, cash conversion cycle, vendor payments projections, etc. Pitch your topic with ease and precision using this Financial Key Metrics Dashboard And Vendor Payment Projections Professional PDF. This layout presents information on Financial KPI Dashboard, Current Working Capital, Vendor Payments. It is also available for immediate download and adjustment. So, changes can be made in the color, design, graphics or any other component to create a unique layout.
E Commerce Project Planning And Management Dashboard Icon Background PDF
Persuade your audience using this E Commerce Project Planning And Management Dashboard Icon Background PDF. This PPT design covers three stages, thus making it a great tool to use. It also caters to a variety of topics including E Commerce Project Planning And Management Dashboard Icon. Download this PPT design now to present a convincing pitch that not only emphasizes the topic but also showcases your presentation skills.
Implementing Effective Strategy Staff Training Effectiveness Tracking Dashboard Guidelines PDF
This slide provides information regarding workforce training effectiveness monitoring dashboard. The dashboard includes details such as training cost, cost per participant, number of participants, hours of training, etc. Take your projects to the next level with our ultimate collection of Implementing Effective Strategy Staff Training Effectiveness Tracking Dashboard Guidelines PDF. Slidegeeks has designed a range of layouts that are perfect for representing task or activity duration, keeping track of all your deadlines at a glance. Tailor these designs to your exact needs and give them a truly corporate look with your own brand colors theyll make your projects stand out from the rest.
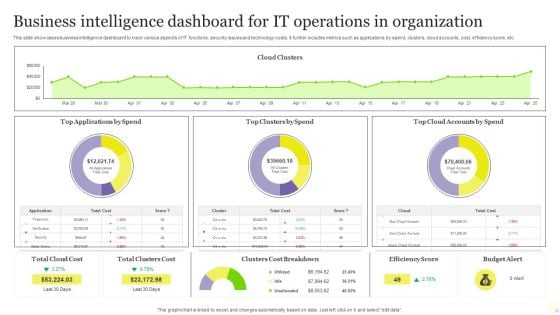
Business Intelligence Dashboard For It Operations In Organization Themes PDF
This slide showcases business intelligence dashboard to track various aspects of IT functions, security issues and technology costs. It further includes metrics such as applications by spend, clusters, cloud accounts, cost, efficiency score, etc. Showcasing this set of slides titled Business Intelligence Dashboard For It Operations In Organization Themes PDF. The topics addressed in these templates are Business Intelligence Dashboard, IT Operations, Organization. All the content presented in this PPT design is completely editable. Download it and make adjustments in color, background, font etc. as per your unique business setting.
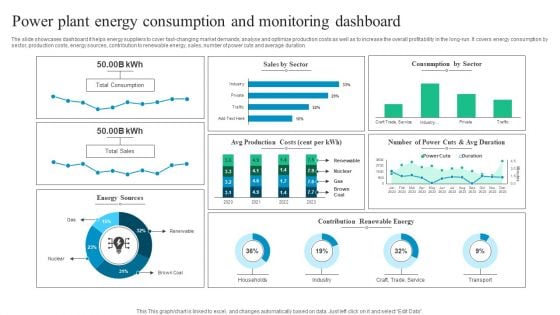
Power Plant Energy Consumption And Monitoring Dashboard Diagrams PDF
The slide showcases dashboard it helps energy suppliers to cover fast-changing market demands, analyse and optimize production costs as well as to increase the overall profitability in the long-run. It covers energy consumption by sector, production costs, energy sources, contribution to renewable energy, sales, number of power cuts and average duration. Pitch your topic with ease and precision using this Power Plant Energy Consumption And Monitoring Dashboard Diagrams PDF. This layout presents information on Power Plant Energy Consumption, Monitoring Dashboard. It is also available for immediate download and adjustment. So, changes can be made in the color, design, graphics or any other component to create a unique layout.
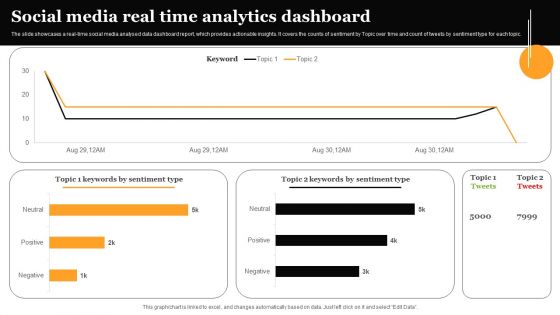
Social Media Real Time Analytics Dashboard Formats PDF
The slide showcases a real-time social media analysed data dashboard report, which provides actionable insights. It covers the counts of sentiment by Topic over time and count of tweets by sentiment type for each topic. Showcasing this set of slides titled Social Media Real Time Analytics Dashboard Formats PDF. The topics addressed in these templates are Social Media Real, Time Analytics, Dashboard. All the content presented in this PPT design is completely editable. Download it and make adjustments in color, background, font etc. as per your unique business setting.
Data Breach Prevention Status Tracking Dashboard Data Fortification Strengthening Defenses
This slide represents the critical cyber security performance indicators for the organization. The key components include application health, encryption status, license consumption, windows defender, etc.Are you in need of a template that can accommodate all of your creative concepts This one is crafted professionally and can be altered to fit any style. Use it with Google Slides or PowerPoint. Include striking photographs, symbols, depictions, and other visuals. Fill, move around, or remove text boxes as desired. Test out color palettes and font mixtures. Edit and save your work, or work with colleagues. Download Data Breach Prevention Status Tracking Dashboard Data Fortification Strengthening Defenses and observe how to make your presentation outstanding. Give an impeccable presentation to your group and make your presentation unforgettable. This slide represents the critical cyber security performance indicators for the organization. The key components include application health, encryption status, license consumption, windows defender, etc.
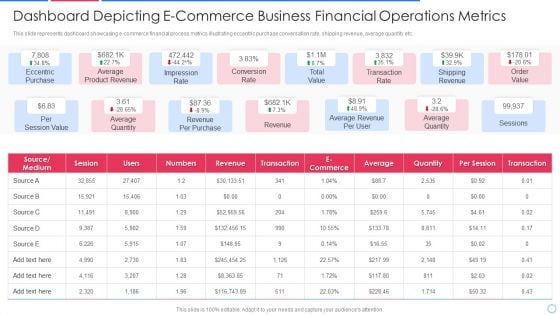
Dashboard Depicting E-Commerce Business Financial Operations Metrics Topics PDF
This slide represents dashboard showcasing e-commerce financial process metrics illustrating eccentric purchase conversation rate, shipping revenue, average quantity etc.Showcasing this set of slides titled dashboard depicting e-commerce business financial operations metrics topics pdf The topics addressed in these templates are eccentric purchase, average product revenue, impression rate All the content presented in this PPT design is completely editable. Download it and make adjustments in color, background, font etc. as per your unique business setting.

Supplier Performance Dashboard With Compensation Status Themes PDF
This slide showcases payment performance dashboard that can help organization to analyze the outstanding amount by different vendors and impose necessary restrictions in case of any delay. Its key components are amount paid early, total money paid, paid on time and paid late. Pitch your topic with ease and precision using this supplier performance dashboard with compensation status themes pdf. This layout presents information on supplier performance dashboard with compensation status. It is also available for immediate download and adjustment. So, changes can be made in the color, design, graphics or any other component to create a unique layout.
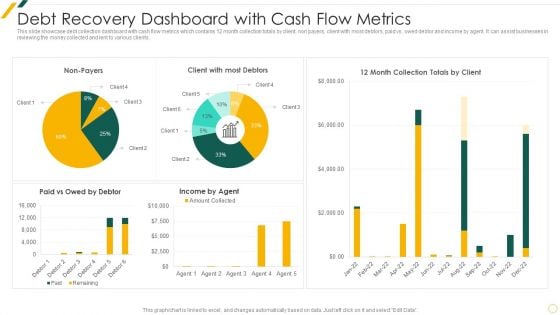
Debt Recovery Dashboard With Cash Flow Metrics Summary PDF
This slide showcase debt collection dashboard with cash flow metrics which contains 12 month collection totals by client, non payers, client with most debtors, paid vs. owed debtor and income by agent. It can assist businesses in reviewing the money collected and lent to various clients.Pitch your topic with ease and precision using this Debt Recovery Dashboard With Cash Flow Metrics Summary PDF This layout presents information on Debt Recovery, Dashboard Cash, Flow Metrics It is also available for immediate download and adjustment. So, changes can be made in the color, design, graphics or any other component to create a unique layout.
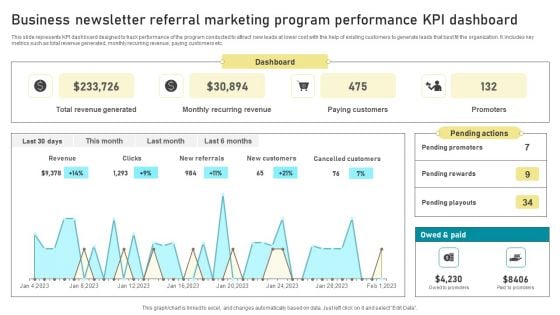
Business Newsletter Referral Marketing Program Performance KPI Dashboard Formats PDF
This slide represents KPI dashboard designed to track performance of the program conducted to attract new leads at lower cost with the help of existing customers to generate leads that best fit the organization. It includes key metrics such as total revenue generated, monthly recurring revenue, paying customers etc. Showcasing this set of slides titled Business Newsletter Referral Marketing Program Performance KPI Dashboard Formats PDF. The topics addressed in these templates are Dashboard, Paying Customers, Monthly Recurring Revenue, Total Revenue Generated. All the content presented in this PPT design is completely editable. Download it and make adjustments in color, background, font etc. as per your unique business setting.
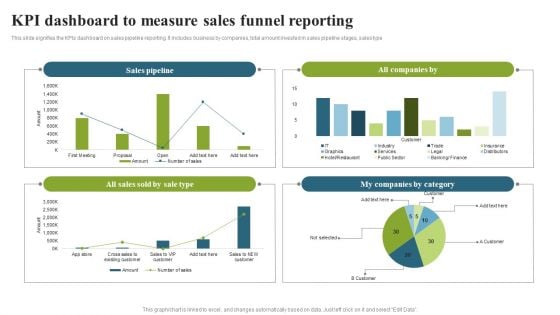
KPI Dashboard To Measure Sales Funnel Reporting Template PDF
This slide signifies the KPIs dashboard on sales pipeline reporting. It includes business by companies, total amount invested in sales pipeline stages, sales type. Showcasing this set of slides titled KPI Dashboard To Measure Sales Funnel Reporting Template PDF. The topics addressed in these templates are Sales Pipeline, Companies Category, Sales Sold. All the content presented in this PPT design is completely editable. Download it and make adjustments in color, background, font etc. as per your unique business setting.
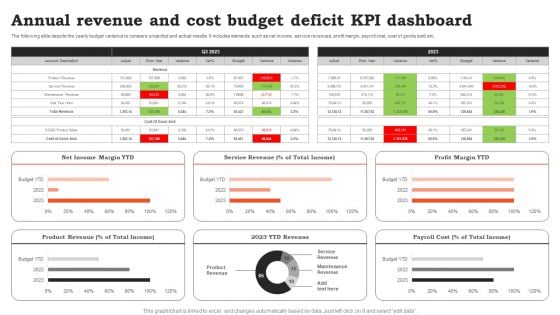
Annual Revenue And Cost Budget Deficit KPI Dashboard Ideas PDF
The following slide depicts the yearly budget variance to compare projected and actual results. It includes elements such as net income, service revenues, profit margin, payroll cost, cost of goods sold etc. Showcasing this set of slides titled Annual Revenue And Cost Budget Deficit KPI Dashboard Ideas PDF. The topics addressed in these templates are Cost Budget, Deficit KPI Dashboard. All the content presented in this PPT design is completely editable. Download it and make adjustments in color, background, font etc. as per your unique business setting.
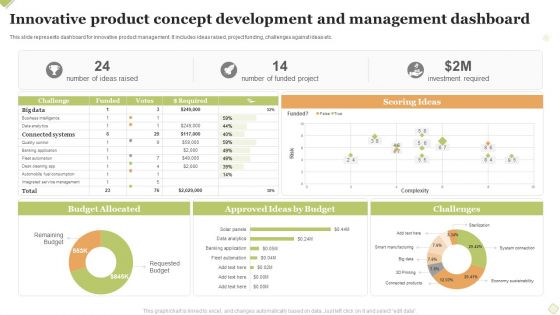
Innovative Product Concept Development And Management Dashboard Introduction PDF
This slide represents dashboard for innovative product management. It includes ideas raised, project funding, challenges against ideas etc. Pitch your topic with ease and precision using this Innovative Product Concept Development And Management Dashboard Introduction PDF This layout presents information on Scoring Ideas, Budget Allocated, Challenges. It is also available for immediate download and adjustment. So, changes can be made in the color, design, graphics or any other component to create a unique layout.
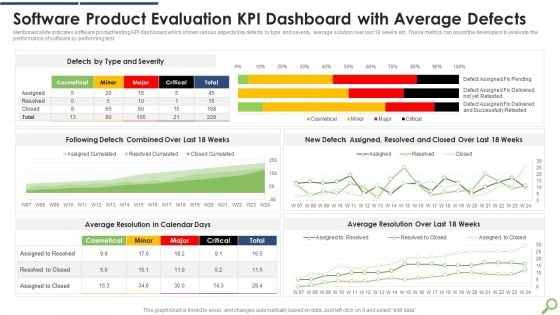
Software Product Evaluation KPI Dashboard With Average Defects Infographics PDF
Mentioned slide indicates software product testing KPI dashboard which shows various aspects like defects by type and severity, average solution over last 18 weeks etc. These metrics can assist the developers to evaluate the performance of software by performing test.Showcasing this set of slides titled Software Product Evaluation KPI Dashboard With Average Defects Infographics PDF The topics addressed in these templates are Software Product, Evaluation Dashboard, Average Defects All the content presented in this PPT design is completely editable. Download it and make adjustments in color, background, font etc. as per your unique business setting.
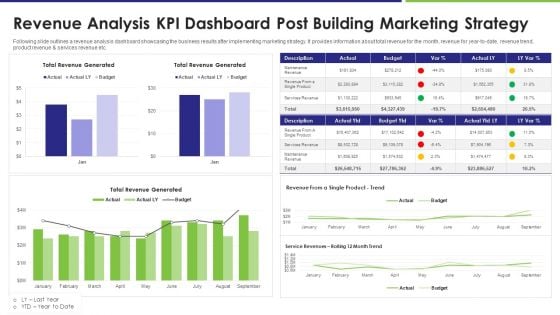
Revenue Analysis KPI Dashboard Post Building Marketing Strategy Infographics PDF
Following slide outlines a revenue analysis dashboard showcasing the business results after implementing marketing strategy. It provides information about total revenue for the month, revenue for year to date, revenue trend, product revenue and services revenue etc. Pitch your topic with ease and precision using this revenue analysis kpi dashboard post building marketing strategy infographics pdf. This layout presents information on revenue analysis kpi dashboard post building marketing strategy. It is also available for immediate download and adjustment. So, changes can be made in the color, design, graphics or any other component to create a unique layout.
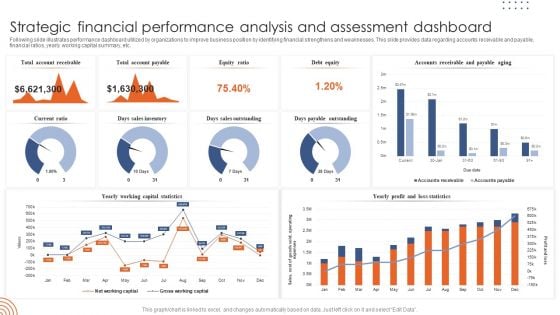
Strategic Financial Performance Analysis And Assessment Dashboard Template PDF
Following slide illustrates performance dashboard utilized by organizations to improve business position by identifying financial strengthens and weaknesses. This slide provides data regarding accounts receivable and payable, financial ratios, yearly working capital summary, etc. Showcasing this set of slides titled Strategic Financial Performance Analysis And Assessment Dashboard Template PDF. The topics addressed in these templates are Strategic Financial Performance, Analysis Assessment Dashboard. All the content presented in this PPT design is completely editable. Download it and make adjustments in color, background, font etc. as per your unique business setting.
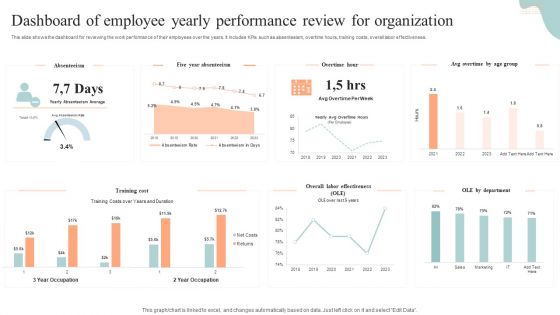
Dashboard Of Employee Yearly Performance Review For Organization Mockup PDF
This slide shows the dashboard for reviewing the work performance of their employees over the years. It includes KPIs such as absenteeism, overtime hours, training costs, overall labor effectiveness. Showcasing this set of slides titled Dashboard Of Employee Yearly Performance Review For Organization Mockup PDF. The topics addressed in these templates are Dashboard Of Employee, Yearly Performance, Review For Organization. All the content presented in this PPT design is completely editable. Download it and make adjustments in color, background, font etc. as per your unique business setting.
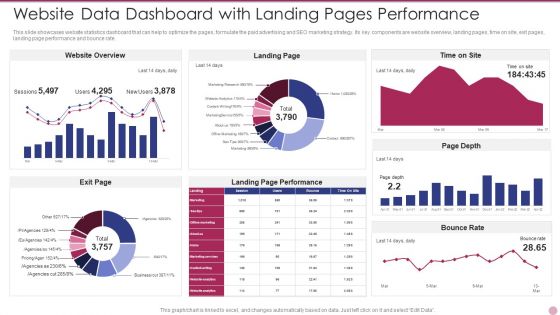
Website Data Dashboard With Landing Pages Performance Formats PDF
This slide showcases website statistics dashboard that can help to optimize the pages, formulate the paid advertising and SEO marketing strategy. Its key components are website overview, landing pages, time on site, exit pages, landing page performance and bounce rate. Showcasing this set of slides titled Website Data Dashboard With Landing Pages Performance Formats PDF. The topics addressed in these templates are Website Data Dashboard With Landing Pages Performance. All the content presented in this PPT design is completely editable. Download it and make adjustments in color, background, font etc. as per your unique business setting.
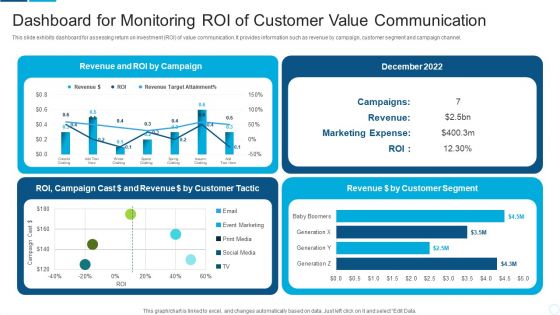
Dashboard For Monitoring Roi Of Customer Value Communication Portrait PDF
This slide exhibits dashboard for assessing return on investment ROI of value communication. It provides information such as revenue by campaign, customer segment and campaign channel. Pitch your topic with ease and precision using this dashboard for monitoring roi of customer value communication portrait pdf. This layout presents information on customer, revenue, marketing expense. It is also available for immediate download and adjustment. So, changes can be made in the color, design, graphics or any other component to create a unique layout.


 Continue with Email

 Home
Home


