Bank Icon
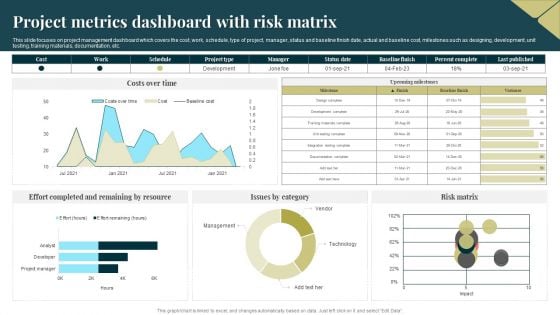
Project Metrics Dashboard With Risk Matrix Microsoft PDF
This slide focuses on project management dashboard which covers the cost, work, schedule, type of project, manager, status and baseline finish date, actual and baseline cost, milestones such as designing, development, unit testing, training materials, documentation, etc. Showcasing this set of slides titled Project Metrics Dashboard With Risk Matrix Microsoft PDF. The topics addressed in these templates are Risk Matrix, Resource, Management. All the content presented in this PPT design is completely editable. Download it and make adjustments in color, background, font etc. as per your unique business setting.
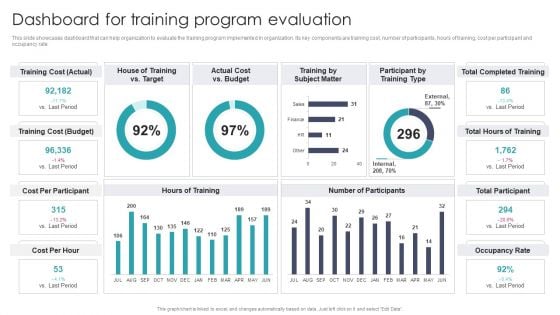
Dashboard For Training Program Evaluation Sample PDF
This slide showcases dashboard that can help organization to evaluate the training program implemented in organization. Its key components are training cost, number of participants, hours of training, cost per participant and occupancy rate. Slidegeeks is one of the best resources for PowerPoint templates. You can download easily and regulate Dashboard For Training Program Evaluation Sample PDF for your personal presentations from our wonderful collection. A few clicks is all it takes to discover and get the most relevant and appropriate templates. Use our Templates to add a unique zing and appeal to your presentation and meetings. All the slides are easy to edit and you can use them even for advertisement purposes.
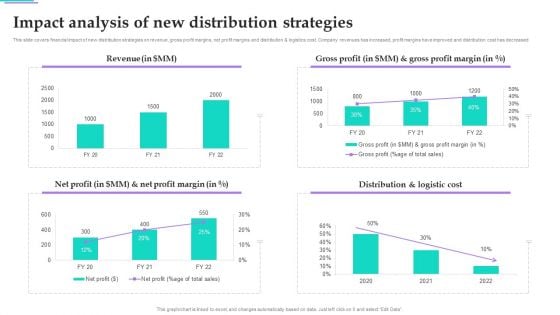
Distribution Strategies For Increasing Impact Analysis Of New Distribution Strategies Elements PDF
This slide covers financial impact of new distribution strategies on revenue, gross profit margins, net profit margins and distribution and logistics cost. Company revenues has increased, profit margins have improved and distribution cost has decreased. The best PPT templates are a great way to save time, energy, and resources. Slidegeeks have 100 percent editable powerpoint slides making them incredibly versatile. With these quality presentation templates, you can create a captivating and memorable presentation by combining visually appealing slides and effectively communicating your message. Download Distribution Strategies For Increasing Impact Analysis Of New Distribution Strategies Elements PDF from Slidegeeks and deliver a wonderful presentation.
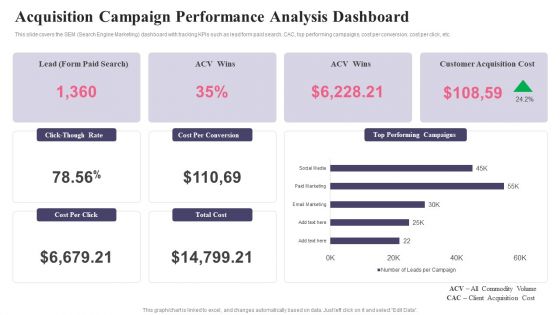
Comprehensive Guide To Acquire Customers Acquisition Campaign Performance Portrait PDF
This slide covers the SEM Search Engine Marketing dashboard with tracking KPIs such as lead form paid search, CAC, top performing campaigns, cost per conversion, cost per click, etc.Slidegeeks is one of the best resources for PowerPoint templates. You can download easily and regulate Comprehensive Guide To Acquire Customers Acquisition Campaign Performance Portrait PDF for your personal presentations from our wonderful collection. A few clicks is all it takes to discover and get the most relevant and appropriate templates. Use our Templates to add a unique zing and appeal to your presentation and meetings. All the slides are easy to edit and you can use them even for advertisement purposes.
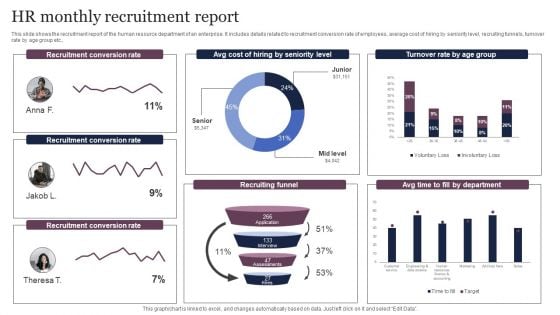
HR Monthly Recruitment Report Inspiration PDF
This slide shows the recruitment report of the human resource department of an enterprise. It includes details related to recruitment conversion rate of employees, average cost of hiring by seniority level, recruiting funnels, turnover rate by age group etc. Showcasing this set of slides titled HR Monthly Recruitment Report Inspiration PDF. The topics addressed in these templates are Recruitment Conversion Rate, Cost, Turnover Rate. All the content presented in this PPT design is completely editable. Download it and make adjustments in color, background, font etc. as per your unique business setting.
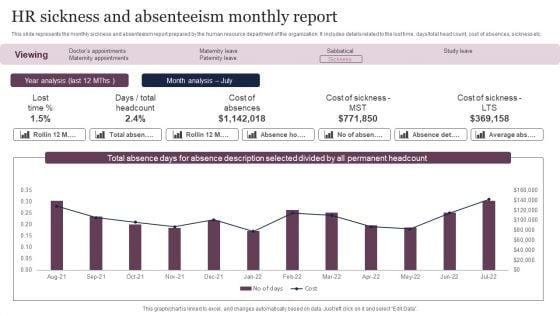
HR Sickness And Absenteeism Monthly Report Sample PDF
This slide represents the monthly sickness and absenteeism report prepared by the human resource department of the organization. It includes details related to the lost time, days or total head count, cost of absences, sickness etc. Showcasing this set of slides titled HR Sickness And Absenteeism Monthly Report Sample PDF. The topics addressed in these templates are Analysis, Cost, Hr Sickness. All the content presented in this PPT design is completely editable. Download it and make adjustments in color, background, font etc. as per your unique business setting.
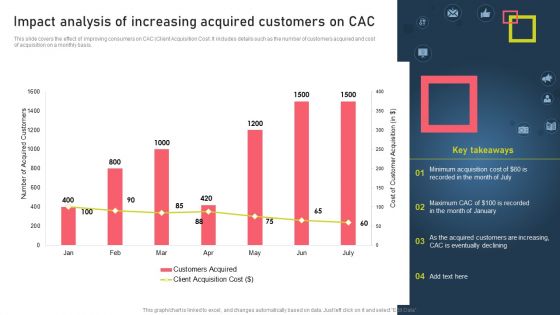
Strategies For Acquiring Online And Offline Clients Impact Analysis Of Increasing Acquired Customers On Cac Ideas PDF
This slide covers the effect of improving consumers on CAC Client Acquisition Cost. It includes details such as the number of customers acquired and cost of acquisition on a monthly basis. The best PPT templates are a great way to save time, energy, and resources. Slidegeeks have 100 percent editable powerpoint slides making them incredibly versatile. With these quality presentation templates, you can create a captivating and memorable presentation by combining visually appealing slides and effectively communicating your message. Download Strategies For Acquiring Online And Offline Clients Impact Analysis Of Increasing Acquired Customers On Cac Ideas PDF from Slidegeeks and deliver a wonderful presentation.
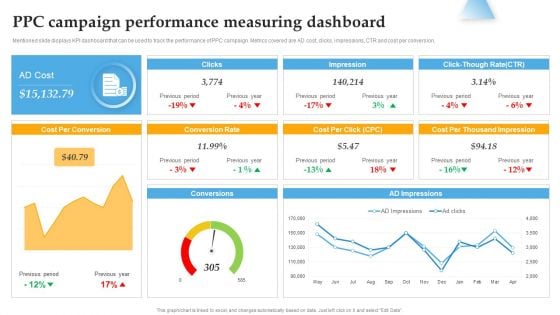
Ppc Campaign Performance Measuring Dashboard Background PDF
Mentioned slide displays KPI dashboard that can be used to track the performance of PPC campaign. Metrics covered are AD cost, clicks, impressions, CTR and cost per conversion.The best PPT templates are a great way to save time, energy, and resources. Slidegeeks have 100 precent editable powerpoint slides making them incredibly versatile. With these quality presentation templates, you can create a captivating and memorable presentation by combining visually appealing slides and effectively communicating your message. Download Ppc Campaign Performance Measuring Dashboard Background PDF from Slidegeeks and deliver a wonderful presentation.
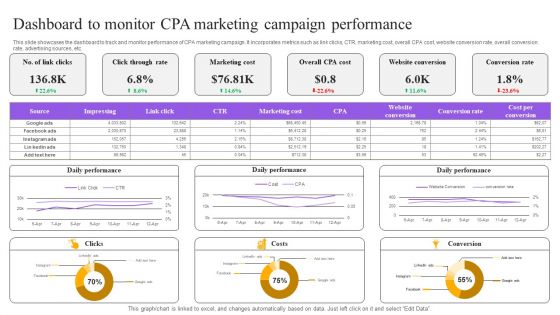
Strategies For Implementing CPA Marketing Dashboard To Monitor CPA Marketing Campaign Performance Topics PDF
This slide showcases the dashboard to track and monitor performance of CPA marketing campaign. It incorporates metrics such as link clicks, CTR, marketing cost, overall CPA cost, website conversion rate, overall conversion rate, advertising sources, etc. The best PPT templates are a great way to save time, energy, and resources. Slidegeeks have 100 percent editable powerpoint slides making them incredibly versatile. With these quality presentation templates, you can create a captivating and memorable presentation by combining visually appealing slides and effectively communicating your message. Download Strategies For Implementing CPA Marketing Dashboard To Monitor CPA Marketing Campaign Performance Topics PDF from Slidegeeks and deliver a wonderful presentation.
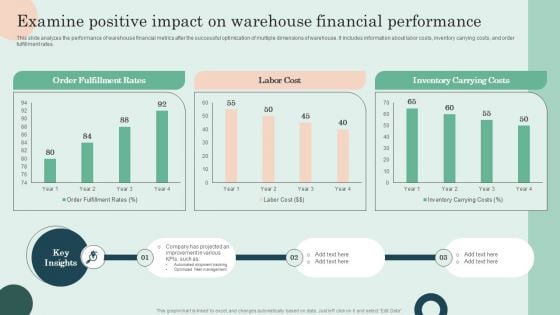
Examine Positive Impact On Warehouse Financial Performance Pictures PDF
This slide analyzes the performance of warehouse financial metrics after the successful optimization of multiple dimensions of warehouse. It includes information about labor costs, inventory carrying costs, and order fulfillment rates. Slidegeeks is one of the best resources for PowerPoint templates. You can download easily and regulate Examine Positive Impact On Warehouse Financial Performance Pictures PDF for your personal presentations from our wonderful collection. A few clicks is all it takes to discover and get the most relevant and appropriate templates. Use our Templates to add a unique zing and appeal to your presentation and meetings. All the slides are easy to edit and you can use them even for advertisement purposes.
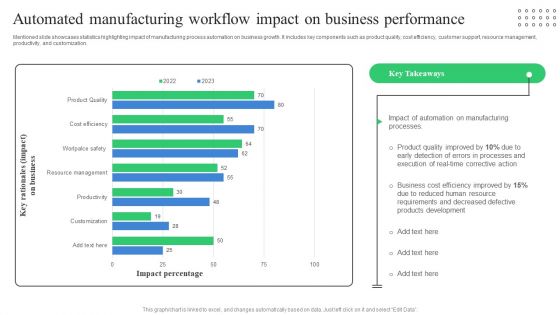
Automated Manufacturing Workflow Impact On Business Performance Sample PDF
Mentioned slide showcases statistics highlighting impact of manufacturing process automation on business growth. It includes key components such as product quality, cost efficiency, customer support, resource management, productivity, and customization. Showcasing this set of slides titled Automated Manufacturing Workflow Impact On Business Performance Sample PDF. The topics addressed in these templates are Product Quality Improved, Business Cost Efficiency, Defective Products Development. All the content presented in this PPT design is completely editable. Download it and make adjustments in color, background, font etc. as per your unique business setting.
Tracking Expenditure Incurred On Cloud Deployment Dashboard Download PDF
The following slide highlights cloud implementation expenditure dashboard to determine overspend, unused resources, plan future costs, available discounts, customization options etc. It includes components such as cloud native, software, departments, cost centre etc. Pitch your topic with ease and precision using this Tracking Expenditure Incurred On Cloud Deployment Dashboard Download PDF. This layout presents information on Dashboard, Tracking, Deployment. It is also available for immediate download and adjustment. So, changes can be made in the color, design, graphics or any other component to create a unique layout.
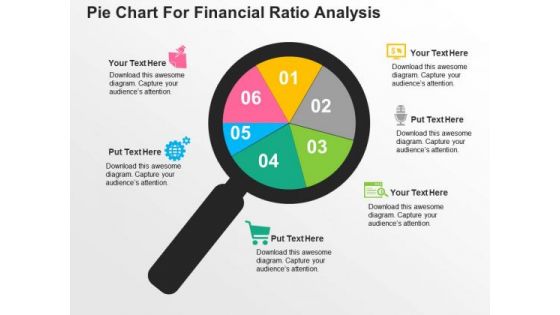
Pie Chart For Financial Ratio Analysis PowerPoint Template
Deliver amazing presentations with our above template showing pie chart. You may download this slide to display financial ratio analysis. Capture the attention of your audience using this diagram.
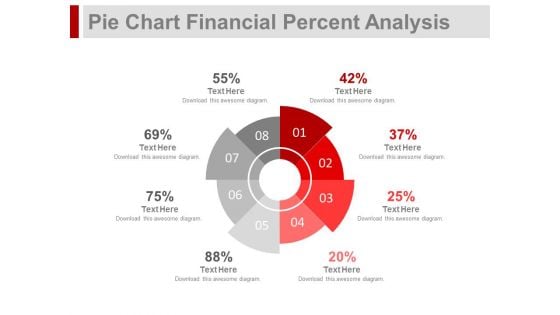
Pie Chart For Financial Ratio Analysis Powerpoint Slides
This PPT slide contains graphics of eight stage pie chart. Download this PowerPoint template slide for financial ratio analysis. This diagram is editable you can edit text, color, shade and style as per you need.
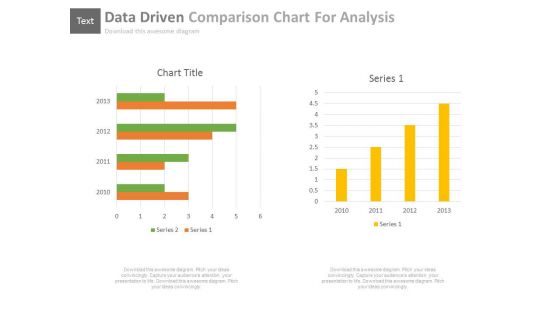
Data Driven Comparison Charts For Analysis Powerpoint Slides
You can download this PowerPoint template to display statistical data and analysis. This PPT slide contains data driven comparison charts. Draw an innovative business idea using this professional diagram.
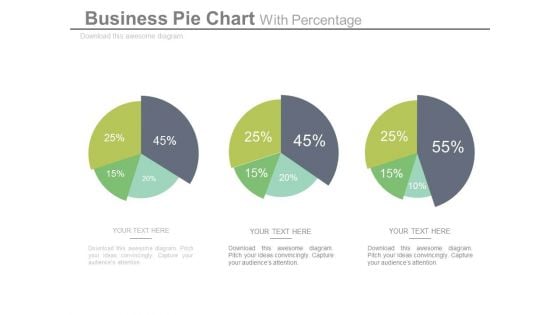
Pie Charts For Relative Comparison Study Powerpoint Slides
This power point template illustrates diagram of three pie charts with percentage values. This business slide can be used for relative comparison study. Present your views and ideas with this impressive slide.
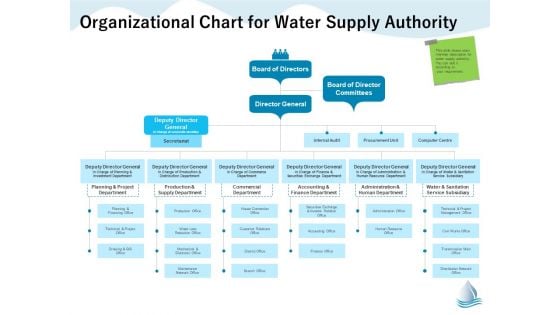
Underground Aquifer Supervision Organizational Chart For Water Supply Authority Themes PDF
Presenting this set of slides with name underground aquifer supervision organizational chart for water supply authority themes pdf. The topics discussed in these slides are planning, financing, project, production, accounting. This is a completely editable PowerPoint presentation and is available for immediate download. Download now and impress your audience.
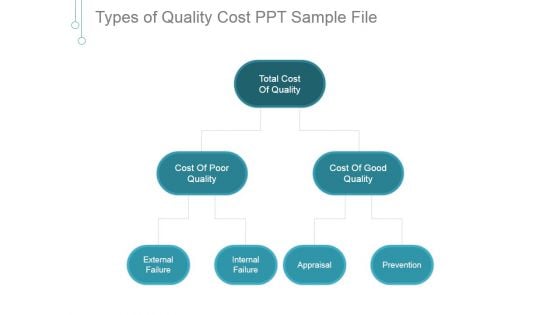
Types Of Quality Cost Ppt PowerPoint Presentation Themes
This is a types of quality cost ppt powerpoint presentation themes. This is a three stage process. The stages in this process are total cost of quality, cost of poor quality, cost of good quality, external failure, internal failure.
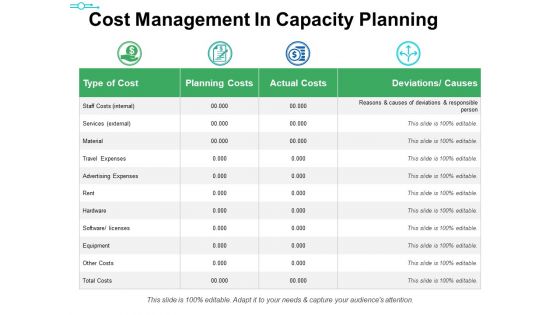
Cost Management In Capacity Planning Ppt PowerPoint Presentation Pictures Themes
This is a cost management in capacity planning ppt powerpoint presentation pictures themes. This is a four stage process. The stages in this process are type of cost, planning costs, actual costs, deviations, causes.
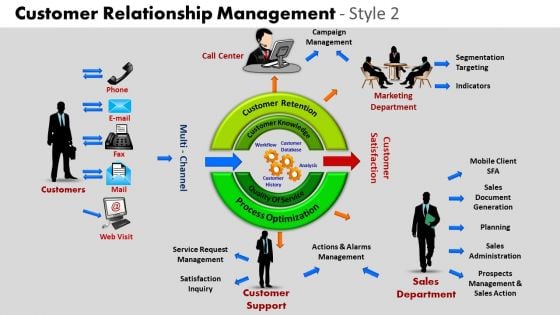
PowerPoint Themes Leadership Customer Relationship Ppt Slide Designs
PowerPoint Themes Leadership Customer Relationship PPT Slide Designs-These high quality powerpoint pre-designed slides and powerpoint templates have been carefully created by our professional team to help you impress your audience. All slides have been created and are 100% editable in powerpoint. Each and every property of any graphic - color, size, orientation, shading, outline etc. can be modified to help you build an effective powerpoint presentation. Any text can be entered at any point in the powerpoint template or slide. Simply DOWNLOAD, TYPE and PRESENT! You've found a valuable resource with our PowerPoint Themes Leadership Customer Relationship Ppt Slide Designs. You'll always stay ahead of the game.
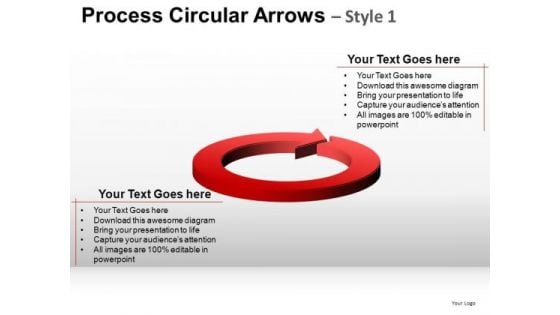
Editable Ppt Slides Circular Arrows Cycle Diagram PowerPoint Templates
Editable PPT Slides Circular Arrows Cycle Diagram PowerPoint Templates-These high quality powerpoint pre-designed slides and powerpoint templates have been carefully created by our professional team to help you impress your audience. All slides have been created and are 100% editable in powerpoint. Each and every property of any graphic - color, size, orientation, shading, outline etc. can be modified to help you build an effective powerpoint presentation. Any text can be entered at any point in the powerpoint template or slide. Simply DOWNLOAD, TYPE and PRESENT! These PowerPoint presentation slides can be used to represent themes relating to - Advise teams with our Editable Ppt Slides Circular Arrows Cycle Diagram PowerPoint Templates. Download without worries with our money back guaranteee.
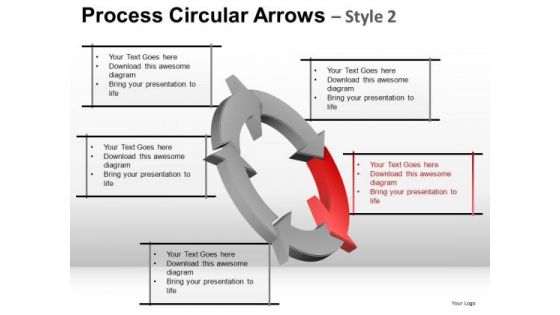
Ppt 5 Step Process Flow Cycle Diagram PowerPoint Slides
PPT 5 Step Process Flow Cycle Diagram PowerPoint Slides-These high quality powerpoint pre-designed slides and powerpoint templates have been carefully created by our professional team to help you impress your audience. All slides have been created and are 100% editable in powerpoint. Each and every property of any graphic - color, size, orientation, shading, outline etc. can be modified to help you build an effective powerpoint presentation. Any text can be entered at any point in the powerpoint template or slide. Simply DOWNLOAD, TYPE and PRESENT! These PowerPoint presentation slides can be used to represent themes relating to - Monitor plans with our Ppt 5 Step Process Flow Cycle Diagram PowerPoint Slides. Download without worries with our money back guaranteee.
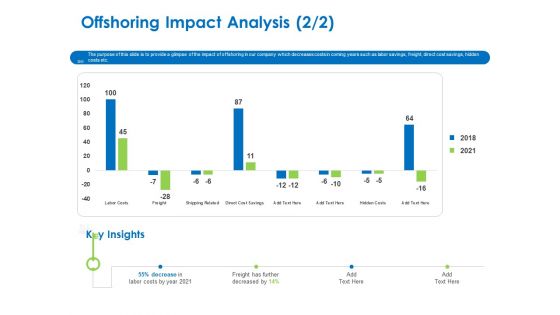
Relocation Of Business Process Offshoring Offshoring Impact Analysis Insights Inspiration PDF
The purpose of this slide is to provide a glimpse of the impact of offshoring in our company which decreases costs in coming years such as labor savings, freight, direct cost savings, hidden costs etc. Deliver an awe-inspiring pitch with this creative relocation of business process offshoring offshoring impact analysis insights inspiration pdf bundle. Topics like labor costs, freight, shipping related, direct cost savings, hidden costs, 2018 to 2021 can be discussed with this completely editable template. It is available for immediate download depending on the needs and requirements of the user.
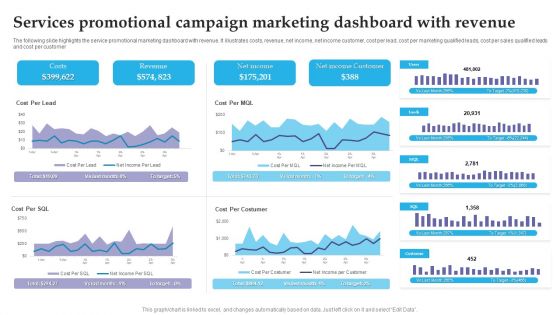
Services Promotional Campaign Marketing Dashboard With Revenue Brochure PDF
The following slide highlights the service promotional marketing dashboard with revenue. It illustrates costs, revenue, net income, net income customer, cost per lead, cost per marketing qualified leads, cost per sales qualified leads and cost per customer. Pitch your topic with ease and precision using this Services Promotional Campaign Marketing Dashboard With Revenue Brochure PDF. This layout presents information on Costs, Revenue, Net Income. It is also available for immediate download and adjustment. So, changes can be made in the color, design, graphics or any other component to create a unique layout.
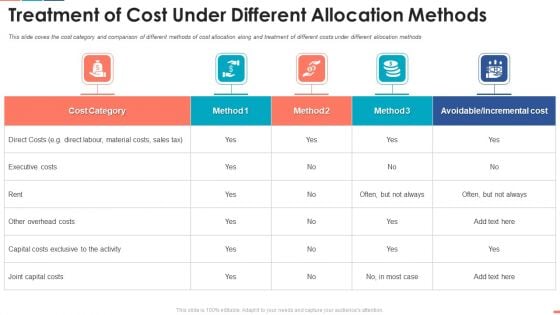
Summarize Techniques For Organization Cost Allocation Treatment Of Cost Under Themes PDF
This slide coves the cost category and comparison of different methods of cost allocation along and treatment of different costs under different allocation methods Deliver and pitch your topic in the best possible manner with this summarize techniques for organization cost allocation treatment of cost under themes pdf. Use them to share invaluable insights on executive costs, capital costs, cost category, method and impress your audience. This template can be altered and modified as per your expectations. So, grab it now.

Business Charts PowerPoint Templates Cards And Dices Happy New Year Sales Marketing Slides
Business Charts PowerPoint templates cards and dices happy new year Sales marketing Slides-New Year is the time at which a new calendar year begins and the calendar's year count is incremented. This PowerPoint Diagram helps you to wish New Year in different way. It consists of many slides with different graphics. It shows different ways of representing 2013 and wishing New Year. Critique plans with our Business Charts PowerPoint Templates Cards And Dices Happy New Year Sales Marketing Slides. Download without worries with our money back guaranteee.
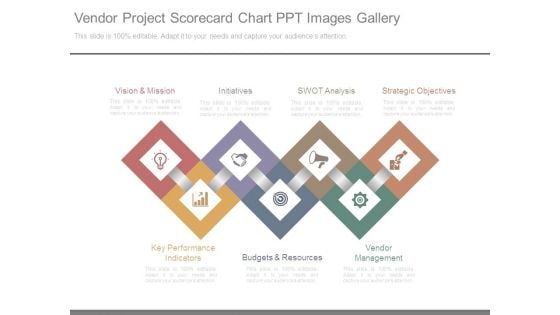
Vendor Project Scorecard Chart Ppt Images Gallery
This is a vendor project scorecard chart ppt images gallery. This is a seven stage process. The stages in this process are vision and mission, initiatives, swot analysis, strategic objectives, vendor management, budgets and resources, key performance indicators.
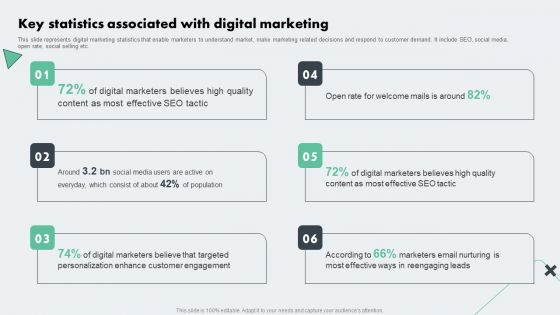
Deploying Online Marketing Key Statistics Associated With Digital Marketing Themes PDF
This slide represents digital marketing statistics that enable marketers to understand market, make marketing related decisions and respond to customer demand. It include SEO, social media, open rate, social selling etc. Boost your pitch with our creative Deploying Online Marketing Key Statistics Associated With Digital Marketing Themes PDF. Deliver an awe-inspiring pitch that will mesmerize everyone. Using these presentation templates you will surely catch everyones attention. You can browse the ppts collection on our website. We have researchers who are experts at creating the right content for the templates. So you dont have to invest time in any additional work. Just grab the template now and use them.
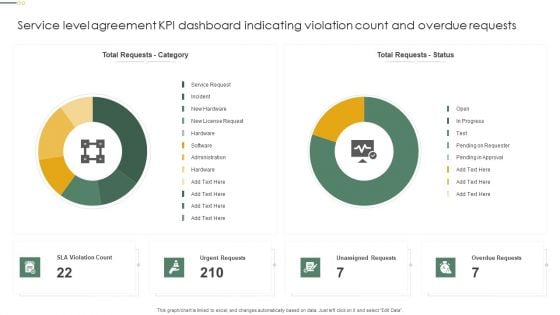
Service Level Agreement KPI Dashboard Indicating Violation Count And Overdue Requests Diagrams PDF
This graph or chart is linked to excel, and changes automatically based on data. Just left click on it and select Edit Data. Showcasing this set of slides titled Service Level Agreement KPI Dashboard Indicating Violation Count And Overdue Requests Diagrams PDF. The topics addressed in these templates are Total Requests Category, Total Requests Status, Urgent Requests. All the content presented in this PPT design is completely editable. Download it and make adjustments in color, background, font etc. as per your unique business setting.
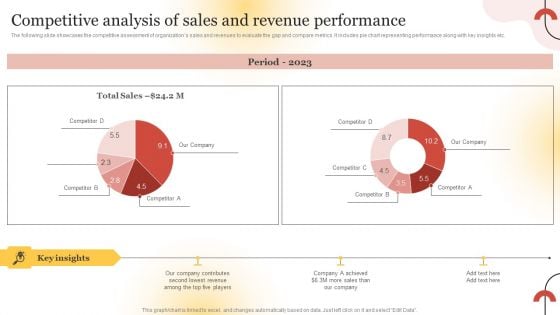
Executing Sales Risk Reduction Plan Competitive Analysis Of Sales And Revenue Performance Diagrams PDF
The following slide showcases the competitive assessment of organizations sales and revenues to evaluate the gap and compare metrics. It includes pie chart representing performance along with key insights etc. Take your projects to the next level with our ultimate collection of Executing Sales Risk Reduction Plan Competitive Analysis Of Sales And Revenue Performance Diagrams PDF. Slidegeeks has designed a range of layouts that are perfect for representing task or activity duration, keeping track of all your deadlines at a glance. Tailor these designs to your exact needs and give them a truly corporate look with your own brand colors they will make your projects stand out from the rest.
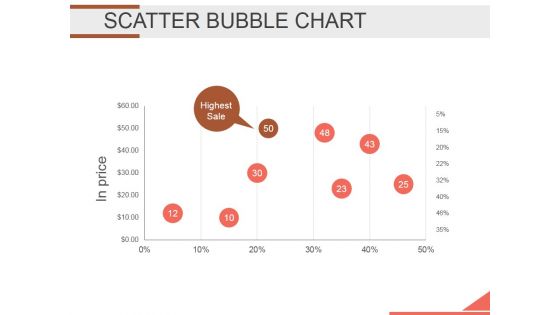
Scatter Bubble Chart Ppt PowerPoint Presentation Backgrounds
This is a scatter bubble chart ppt powerpoint presentation backgrounds. This is a one stage process. The stages in this process are bubble chart, finance, marketing, analysis, strategy, business.
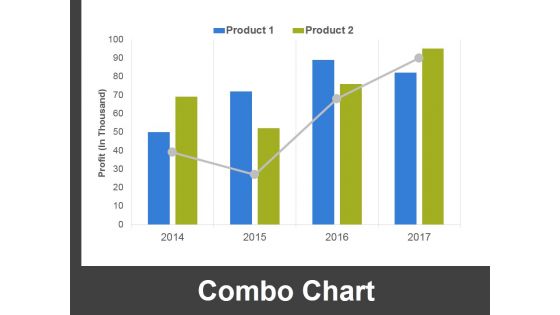
Combo Chart Ppt PowerPoint Presentation Ideas Outfit
This is a combo chart ppt powerpoint presentation ideas outfit. This is a four stage process. The stages in this process are combo chart, finance, analysis, marketing, strategy, business.
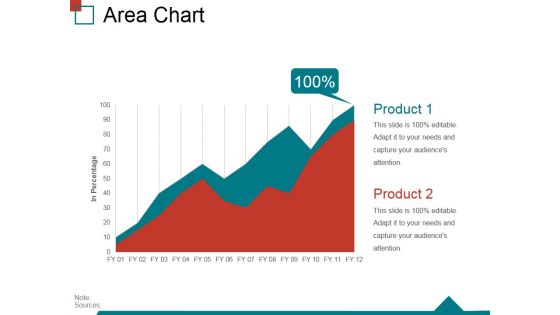
Area Chart Ppt PowerPoint Presentation Inspiration Display
This is a area chart ppt powerpoint presentation inspiration display. This is a two stage process. The stages in this process are area chart, finance, growth, success, strategy, business.
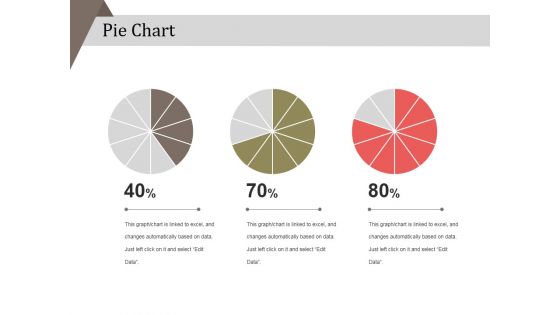
Pie Chart Ppt PowerPoint Presentation Layouts Example
This is a pie chart ppt powerpoint presentation layouts example. This is a three stage process. The stages in this process are business, strategy, analysis, pie chart, finance, marketing.
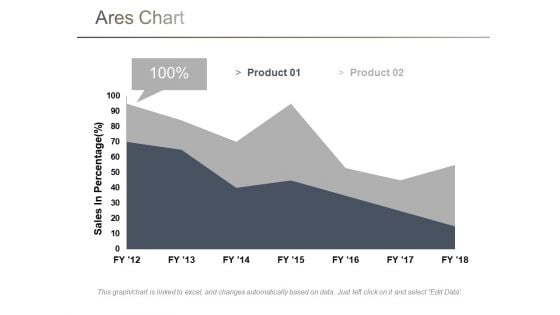
Area Chart Ppt PowerPoint Presentation Model Influencers
This is a area chart ppt powerpoint presentation model influencers. This is a two stage process. The stages in this process are sales in percentage, chart, business, marketing, finance.
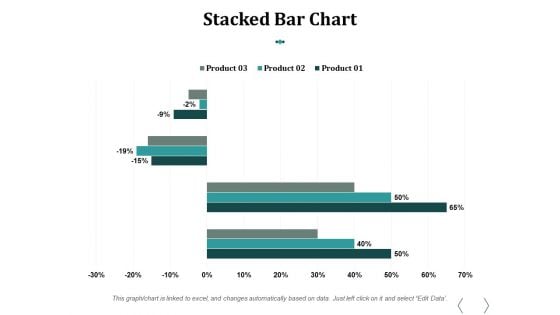
Stacked Bar Chart Ppt PowerPoint Presentation Influencers
This is a stacked bar chart ppt powerpoint presentation influencers. This is a three stage process. The stages in this process are stacked bar chart, product, percentage, finance, business.

International Business Extension Expectations After Expanding Into Global Markets Diagrams PDF
This slide showcase graph that can help organization to estimate the impact on organizational sales after global expansion. It showcases sales in thousand dollars and forecast for a period of two years. If you are looking for a format to display your unique thoughts, then the professionally designed International Business Extension Expectations After Expanding Into Global Markets Diagrams PDF is the one for you. You can use it as a Google Slides template or a PowerPoint template. Incorporate impressive visuals, symbols, images, and other charts. Modify or reorganize the text boxes as you desire. Experiment with shade schemes and font pairings. Alter, share or cooperate with other people on your work. Download International Business Extension Expectations After Expanding Into Global Markets Diagrams PDF and find out how to give a successful presentation. Present a perfect display to your team and make your presentation unforgettable.
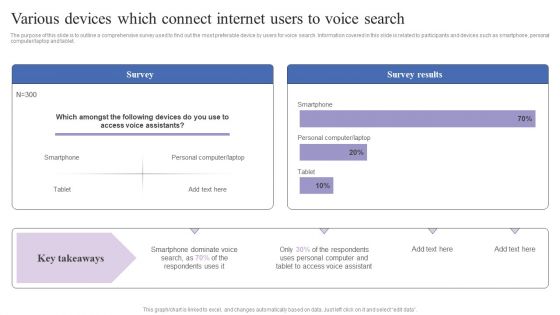
Various Devices Which Connect Internet Users To Voice Search Diagrams PDF
The purpose of this slide is to outline a comprehensive survey used to find out the most preferable device by users for voice search. Information covered in this slide is related to participants and devices such as smartphone, personal computer laptop and tablet. If you are looking for a format to display your unique thoughts, then the professionally designed Various Devices Which Connect Internet Users To Voice Search Diagrams PDF is the one for you. You can use it as a Google Slides template or a PowerPoint template. Incorporate impressive visuals, symbols, images, and other charts. Modify or reorganize the text boxes as you desire. Experiment with shade schemes and font pairings. Alter, share or cooperate with other people on your work. Download Various Devices Which Connect Internet Users To Voice Search Diagrams PDF and find out how to give a successful presentation. Present a perfect display to your team and make your presentation unforgettable.
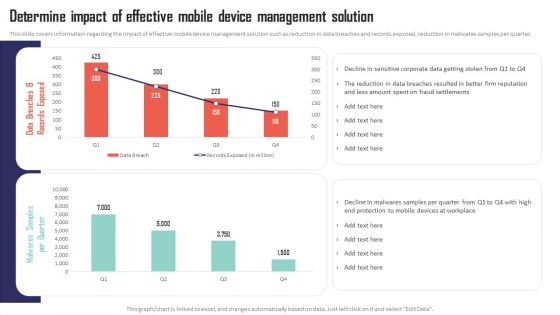
Mobile Device Management Determine Impact Of Effective Mobile Device Management Diagrams PDF
This slide covers information regarding the impact of effective mobile device management solution such as reduction in data breaches and records exposed, reduction in malwares samples per quarter. If you are looking for a format to display your unique thoughts, then the professionally designed Mobile Device Management Determine Impact Of Effective Mobile Device Management Diagrams PDF is the one for you. You can use it as a Google Slides template or a PowerPoint template. Incorporate impressive visuals, symbols, images, and other charts. Modify or reorganize the text boxes as you desire. Experiment with shade schemes and font pairings. Alter, share or cooperate with other people on your work. Download Mobile Device Management Determine Impact Of Effective Mobile Device Management Diagrams PDF and find out how to give a successful presentation. Present a perfect display to your team and make your presentation unforgettable.
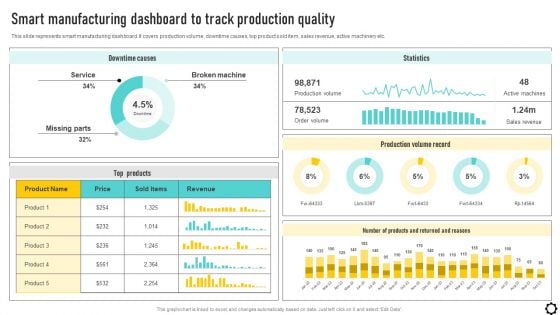
Optimizing Production Process Smart Manufacturing Dashboard To Track Production Diagrams PDF
This slide represents smart manufacturing dashboard. It covers production volume, downtime causes, top product sold item, sales revenue, active machinery etc. If you are looking for a format to display your unique thoughts, then the professionally designed Optimizing Production Process Smart Manufacturing Dashboard To Track Production Diagrams PDF is the one for you. You can use it as a Google Slides template or a PowerPoint template. Incorporate impressive visuals, symbols, images, and other charts. Modify or reorganize the text boxes as you desire. Experiment with shade schemes and font pairings. Alter, share or cooperate with other people on your work. Download Optimizing Production Process Smart Manufacturing Dashboard To Track Production Diagrams PDF and find out how to give a successful presentation. Present a perfect display to your team and make your presentation unforgettable.
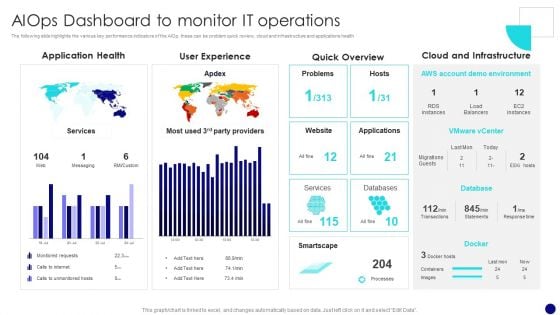
Information Technology Operations Administration With ML Aiops Dashboard To Monitor Diagrams PDF
The following slide highlights the various key performance indicators of the AIOp, these can be problem quick review, cloud and infrastructure and applications health. If you are looking for a format to display your unique thoughts, then the professionally designed Information Technology Operations Administration With ML Aiops Dashboard To Monitor Diagrams PDF is the one for you. You can use it as a Google Slides template or a PowerPoint template. Incorporate impressive visuals, symbols, images, and other charts. Modify or reorganize the text boxes as you desire. Experiment with shade schemes and font pairings. Alter, share or cooperate with other people on your work. Download Information Technology Operations Administration With ML Aiops Dashboard To Monitor Diagrams PDF and find out how to give a successful presentation. Present a perfect display to your team and make your presentation unforgettable.

Operational Strategy For ML In IT Sector Aiops Dashboard To Monitor IT Operations Diagrams PDF
The following slide highlights the various key performance indicators of the AIOps, these can be problem quick review, cloud and infrastructure and applications health If you are looking for a format to display your unique thoughts, then the professionally designed Operational Strategy For ML In IT Sector Aiops Dashboard To Monitor IT Operations Diagrams PDF is the one for you. You can use it as a Google Slides template or a PowerPoint template. Incorporate impressive visuals, symbols, images, and other charts. Modify or reorganize the text boxes as you desire. Experiment with shade schemes and font pairings. Alter, share or cooperate with other people on your work. Download Operational Strategy For ML In IT Sector Aiops Dashboard To Monitor IT Operations Diagrams PDF and find out how to give a successful presentation. Present a perfect display to your team and make your presentation unforgettable.

Mitigating Sales Risks With Strategic Action Planning Assessing Impact Of Sales Risk Management Diagrams PDF
The following slide highlights some key performance indicators KPIs to measure the influence of executing sales risk management strategies on revenue performance. It includes elements such as target attainment rate, gross profit, annual growth rate etc. If you are looking for a format to display your unique thoughts, then the professionally designed Mitigating Sales Risks With Strategic Action Planning Assessing Impact Of Sales Risk Management Diagrams PDF is the one for you. You can use it as a Google Slides template or a PowerPoint template. Incorporate impressive visuals, symbols, images, and other charts. Modify or reorganize the text boxes as you desire. Experiment with shade schemes and font pairings. Alter, share or cooperate with other people on your work. Download Mitigating Sales Risks With Strategic Action Planning Assessing Impact Of Sales Risk Management Diagrams PDF and find out how to give a successful presentation. Present a perfect display to your team and make your presentation unforgettable.
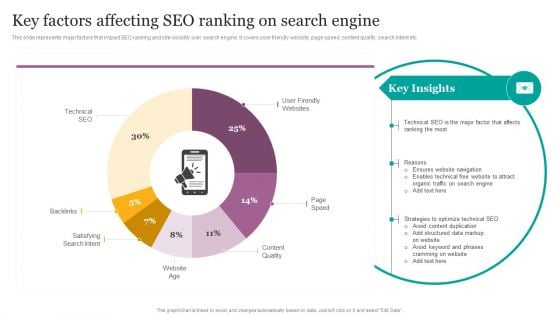
Key Factors Affecting SEO Ranking On Search Engine Ppt Infographics Diagrams PDF
This slide represents major factors that impact SEO ranking and site visibility over search engine. It covers user friendly website, page speed, content quality, search intent etc. If you are looking for a format to display your unique thoughts, then the professionally designed Key Factors Affecting SEO Ranking On Search Engine Ppt Infographics Diagrams PDF is the one for you. You can use it as a Google Slides template or a PowerPoint template. Incorporate impressive visuals, symbols, images, and other charts. Modify or reorganize the text boxes as you desire. Experiment with shade schemes and font pairings. Alter, share or cooperate with other people on your work. Download Key Factors Affecting SEO Ranking On Search Engine Ppt Infographics Diagrams PDF and find out how to give a successful presentation. Present a perfect display to your team and make your presentation unforgettable.
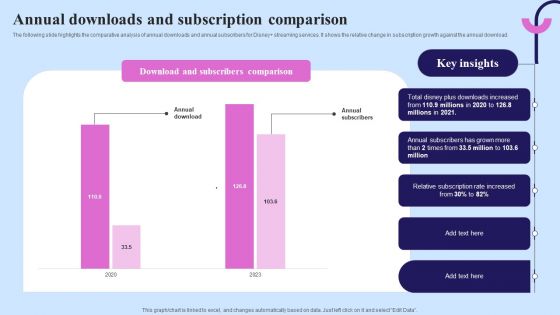
Video Streaming Technology Company Introduction Annual Downloads And Subscription Diagrams PDF
The following slide highlights the comparative analysis of annual downloads and annual subscribers for Disney plus streaming services. It shows the relative change in subscription growth against the annual download. If you are looking for a format to display your unique thoughts, then the professionally designed Video Streaming Technology Company Introduction Annual Downloads And Subscription Diagrams PDF is the one for you. You can use it as a Google Slides template or a PowerPoint template. Incorporate impressive visuals, symbols, images, and other charts. Modify or reorganize the text boxes as you desire. Experiment with shade schemes and font pairings. Alter, share or cooperate with other people on your work. Download Video Streaming Technology Company Introduction Annual Downloads And Subscription Diagrams PDF and find out how to give a successful presentation. Present a perfect display to your team and make your presentation unforgettable.
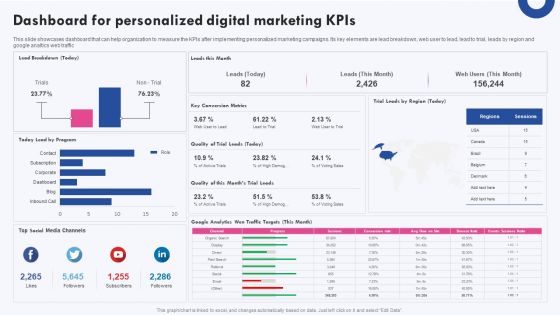
Targeted Marketing Campaigns To Improve Buyers Experience Dashboard For Personalized Digital Marketing Kpis Diagrams PDF
This slide showcases dashboard that can help organization to measure the KPIs after implementing personalized marketing campaigns. Its key elements are lead breakdown, web user to lead, lead to trial, leads by region and google analtics web traffic If you are looking for a format to display your unique thoughts, then the professionally designed Targeted Marketing Campaigns To Improve Buyers Experience Dashboard For Personalized Digital Marketing Kpis Diagrams PDF is the one for you. You can use it as a Google Slides template or a PowerPoint template. Incorporate impressive visuals, symbols, images, and other charts. Modify or reorganize the text boxes as you desire. Experiment with shade schemes and font pairings. Alter, share or cooperate with other people on your work. Download Targeted Marketing Campaigns To Improve Buyers Experience Dashboard For Personalized Digital Marketing Kpis Diagrams PDF and find out how to give a successful presentation. Present a perfect display to your team and make your presentation unforgettable.

Pie Graph01 Business PowerPoint Templates And PowerPoint Themes 0512
Microsoft Powerpoint Templates and Background with pie chart-These templates can be used for presentations relating to-Pie chart, finance, marketing, business, circle chart, shapes-Pie Graph01 Business PowerPoint Templates And PowerPoint Themes 0512 Brew your ideas in our Pie Graph01 Business PowerPoint Templates And PowerPoint Themes 0512. They will come upwith an exciting concoction.
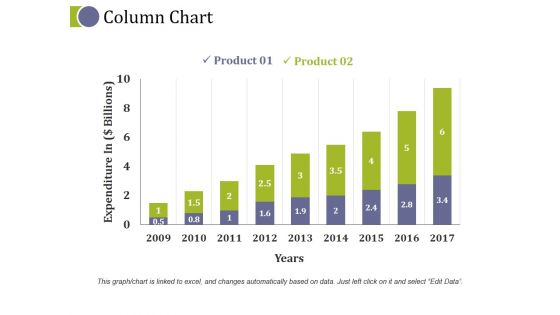
Column Chart Ppt PowerPoint Presentation Ideas Visual Aids
This is a column chart ppt powerpoint presentation ideas visual aids. This is a two stage process. The stages in this process are growth, business, finance, marketing, analysis.

Combo Chart Ppt PowerPoint Presentation Styles Example File
This is a combo chart ppt powerpoint presentation styles example file. This is a three stage process. The stages in this process are finance, growth, business, analysis, marketing.
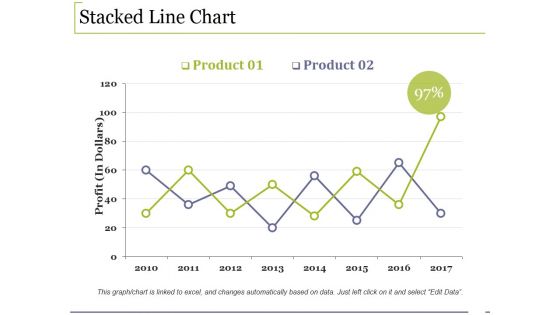
Stacked Line Chart Ppt PowerPoint Presentation Ideas Styles
This is a stacked line chart ppt powerpoint presentation ideas styles. This is a two stage process. The stages in this process are growth, finance, analysis, management, business.
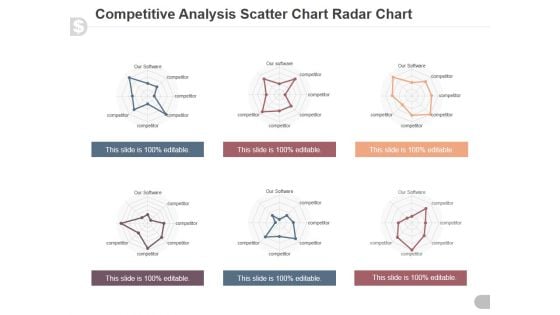
Competitive Analysis Scatter Chart Radar Chart Ppt PowerPoint Presentation Model
This is a competitive analysis scatter chart radar chart ppt powerpoint presentation model. This is a eight stage process. The stages in this process are users interface, data import, example, pricing, support, update, tutorials, easy to use.
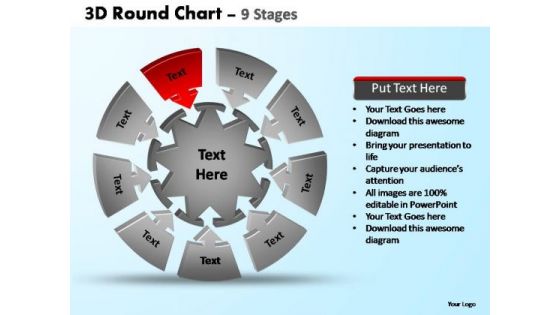
PowerPoint Process Chart Pie Chart With Arrows Ppt Design Slides
PowerPoint Process Chart Pie Chart with Arrows PPT Design Slides-These amazing PowerPoint pre-designed slides and PowerPoint templates have been carefully created by our team of experts to help you impress your audience. Our stunning collection of Powerpoint slides are 100% editable and can easily fit in any PowerPoint presentations. By using these animations and graphics in PowerPoint and you can easily make professional presentations. Any text can be entered at any point in the PowerPoint template or slide. Just DOWNLOAD our awesome PowerPoint templates and you are ready to go. The impact of your ideas will take time to fade. The images of our PowerPoint Process Chart Pie Chart With Arrows Ppt Design Slides will help their recall.
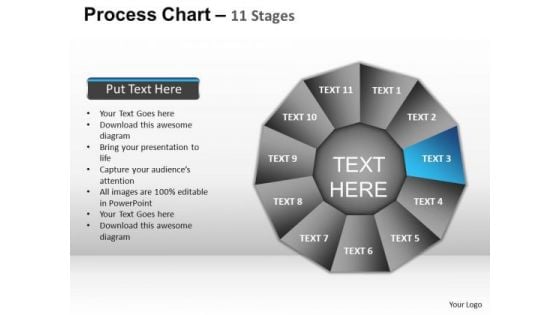
PowerPoint Presentation Designs Chart Process Chart Ppt Template
PowerPoint Presentation Designs Chart process chart PPT Template-The Circle of Life - a concept emmbedded in our minds and hence easy to comprehend. Life and Business is made up of processes comprising stages that flow from one to another. An excellent graphic to attract the attention of and understanding by your audience to improve earnings.-These amazing PowerPoint pre-designed slides and PowerPoint templates have been carefully created by our team of experts to help you impress your audience. Our stunning collection of Powerpoint slides are 100% editable and can easily fit in any PowerPoint presentations. By using these animations and graphics in PowerPoint and you can easily make professional presentations. Any text can be entered at any point in the PowerPoint template or slide. Just DOWNLOAD our awesome PowerPoint templates and you are ready to go. Let our PowerPoint Presentation Designs Chart Process Chart Ppt Template figure in your plans. Appreciate the assistance they provide.
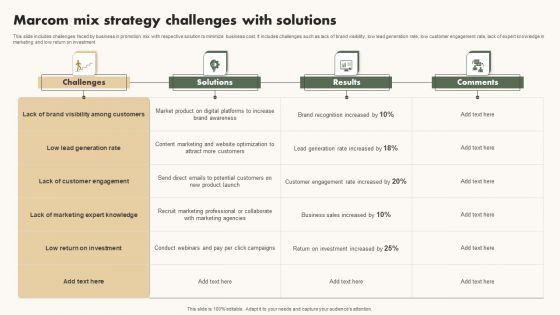
Marcom Mix Strategy Challenges With Solutions Themes PDF
This slide includes challenges faced by business in promotion mix with respective solution to minimize business cost. It includes challenges such as lack of brand visibility, low lead generation rate, low customer engagement rate, lack of expert knowledge in marketing and low return on investment. Showcasing this set of slides titled Marcom Mix Strategy Challenges With Solutions Themes PDF. The topics addressed in these templates are Lack Of Customer Engagement, Low Lead Generation Rate, Low Return On Investment. All the content presented in this PPT design is completely editable. Download it and make adjustments in color, background, font etc. as per your unique business setting.
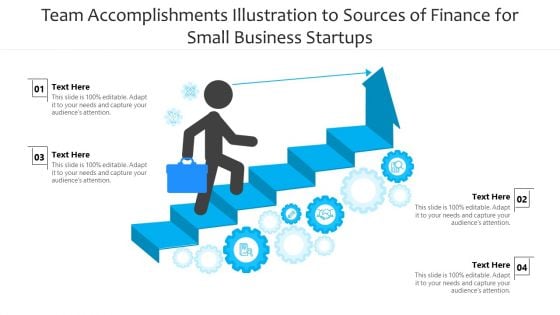
Team Accomplishments Illustration To Sources Of Finance For Small Business Startups Ppt PowerPoint Presentation File Topics PDF
Presenting team accomplishments illustration to sources of finance for small business startups ppt powerpoint presentation file topics pdf to dispense important information. This template comprises four stages. It also presents valuable insights into the topics including team accomplishments illustration to sources of finance for small business startups. This is a completely customizable PowerPoint theme that can be put to use immediately. So, download it and address the topic impactfully.
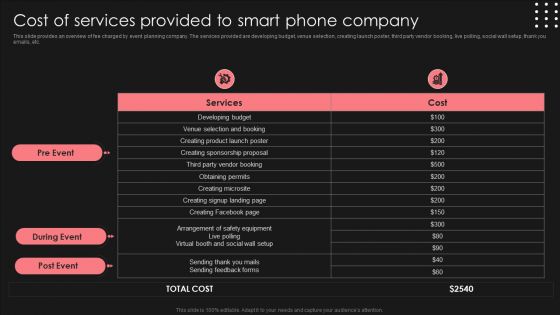
Positive Impact Of Effective Cost Of Services Provided To Smart Phone Company Themes PDF
This slide provides an overview of fee charged by event planning company. The services provided are developing budget, venue selection, creating launch poster, third party vendor booking, live polling, social wall setup, thank you emails, etc. If you are looking for a format to display your unique thoughts, then the professionally designed Positive Impact Of Effective Cost Of Services Provided To Smart Phone Company Themes PDF is the one for you. You can use it as a Google Slides template or a PowerPoint template. Incorporate impressive visuals, symbols, images, and other charts. Modify or reorganize the text boxes as you desire. Experiment with shade schemes and font pairings. Alter, share or cooperate with other people on your work. Download Positive Impact Of Effective Cost Of Services Provided To Smart Phone Company Themes PDF and find out how to give a successful presentation. Present a perfect display to your team and make your presentation unforgettable.
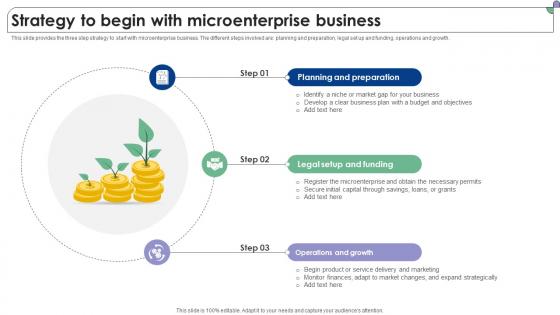
Strategy To Begin With Microenterprise Business Complete Guide To Microfinance Fin SS V
This slide provides the three step strategy to start with microenterprise business. The different steps involved are planning and preparation, legal set up and funding, operations and growth. Retrieve professionally designed Strategy To Begin With Microenterprise Business Complete Guide To Microfinance Fin SS V to effectively convey your message and captivate your listeners. Save time by selecting pre-made slideshows that are appropriate for various topics, from business to educational purposes. These themes come in many different styles, from creative to corporate, and all of them are easily adjustable and can be edited quickly. Access them as PowerPoint templates or as Google Slides themes. You do not have to go on a hunt for the perfect presentation because Slidegeeks got you covered from everywhere. This slide provides the three step strategy to start with microenterprise business. The different steps involved are planning and preparation, legal set up and funding, operations and growth.
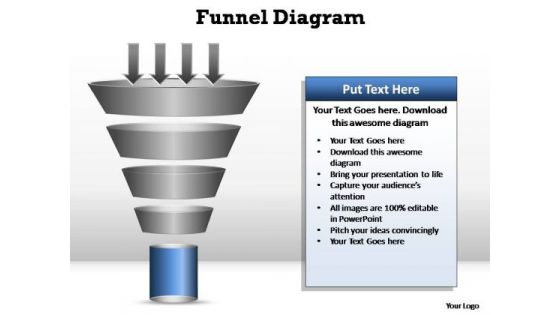
PowerPoint Themes Marketing Funnel Diagram Ppt Presentation
PowerPoint Themes Marketing Funnel Diagram PPT Presentation-You have the product you need. Now funnel your marketing strategies down the cone,stage by stage, refining as you go along. Enlighten others on the process with this innovative graphic to authenticate your plan of acheiving the goal of added value/profit.-PowerPoint Themes Marketing Funnel Diagram PPT Presentation Conduct meetings with our PowerPoint Themes Marketing Funnel Diagram Ppt Presentation. Download without worries with our money back guaranteee.
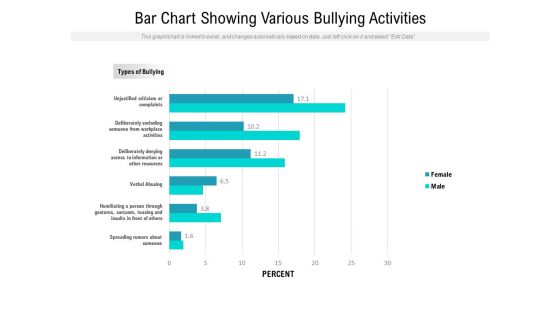
Bar Chart Showing Various Bullying Activities Ppt PowerPoint Presentation Professional Slide PDF
Pitch your topic with ease and precision using this bar chart showing various bullying activities ppt powerpoint presentation professional slide pdf. This layout presents information on unjustified criticism or complaints, deliberately excluding someone from workplace activities, deliberately denying access to information or other resources, verbal abusing, humiliating a person through gestures, sarcasm, teasing and insults in front of others, spreading rumors about someone. It is also available for immediate download and adjustment. So, changes can be made in the color, design, graphics or any other component to create a unique layout.
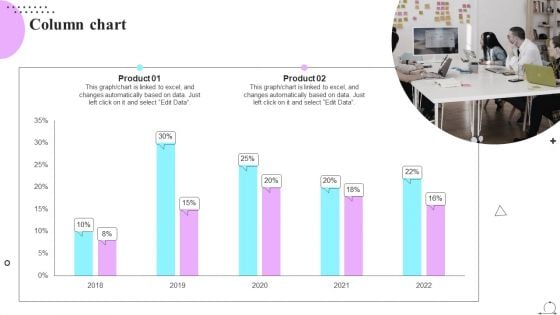
Playbook For Sprint Agile Column Chart Ppt PowerPoint Presentation File Layouts PDF
Slidegeeks is one of the best resources for PowerPoint templates. You can download easily and regulate Playbook For Sprint Agile Column Chart Ppt PowerPoint Presentation File Layouts PDF for your personal presentations from our wonderful collection. A few clicks is all it takes to discover and get the most relevant and appropriate templates. Use our Templates to add a unique zing and appeal to your presentation and meetings. All the slides are easy to edit and you can use them even for advertisement purposes.

 Home
Home