Bank Icon
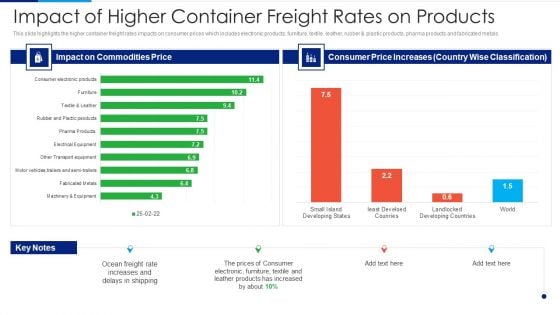
Russia Ukraine Conflict Effect Impact Of Higher Container Freight Rates On Products Diagrams PDF
This slide highlights the higher container freight rates impacts on consumer prices which includes electronic products, furniture, textile, leather, rubber and plastic products, pharma products and fabricated metals. Deliver an awe inspiring pitch with this creative Russia Ukraine Conflict Effect Impact Of Higher Container Freight Rates On Products Diagrams PDF bundle. Topics like Impact On Commodities Price, Consumer Price Increases, Ocean Freight Rate, Prices Of Consumer can be discussed with this completely editable template. It is available for immediate download depending on the needs and requirements of the user.
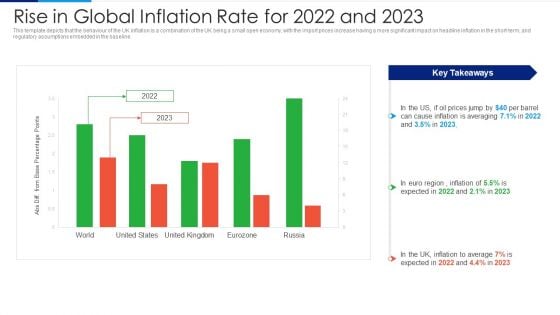
Russia Ukraine Conflict Effect Rise In Global Inflation Rate For 2022 And 2023 Diagrams PDF
This template depicts that the behaviour of the UK inflation is a combination of the UK being a small open economy, with the import prices increase having a more significant impact on headline inflation in the short-term, and regulatory assumptions embedded in the baseline. Deliver and pitch your topic in the best possible manner with this Russia Ukraine Conflict Effect Rise In Global Inflation Rate For 2022 And 2023 Diagrams PDF. Use them to share invaluable insights on Inflation To Average, 2022 To 2023, Abs Diff From Base Percentage Points and impress your audience. This template can be altered and modified as per your expectations. So, grab it now.
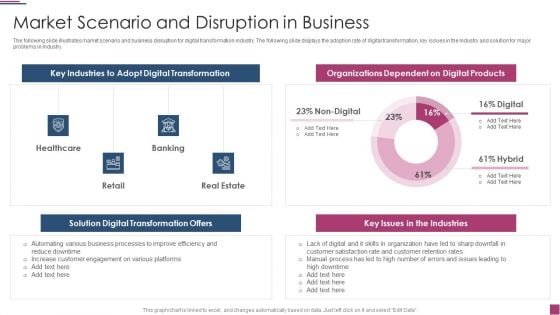
Innovation Procedure For Online Business Market Scenario And Disruption In Business Diagrams PDF
The following slide illustrates market scenario and business disruption for digital transformation industry. The following slide displays the adoption rate of digital transformation, key issues in the Industry and solution for major problems in Industry. Deliver and pitch your topic in the best possible manner with this Innovation Procedure For Online Business Market Scenario And Disruption In Business Diagrams PDF Use them to share invaluable insights on Key Industries, Solution Digital Transformation, Organizations Dependent and impress your audience. This template can be altered and modified as per your expectations. So, grab it now.
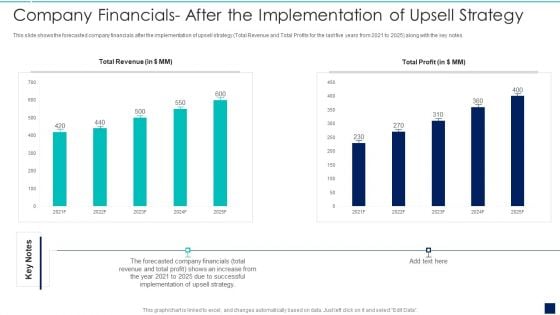
Influence Buyers To Purchase Additional High Company Financials After The Implementation Diagrams PDF
This slide shows the forecasted company financials after the implementation of upsell strategy total Revenue and Total Profits for the last five years from 2021 to 2025 along with the key notes.Deliver an awe inspiring pitch with this creative Influence Buyers To Purchase Additional High Company Financials After The Implementation Diagrams PDF bundle. Topics like Company Financials After The Implementation Of Upsell Strategy can be discussed with this completely editable template. It is available for immediate download depending on the needs and requirements of the user.
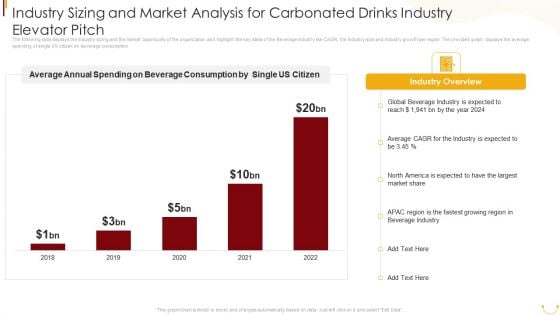
Industry Sizing And Market Analysis For Carbonated Drinks Industry Elevator Pitch Diagrams PDF
The following slide displays the Industry sizing and the market opportunity of the organization as it highlight the key stats of the Beverage industry like CAGR, the Industry size and Industry growth per region. The provided graph displays the average spending of single US citizen on beverage consumption. Deliver and pitch your topic in the best possible manner with this Industry Sizing And Market Analysis For Carbonated Drinks Industry Elevator Pitch Diagrams PDF. Use them to share invaluable insights on Average Annual Spending, Beverage Consumption, Single US Citizen, Global Beverage Industry, 2018 To 2022 and impress your audience. This template can be altered and modified as per your expectations. So, grab it now.

Insurance Company Business Plan Addressing Market Assessment For Insurance Business Diagrams PDF
This slide covers information regarding market assessment of insurance business with high competition existing. It covers details about key players and market share associated to top players. Deliver and pitch your topic in the best possible manner with this Insurance Company Business Plan Addressing Market Assessment For Insurance Business Diagrams PDF Use them to share invaluable insights on America Insurance, General Insurance, Local Competition Includes and impress your audience. This template can be altered and modified as per your expectations. So, grab it now.
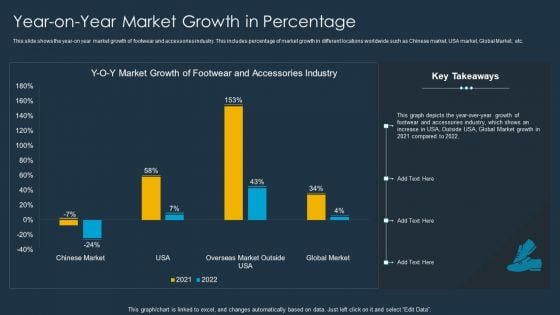
Shoe Firm Investor Pitch Deck Year On Year Market Growth In Percentage Diagrams PDF
This slide shows the year-on year market growth of footwear and accessories industry. This includes percentage of market growth in different locations worldwide such as Chinese market, USA market, Global Market, etc. Deliver an awe inspiring pitch with this creative Shoe Firm Investor Pitch Deck Year On Year Market Growth In Percentage Diagrams PDF bundle. Topics like Market Growth, Accessories Industry, Global Merket can be discussed with this completely editable template. It is available for immediate download depending on the needs and requirements of the user.
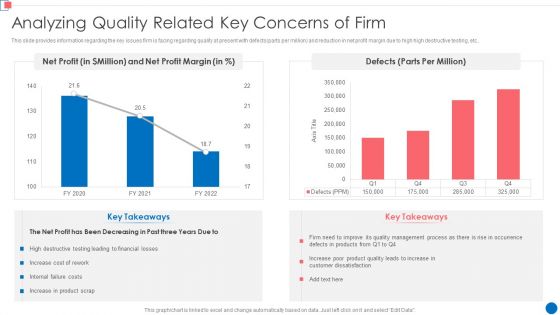
Optimize Enterprise Core Analyzing Quality Related Key Concerns Of Firm Diagrams PDF
This slide provides information regarding the key issues firm is facing regarding quality at present with defects parts per million and reduction in net profit margin due to high high destructive testing, etc. Deliver an awe inspiring pitch with this creative Optimize Enterprise Core Analyzing Quality Related Key Concerns Of Firm Diagrams PDF bundle. Topics like Net Profit, Net Profit Margin, 2020 To 2022 can be discussed with this completely editable template. It is available for immediate download depending on the needs and requirements of the user.
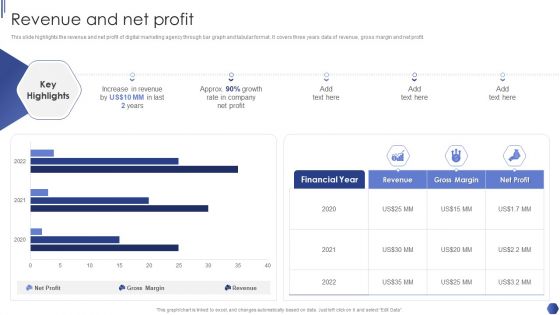
Digital Marketing Agency Business Profile Revenue And Net Profit Diagrams PDF
This slide highlights the revenue and net profit of digital marketing agency through bar graph and tabular format. It covers three years data of revenue, gross margin and net profit. Deliver and pitch your topic in the best possible manner with this Digital Marketing Agency Business Profile Revenue And Net Profit Diagrams PDF. Use them to share invaluable insights on Increase In Revenue, Growth Rate, Net Profit and impress your audience. This template can be altered and modified as per your expectations. So, grab it now.
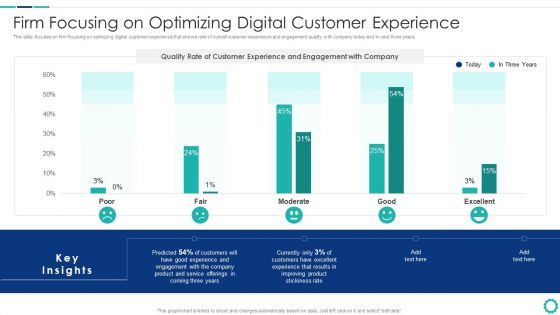
Creating Successful Strategies To Enhance Customer Experience Firm Focusing On Optimizing Digital Diagrams PDF
This slide focuses on firm focusing on optimizing digital customer experience that shows rate of overall customer experience and engagement quality with company today and in next three years.Deliver and pitch your topic in the best possible manner with this Creating Successful Strategies To Enhance Customer Experience Firm Focusing On Optimizing Digital Diagrams PDF Use them to share invaluable insights on Experience And Engagement, Improving Product, Customers Excellent and impress your audience. This template can be altered and modified as per your expectations. So, grab it now.
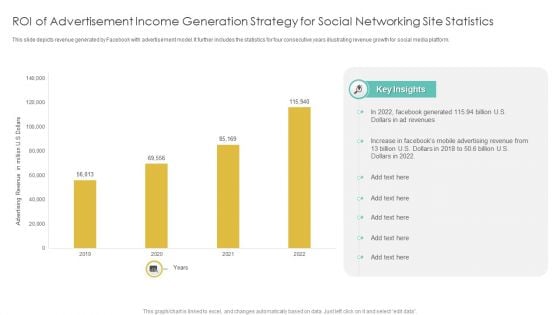
Roi Of Advertisement Income Generation Strategy For Social Networking Site Statistics Diagrams PDF
This slide depicts revenue generated by Facebook with advertisement model. It further includes the statistics for four consecutive years illustrating revenue growth for social media platform. Pitch your topic with ease and precision using this Roi Of Advertisement Income Generation Strategy For Social Networking Site Statistics Diagrams PDF. This layout presents information on Advertisement Income, Generation Strategy, Social Networking Site Statistics. It is also available for immediate download and adjustment. So, changes can be made in the color, design, graphics or any other component to create a unique layout.
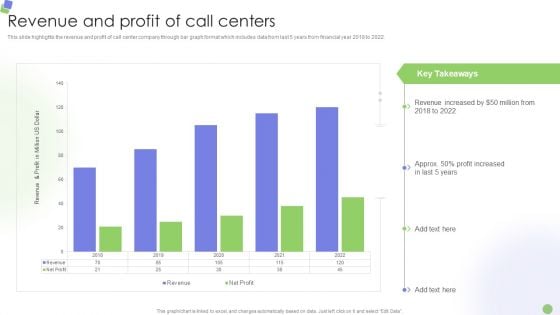
Knowledge Process Outsourcing Company Profile Revenue And Profit Of Call Centers Diagrams PDF
This slide highlights the revenue and profit of call center company through bar graph format which includes data from last 5 years from financial year 2018 to 2022.Deliver and pitch your topic in the best possible manner with this Knowledge Process Outsourcing Company Profile Revenue And Profit Of Call Centers Diagrams PDF. Use them to share invaluable insights on Revenue Increased, Profit Increased, Key Takeaways and impress your audience. This template can be altered and modified as per your expectations. So, grab it now.
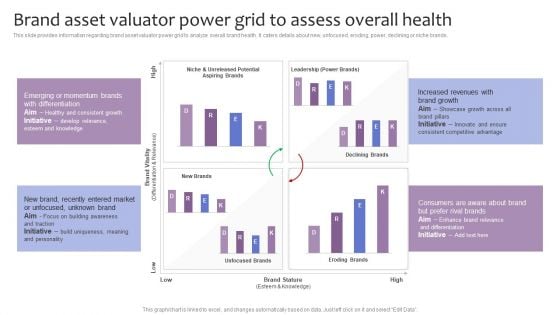
Strategic Brand Management Brand Asset Valuator Power Grid To Assess Overall Health Diagrams PDF
This slide provides information regarding brand asset valuator power grid to analyze overall brand health. It caters details about new, unfocused, eroding, power, declining or niche brands. Deliver and pitch your topic in the best possible manner with this Strategic Brand Management Brand Asset Valuator Power Grid To Assess Overall Health Diagrams PDF. Use them to share invaluable insights on Brand Vitality, Brand Stature, Declining Brands, Eroding Brands and impress your audience. This template can be altered and modified as per your expectations. So, grab it now.
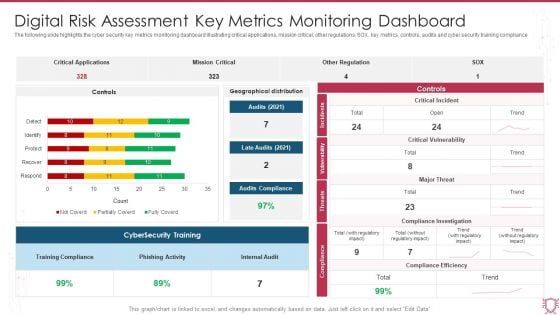
Digital Risk Assessment Key Metrics Monitoring Dashboard Ppt Ideas Diagrams PDF
The following slide highlights the cyber security key metrics monitoring dashboard illustrating critical applications, mission critical, other regulations, SOX, key metrics, controls, audits and cyber security training compliance. Showcasing this set of slides titled Digital Risk Assessment Key Metrics Monitoring Dashboard Ppt Ideas Diagrams PDF. The topics addressed in these templates are Critical Applications, Mission Critical, Other Regulation. All the content presented in this PPT design is completely editable. Download it and make adjustments in color, background, font etc. as per your unique business setting.
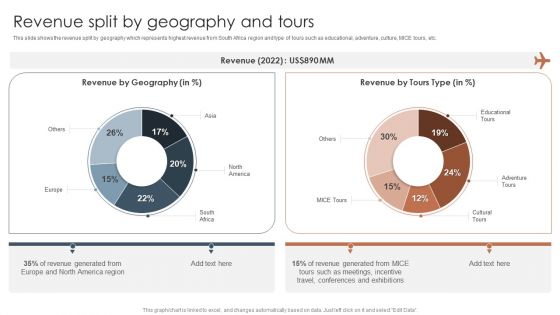
Tour And Travels Agency Profile Revenue Split By Geography And Tours Diagrams PDF
This slide shows the revenue split by geography which represents highest revenue from South Africa region and type of tours such as educational, adventure, culture, MICE tours, etc.Deliver and pitch your topic in the best possible manner with this Tour And Travels Agency Profile Revenue Split By Geography And Tours Diagrams PDF. Use them to share invaluable insights on Revenue Generated, America Region, Such As Meetings and impress your audience. This template can be altered and modified as per your expectations. So, grab it now.
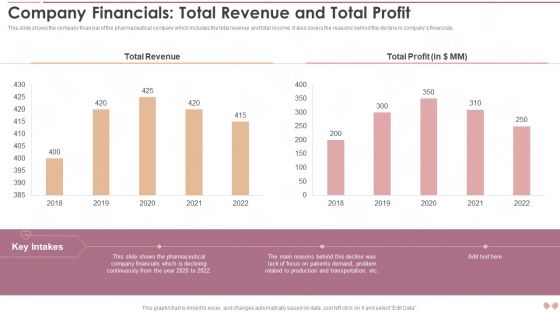
Innovative Business Model Of Pharmaceutical Company Financials Total Revenue And Total Profit Diagrams PDF
This slide shows the key impacts of the strategies on companys operations. It includes operational and environmental impacts such as accurate demand forecasting, reward research and development etc.Deliver and pitch your topic in the best possible manner with this Innovative Business Model Of Pharmaceutical Company Financials Total Revenue And Total Profit Diagrams PDF. Use them to share invaluable insights on Total Revenue, Total Profit, Related Production and impress your audience. This template can be altered and modified as per your expectations. So, grab it now.
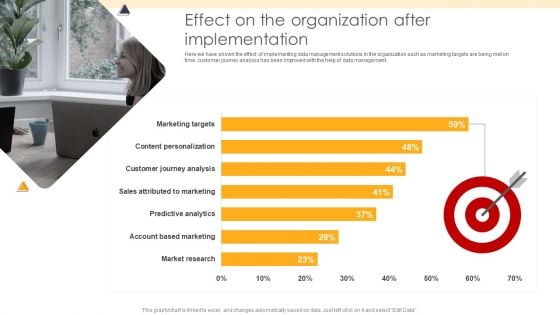
ETL Repository Effect On The Organization After Implementation Ppt PowerPoint Presentation Portfolio Diagrams PDF
Here we have shown the effect of implementing data management solutions in the organization such as marketing targets are being met on time, customer journey analysis has been improved with the help of data management. Deliver an awe inspiring pitch with this creative ETL Repository Effect On The Organization After Implementation Ppt PowerPoint Presentation Portfolio Diagrams PDF bundle. Topics like Market Research, Account Based, Sales Attributed can be discussed with this completely editable template. It is available for immediate download depending on the needs and requirements of the user.
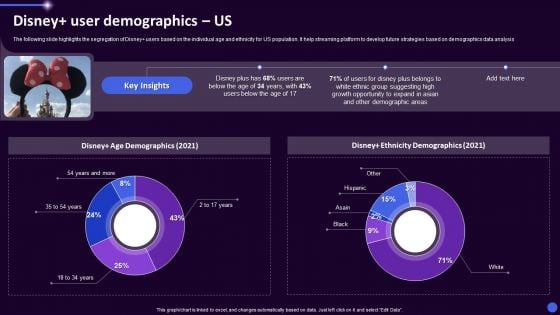
Disney Plus OTT Platform Company Summary Disney User Demographics Us Ppt Gallery Diagrams PDF
The following slide highlights the segregation of Disney users based on the individual age and ethnicity for US population. It help streaming platform to develop future strategies based on demographics data analysis. Deliver an awe inspiring pitch with this creative Disney Plus OTT Platform Company Summary Disney User Demographics Us Ppt Gallery Diagrams PDF bundle. Topics like Disney Ethnicity Demographics, Disney Age Demographics, 2021 can be discussed with this completely editable template. It is available for immediate download depending on the needs and requirements of the user.
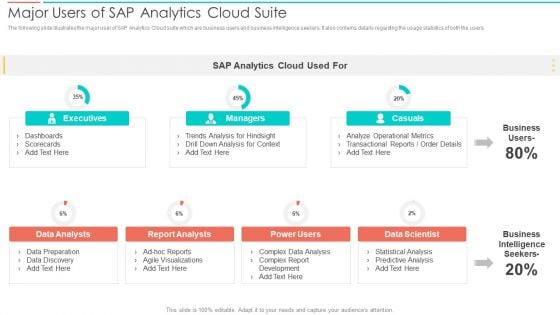
SAC Planning And Implementation Major Users Of SAP Analytics Cloud Suite Diagrams PDF
The following slide illustrates the major user of SAP Analytics Cloud suite which are business users and business intelligence seekers. It also contains details regarding the usage statistics of both the users. Deliver an awe inspiring pitch with this creative SAC Planning And Implementation Major Users Of SAP Analytics Cloud Suite Diagrams PDF bundle. Topics like Executives, Casuals, Business Intelligence Seekers, Data Scientist can be discussed with this completely editable template. It is available for immediate download depending on the needs and requirements of the user.
B2B Sales Techniques Playbook Sales Management Activities Tracking Dashboard Diagrams PDF
This slide provides information regarding sales management activities tracking dashboard to measure closed business, sales pipeline, sales activity by sales rep, month over month growth, forecast by month, etc. Deliver and pitch your topic in the best possible manner with this B2B Sales Techniques Playbook Sales Management Activities Tracking Dashboard Diagrams PDF. Use them to share invaluable insights on Sales Pipeline, Sales Activity, Sales Pipeline and impress your audience. This template can be altered and modified as per your expectations. So, grab it now.
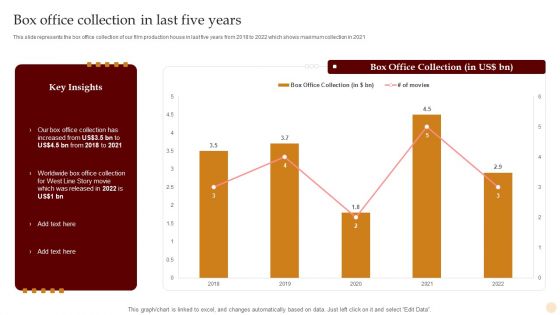
Motion Pictures Production Company Profile Box Office Collection In Last Five Years Diagrams PDF
This slide represents the box office collection of our film production house in last five years from 2018 to 2022 which shows maximum collection in 2021. Deliver and pitch your topic in the best possible manner with this Motion Pictures Production Company Profile Box Office Collection In Last Five Years Diagrams PDF. Use them to share invaluable insights on Box Office Collection, 2018 To 2022 and impress your audience. This template can be altered and modified as per your expectations. So, grab it now.
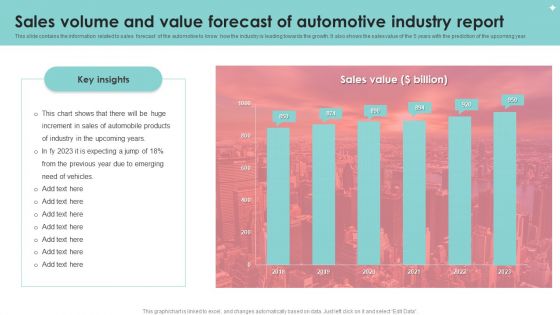
Sales Volume And Value Forecast Of Automotive Industry Report Diagrams PDF
This slide contains the information related to sales forecast of the automotive to know how the industry is leading towards the growth. It also shows the sales value of the 5 years with the prediction of the upcoming year. Showcasing this set of slides titled Sales Volume And Value Forecast Of Automotive Industry Report Diagrams PDF. The topics addressed in these templates are Sales Volume, Value Forecast, Automotive Industry Report. All the content presented in this PPT design is completely editable. Download it and make adjustments in color, background, font etc. as per your unique business setting.
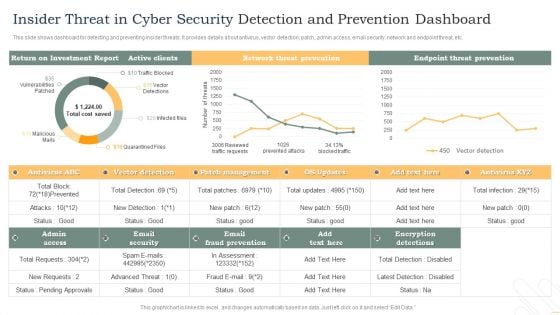
Insider Threat In Cyber Security Detection And Prevention Dashboard Diagrams PDF
This slide shows dashboard for detecting and preventing insider threats. It provides details about antivirus, vector detection, patch, admin access, email security, network and endpoint threat, etc. Pitch your topic with ease and precision using this Insider Threat In Cyber Security Detection And Prevention Dashboard Diagrams PDF. This layout presents information on Active Clients, Network Threat Prevention, Endpoint Threat Prevention. It is also available for immediate download and adjustment. So, changes can be made in the color, design, graphics or any other component to create a unique layout.
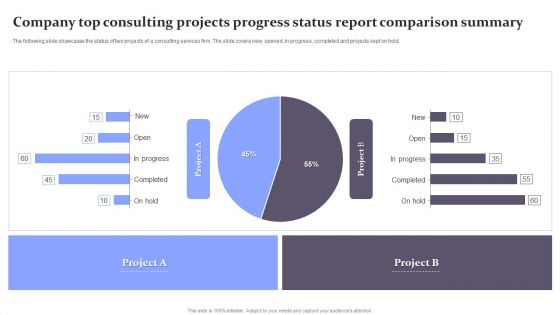
Company Top Consulting Projects Progress Status Report Comparison Summary Diagrams PDF
The following slide showcases the status of two projects of a consulting services firm. The slide covers new, opened, in progress, completed and projects kept on hold. Pitch your topic with ease and precision using this Company Top Consulting Projects Progress Status Report Comparison Summary Diagrams PDF. This layout presents information on Company Top Consulting Projects Progress, Status Report Comparison Summary. It is also available for immediate download and adjustment. So, changes can be made in the color, design, graphics or any other component to create a unique layout.
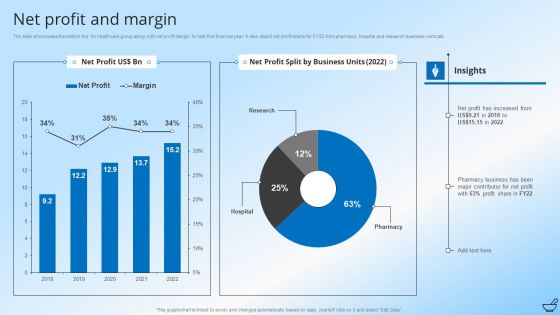
Pharmaceutical And Clinical Research Summary Net Profit And Margin Diagrams PDF
The slide showcases the bottom line for healthcare group along with net profit margin for last five financial year. It also depict net profit share for FY22 from pharmacy, hospital and research business verticals. Deliver an awe inspiring pitch with this creative Pharmaceutical And Clinical Research Summary Net Profit And Margin Diagrams PDF bundle. Topics like Pharmacy Business, Profit Share, Business Units can be discussed with this completely editable template. It is available for immediate download depending on the needs and requirements of the user.

IT Application Services Company Outline Revenue And Profit By Category Diagrams PDF
The slide highlights the historical revenue and profit for services and solutions. It also depicts revenue and profit split for services and solutions for current year along with key insights. Deliver and pitch your topic in the best possible manner with this IT Application Services Company Outline Revenue And Profit By Category Diagrams PDF. Use them to share invaluable insights on Revenue Split, Profit Split, Services and impress your audience. This template can be altered and modified as per your expectations. So, grab it now.
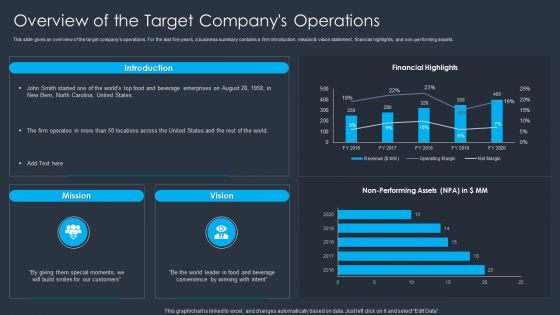
Merger And Acquisition Buying Strategy For Business Growth Overview Of The Target Companys Operations Diagrams PDF
This slide gives an overview of the target companys operations. For the last five years, a business summary contains a firm introduction, mission and vision statement, financial highlights, and non performing assets. Deliver and pitch your topic in the best possible manner with this Merger And Acquisition Buying Strategy For Business Growth Overview Of The Target Companys Operations Diagrams PDF. Use them to share invaluable insights on Customers, Financial Highlights, Enterprises and impress your audience. This template can be altered and modified as per your expectations. So, grab it now.
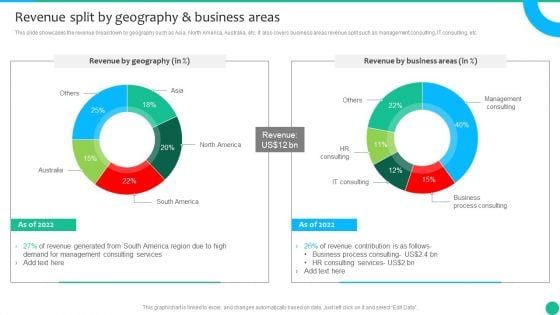
Strategic Management Consultancy Business Profile Revenue Split By Geography And Business Areas Diagrams PDF
This slide showcases the revenue breakdown by geography such as Asia, North America, Australia, etc. It also covers business areas revenue split such as management consulting, IT consulting, etc. Deliver and pitch your topic in the best possible manner with this Strategic Management Consultancy Business Profile Revenue Split By Geography And Business Areas Diagrams PDF. Use them to share invaluable insights on Demand For Management, Consulting Services, Revenue and impress your audience. This template can be altered and modified as per your expectations. So, grab it now.
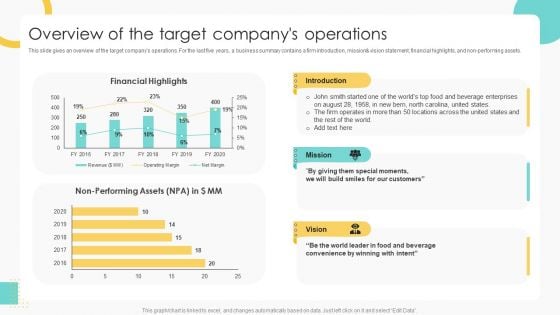
Buy Side Merger And Acquisition Pitch Book Overview Of The Target Companys Operations Diagrams PDF
This slide gives an overview of the target companys operations. For the last five years, a business summary contains a firm introduction, mission and vision statement, financial highlights, and non performing assets. Deliver and pitch your topic in the best possible manner with this Buy Side Merger And Acquisition Pitch Book Overview Of The Target Companys Operations Diagrams PDF. Use them to share invaluable insights on Financial Highlights, Enterprises, Customers and impress your audience. This template can be altered and modified as per your expectations. So, grab it now.

Performance Analysis Using Operating Revenue Business Operational Expenditure And Income Metrics Diagrams PDF
This slide illustrates performance analysis using operating revenue, operating expenditure opex and income metrics which can be referred by organizations to evaluate their inflows and outflows to make relevant decisions for increasing profitability. It includes information about operating revenue, operating expense and income before taxes. Pitch your topic with ease and precision using this Performance Analysis Using Operating Revenue Business Operational Expenditure And Income Metrics Diagrams PDF. This layout presents information on Taxes, Highest Operating, Recorded. It is also available for immediate download and adjustment. So, changes can be made in the color, design, graphics or any other component to create a unique layout.
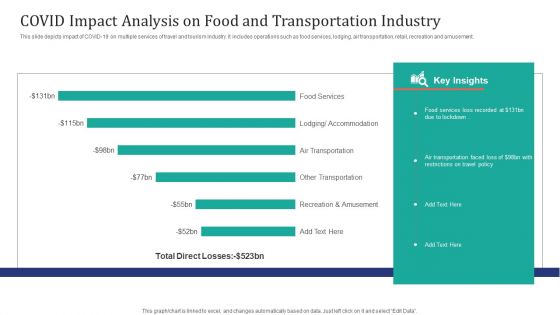
COVID Impact Analysis On Food And Transportation Industry Ppt Infographic Template Diagrams PDF
This slide depicts impact of COVID-19 on multiple services of travel and tourism industry. It includes operations such as food services, lodging, air transportation, retail, recreation and amusement. Showcasing this set of slides titled COVID Impact Analysis On Food And Transportation Industry Ppt Infographic Template Diagrams PDF. The topics addressed in these templates are Food Services, Air Transportation Faced, Restrictions Travel Policy. All the content presented in this PPT design is completely editable. Download it and make adjustments in color, background, font etc. as per your unique business setting.
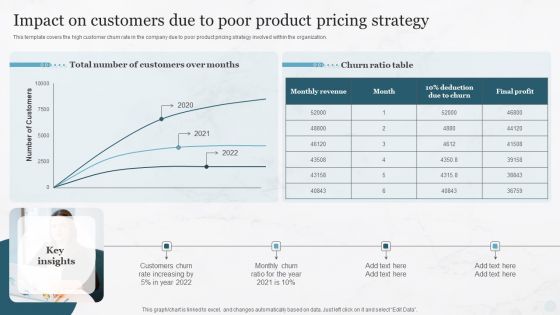
Impact On Customers Due To Poor Product Pricing Strategy Pricing Strategies For New Diagrams PDF
This template covers the high customer churn rate in the company due to poor product pricing strategy involved within the organization.Present like a pro with Impact On Customers Due To Poor Product Pricing Strategy Pricing Strategies For New Diagrams PDF Create beautiful presentations together with your team, using our easy-to-use presentation slides. Share your ideas in real-time and make changes on the fly by downloading our templates. So whether you are in the office, on the go, or in a remote location, you can stay in sync with your team and present your ideas with confidence. With Slidegeeks presentation got a whole lot easier. Grab these presentations today.
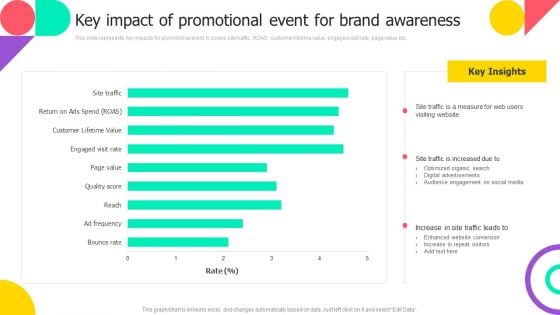
Brand Engagement Promotional Campaign Implementation Key Impact Of Promotional Event For Brand Awareness Diagrams PDF
This slide represents key impacts for promotional event. It covers site traffic, ROAS, customer lifetime value, engaged visit rate, page value etc. Find a pre designed and impeccable Brand Engagement Promotional Campaign Implementation Key Impact Of Promotional Event For Brand Awareness Diagrams PDF. The templates can ace your presentation without additional effort. You can download these easy to edit presentation templates to make your presentation stand out from others. So, what are you waiting for Download the template from Slidegeeks today and give a unique touch to your presentation.
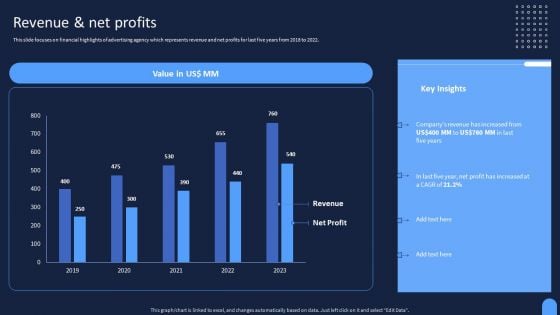
Ad And Media Agency Company Profile Revenue And Net Profits Diagrams PDF
This slide focuses on financial highlights of advertising agency which represents revenue and net profits for last five years from 2018 to 2022. Welcome to our selection of the Ad And Media Agency Company Profile Revenue And Net Profits Diagrams PDF. These are designed to help you showcase your creativity and bring your sphere to life. Planning and Innovation are essential for any business that is just starting out. This collection contains the designs that you need for your everyday presentations. All of our PowerPoints are 100 percent editable, so you can customize them to suit your needs. This multi-purpose template can be used in various situations. Grab these presentation templates today.
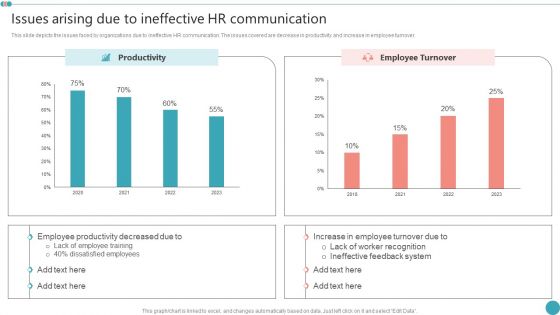
Issues Arising Due To Ineffective HR Communication Employee Engagement HR Strategy At Organization Diagrams PDF
This slide depicts the issues faced by organizations due to ineffective HR communication. The issues covered are decrease in productivity and increase in employee turnover.Want to ace your presentation in front of a live audience Our Issues Arising Due To Ineffective HR Communication Employee Engagement HR Strategy At Organization Diagrams PDF can help you do that by engaging all the users towards you.. Slidegeeks experts have put their efforts and expertise into creating these impeccable powerpoint presentations so that you can communicate your ideas clearly. Moreover, all the templates are customizable, and easy-to-edit and downloadable. Use these for both personal and commercial use.
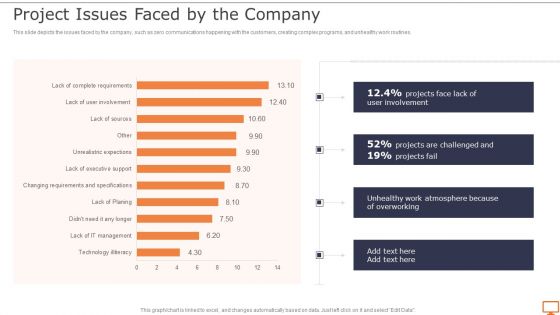
Deploying XP Practices To Enhance Operational Efficiency Project Issues Faced By The Company Diagrams PDF
This slide depicts the issues faced by the company, such as zero communications happening with the customers, creating complex programs, and unhealthy work routines.Want to ace your presentation in front of a live audience Our Deploying XP Practices To Enhance Operational Efficiency Project Issues Faced By The Company Diagrams PDF can help you do that by engaging all the users towards you.. Slidegeeks experts have put their efforts and expertise into creating these impeccable powerpoint presentations so that you can communicate your ideas clearly. Moreover, all the templates are customizable, and easy-to-edit and downloadable. Use these for both personal and commercial use.
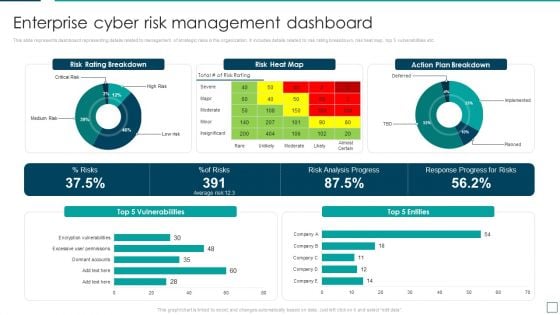
Strategic Risk Management And Mitigation Plan Enterprise Cyber Risk Management Dashboard Diagrams PDF
This slide represents dashboard representing details related to management of strategic risks in the organization. It includes details related to risk rating breakdown, risk heat map, top 5 vulnerabilities etc. From laying roadmaps to briefing everything in detail, our templates are perfect for you. You can set the stage with your presentation slides. All you have to do is download these easy to edit and customizable templates. Strategic Risk Management And Mitigation Plan Enterprise Cyber Risk Management Dashboard Diagrams PDF will help you deliver an outstanding performance that everyone would remember and praise you for. Do download this presentation today.
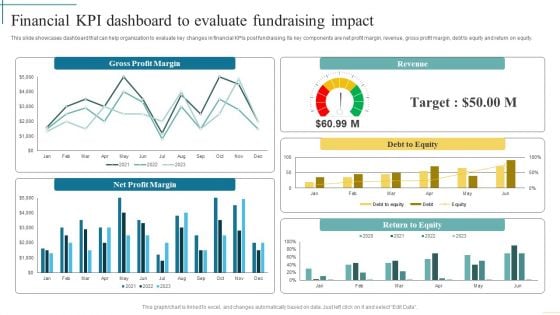
Financial Kpi Dashboard To Evaluate Fundraising Impact Developing Fundraising Techniques Diagrams PDF
This slide showcases dashboard that can help organization to evaluate key changes in financial KPIs post fundraising. Its key components are net profit margin, revenue, gross profit margin, debt to equity and return on equity. From laying roadmaps to briefing everything in detail, our templates are perfect for you. You can set the stage with your presentation slides. All you have to do is download these easy-to-edit and customizable templates. Financial Kpi Dashboard To Evaluate Fundraising Impact Developing Fundraising Techniques Diagrams PDF will help you deliver an outstanding performance that everyone would remember and praise you for. Do download this presentation today.
Process Enhancement Plan To Boost Sales Performance Website Performance Tracking And Monitoring Dashboard Diagrams PDF
The following slide showcases a dashboard to track and measure website performance. It includes key elements such as visits, average session duration, bounce rate, page views, goal conversion, visits by week, traffic sources, top channels by conversions, etc. From laying roadmaps to briefing everything in detail, our templates are perfect for you. You can set the stage with your presentation slides. All you have to do is download these easy to edit and customizable templates. Process Enhancement Plan To Boost Sales Performance Website Performance Tracking And Monitoring Dashboard Diagrams PDF will help you deliver an outstanding performance that everyone would remember and praise you for. Do download this presentation today.
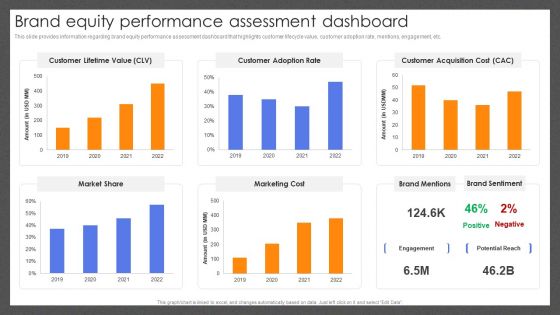
Guide For Effective Brand Brand Equity Performance Assessment Dashboard Diagrams PDF
This slide provides information regarding brand equity performance assessment dashboard that highlights customer lifecycle value, customer adoption rate, mentions, engagement, etc. Present like a pro with Guide For Effective Brand Brand Equity Performance Assessment Dashboard Diagrams PDF Create beautiful presentations together with your team, using our easy-to-use presentation slides. Share your ideas in real-time and make changes on the fly by downloading our templates. So whether youre in the office, on the go, or in a remote location, you can stay in sync with your team and present your ideas with confidence. With Slidegeeks presentation got a whole lot easier. Grab these presentations today.
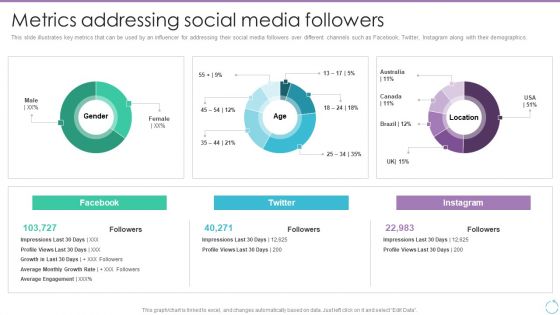
Personal Branding Plan For Executives Metrics Addressing Social Media Followers Diagrams PDF
This slide illustrates key metrics that can be used by an influencer for addressing their social media followers over different channels such as Facebook, Twitter, Instagram along with their demographics. The Personal Branding Plan For Executives Metrics Addressing Social Media Followers Diagrams PDF is a compilation of the most recent design trends as a series of slides. It is suitable for any subject or industry presentation, containing attractive visuals and photo spots for businesses to clearly express their messages. This template contains a variety of slides for the user to input data, such as structures to contrast two elements, bullet points, and slides for written information. Slidegeeks is prepared to create an impression.
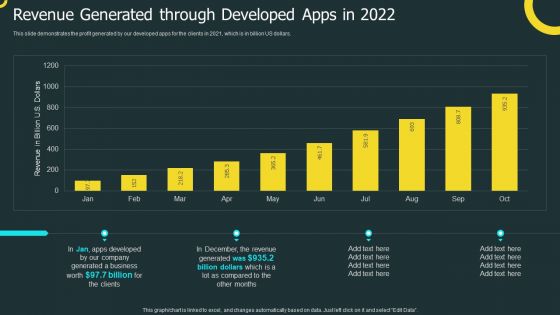
IOS Application Development Revenue Generated Through Developed Apps In 2022 Diagrams PDF
This slide demonstrates the profit generated by our developed apps for the clients in 2021, which is in billion US dollars. Slidegeeks has constructed IOS Application Development Revenue Generated Through Developed Apps In 2022 Diagrams PDF after conducting extensive research and examination. These presentation templates are constantly being generated and modified based on user preferences and critiques from editors. Here, you will find the most attractive templates for a range of purposes while taking into account ratings and remarks from users regarding the content. This is an excellent jumping off point to explore our content and will give new users an insight into our top notch PowerPoint Templates.
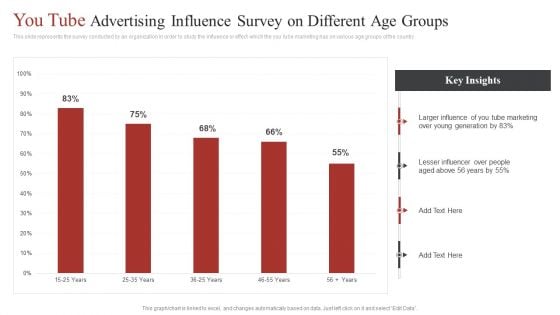
You Tube Advertising Influence Survey On Different Age Groups Ppt Diagram Ppt PDF
This slide represents the survey conducted by an organization in order to study the influence or effect which the you tube marketing has on various age groups of the country. Pitch your topic with ease and precision using this You Tube Advertising Influence Survey On Different Age Groups Ppt Diagram Ppt PDF. This layout presents information on Larger Influence, You Tube Marketing, Young Generation. It is also available for immediate download and adjustment. So, changes can be made in the color, design, graphics or any other component to create a unique layout.
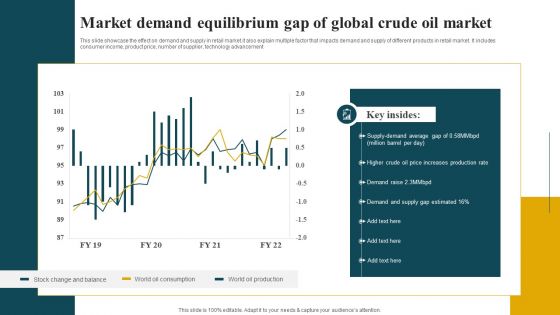
Market Demand Equilibrium Gap Of Global Crude Oil Market Diagrams PDF
This slide showcase the effect on demand and supply in retail market.it also explain multiple factor that impacts demand and supply of different products in retail market. It includes consumer income, product price, number of supplier, technology advancement. Pitch your topic with ease and precision using this Market Demand Equilibrium Gap Of Global Crude Oil Market Diagrams PDF. This layout presents information on Demand And Supply, Production Rate, Average. It is also available for immediate download and adjustment. So, changes can be made in the color, design, graphics or any other component to create a unique layout.

Customer Support Center Call Center Action Plan Dashboard Highlighting Agent Diagrams PDF
This slide showcases dashboard for call center action plan which includes total calls, average answer speed, abandon rate, average calls per minute with agent performance and overall customer satisfaction score. Want to ace your presentation in front of a live audience Our Customer Support Center Call Center Action Plan Dashboard Highlighting Agent Diagrams PDF can help you do that by engaging all the users towards you.. Slidegeeks experts have put their efforts and expertise into creating these impeccable powerpoint presentations so that you can communicate your ideas clearly. Moreover, all the templates are customizable, and easy-to-edit and downloadable. Use these for both personal and commercial use.

Comprehensive Market Research Guide Growth Opportunities In Market Research Industry Diagrams PDF
The following slide outlines market size of global market research industry. Information covered in this slide is related to projected revenue from 2022 to 2030 and compound annual growth rate CAGR. Make sure to capture your audiences attention in your business displays with our gratis customizable Comprehensive Market Research Guide Growth Opportunities In Market Research Industry Diagrams PDF. These are great for business strategies, office conferences, capital raising or task suggestions. If you desire to acquire more customers for your tech business and ensure they stay satisfied, create your own sales presentation with these plain slides.
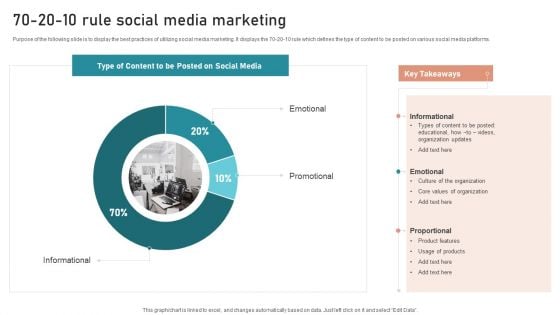
B2B And B2C Startups Marketing Mix Strategies 70 20 10 Rule Social Media Marketing Diagrams PDF
Purpose of the following slide is to display the best practices of utilizing social media marketing. It displays the 70 20 10 rule which defines the type of content to be posted on various social media platforms. Find a pre designed and impeccable B2B And B2C Startups Marketing Mix Strategies 70 20 10 Rule Social Media Marketing Diagrams PDF. The templates can ace your presentation without additional effort. You can download these easy to edit presentation templates to make your presentation stand out from others. So, what are you waiting for Download the template from Slidegeeks today and give a unique touch to your presentation.
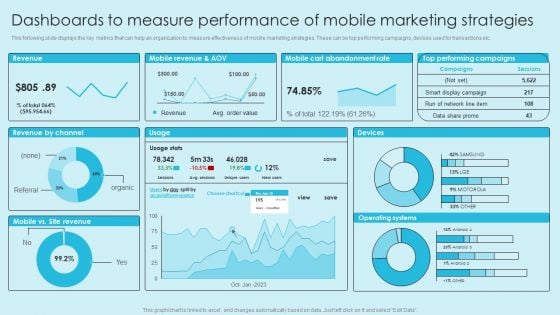
Online Marketing Techniques For Acquiring Clients Dashboards To Measure Performance Of Mobile Marketing Diagrams PDF
This following slide displays the key metrics that can help an organization to measure effectiveness of mobile marketing strategies. These can be top performing campaigns, devises used for transactions etc. Find a pre designed and impeccable Online Marketing Techniques For Acquiring Clients Dashboards To Measure Performance Of Mobile Marketing Diagrams PDF. The templates can ace your presentation without additional effort. You can download these easy to edit presentation templates to make your presentation stand out from others. So, what are you waiting for. Download the template from Slidegeeks today and give a unique touch to your presentation.
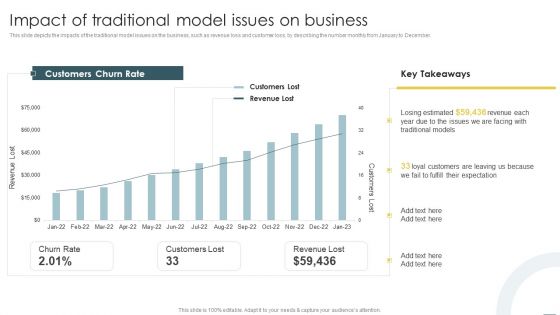
Crystal Methods In Agile Framework Impact Of Traditional Model Issues On Business Diagrams PDF
This slide depicts the impacts of the traditional model issues on the business, such as revenue loss and customer loss, by describing the number monthly from January to December. Take your projects to the next level with our ultimate collection of Crystal Methods In Agile Framework Impact Of Traditional Model Issues On Business Diagrams PDF. Slidegeeks has designed a range of layouts that are perfect for representing task or activity duration, keeping track of all your deadlines at a glance. Tailor these designs to your exact needs and give them a truly corporate look with your own brand colors they will make your projects stand out from the rest.

Expectations After Expanding Into Global Markets Ppt PowerPoint Presentation Diagram Lists PDF
This slide showcase graph that can help organization to estimate the impact on organizational sales after global expansion. It showcases sales in thousand dollars and forecast for a period of two years.Want to ace your presentation in front of a live audience Our Expectations After Expanding Into Global Markets Ppt PowerPoint Presentation Diagram Lists PDF can help you do that by engaging all the users towards you.. Slidegeeks experts have put their efforts and expertise into creating these impeccable powerpoint presentations so that you can communicate your ideas clearly. Moreover, all the templates are customizable, and easy-to-edit and downloadable. Use these for both personal and commercial use.
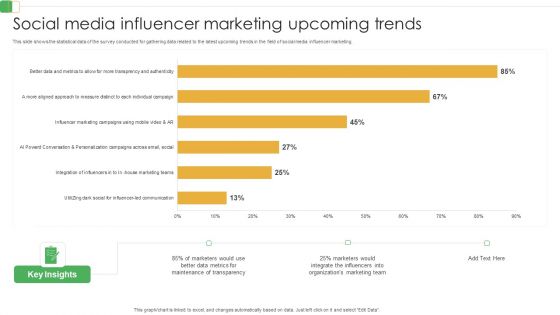
Social Media Influencer Marketing Upcoming Trends Ppt PowerPoint Presentation Diagram Templates PDF
This slide shows the statistical data of the survey conducted for gathering data related to the latest upcoming trends in the field of social media influencer marketing.Showcasing this set of slides titled Social Media Influencer Marketing Upcoming Trends Ppt PowerPoint Presentation Diagram Templates PDF. The topics addressed in these templates are Maintenance Transparency, Better Data Metrics, Integrate Influencers. All the content presented in this PPT design is completely editable. Download it and make adjustments in color, background, font etc. as per your unique business setting.
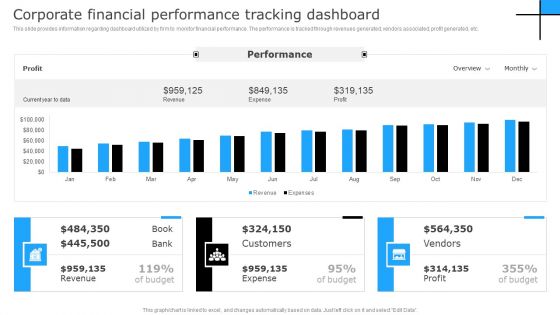
Successful Corporate Technique Enhancing Firms Performance Corporate Financial Performance Diagrams PDF
This slide provides information regarding dashboard utilized by firm to monitor financial performance. The performance is tracked through revenues generated, vendors associated, profit generated, etc. Find a pre designed and impeccable Successful Corporate Technique Enhancing Firms Performance Corporate Financial Performance Diagrams PDF. The templates can ace your presentation without additional effort. You can download these easy to edit presentation templates to make your presentation stand out from others. So, what are you waiting for Download the template from Slidegeeks today and give a unique touch to your presentation.
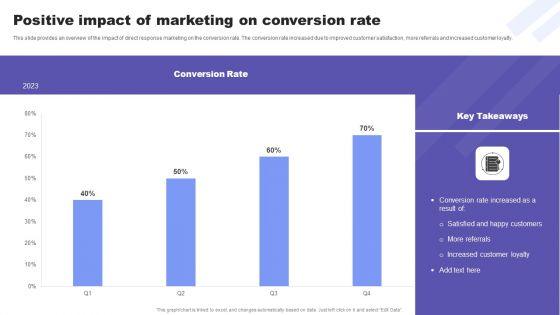
Direct Response Marketing Guide Ultimate Success Positive Impact Of Marketing On Diagrams PDF
This slide provides an overview of the impact of direct response marketing on the conversion rate. The conversion rate increased due to improved customer satisfaction, more referrals and increased customer loyalty. Make sure to capture your audiences attention in your business displays with our gratis customizable Direct Response Marketing Guide Ultimate Success Positive Impact Of Marketing On Diagrams PDF. These are great for business strategies, office conferences, capital raising or task suggestions. If you desire to acquire more customers for your tech business and ensure they stay satisfied, create your own sales presentation with these plain slides.
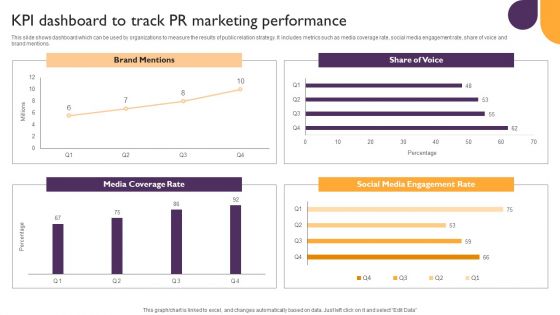
Public Relations Guide To Enhance Brand Credibility KPI Dashboard To Track PR Marketing Performance Diagrams PDF
This slide shows dashboard which can be used by organizations to measure the results of public relation strategy. It includes metrics such as media coverage rate, social media engagement rate, share of voice and brand mentions. Make sure to capture your audiences attention in your business displays with our gratis customizable Public Relations Guide To Enhance Brand Credibility KPI Dashboard To Track PR Marketing Performance Diagrams PDF. These are great for business strategies, office conferences, capital raising or task suggestions. If you desire to acquire more customers for your tech business and ensure they stay satisfied, create your own sales presentation with these plain slides.

Identifying And Increasing Brand Awareness Current Issues Faced By Company Diagrams PDF
This slide covers the current issues faced by company such as rise in bounce rate and low conversion rate due to low-quality content, slow loading time, ad heavy images, lack of sufficient information, poor website performance, etc. Want to ace your presentation in front of a live audience Our Identifying And Increasing Brand Awareness Current Issues Faced By Company Diagrams PDF can help you do that by engaging all the users towards you.. Slidegeeks experts have put their efforts and expertise into creating these impeccable powerpoint presentations so that you can communicate your ideas clearly. Moreover, all the templates are customizable, and easy-to-edit and downloadable. Use these for both personal and commercial use.
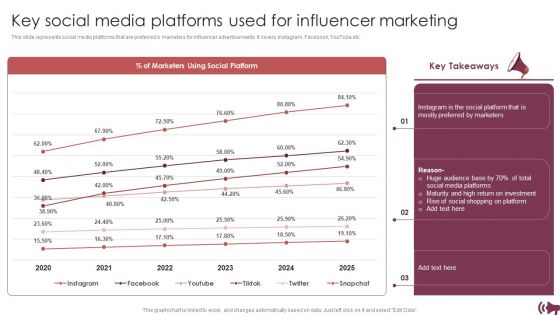
Guide Digital Advertising Optimize Lead Targeting Key Social Media Platforms Used For Influencer Marketing Diagrams PDF
This slide represents social media platforms that are preferred b marketers for influencer advertisements. It covers Instagram, Facebook, YouTube etc. Find a pre designed and impeccable Guide Digital Advertising Optimize Lead Targeting Key Social Media Platforms Used For Influencer Marketing Diagrams PDF. The templates can ace your presentation without additional effort. You can download these easy to edit presentation templates to make your presentation stand out from others. So, what are you waiting for Download the template from Slidegeeks today and give a unique touch to your presentation.
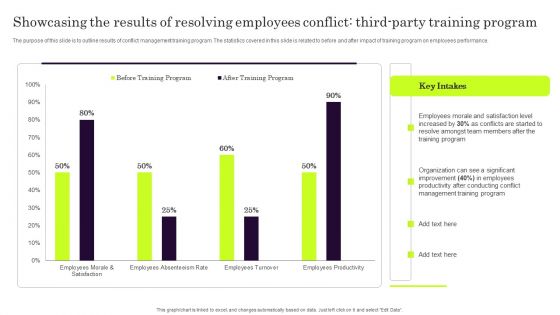
Showcasing The Results Of Resolving Employees Conflict Third Party Training Program Diagrams PDF
The purpose of this slide is to outline results of conflict management training program. The statistics covered in this slide is related to before and after impact of training program on employees performance. From laying roadmaps to briefing everything in detail, our templates are perfect for you. You can set the stage with your presentation slides. All you have to do is download these easy to edit and customizable templates. Showcasing The Results Of Resolving Employees Conflict Third Party Training Program Diagrams PDF will help you deliver an outstanding performance that everyone would remember and praise you for. Do download this presentation today.
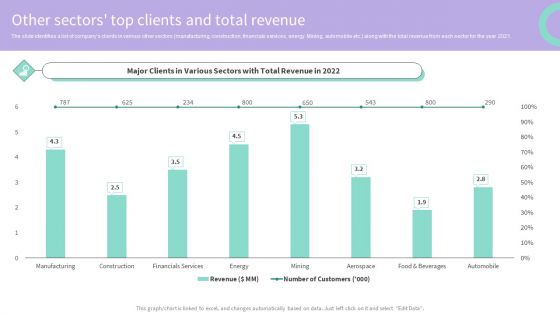
Buy Side Merger And Acquisition Advisory Other Sectors Top Clients And Total Revenue Diagrams PDF
The slide identifies a list of companys clients in various other sectors manufacturing, construction, financials services, energy. Mining, automobile etc. along with the total revenue from each sector for the year 2021. Take your projects to the next level with our ultimate collection of Buy Side Merger And Acquisition Advisory Other Sectors Top Clients And Total Revenue Diagrams PDF. Slidegeeks has designed a range of layouts that are perfect for representing task or activity duration, keeping track of all your deadlines at a glance. Tailor these designs to your exact needs and give them a truly corporate look with your own brand colors they will make your projects stand out from the rest.
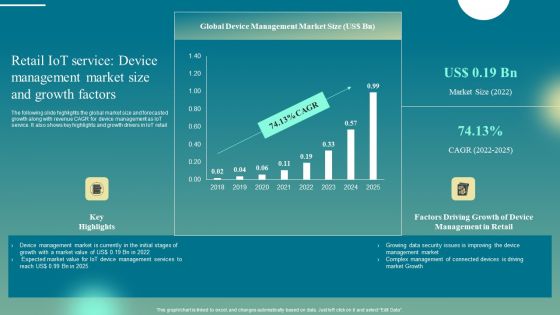
Retail Iot Service Device Management Market Size And Growth Factors Diagrams PDF
The following slide highlights the global market size and forecasted growth along with revenue CAGR for device management as IoT service. It also shows key highlights and growth drivers in IoT retail. If your project calls for a presentation, then Slidegeeks is your go-to partner because we have professionally designed, easy-to-edit templates that are perfect for any presentation. After downloading, you can easily edit Retail Iot Service Device Management Market Size And Growth Factors Diagrams PDF and make the changes accordingly. You can rearrange slides or fill them with different images. Check out all the handy templates
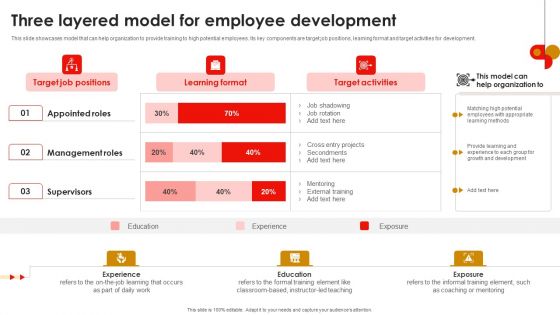
Strategic Talent Development Three Layered Model For Employee Development Diagrams PDF
This slide showcases model that can help organization to provide training to high potential employees. Its key components are target job positions, learning format and target activities for development. From laying roadmaps to briefing everything in detail, our templates are perfect for you. You can set the stage with your presentation slides. All you have to do is download these easy-to-edit and customizable templates. Strategic Talent Development Three Layered Model For Employee Development Diagrams PDF will help you deliver an outstanding performance that everyone would remember and praise you for. Do download this presentation today.
Facebook Advertising Campaign Performance Tracking Report Ppt PowerPoint Presentation Diagram Images PDF
This slide represents the dashboard to track and monitor the performance and effectiveness of Facebook advertising campaign. It includes details related to KPIs such as Facebook Ads amount spent, FB ads websites conversion etc. Make sure to capture your audiences attention in your business displays with our gratis customizable Facebook Advertising Campaign Performance Tracking Report Ppt PowerPoint Presentation Diagram Images PDF. These are great for business strategies, office conferences, capital raising or task suggestions. If you desire to acquire more customers for your tech business and ensure they stay satisfied, create your own sales presentation with these plain slides.
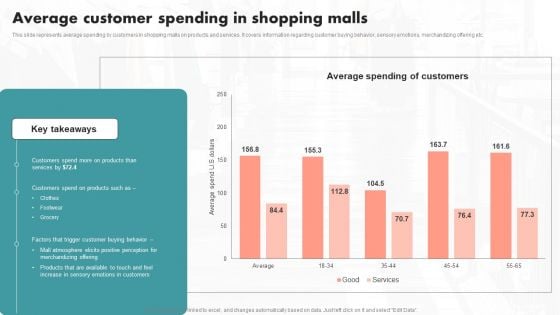
Average Customer Spending In Shopping Malls Ppt PowerPoint Presentation Diagram Images PDF
This slide represents average spending by customers in shopping malls on products and services. It covers information regarding customer buying behavior, sensory emotions, merchandizing offering etc. qIf your project calls for a presentation, then Slidegeeks is your go to partner because we have professionally designed, easy to edit templates that are perfect for any presentation. After downloading, you can easily edit Average Customer Spending In Shopping Malls Ppt PowerPoint Presentation Diagram Images PDF and make the changes accordingly. You can rearrange slides or fill them with different images. Check out all the handy templates
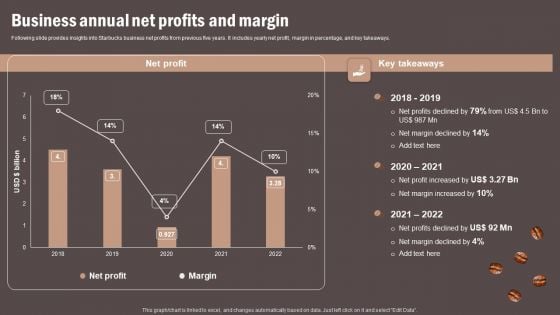
Coffee Cafe Company Profile Business Annual Net Profits And Margin Diagrams PDF
Following slide provides insights into Starbucks business net profits from previous five years. It includes yearly net profit, margin in percentage, and key takeaways. Want to ace your presentation in front of a live audience Our Coffee Cafe Company Profile Business Annual Net Profits And Margin Diagrams PDF can help you do that by engaging all the users towards you. Slidegeeks experts have put their efforts and expertise into creating these impeccable powerpoint presentations so that you can communicate your ideas clearly. Moreover, all the templates are customizable, and easy to edit and downloadable. Use these for both personal and commercial use.
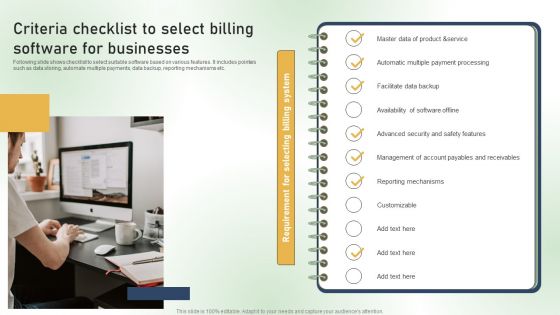
Criteria Checklist To Select Billing Software For Businesses Ppt PowerPoint Presentation Diagram Templates PDF
Following slide shows checklist to select suitable software based on various features. It includes pointers such as data storing, automate multiple payments, data backup, reporting mechanisms etc. Make sure to capture your audiences attention in your business displays with our gratis customizable Criteria Checklist To Select Billing Software For Businesses Ppt PowerPoint Presentation Diagram Templates PDF. These are great for business strategies, office conferences, capital raising or task suggestions. If you desire to acquire more customers for your tech business and ensure they stay satisfied, create your own sales presentation with these plain slides.
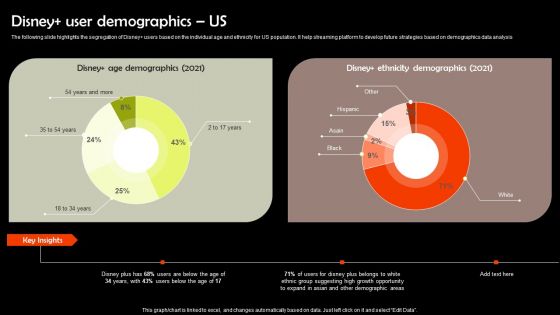
Digital Media Streaming Platform Company Profile Disney User Demographics US Diagrams PDF
The following slide highlights the segregation of Disney users based on the individual age and ethnicity for US population. It help streaming platform to develop future strategies based on demographics data analysis Take your projects to the next level with our ultimate collection of Digital Media Streaming Platform Company Profile Disney User Demographics US Diagrams PDF. Slidegeeks has designed a range of layouts that are perfect for representing task or activity duration, keeping track of all your deadlines at a glance. Tailor these designs to your exact needs and give them a truly corporate look with your own brand colors they will make your projects stand out from the rest.
Providing Efficient Client Services Kpi Dashboard For Tracking Customer Retention Diagrams PDF
This slide covers the dashboard for analyzing customer loyalty with metrics such as NPS, loyal customer rate, premium users, CLV, customer churn, revenue churn, net retention, MRR growth, etc. Take your projects to the next level with our ultimate collection of Providing Efficient Client Services Kpi Dashboard For Tracking Customer Retention Diagrams PDF. Slidegeeks has designed a range of layouts that are perfect for representing task or activity duration, keeping track of all your deadlines at a glance. Tailor these designs to your exact needs and give them a truly corporate look with your own brand colors they will make your projects stand out from the rest.
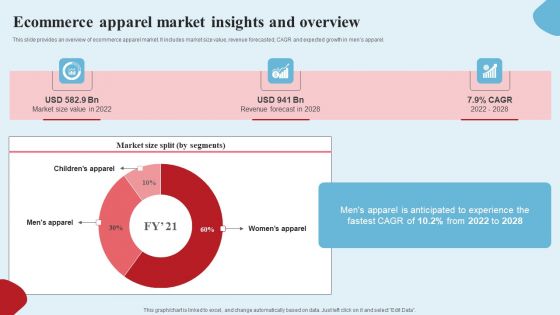
Apparel Ecommerce Business Strategy Ecommerce Apparel Market Insights And Overview Diagrams PDF
This slide provides an overview of ecommerce apparel market. It includes market size value, revenue forecasted, CAGR and expected growth in mens apparel. Want to ace your presentation in front of a live audience Our Apparel Ecommerce Business Strategy Ecommerce Apparel Market Insights And Overview Diagrams PDF can help you do that by engaging all the users towards you. Slidegeeks experts have put their efforts and expertise into creating these impeccable powerpoint presentations so that you can communicate your ideas clearly. Moreover, all the templates are customizable, and easy to edit and downloadable. Use these for both personal and commercial use.
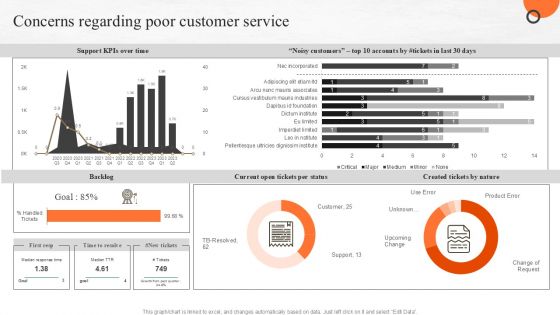
Concerns Regarding Poor Customer Service Ppt PowerPoint Presentation Diagram Images PDF
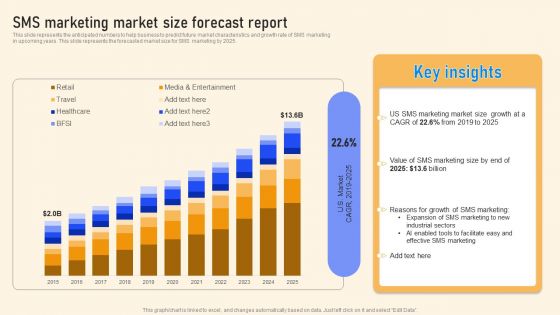
SMS Marketing Market Size Forecast Report Ppt PowerPoint Presentation File Diagrams PDF
This slide represents the anticipated numbers to help business to predict future market characteristics and growth rate of SMS marketing in upcoming years. This slide represents the forecasted market size for SMS marketing by 2025. From laying roadmaps to briefing everything in detail, our templates are perfect for you. You can set the stage with your presentation slides. All you have to do is download these easy to edit and customizable templates. SMS Marketing Market Size Forecast Report Ppt PowerPoint Presentation File Diagrams PDF will help you deliver an outstanding performance that everyone would remember and praise you for. Do download this presentation today.
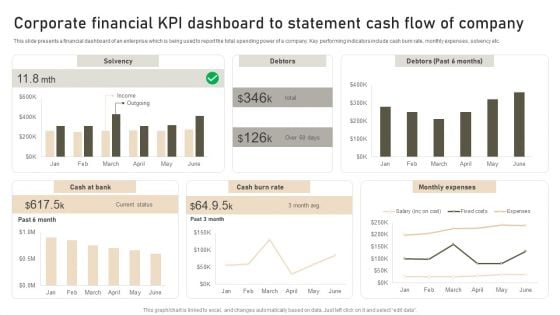
Corporate Financial KPI Dashboard To Statement Cash Flow Of Company Diagrams PDF
This slide presents a financial dashboard of an enterprise which is being used to report the total spending power of a company. Key performing indicators include cash burn rate, monthly expenses, solvency etc. Showcasing this set of slides titled Corporate Financial KPI Dashboard To Statement Cash Flow Of Company Diagrams PDF. The topics addressed in these templates are Solvency, Debtors, Monthly Expenses. All the content presented in this PPT design is completely editable. Download it and make adjustments in color, background, font etc. as per your unique business setting.
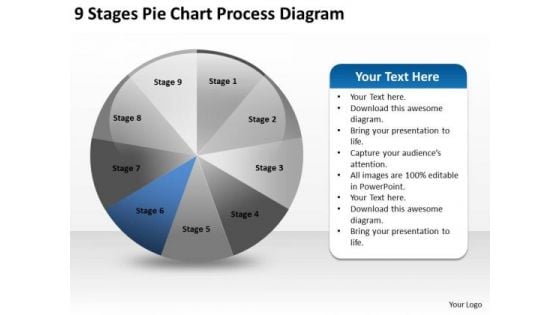
9 Stages Pie Chart Process Diagram Business Plan Online PowerPoint Slides
We present our 9 stages pie chart process diagram business plan online PowerPoint Slides.Use our Marketing PowerPoint Templates because It can be used to Set your controls for the heart of the sun. Our PowerPoint Templates and Slides will be the propellant to get you there. Use our Finance PowerPoint Templates because Our PowerPoint Templates and Slides are specially created by a professional team with vast experience. They diligently strive to come up with the right vehicle for your brilliant Ideas. Present our Arrows PowerPoint Templates because Our PowerPoint Templates and Slides are innately eco-friendly. Their high recall value negate the need for paper handouts. Present our Circle Charts PowerPoint Templates because Our PowerPoint Templates and Slides are a sure bet. Gauranteed to win against all odds. Present our Shapes PowerPoint Templates because Our PowerPoint Templates and Slides will let you meet your Deadlines.Use these PowerPoint slides for presentations relating to Diagram, business, chart, market, website, network, statistics, model, document, junction, plan, vector, presentation, template, circle, brochure, data, stock, process, marketing, management, graph, wheel, box, pie, options, catalog, direction, design, company, navigation, financial, structure, multiple, button, goals, results. The prominent colors used in the PowerPoint template are Blue, Gray, Black. Our 9 Stages Pie Chart Process Diagram Business Plan Online PowerPoint Slides can be exceedingly captivating. Bewitch your audience with your thoughts.
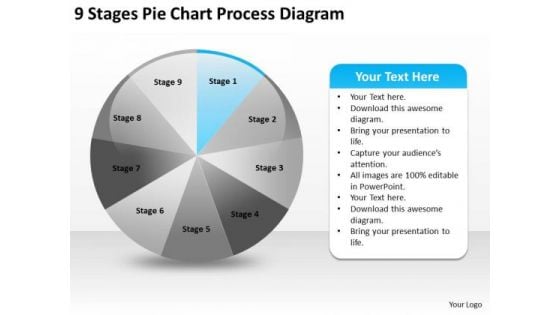
9 Stages Pie Chart Process Diagram Example Executiv Business Plan PowerPoint Slides
We present our 9 stages pie chart process diagram example executiv business plan PowerPoint Slides.Download and present our Marketing PowerPoint Templates because They will Put the wind in your sails. Skim smoothly over the choppy waters of the market. Use our Finance PowerPoint Templates because Our PowerPoint Templates and Slides help you pinpoint your timelines. Highlight the reasons for your deadlines with their use. Use our Arrows PowerPoint Templates because You have the co-ordinates for your destination of success. Let our PowerPoint Templates and Slides map out your journey. Download our Circle Charts PowerPoint Templates because Our PowerPoint Templates and Slides will bullet point your ideas. See them fall into place one by one. Present our Shapes PowerPoint Templates because It will Strengthen your hand with your thoughts. They have all the aces you need to win the day.Use these PowerPoint slides for presentations relating to Diagram, business, chart, market, website, network, statistics, model, document, junction, plan, vector, presentation, template, circle, brochure, data, stock, process, marketing, management, graph, wheel, box, pie, options, catalog, direction, design, company, navigation, financial, structure, multiple, button, goals, results. The prominent colors used in the PowerPoint template are Blue, Gray, Black. Deal with matters in an equitable way. Reach a settlement with the help of our 9 Stages Pie Chart Process Diagram Example Executiv Business Plan PowerPoint Slides.
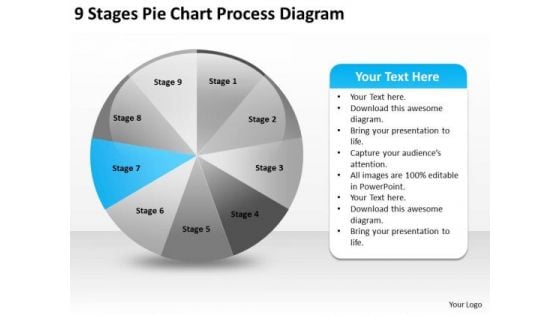
9 Stages Pie Chart Process Diagram Examples Of Business Plan PowerPoint Slides
We present our 9 stages pie chart process diagram examples of business plan PowerPoint Slides.Present our Marketing PowerPoint Templates because You can Raise a toast with our PowerPoint Templates and Slides. Spread good cheer amongst your audience. Present our Finance PowerPoint Templates because Our PowerPoint Templates and Slides are created with admirable insight. Use them and give your group a sense of your logical mind. Download and present our Arrows PowerPoint Templates because They will bring a lot to the table. Their alluring flavours will make your audience salivate. Download and present our Circle Charts PowerPoint Templates because Our PowerPoint Templates and Slides will let your team Walk through your plans. See their energy levels rise as you show them the way. Download our Shapes PowerPoint Templates because Timeline crunches are a fact of life. Meet all deadlines using our PowerPoint Templates and Slides.Use these PowerPoint slides for presentations relating to Diagram, business, chart, market, website, network, statistics, model, document, junction, plan, vector, presentation, template, circle, brochure, data, stock, process, marketing, management, graph, wheel, box, pie, options, catalog, direction, design, company, navigation, financial, structure, multiple, button, goals, results. The prominent colors used in the PowerPoint template are Blue, Gray, Black. Give the right exposure to your ideas. Our 9 Stages Pie Chart Process Diagram Examples Of Business Plan PowerPoint Slides will enhance their clarity.
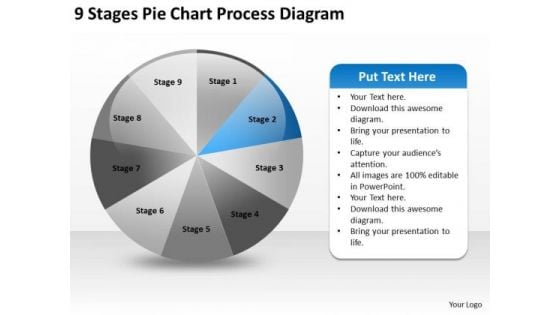
9 Stages Pie Chart Process Diagram Make Business Plan PowerPoint Slides
We present our 9 stages pie chart process diagram make business plan PowerPoint Slides.Present our Marketing PowerPoint Templates because Our PowerPoint Templates and Slides will generate and maintain the level of interest you desire. They will create the impression you want to imprint on your audience. Present our Finance PowerPoint Templates because Our PowerPoint Templates and Slides are created by a hardworking bunch of busybees. Always flitting around with solutions gauranteed to please. Use our Arrows PowerPoint Templates because You can Be the puppeteer with our PowerPoint Templates and Slides as your strings. Lead your team through the steps of your script. Download and present our Circle Charts PowerPoint Templates because Our PowerPoint Templates and Slides will provide weight to your words. They will bring out the depth of your thought process. Download and present our Shapes PowerPoint Templates because Our PowerPoint Templates and Slides has conjured up a web of all you need with the help of our great team. Use them to string together your glistening ideas.Use these PowerPoint slides for presentations relating to Diagram, business, chart, market, website, network, statistics, model, document, junction, plan, vector, presentation, template, circle, brochure, data, stock, process, marketing, management, graph, wheel, box, pie, options, catalog, direction, design, company, navigation, financial, structure, multiple, button, goals, results. The prominent colors used in the PowerPoint template are Blue, Gray, Black. Exult in the comfort of our 9 Stages Pie Chart Process Diagram Make Business Plan PowerPoint Slides. Experience the convenience they deliver.
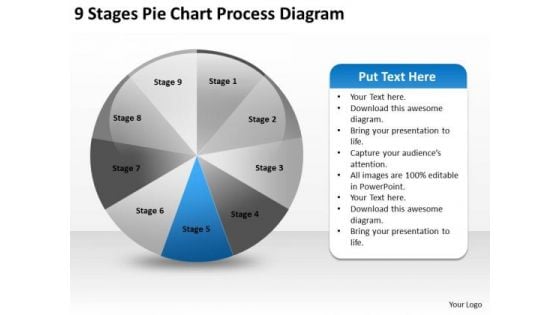
9 Stages Pie Chart Process Diagram Ppt Business Development Plan PowerPoint Slides
We present our 9 stages pie chart process diagram ppt business development plan PowerPoint Slides.Download our Marketing PowerPoint Templates because you should Experience excellence with our PowerPoint Templates and Slides. They will take your breath away. Download and present our Finance PowerPoint Templates because You can Create a matrix with our PowerPoint Templates and Slides. Feel the strength of your ideas click into place. Present our Arrows PowerPoint Templates because It can Bubble and burst with your ideas. Present our Circle Charts PowerPoint Templates because Our PowerPoint Templates and Slides will Embellish your thoughts. They will help you illustrate the brilliance of your ideas. Download our Shapes PowerPoint Templates because It can Bubble and burst with your ideas.Use these PowerPoint slides for presentations relating to Diagram, business, chart, market, website, network, statistics, model, document, junction, plan, vector, presentation, template, circle, brochure, data, stock, process, marketing, management, graph, wheel, box, pie, options, catalog, direction, design, company, navigation, financial, structure, multiple, button, goals, results. The prominent colors used in the PowerPoint template are Blue, Gray, Black. There is nothing far fetched about our 9 Stages Pie Chart Process Diagram Ppt Business Development Plan PowerPoint Slides. Every aspect is correct and achievable.
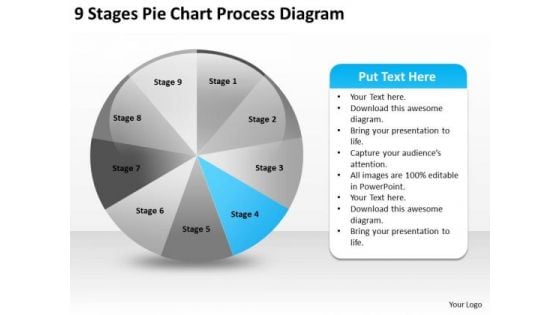
9 Stages Pie Chart Process Diagram Ppt Formulating Business Plan PowerPoint Templates
We present our 9 stages pie chart process diagram ppt formulating business plan PowerPoint templates.Download our Marketing PowerPoint Templates because you can Set pulses racing with our PowerPoint Templates and Slides. They will raise the expectations of your team. Download and present our Finance PowerPoint Templates because Our PowerPoint Templates and Slides are a sure bet. Gauranteed to win against all odds. Present our Arrows PowerPoint Templates because It is Aesthetically crafted by artistic young minds. Our PowerPoint Templates and Slides are designed to display your dexterity. Download our Circle Charts PowerPoint Templates because you should once Tap the ingenuity of our PowerPoint Templates and Slides. They are programmed to succeed. Download our Shapes PowerPoint Templates because You can Channelise the thoughts of your team with our PowerPoint Templates and Slides. Urge them to focus on the goals you have set.Use these PowerPoint slides for presentations relating to Diagram, business, chart, market, website, network, statistics, model, document, junction, plan, vector, presentation, template, circle, brochure, data, stock, process, marketing, management, graph, wheel, box, pie, options, catalog, direction, design, company, navigation, financial, structure, multiple, button, goals, results. The prominent colors used in the PowerPoint template are Blue, Gray, Black. Champion your favourite cause with our 9 Stages Pie Chart Process Diagram Ppt Formulating Business Plan PowerPoint Templates. They give your argument added depth.
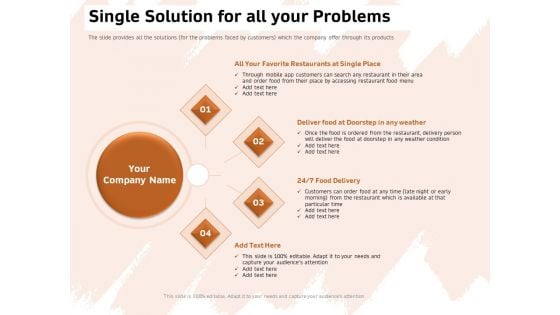
Investor Deck For Capital Generation From Substitute Funding Options Single Solution For All Your Problems Diagrams PDF
Presenting this set of slides with name investor deck for capital generation from substitute funding options single solution for all your problems diagrams pdf. This is a four stage process. The stages in this process are food delivery, delivery charges, favorite restaurants at single place. This is a completely editable PowerPoint presentation and is available for immediate download. Download now and impress your audience.
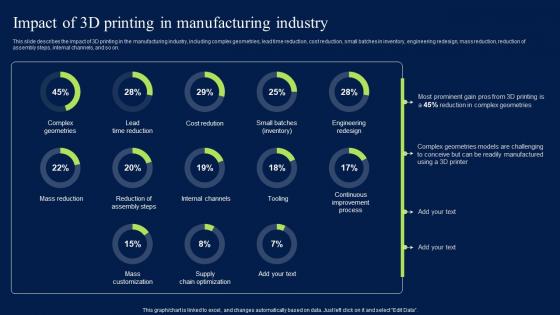
Impact Of 3D Printing In Manufacturing Industry Formats PDF
This slide describes the impact of 3D printing in the manufacturing industry, including complex geometries, lead time reduction, cost reduction, small batches in inventory, engineering redesign, mass reduction, reduction of assembly steps, internal channels, and so on. Create an editable Impact Of 3D Printing In Manufacturing Industry Formats PDF that communicates your idea and engages your audience. Whether you are presenting a business or an educational presentation, pre-designed presentation templates help save time. Impact Of 3D Printing In Manufacturing Industry Formats PDF is highly customizable and very easy to edit, covering many different styles from creative to business presentations. Slidegeeks has creative team members who have crafted amazing templates. So, go and get them without any delay. This slide describes the impact of 3D printing in the manufacturing industry, including complex geometries, lead time reduction, cost reduction, small batches in inventory, engineering redesign, mass reduction, reduction of assembly steps, internal channels, and so on.
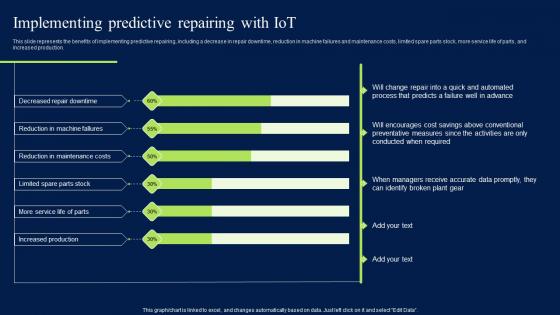
Implementing Predictive Repairing With Iot Artificial Intelligence Impact Graphics PDF
This slide represents the benefits of implementing predictive repairing, including a decrease in repair downtime, reduction in machine failures and maintenance costs, limited spare parts stock, more service life of parts, and increased production. There are so many reasons you need a Implementing Predictive Repairing With Iot Artificial Intelligence Impact Graphics PDF. The first reason is you can not spend time making everything from scratch, Thus, Slidegeeks has made presentation templates for you too. You can easily download these templates from our website easily. This slide represents the benefits of implementing predictive repairing, including a decrease in repair downtime, reduction in machine failures and maintenance costs, limited spare parts stock, more service life of parts, and increased production.
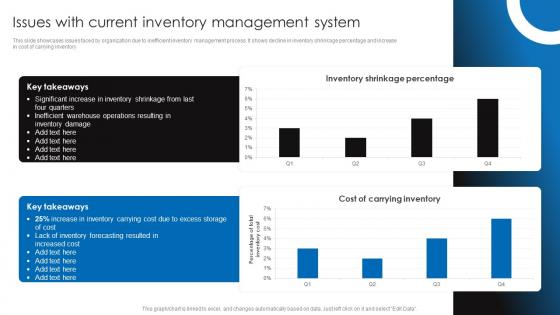
Issues With Current Inventory Management Retail Stock Administration Strategies Microsoft Pdf
This slide showcases issues faced by organization due to inefficient inventory management process. It shows decline in inventory shrinkage percentage and increase in cost of carrying inventory.Here you can discover an assortment of the finest PowerPoint and Google Slides templates. With these templates, you can create presentations for a variety of purposes while simultaneously providing your audience with an eye-catching visual experience. Download Issues With Current Inventory Management Retail Stock Administration Strategies Microsoft Pdf to deliver an impeccable presentation. These templates will make your job of preparing presentations much quicker, yet still, maintain a high level of quality. Slidegeeks has experienced researchers who prepare these templates and write high-quality content for you. Later on, you can personalize the content by editing the XXXXXXXXXXXXXXX. This slide showcases issues faced by organization due to inefficient inventory management process. It shows decline in inventory shrinkage percentage and increase in cost of carrying inventory.
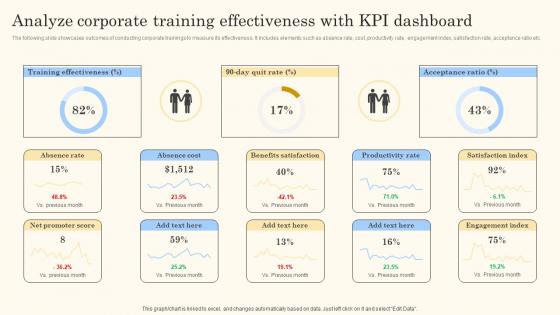
Analyze Corporate Training Effectiveness With Action Steps For Employee Engagement Structure Pdf
The following slide showcases outcomes of conducting corporate trainings to measure its effectiveness. It includes elements such as absence rate, cost, productivity rate, engagement index, satisfaction rate, acceptance ratio etc.Coming up with a presentation necessitates that the majority of the effort goes into the content and the message you intend to convey. The visuals of a PowerPoint presentation can only be effective if it supplements and supports the story that is being told. Keeping this in mind our experts created Analyze Corporate Training Effectiveness With Action Steps For Employee Engagement Structure Pdf to reduce the time that goes into designing the presentation. This way, you can concentrate on the message while our designers take care of providing you with the right template for the situation. The following slide showcases outcomes of conducting corporate trainings to measure its effectiveness. It includes elements such as absence rate, cost, productivity rate, engagement index, satisfaction rate, acceptance ratio etc.
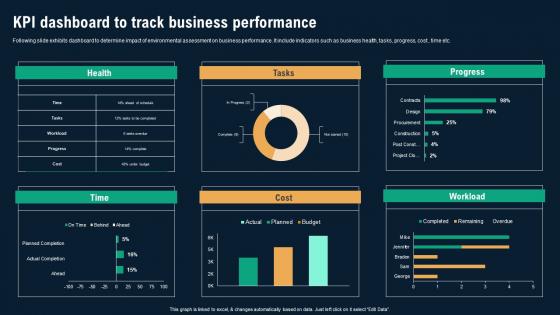
KPI Dashboard To Track Business Performance Business Environmental Analysis Formats Pdf
Following slide exhibits dashboard to determine impact of environmental assessment on business performance. It include indicators such as business health, tasks, progress, cost , time etc. The KPI Dashboard To Track Business Performance Business Environmental Analysis Formats Pdf is a compilation of the most recent design trends as a series of slides. It is suitable for any subject or industry presentation, containing attractive visuals and photo spots for businesses to clearly express their messages. This template contains a variety of slides for the user to input data, such as structures to contrast two elements, bullet points, and slides for written information. Slidegeeks is prepared to create an impression. Following slide exhibits dashboard to determine impact of environmental assessment on business performance. It include indicators such as business health, tasks, progress, cost , time etc.
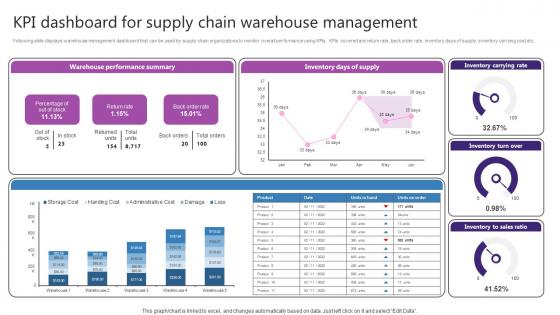
KPI Dashboard For Supply Chain Warehouse Strategic Plan For Enhancing Brochure Pdf
Following slide displays warehouse management dashboard that can be used by supply chain organizations to monitor overall performance using KPIs. KPIs covered are return rate, back order rate, inventory days of supply, inventory carrying cost etc. Slidegeeks has constructed KPI Dashboard For Supply Chain Warehouse Strategic Plan For Enhancing Brochure Pdf after conducting extensive research and examination. These presentation templates are constantly being generated and modified based on user preferences and critiques from editors. Here, you will find the most attractive templates for a range of purposes while taking into account ratings and remarks from users regarding the content. This is an excellent jumping-off point to explore our content and will give new users an insight into our top-notch PowerPoint Templates. Following slide displays warehouse management dashboard that can be used by supply chain organizations to monitor overall performance using KPIs. KPIs covered are return rate, back order rate, inventory days of supply, inventory carrying cost etc.
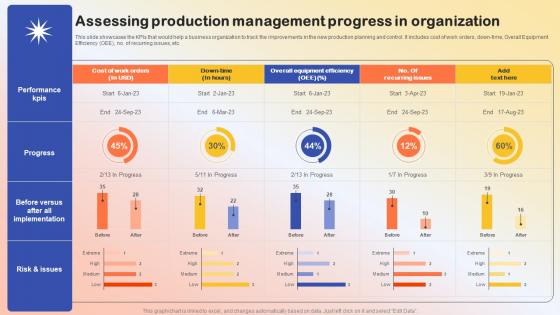
Assessing Production Management Progress In Production Quality Administration Introduction Pdf
This slide showcases the KPIs that would help a business organization to track the improvements in the new production planning and control. It includes cost of work orders, down-time, Overall Equipment Efficiency OEE, no. of recurring issues, etc.Create an editable Assessing Production Management Progress In Production Quality Administration Introduction Pdf that communicates your idea and engages your audience. Whether you are presenting a business or an educational presentation, pre-designed presentation templates help save time. Assessing Production Management Progress In Production Quality Administration Introduction Pdf is highly customizable and very easy to edit, covering many different styles from creative to business presentations. Slidegeeks has creative team members who have crafted amazing templates. So, go and get them without any delay. This slide showcases the KPIs that would help a business organization to track the improvements in the new production planning and control. It includes cost of work orders, down time, Overall Equipment Efficiency OEE no. of recurring issues, etc.
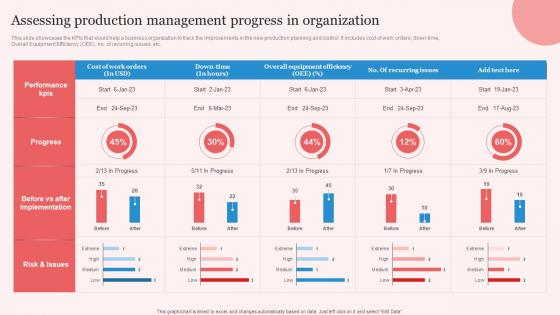
Assessing Production Enhancing Manufacturing Operation Effectiveness Slides Pdf
This slide showcases the KPIs that would help a business organization to track the improvements in the new production planning and control. It includes cost of work orders, down time, Overall Equipment Efficiency OEE, no. of recurring issues, etc. Create an editable Assessing Production Enhancing Manufacturing Operation Effectiveness Slides Pdf that communicates your idea and engages your audience. Whether you are presenting a business or an educational presentation, pre designed presentation templates help save time. Assessing Production Enhancing Manufacturing Operation Effectiveness Slides Pdf is highly customizable and very easy to edit, covering many different styles from creative to business presentations. Slidegeeks has creative team members who have crafted amazing templates. So, go and get them without any delay. This slide showcases the KPIs that would help a business organization to track the improvements in the new production planning and control. It includes cost of work orders, down time, Overall Equipment Efficiency OEE, no. of recurring issues, etc.
Action Measures To Build Staff Employee Performance Tracking And Management Background Pdf
This slide showcases a dashboard presenting various metrics to measure and analyze employee overall performance. It outlines information about average absenteeism rate, yearly average overtime hours, training costs and overall labor effectiveness. Present like a pro with Action Measures To Build Staff Employee Performance Tracking And Management Background Pdf Create beautiful presentations together with your team, using our easy-to-use presentation slides. Share your ideas in real-time and make changes on the fly by downloading our templates. So whether you are in the office, on the go, or in a remote location, you can stay in sync with your team and present your ideas with confidence. With Slidegeeks presentation got a whole lot easier. Grab these presentations today. This slide showcases a dashboard presenting various metrics to measure and analyze employee overall performance. It outlines information about average absenteeism rate, yearly average overtime hours, training costs and overall labor effectiveness.
Employer Branding Strategy For Competitive Employee Performance Tracking Background Pdf
This slide showcases a dashboard presenting various metrics to measure and analyze employee overall performance. It outlines information about average absenteeism rate, yearly average overtime hours, training costs and overall labor effectiveness. Do you have an important presentation coming up Are you looking for something that will make your presentation stand out from the rest Look no further than Employer Branding Strategy For Competitive Employee Performance Tracking Background Pdf. With our professional designs, you can trust that your presentation will pop and make delivering it a smooth process. And with Slidegeeks, you can trust that your presentation will be unique and memorable. So why wait Grab Employer Branding Strategy For Competitive Employee Performance Tracking Background Pdf today and make your presentation stand out from the rest. This slide showcases a dashboard presenting various metrics to measure and analyze employee overall performance. It outlines information about average absenteeism rate, yearly average overtime hours, training costs and overall labor effectiveness.

Successful Guide For Ecommerce Promotion Reasons For Ecommerce Shopping Cart Download Pdf
This slide showcases prime reasons of high shopping cart abandonment on ecommerce website. Key reasons include High shipping cost, visitor scrolling website, payment security concerns, long checkout process, lack of coupon code and lack of express shipping. Create an editable Successful Guide For Ecommerce Promotion Reasons For Ecommerce Shopping Cart Download Pdf that communicates your idea and engages your audience. Whether you are presenting a business or an educational presentation, pre-designed presentation templates help save time. Successful Guide For Ecommerce Promotion Reasons For Ecommerce Shopping Cart Download Pdf is highly customizable and very easy to edit, covering many different styles from creative to business presentations. Slidegeeks has creative team members who have crafted amazing templates. So, go and get them without any delay. This slide showcases prime reasons of high shopping cart abandonment on ecommerce website. Key reasons include High shipping cost, visitor scrolling website, payment security concerns, long checkout process, lack of coupon code and lack of express shipping.
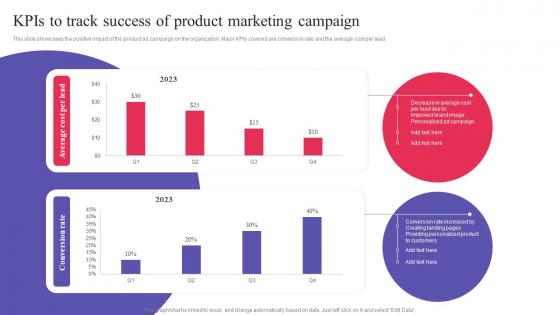
KPIs To Track Success Of Product Marketing Digital Promotional Campaign Demonstration Pdf
This slide showcases the positive impact of the product ad campaign on the organization. Major KPIs covered are conversion rate and the average cost per lead. Welcome to our selection of the KPIs To Track Success Of Product Marketing Digital Promotional Campaign Demonstration Pdf. These are designed to help you showcase your creativity and bring your sphere to life. Planning and Innovation are essential for any business that is just starting out. This collection contains the designs that you need for your everyday presentations. All of our PowerPoints are 100 percent editable, so you can customize them to suit your needs. This multi-purpose template can be used in various situations. Grab these presentation templates today. This slide showcases the positive impact of the product ad campaign on the organization. Major KPIs covered are conversion rate and the average cost per lead.
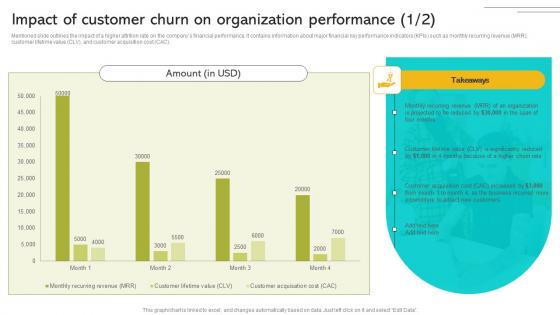
Implementing Strategies To Enhance Impact Of Customer Churn On Organization Performance Infographics PDF
Mentioned slide outlines the impact of a higher attrition rate on the companys financial performance. It contains information about major financial key performance indicators KPIs such as monthly recurring revenue MRR, customer lifetime value CLV, and customer acquisition cost CAC. Make sure to capture your audiences attention in your business displays with our gratis customizable Implementing Strategies To Enhance Impact Of Customer Churn On Organization Performance Infographics PDF These are great for business strategies, office conferences, capital raising or task suggestions. If you desire to acquire more customers for your tech business and ensure they stay satisfied, create your own sales presentation with these plain slides. Mentioned slide outlines the impact of a higher attrition rate on the companys financial performance. It contains information about major financial key performance indicators KPIs such as monthly recurring revenue MRR, customer lifetime value CLV, and customer acquisition cost CAC.
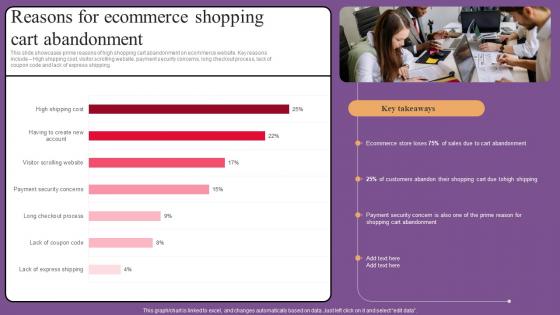
Reasons For Ecommerce Website Optimization To Improve Product Sale Graphics Pdf
This slide showcases prime reasons of high shopping cart abandonment on ecommerce website. Key reasons include High shipping cost, visitor scrolling website, payment security concerns, long checkout process, lack of coupon code and lack of express shipping. Find a pre designed and impeccable Reasons For Ecommerce Website Optimization To Improve Product Sale Graphics Pdf. The templates can ace your presentation without additional effort. You can download these easy to edit presentation templates to make your presentation stand out from others. So, what are you waiting for Download the template from Slidegeeks today and give a unique touch to your presentation. This slide showcases prime reasons of high shopping cart abandonment on ecommerce website. Key reasons include High shipping cost, visitor scrolling website, payment security concerns, long checkout process, lack of coupon code and lack of express shipping.
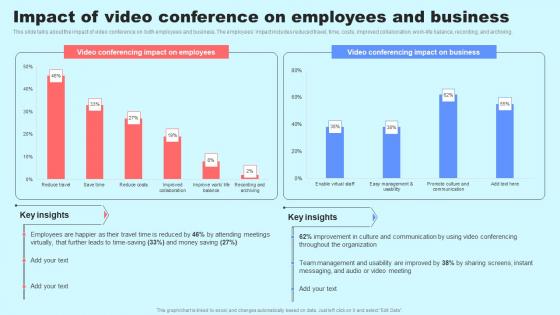
Social Media In Customer Support Impact Of Video Conference On Employees And Business Inspiration Pdf
This slide talks about the impact of video conference on both employees and business. The employees impact includes reduced travel, time, costs, improved collaboration, work life balance, recording, and archiving. Crafting an eye catching presentation has never been more straightforward. Let your presentation shine with this tasteful yet straightforward Social Media In Customer Support Impact Of Video Conference On Employees And Business Inspiration Pdf template. It offers a minimalistic and classy look that is great for making a statement. The colors have been employed intelligently to add a bit of playfulness while still remaining professional. Construct the ideal Social Media In Customer Support Impact Of Video Conference On Employees And Business Inspiration Pdf that effortlessly grabs the attention of your audience Begin now and be certain to wow your customers This slide talks about the impact of video conference on both employees and business. The employees impact includes reduced travel, time, costs, improved collaboration, work life balance, recording, and archiving.
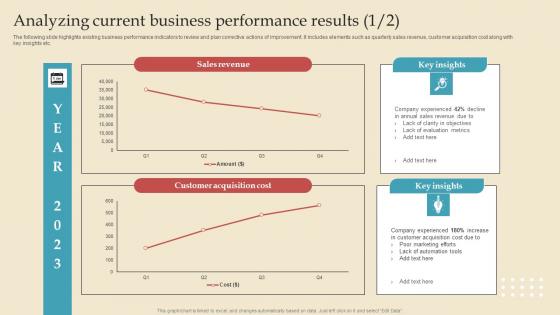
Analyzing Current Describing Business Performance Administration Goals Microsoft Pdf
The following slide highlights existing business performance indicators to review and plan corrective actions of improvement. It includes elements such as quarterly sales revenue, customer acquisition cost along with key insights etc. This modern and well arranged Analyzing Current Describing Business Performance Administration Goals Microsoft Pdf provides lots of creative possibilities. It is very simple to customize and edit with the Powerpoint Software. Just drag and drop your pictures into the shapes. All facets of this template can be edited with Powerpoint, no extra software is necessary. Add your own material, put your images in the places assigned for them, adjust the colors, and then you can show your slides to the world, with an animated slide included. The following slide highlights existing business performance indicators to review and plan corrective actions of improvement. It includes elements such as quarterly sales revenue, customer acquisition cost along with key insights etc.
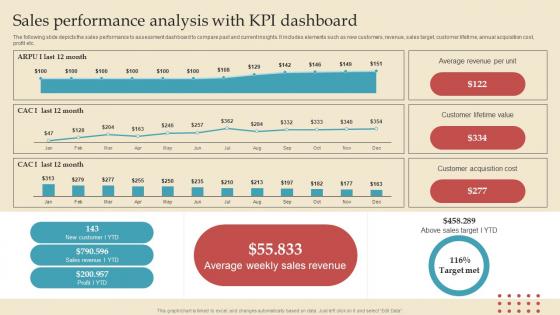
Sales Performance Analysis Describing Business Performance Administration Goals Background Pdf
The following slide depicts the sales performance to assessment dashboard to compare past and current insights. It includes elements such as new customers, revenue, sales target, customer lifetime, annual acquisition cost, profit etc. Crafting an eye catching presentation has never been more straightforward. Let your presentation shine with this tasteful yet straightforward Sales Performance Analysis Describing Business Performance Administration Goals Background Pdf template. It offers a minimalistic and classy look that is great for making a statement. The colors have been employed intelligently to add a bit of playfulness while still remaining professional. Construct the ideal Sales Performance Analysis Describing Business Performance Administration Goals Background Pdf that effortlessly grabs the attention of your audience Begin now and be certain to wow your customers The following slide depicts the sales performance to assessment dashboard to compare past and current insights. It includes elements such as new customers, revenue, sales target, customer lifetime, annual acquisition cost, profit etc.
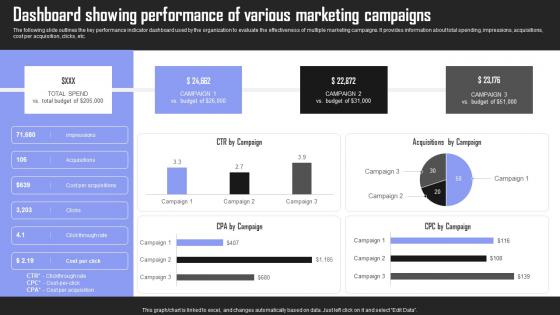
Dashboard Showing Performance Brand Building Techniques To Gain Competitive Edge Topics Pdf
The following slide outlines the key performance indicator dashboard used by the organization to evaluate the effectiveness of multiple marketing campaigns. It provides information about total spending, impressions, acquisitions, cost per acquisition, clicks, etc. If your project calls for a presentation, then Slidegeeks is your go to partner because we have professionally designed, easy to edit templates that are perfect for any presentation. After downloading, you can easily edit Dashboard Showing Performance Brand Building Techniques To Gain Competitive Edge Topics Pdf and make the changes accordingly. You can rearrange slides or fill them with different images. Check out all the handy templates The following slide outlines the key performance indicator dashboard used by the organization to evaluate the effectiveness of multiple marketing campaigns. It provides information about total spending, impressions, acquisitions, cost per acquisition, clicks, etc.
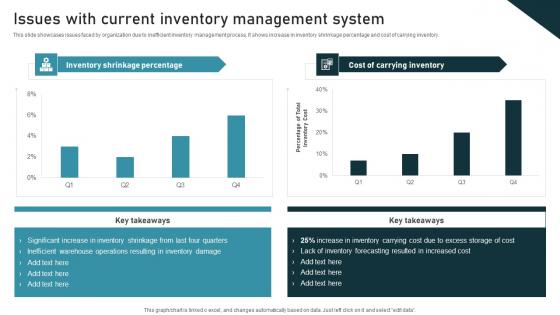
Issues With Current Inventory Administration Techniques For Enhanced Stock Accuracy Mockup Pdf
This slide showcases issues faced by organization due to inefficient inventory management process. It shows increase in inventory shrinkage percentage and cost of carrying inventory. Welcome to our selection of the Issues With Current Inventory Administration Techniques For Enhanced Stock Accuracy Mockup Pdf. These are designed to help you showcase your creativity and bring your sphere to life. Planning and Innovation are essential for any business that is just starting out. This collection contains the designs that you need for your everyday presentations. All of our PowerPoints are 100 percent editable, so you can customize them to suit your needs. This multi purpose template can be used in various situations. Grab these presentation templates today This slide showcases issues faced by organization due to inefficient inventory management process. It shows increase in inventory shrinkage percentage and cost of carrying inventory.
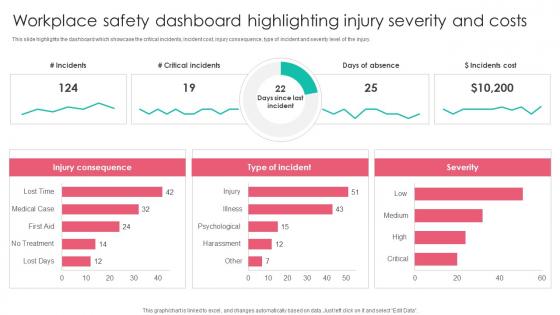
Workplace Safety Dashboard Highlighting Workplace Safety Protocol And Security Practices Elements Pdf
This slide highlights the dashboard which showcase the critical incidents, incident cost, injury consequence, type of incident and severity level of the injury. From laying roadmaps to briefing everything in detail, our templates are perfect for you. You can set the stage with your presentation slides. All you have to do is download these easy to edit and customizable templates. Workplace Safety Dashboard Highlighting Workplace Safety Protocol And Security Practices Elements Pdf will help you deliver an outstanding performance that everyone would remember and praise you for. Do download this presentation today. This slide highlights the dashboard which showcase the critical incidents, incident cost, injury consequence, type of incident and severity level of the injury.
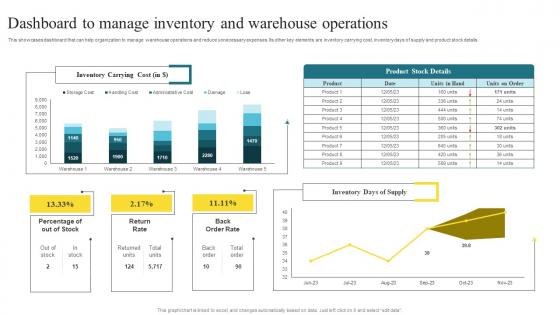
Dashboard To Manage Inventory Methods To Enhance Warehouse Space Utilization Summary Pdf
This showcases dashboard that can help organization to manage warehouse operations and reduce unnecessary expenses. Its other key elements are inventory carrying cost, inventory days of supply and product stock details. There are so many reasons you need a Dashboard To Manage Inventory Methods To Enhance Warehouse Space Utilization Summary Pdf. The first reason is you can not spend time making everything from scratch, Thus, Slidegeeks has made presentation templates for you too. You can easily download these templates from our website easily. This showcases dashboard that can help organization to manage warehouse operations and reduce unnecessary expenses. Its other key elements are inventory carrying cost, inventory days of supply and product stock details.
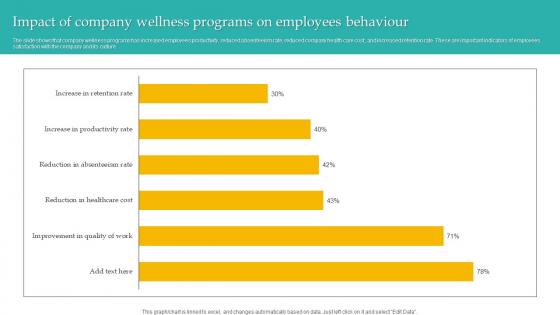
Impact Of Company Wellness Administering Diversity And Inclusion At Workplace Slides Pdf
The slide shows that company wellness programs has increased employees productivity, reduced absenteeism rate, reduced company health care cost, and increased retention rate. These are important indicators of employees satisfaction with the company and its culture. This modern and well arranged Impact Of Company Wellness Administering Diversity And Inclusion At Workplace Slides Pdf provides lots of creative possibilities. It is very simple to customize and edit with the Powerpoint Software. Just drag and drop your pictures into the shapes. All facets of this template can be edited with Powerpoint, no extra software is necessary. Add your own material, put your images in the places assigned for them, adjust the colors, and then you can show your slides to the world, with an animated slide included. The slide shows that company wellness programs has increased employees productivity, reduced absenteeism rate, reduced company health care cost, and increased retention rate. These are important indicators of employees satisfaction with the company and its culture.
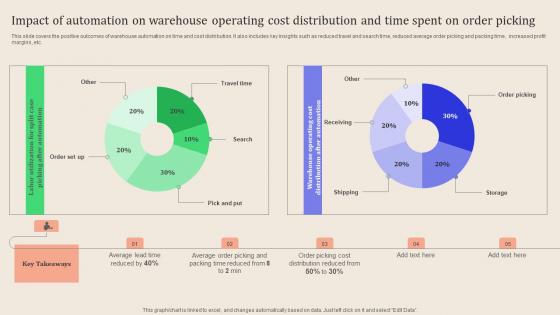
Leveraging Logistics Automation Impact Of Automation On Warehouse Clipart Pdf
This slide covers the positive outcomes of warehouse automation on time and cost distribution. It also includes key insights such as reduced travel and search time, reduced average order picking and packing time, increased profit margins, etc. This modern and well arranged Leveraging Logistics Automation Impact Of Automation On Warehouse Clipart Pdf provides lots of creative possibilities. It is very simple to customize and edit with the Powerpoint Software. Just drag and drop your pictures into the shapes. All facets of this template can be edited with Powerpoint no extra software is necessary. Add your own material, put your images in the places assigned for them, adjust the colors, and then you can show your slides to the world, with an animated slide included. This slide covers the positive outcomes of warehouse automation on time and cost distribution. It also includes key insights such as reduced travel and search time, reduced average order picking and packing time, increased profit margins, etc.
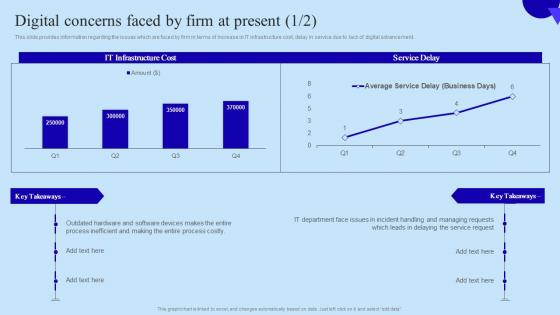
Digital Concerns Faced By Firm At Present Organisational Digital Innovation Demonstration PDF
This slide provides information regarding the issues which are faced by firm in terms of increase in IT infrastructure cost, delay in service due to lack of digital advancement. Present like a pro with Digital Concerns Faced By Firm At Present Organisational Digital Innovation Demonstration PDF Create beautiful presentations together with your team, using our easy-to-use presentation slides. Share your ideas in real-time and make changes on the fly by downloading our templates. So whether you are in the office, on the go, or in a remote location, you can stay in sync with your team and present your ideas with confidence. With Slidegeeks presentation got a whole lot easier. Grab these presentations today. This slide provides information regarding the issues which are faced by firm in terms of increase in IT infrastructure cost, delay in service due to lack of digital advancement.

Assessing Production Management Progress Streamlining Production Operational Background PDF
This slide showcases the KPIs that would help a business organization to track the improvements in the new production planning and control. It includes cost of work orders, down-time, Overall Equipment Efficiency OEE, no. of recurring issues, etc. Create an editable Assessing Production Management Progress Streamlining Production Operational Background PDF that communicates your idea and engages your audience. Whether you are presenting a business or an educational presentation, pre-designed presentation templates help save time. Assessing Production Management Progress Streamlining Production Operational Background PDF is highly customizable and very easy to edit, covering many different styles from creative to business presentations. Slidegeeks has creative team members who have crafted amazing templates. So, go and get them without any delay. This slide showcases the KPIs that would help a business organization to track the improvements in the new production planning and control. It includes cost of work orders, down-time, Overall Equipment Efficiency OEE, no. of recurring issues, etc.
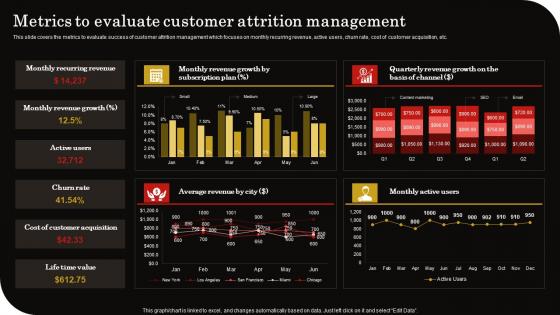
Metrics To Evaluate Customer Attrition Client Retention Strategy To Reduce Churn Rate Infographics Pdf
This slide covers the metrics to evaluate success of customer attrition management which focuses on monthly recurring revenue, active users, churn rate, cost of customer acquisition, etc. This Metrics To Evaluate Customer Attrition Client Retention Strategy To Reduce Churn Rate Infographics Pdf is perfect for any presentation, be it in front of clients or colleagues. It is a versatile and stylish solution for organizing your meetings. The Metrics To Evaluate Customer Attrition Client Retention Strategy To Reduce Churn Rate Infographics Pdf features a modern design for your presentation meetings. The adjustable and customizable slides provide unlimited possibilities for acing up your presentation. Slidegeeks has done all the homework before launching the product for you. So, do not wait, grab the presentation templates today This slide covers the metrics to evaluate success of customer attrition management which focuses on monthly recurring revenue, active users, churn rate, cost of customer acquisition, etc.
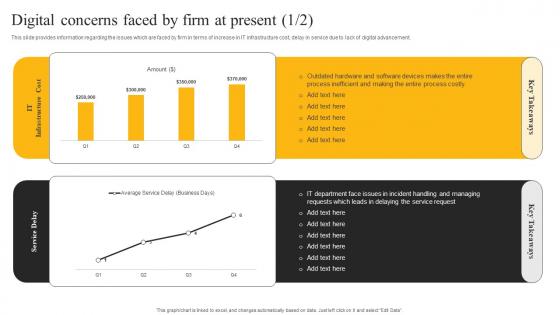
Digital Concerns Faced By Firm At Present E Sales Generation Checklist Template PDF
This slide provides information regarding the issues which are faced by firm in terms of increase in IT infrastructure cost, delay in service due to lack of digital advancement. Present like a pro with Digital Concerns Faced By Firm At Present E Sales Generation Checklist Template PDF Create beautiful presentations together with your team, using our easy-to-use presentation slides. Share your ideas in real-time and make changes on the fly by downloading our templates. So whether you are in the office, on the go, or in a remote location, you can stay in sync with your team and present your ideas with confidence. With Slidegeeks presentation got a whole lot easier. Grab these presentations today. This slide provides information regarding the issues which are faced by firm in terms of increase in IT infrastructure cost, delay in service due to lack of digital advancement.
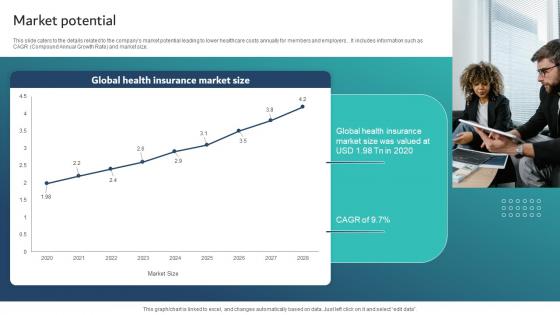
Market Potential Healthcare Insurance App Capital Raising Pitch Deck Introduction Pdf
This slide caters to the details related to the companys market potential leading to lower healthcare costs annually for members and employers. . It includes information such as CAGR Compound Annual Growth Rate and market size. Want to ace your presentation in front of a live audience Our Market Potential Healthcare Insurance App Capital Raising Pitch Deck Introduction Pdf can help you do that by engaging all the users towards you. Slidegeeks experts have put their efforts and expertise into creating these impeccable powerpoint presentations so that you can communicate your ideas clearly. Moreover, all the templates are customizable, and easy to edit and downloadable. Use these for both personal and commercial use. This slide caters to the details related to the companys market potential leading to lower healthcare costs annually for members and employers. . It includes information such as CAGR Compound Annual Growth Rate and market size.
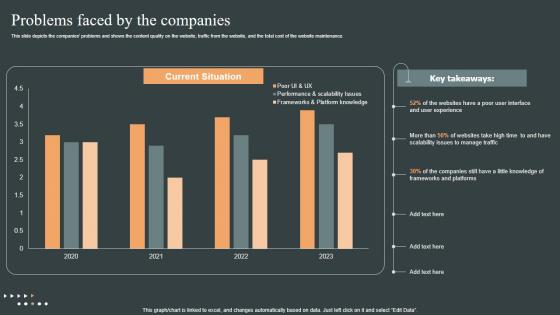
Problems Faced By The Companies Role Web Designing User Engagement Introduction PDF
This slide depicts the companies problems and shows the content quality on the website, traffic from the website, and the total cost of the website maintenance. Explore a selection of the finest Problems Faced By The Companies Role Web Designing User Engagement Introduction PDF here. With a plethora of professionally designed and pre-made slide templates, you can quickly and easily find the right one for your upcoming presentation. You can use our Problems Faced By The Companies Role Web Designing User Engagement Introduction PDF to effectively convey your message to a wider audience. Slidegeeks has done a lot of research before preparing these presentation templates. The content can be personalized and the slides are highly editable. Grab templates today from Slidegeeks. This slide depicts the companies problems and shows the content quality on the website, traffic from the website, and the total cost of the website maintenance.
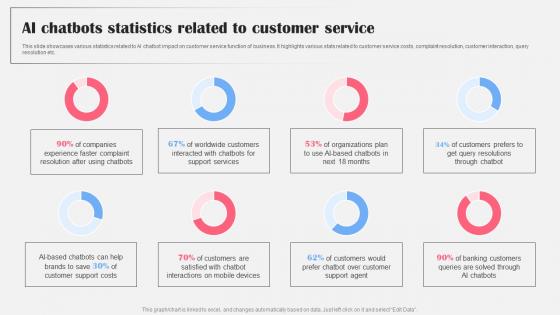
AI Chatbots Statistics Related To Customer AI Bot Application For Various Industries Information Pdf
This slide showcases various statistics related to AI chatbot impact on customer service function of business. It highlights various stats related to customer service costs, complaint resolution, customer interaction, query resolution etc. From laying roadmaps to briefing everything in detail, our templates are perfect for you. You can set the stage with your presentation slides. All you have to do is download these easy to edit and customizable templates. AI Chatbots Statistics Related To Customer AI Bot Application For Various Industries Information Pdf will help you deliver an outstanding performance that everyone would remember and praise you for. Do download this presentation today. This slide showcases various statistics related to AI chatbot impact on customer service function of business. It highlights various stats related to customer service costs, complaint resolution, customer interaction, query resolution etc.
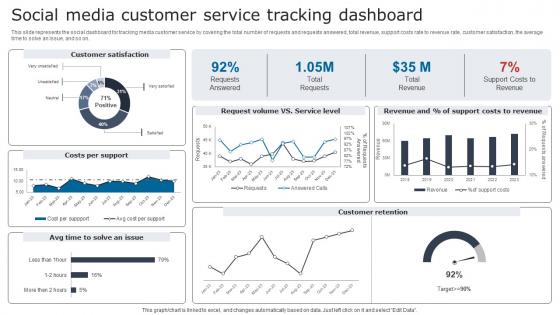
Social Media Customer Service Digital Signage In Internal Communication Channels Template Pdf
This slide represents the social dashboard for tracking media customer service by covering the total number of requests and requests answered, total revenue, support costs rate to revenue rate, customer satisfaction, the average time to solve an issue, and so on. If your project calls for a presentation, then Slidegeeks is your go to partner because we have professionally designed, easy to edit templates that are perfect for any presentation. After downloading, you can easily edit Social Media Customer Service Digital Signage In Internal Communication Channels Template Pdf and make the changes accordingly. You can rearrange slides or fill them with different images. Check out all the handy templates This slide represents the social dashboard for tracking media customer service by covering the total number of requests and requests answered, total revenue, support costs rate to revenue rate, customer satisfaction, the average time to solve an issue, and so on.
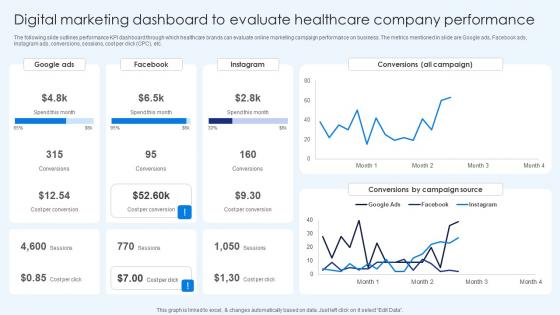
Digital Marketing Dashboard To Evaluate Healthcare Promotion Introduction Pdf
The following slide outlines performance KPI dashboard through which healthcare brands can evaluate online marketing campaign performance on business. The metrics mentioned in slide are Google ads, Facebook ads, Instagram ads, conversions, sessions, cost per click CPC, etc. Present like a pro with Digital Marketing Dashboard To Evaluate Healthcare Promotion Introduction Pdf Create beautiful presentations together with your team, using our easy-to-use presentation slides. Share your ideas in real-time and make changes on the fly by downloading our templates. So whether you are in the office, on the go, or in a remote location, you can stay in sync with your team and present your ideas with confidence. With Slidegeeks presentation got a whole lot easier. Grab these presentations today. The following slide outlines performance KPI dashboard through which healthcare brands can evaluate online marketing campaign performance on business. The metrics mentioned in slide are Google ads, Facebook ads, Instagram ads, conversions, sessions, cost per click CPC, etc.
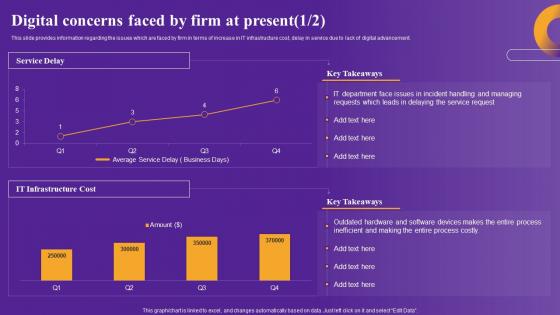
Digital Concerns Faced Strategic Framework To Improve Digital Transformation Portrait Pdf
This slide provides information regarding the issues which are faced by firm in terms of increase in IT infrastructure cost, delay in service due to lack of digital advancement. Present like a pro with Digital Concerns Faced Strategic Framework To Improve Digital Transformation Portrait Pdf Create beautiful presentations together with your team, using our easy to use presentation slides. Share your ideas in real time and make changes on the fly by downloading our templates. So whether you are in the office, on the go, or in a remote location, you can stay in sync with your team and present your ideas with confidence. With Slidegeeks presentation got a whole lot easier. Grab these presentations today. This slide provides information regarding the issues which are faced by firm in terms of increase in IT infrastructure cost, delay in service due to lack of digital advancement.
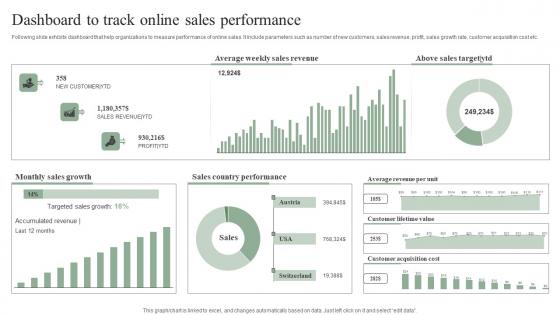
Dashboard To Track Online Sales Performance Efficient Marketing Tactics Topics Pdf
Following slide exhibits dashboard that help organizations to measure performance of online sales. It include parameters such as number of new customers, sales revenue, profit, sales growth rate, customer acquisition cost etc. Do you have an important presentation coming up Are you looking for something that will make your presentation stand out from the rest Look no further than Dashboard To Track Online Sales Performance Efficient Marketing Tactics Topics Pdf. With our professional designs, you can trust that your presentation will pop and make delivering it a smooth process. And with Slidegeeks, you can trust that your presentation will be unique and memorable. So why wait Grab Dashboard To Track Online Sales Performance Efficient Marketing Tactics Topics Pdf today and make your presentation stand out from the rest Following slide exhibits dashboard that help organizations to measure performance of online sales. It include parameters such as number of new customers, sales revenue, profit, sales growth rate, customer acquisition cost etc.
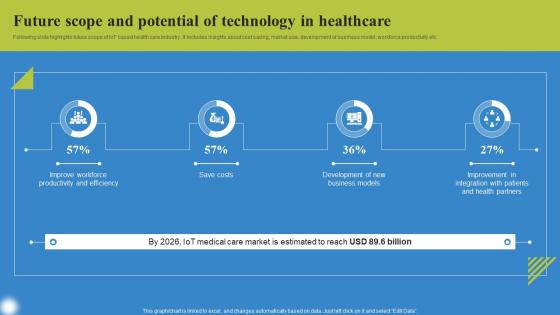
Future Scope And Potential Technology Deploying IoT Solutions For Enhanced Healthcare Inspiration Pdf
Following slide highlights future scope of IoT based health care industry. It includes insights about cost saving, market size, development of business model, workforce productivity etc. This Future Scope And Potential Technology Deploying IoT Solutions For Enhanced Healthcare Inspiration Pdf from Slidegeeks makes it easy to present information on your topic with precision. It provides customization options, so you can make changes to the colors, design, graphics, or any other component to create a unique layout. It is also available for immediate download, so you can begin using it right away. Slidegeeks has done good research to ensure that you have everything you need to make your presentation stand out. Make a name out there for a brilliant performance. Following slide highlights future scope of IoT based health care industry. It includes insights about cost saving, market size, development of business model, workforce productivity etc.
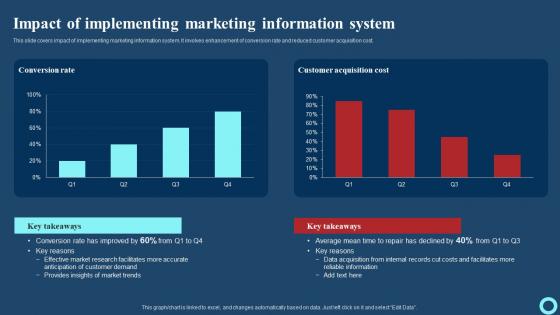
Impact Of Implementing Marketing Information System Effective Strategies To Enhance Information Pdf
This slide covers impact of implementing marketing information system. It involves enhancement of conversion rate and reduced customer acquisition cost. Want to ace your presentation in front of a live audience Our Impact Of Implementing Marketing Information System Effective Strategies To Enhance Information Pdf can help you do that by engaging all the users towards you. Slidegeeks experts have put their efforts and expertise into creating these impeccable powerpoint presentations so that you can communicate your ideas clearly. Moreover, all the templates are customizable, and easy-to-edit and downloadable. Use these for both personal and commercial use. This slide covers impact of implementing marketing information system. It involves enhancement of conversion rate and reduced customer acquisition cost.
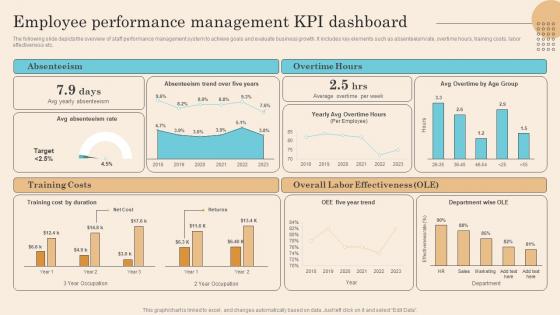
Employee Performance Management Kpi Dashboard Executing Successful Staff Performance Elements Pdf
The following slide depicts the overview of staff performance management system to achieve goals and evaluate business growth. It includes key elements such as absenteeism rate, overtime hours, training costs, labor effectiveness etc. Find highly impressive Employee Performance Management Kpi Dashboard Executing Successful Staff Performance Elements Pdf on Slidegeeks to deliver a meaningful presentation. You can save an ample amount of time using these presentation templates. No need to worry to prepare everything from scratch because Slidegeeks experts have already done a huge research and work for you. You need to download Employee Performance Management Kpi Dashboard Executing Successful Staff Performance Elements Pdf for your upcoming presentation. All the presentation templates are 100 percent editable and you can change the color and personalize the content accordingly. Download now. The following slide depicts the overview of staff performance management system to achieve goals and evaluate business growth. It includes key elements such as absenteeism rate, overtime hours, training costs, labor effectiveness etc.
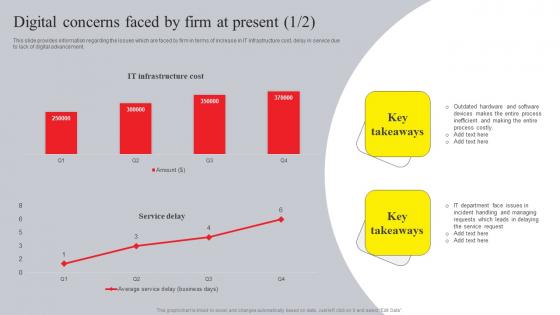
Online Advertising And Technology Task Digital Concerns Faced By Firm At Present Clipart Pdf
This slide provides information regarding the issues which are faced by firm in terms of increase in IT infrastructure cost, delay in service due to lack of digital advancement. Do you have an important presentation coming up Are you looking for something that will make your presentation stand out from the rest Look no further than Online Advertising And Technology Task Digital Concerns Faced By Firm At Present Clipart Pdf. With our professional designs, you can trust that your presentation will pop and make delivering it a smooth process. And with Slidegeeks, you can trust that your presentation will be unique and memorable. So why wait Grab Online Advertising And Technology Task Digital Concerns Faced By Firm At Present Clipart Pdf today and make your presentation stand out from the rest. This slide provides information regarding the issues which are faced by firm in terms of increase in IT infrastructure cost, delay in service due to lack of digital advancement.
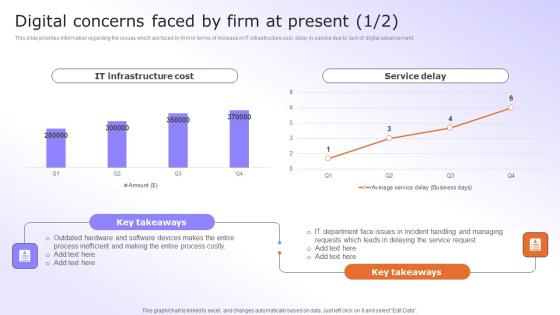
Digital Advancement Checklist Digital Concerns Faced By Firm At Present Summary Pdf
This slide provides information regarding the issues which are faced by firm in terms of increase in IT infrastructure cost, delay in service due to lack of digital advancement. Present like a pro with Digital Advancement Checklist Digital Concerns Faced By Firm At Present Summary Pdf Create beautiful presentations together with your team, using our easy-to-use presentation slides. Share your ideas in real-time and make changes on the fly by downloading our templates. So whether you are in the office, on the go, or in a remote location, you can stay in sync with your team and present your ideas with confidence. With Slidegeeks presentation got a whole lot easier. Grab these presentations today. This slide provides information regarding the issues which are faced by firm in terms of increase in IT infrastructure cost, delay in service due to lack of digital advancement.
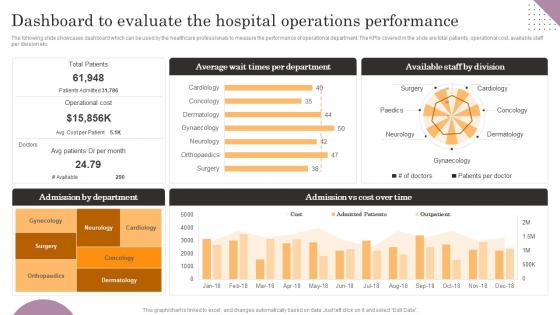
Dashboard To Evaluate The Hospital Operations Performance General Management Rules Pdf
The following slide showcases dashboard which can be used by the healthcare professionals to measure the performance of operational department. The KPIs covered in the slide are total patients, operational cost, available staff per division etc. Present like a pro with Dashboard To Evaluate The Hospital Operations Performance General Management Rules Pdf Create beautiful presentations together with your team, using our easy-to-use presentation slides. Share your ideas in real-time and make changes on the fly by downloading our templates. So whether you are in the office, on the go, or in a remote location, you can stay in sync with your team and present your ideas with confidence. With Slidegeeks presentation got a whole lot easier. Grab these presentations today. The following slide showcases dashboard which can be used by the healthcare professionals to measure the performance of operational department. The KPIs covered in the slide are total patients, operational cost, available staff per division etc.
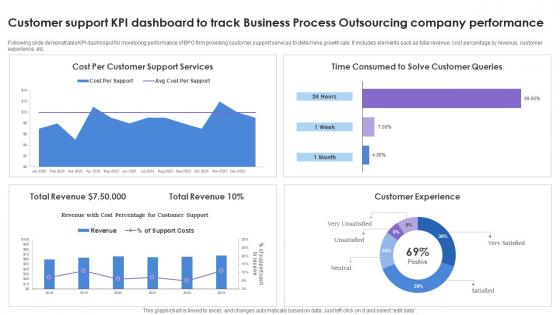
Customer Support KPI Dashboard To Track Business Process Outsourcing Company Performance Rules Pdf Wd
Following slide demonstrates KPI dashboard for monitoring performance of BPO firm providing customer support services to determine growth rate. It includes elements such as total revenue, cost percentage by revenue, customer experience, etc. Showcasing this set of slides titled Customer Support KPI Dashboard To Track Business Process Outsourcing Company Performance Rules Pdf Wd. The topics addressed in these templates are Customer Experience, Total Revenue. All the content presented in this PPT design is completely editable. Download it and make adjustments in color, background, font etc. as per your unique business setting. Following slide demonstrates KPI dashboard for monitoring performance of BPO firm providing customer support services to determine growth rate. It includes elements such as total revenue, cost percentage by revenue, customer experience, etc.
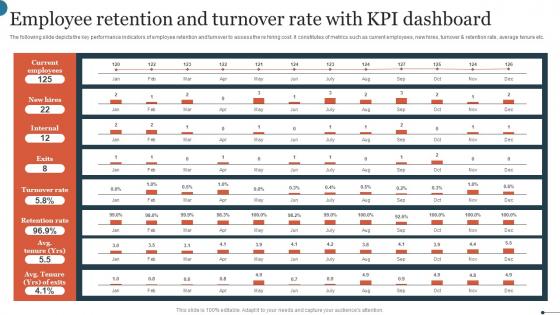
Employee Retention And Turnover Rate With KPI Dashboard Graphics Pdf
The following slide depicts the key performance indicators of employee retention and turnover to assess the re hiring cost. It constitutes of metrics such as current employees, new hires, turnover and retention rate, average tenure etc. Showcasing this set of slides titled Employee Retention And Turnover Rate With KPI Dashboard Graphics Pdf. The topics addressed in these templates are Current Employees, Turnover Rate, Retention Rate. All the content presented in this PPT design is completely editable. Download it and make adjustments in color, background, font etc. as per your unique business setting. The following slide depicts the key performance indicators of employee retention and turnover to assess the re hiring cost. It constitutes of metrics such as current employees, new hires, turnover and retention rate, average tenure etc.
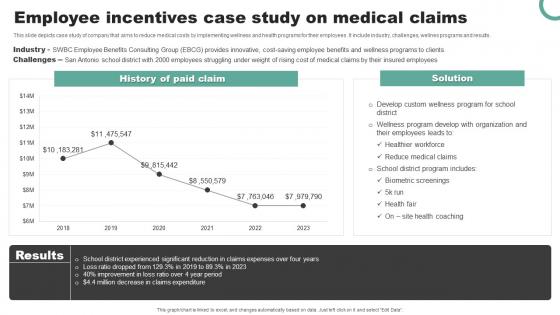
Employee Incentives Case Study On Medical Claims Background Pdf
This slide depicts case study of company that aims to reduce medical costs by implementing wellness and health programs for their employees. It include industry, challenges, wellnes programs and results. Pitch your topic with ease and precision using this Employee Incentives Case Study On Medical Claims Background Pdf This layout presents information on Industry, Employee Incentives, Medical Claims It is also available for immediate download and adjustment. So, changes can be made in the color, design, graphics or any other component to create a unique layout. This slide depicts case study of company that aims to reduce medical costs by implementing wellness and health programs for their employees. It include industry, challenges, wellnes programs and results.
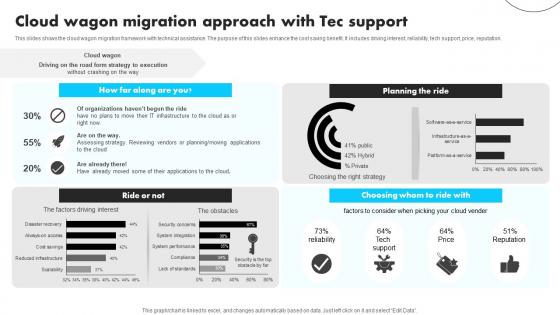
Cloud Wagon Migration Approach With Tec Support Guidelines Pdf
This slides shows the cloud wagon migration framework with technical assistance. The purpose of this slides enhance the cost saving benefit. It includes driving interest, reliability, tech support, price, reputation. Pitch your topic with ease and precision using this Cloud Wagon Migration Approach With Tec Support Guidelines Pdf This layout presents information on Planning The Ride, Choosing Whom, Tec Support It is also available for immediate download and adjustment. So, changes can be made in the color, design, graphics or any other component to create a unique layout. This slides shows the cloud wagon migration framework with technical assistance. The purpose of this slides enhance the cost saving benefit. It includes driving interest, reliability, tech support, price, reputation.
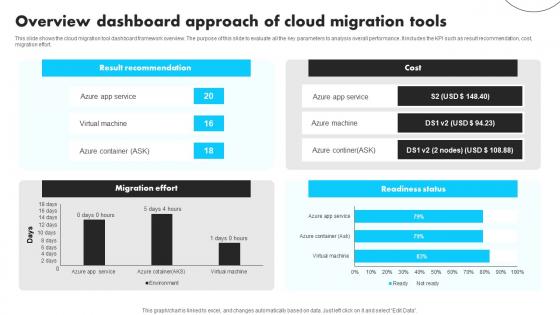
Overview Dashboard Approach Of Cloud Migration Tools Graphics Pdf
This slide shows the cloud migration tool dashboard framework overview. The purpose of this slide to evaluate all the key parameters to analysis overall performance .It includes the KPI such as result recommendation, cost, migration effort. Showcasing this set of slides titled Overview Dashboard Approach Of Cloud Migration Tools Graphics Pdf The topics addressed in these templates are Result Recommendation, Migration Effort, Readiness Status All the content presented in this PPT design is completely editable. Download it and make adjustments in color, background, font etc. as per your unique business setting. This slide shows the cloud migration tool dashboard framework overview. The purpose of this slide to evaluate all the key parameters to analysis overall performance .It includes the KPI such as result recommendation, cost, migration effort.
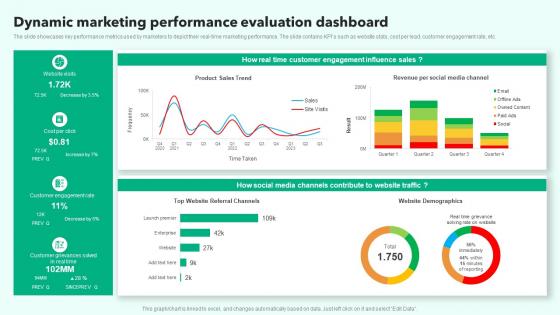
Dynamic Marketing Performance Evaluation Dashboard Microsoft Pdf
The slide showcases key performance metrics used by marketers to depict their real time marketing performance. The slide contains KPIs such as website stats, cost per lead, customer engagement rate, etc. Pitch your topic with ease and precision using this Dynamic Marketing Performance Evaluation Dashboard Microsoft Pdf. This layout presents information on Influence Sales, Customer Engagement, Customer Engagement Rate. It is also available for immediate download and adjustment. So, changes can be made in the color, design, graphics or any other component to create a unique layout. The slide showcases key performance metrics used by marketers to depict their real time marketing performance. The slide contains KPIs such as website stats, cost per lead, customer engagement rate, etc.
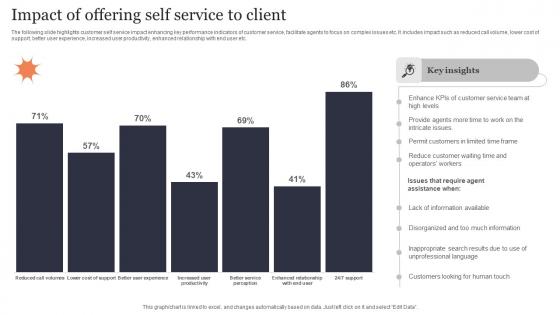
Impact Of Offering Self Service To Client Structure Pdf
The following slide highlights customer self service impact enhancing key performance indicators of customer service, facilitate agents to focus on complex issues etc. It includes impact such as reduced call volume, lower cost of support, better user experience, increased user productivity, enhanced relationship with end user etc. Showcasing this set of slides titled Impact Of Offering Self Service To Client Structure Pdf. The topics addressed in these templates are Impact Of Offering, Self Service. All the content presented in this PPT design is completely editable. Download it and make adjustments in color, background, font etc. as per your unique business setting. The following slide highlights customer self service impact enhancing key performance indicators of customer service, facilitate agents to focus on complex issues etc. It includes impact such as reduced call volume, lower cost of support, better user experience, increased user productivity, enhanced relationship with end user etc.
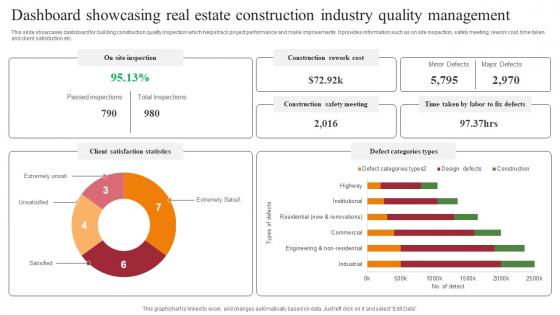
Dashboard Showcasing Real Estate Construction Industry Quality Management Topics Pdf
This slide showcases dashboard for building construction quality inspection which helps track project performance and make improvements. It provides information such as on site inspection, safety meeting, rework cost, time taken and client satisfaction etc. Pitch your topic with ease and precision using this Dashboard Showcasing Real Estate Construction Industry Quality Management Topics Pdf. This layout presents information on Client Satisfaction Statistics, Defect Categories Types. It is also available for immediate download and adjustment. So, changes can be made in the color, design, graphics or any other component to create a unique layout. This slide showcases dashboard for building construction quality inspection which helps track project performance and make improvements. It provides information such as on site inspection, safety meeting, rework cost, time taken and client satisfaction etc.
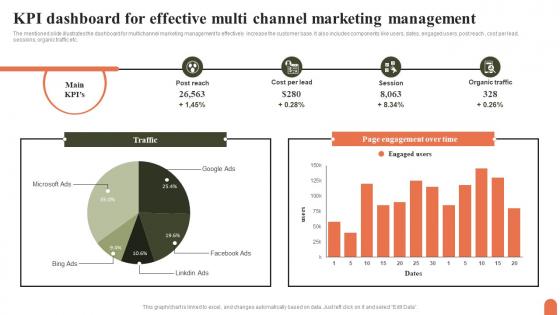
KPI Dashboard For Effective Multi Channel Marketing Management Topics Pdf
The mentioned slide illustrates the dashboard for multichannel marketing management to effectively increase the customer base. It also includes components like users, dates, engaged users, post reach , cost per lead, sessions, organic traffic etc. Showcasing this set of slides titled KPI Dashboard For Effective Multi Channel Marketing Management Topics Pdf. The topics addressed in these templates are KPI Dashboard, Effective Multi Channel, Marketing Management. All the content presented in this PPT design is completely editable. Download it and make adjustments in color, background, font etc. as per your unique business setting. The mentioned slide illustrates the dashboard for multichannel marketing management to effectively increase the customer base. It also includes components like users, dates, engaged users, post reach , cost per lead, sessions, organic traffic etc.
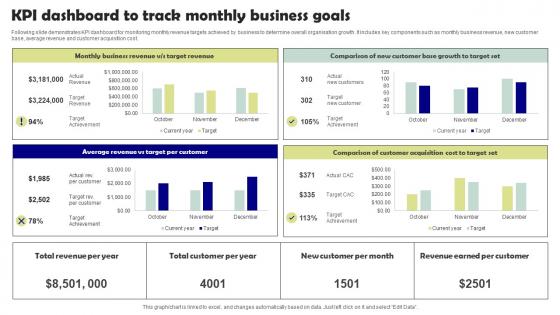
KPI Dashboard To Track Monthly Business Goals Microsoft Pdf
Following slide demonstrates KPI dashboard for monitoring monthly revenue targets achieved by business to determine overall organisation growth. It includes key components such as monthly business revenue, new customer base, average revenue and customer acquisition cost. Pitch your topic with ease and precision using this KPI Dashboard To Track Monthly Business Goals Microsoft Pdf. This layout presents information on Target Per Customer, Target Set. It is also available for immediate download and adjustment. So, changes can be made in the color, design, graphics or any other component to create a unique layout. Following slide demonstrates KPI dashboard for monitoring monthly revenue targets achieved by business to determine overall organisation growth. It includes key components such as monthly business revenue, new customer base, average revenue and customer acquisition cost.
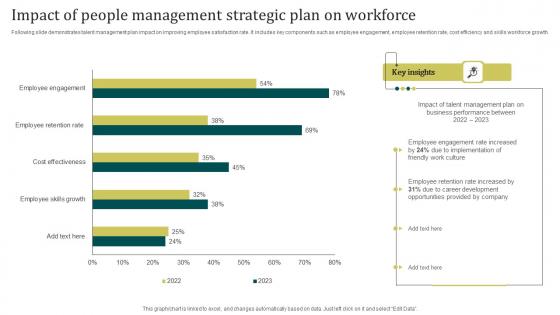
Impact Of People Management Strategic Plan On Workforce Topics Pdf
Following slide demonstrates talent management plan impact on improving employee satisfaction rate. It includes key components such as employee engagement, employee retention rate, cost efficiency and skills workforce growth. Pitch your topic with ease and precision using this Impact Of People Management Strategic Plan On Workforce Topics Pdf. This layout presents information on Impact Of People, Management Strategic. It is also available for immediate download and adjustment. So, changes can be made in the color, design, graphics or any other component to create a unique layout. Following slide demonstrates talent management plan impact on improving employee satisfaction rate. It includes key components such as employee engagement, employee retention rate, cost efficiency and skills workforce growth.
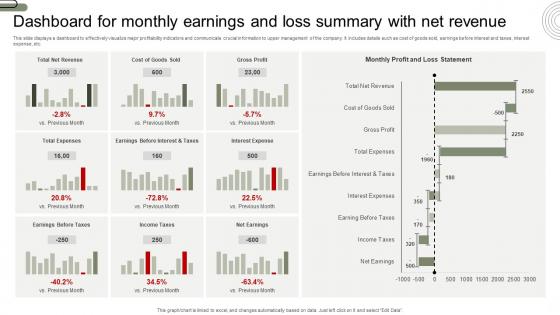
Dashboard For Monthly Earnings And Loss Summary With Net Revenue Background Pdf
This slide displays a dashboard to effectively visualize major profitability indicators and communicate crucial information to upper management of the company. It includes details such as cost of goods sold, earnings before interest and taxes, interest expense, etc. Pitch your topic with ease and precision using this Dashboard For Monthly Earnings And Loss Summary With Net Revenue Background Pdf. This layout presents information on Dashboard For Monthly Earnings, Loss Summary, Net Revenue. It is also available for immediate download and adjustment. So, changes can be made in the color, design, graphics or any other component to create a unique layout. This slide displays a dashboard to effectively visualize major profitability indicators and communicate crucial information to upper management of the company. It includes details such as cost of goods sold, earnings before interest and taxes, interest expense, etc.
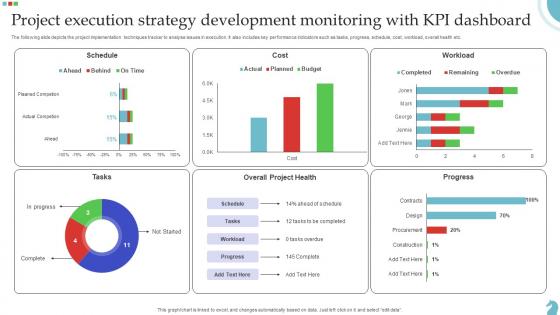
Project Execution Strategy Development Monitoring With Kpi Dashboard Download Pdf
The following slide depicts the project implementation techniques tracker to analyse issues in execution. It also includes key performance indicators such as tasks, progress, schedule, cost, workload, overall health etc. Pitch your topic with ease and precision using this Project Execution Strategy Development Monitoring With Kpi Dashboard Download Pdf. This layout presents information on Project Execution, Strategy Development, Monitoring Kpi Dashboard. It is also available for immediate download and adjustment. So, changes can be made in the color, design, graphics or any other component to create a unique layout. The following slide depicts the project implementation techniques tracker to analyse issues in execution. It also includes key performance indicators such as tasks, progress, schedule, cost, workload, overall health etc.
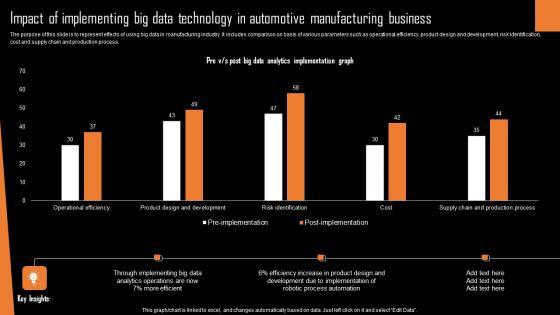
Impact Of Implementing Big Data Technology In Automotive Manufacturing Business Guidelines Pdf
The purpose of this slide is to represent effects of using big data in manufacturing industry. It includes comparison on basis of various parameters such as operational efficiency, product design and development, risk identification, cost and supply chain and production process.Showcasing this set of slides titled Impact Of Implementing Big Data Technology In Automotive Manufacturing Business Guidelines Pdf The topics addressed in these templates are Through Implementing, Process Automation, Development Due Implementation All the content presented in this PPT design is completely editable. Download it and make adjustments in color, background, font etc. as per your unique business setting. The purpose of this slide is to represent effects of using big data in manufacturing industry. It includes comparison on basis of various parameters such as operational efficiency, product design and development, risk identification, cost and supply chain and production process.
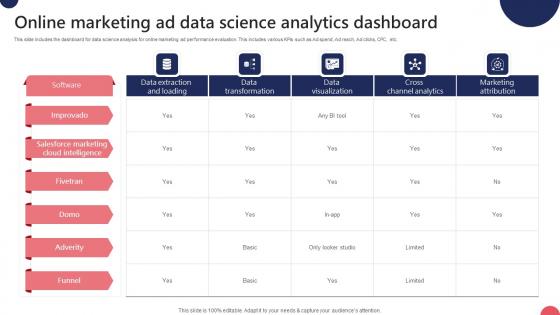
Online Marketing Ad Data Science Analytics Dashboard Ppt Inspiration Guidelines Pdf
This slide includes the dashboard for data science analysis for online marketing ad performance evaluation. This includes various KPIs such as Ad spend, Ad reach, Ad clicks, CPC, etc. Pitch your topic with ease and precision using this Online Marketing Ad Data Science Analytics Dashboard Ppt Inspiration Guidelines Pdf. This layout presents information on Ad Spend, Cost Per Thousand, Cost Per Click. It is also available for immediate download and adjustment. So, changes can be made in the color, design, graphics or any other component to create a unique layout. This slide includes the dashboard for data science analysis for online marketing ad performance evaluation. This includes various KPIs such as Ad spend, Ad reach, Ad clicks, CPC, etc.
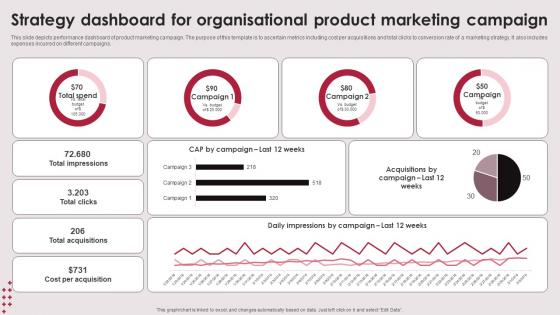
Strategy Dashboard For Organisational Product Marketing Campaign Elements Pdf
This slide depicts performance dashboard of product marketing campaign. The purpose of this template is to ascertain metrics including cost per acquisitions and total clicks to conversion rate of a marketing strategy. It also includes expenses incurred on different campaigns. Pitch your topic with ease and precision using this Strategy Dashboard For Organisational Product Marketing Campaign Elements PDF. This layout presents information on Strategy Dashboard, Organisational Product, Marketing Campaign. It is also available for immediate download and adjustment. So, changes can be made in the color, design, graphics or any other component to create a unique layout. This slide depicts performance dashboard of product marketing campaign. The purpose of this template is to ascertain metrics including cost per acquisitions and total clicks to conversion rate of a marketing strategy. It also includes expenses incurred on different campaigns.
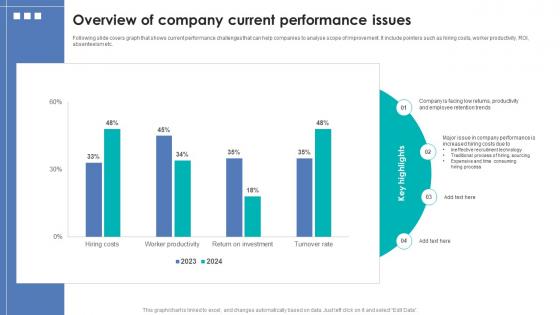
Integrating Automation For Effective Business Overview Of Company Current Performance Issues
Following slide covers graph that shows current performance challenges that can help companies to analyse scope of improvement. It include pointers such as hiring costs, worker productivity, ROI, absenteeism etc. Explore a selection of the finest Integrating Automation For Effective Business Overview Of Company Current Performance Issues here. With a plethora of professionally designed and pre-made slide templates, you can quickly and easily find the right one for your upcoming presentation. You can use our Integrating Automation For Effective Business Overview Of Company Current Performance Issues to effectively convey your message to a wider audience. Slidegeeks has done a lot of research before preparing these presentation templates. The content can be personalized and the slides are highly editable. Grab templates today from Slidegeeks. Following slide covers graph that shows current performance challenges that can help companies to analyse scope of improvement. It include pointers such as hiring costs, worker productivity, ROI, absenteeism etc.
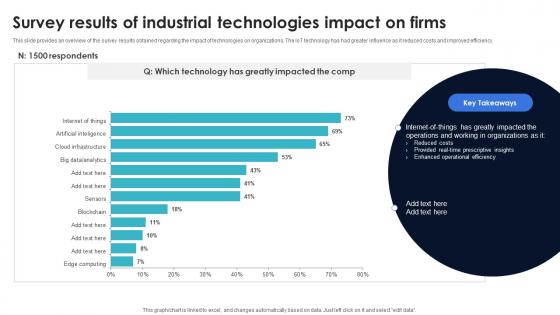
Optimization Of IoT Remote Monitoring Survey Results Of Industrial Technologies Impact On Firms IoT SS V
This slide provides an overview of the survey results obtained regarding the impact of technologies on organizations. The IoT technology has had greater influence as it reduced costs and improved efficiency. There are so many reasons you need a Optimization Of IoT Remote Monitoring Survey Results Of Industrial Technologies Impact On Firms IoT SS V. The first reason is you can not spend time making everything from scratch, Thus, Slidegeeks has made presentation templates for you too. You can easily download these templates from our website easily. This slide provides an overview of the survey results obtained regarding the impact of technologies on organizations. The IoT technology has had greater influence as it reduced costs and improved efficiency.
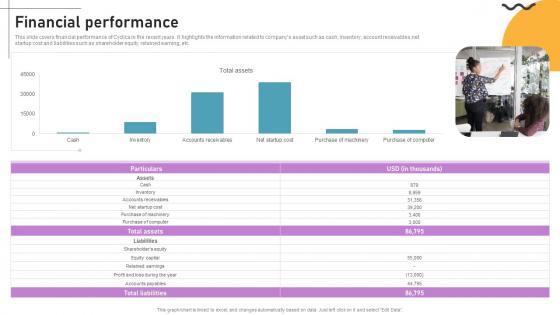
Financial Performance Cloud Based Predictive Analytics Software Pitch Deck
This slide covers financial performance of Cyclica in the recent years. It highlights the information related to companys asset such as cash, inventory, account receivables,net startup cost and liabilities such as shareholder equity, retained earning, etc. From laying roadmaps to briefing everything in detail, our templates are perfect for you. You can set the stage with your presentation slides. All you have to do is download these easy-to-edit and customizable templates. Financial Performance Cloud Based Predictive Analytics Software Pitch Deck will help you deliver an outstanding performance that everyone would remember and praise you for. Do download this presentation today. This slide covers financial performance of Cyclica in the recent years. It highlights the information related to companys asset such as cash, inventory, account receivables,net startup cost and liabilities such as shareholder equity, retained earning, etc.
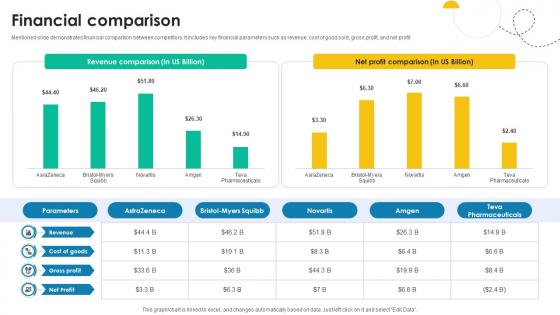
Financial Comparison Medical Research And Development Company Profile CP SS V
Mentioned slide demonstrates financial comparison between competitors. It includes key financial parameters such as revenue, cost of good sold, gross profit, and net profit. Are you in need of a template that can accommodate all of your creative concepts This one is crafted professionally and can be altered to fit any style. Use it with Google Slides or PowerPoint. Include striking photographs, symbols, depictions, and other visuals. Fill, move around, or remove text boxes as desired. Test out color palettes and font mixtures. Edit and save your work, or work with colleagues. Download Financial Comparison Medical Research And Development Company Profile CP SS V and observe how to make your presentation outstanding. Give an impeccable presentation to your group and make your presentation unforgettable. Mentioned slide demonstrates financial comparison between competitors. It includes key financial parameters such as revenue, cost of good sold, gross profit, and net profit.
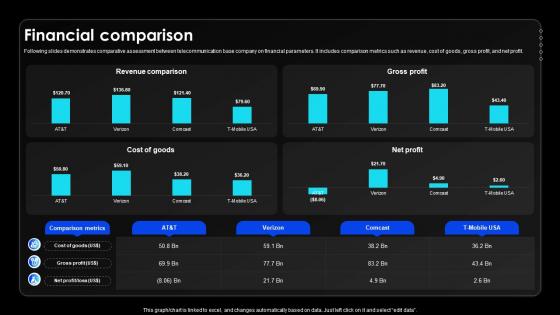
Financial Comparison Wireless Communication Services Provider Company Profile CP SS V
Following slides demonstrates comparative assessment between telecommunication base company on financial parameters. It includes comparison metrics such as revenue, cost of goods, gross profit, and net profit.If your project calls for a presentation, then Slidegeeks is your go-to partner because we have professionally designed, easy-to-edit templates that are perfect for any presentation. After downloading, you can easily edit Financial Comparison Wireless Communication Services Provider Company Profile CP SS V and make the changes accordingly. You can rearrange slides or fill them with different images. Check out all the handy templates Following slides demonstrates comparative assessment between telecommunication base company on financial parameters. It includes comparison metrics such as revenue, cost of goods, gross profit, and net profit.
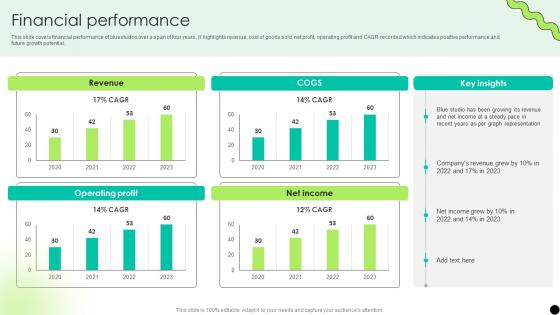
Financial Performance Digital Payment Platform Pitch Deck
This slide covers financial performance of bluestudios over a span of four years. It highlights revenue, cost of goods sold, net profit, operating profit and CAGR recorded which indicates positive performance and future growth potential. From laying roadmaps to briefing everything in detail, our templates are perfect for you. You can set the stage with your presentation slides. All you have to do is download these easy-to-edit and customizable templates. Financial Performance Digital Payment Platform Pitch Deck will help you deliver an outstanding performance that everyone would remember and praise you for. Do download this presentation today. This slide covers financial performance of bluestudios over a span of four years. It highlights revenue, cost of goods sold, net profit, operating profit and CAGR recorded which indicates positive performance and future growth potential.
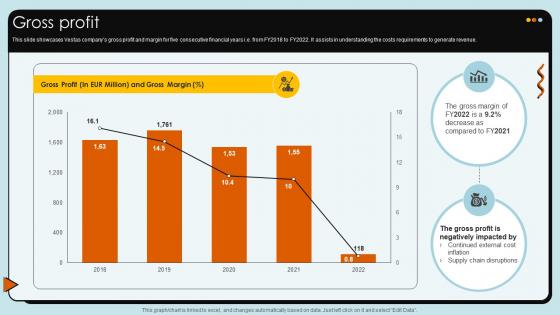
Gross Profit Wind Turbines Manufacturer Company Profile CP SS V
This slide showcases Vestas companys gross profit and margin for five consecutive financial years i.e. from FY2018 to FY2022. It assists in understanding the costs requirements to generate revenue.If your project calls for a presentation, then Slidegeeks is your go-to partner because we have professionally designed, easy-to-edit templates that are perfect for any presentation. After downloading, you can easily edit Gross Profit Wind Turbines Manufacturer Company Profile CP SS V and make the changes accordingly. You can rearrange slides or fill them with different images. Check out all the handy templates This slide showcases Vestas companys gross profit and margin for five consecutive financial years i.e. from FY2018 to FY2022. It assists in understanding the costs requirements to generate revenue.

Increasing Business Awareness Dashboard To Monitor Pay Per Click Advertising Strategy SS V
This slide represent a search engine marketing KPIs indicating crucial aspects of pay per click advertising. It includes metrics such as cost per conversion by month, overall spend, top keywords, monthly conversion and interaction by day. Get a simple yet stunning designed Increasing Business Awareness Dashboard To Monitor Pay Per Click Advertising Strategy SS V. It is the best one to establish the tone in your meetings. It is an excellent way to make your presentations highly effective. So, download this PPT today from Slidegeeks and see the positive impacts. Our easy-to-edit Increasing Business Awareness Dashboard To Monitor Pay Per Click Advertising Strategy SS V can be your go-to option for all upcoming conferences and meetings. So, what are you waiting for Grab this template today. This slide represent a search engine marketing KPIs indicating crucial aspects of pay per click advertising. It includes metrics such as cost per conversion by month, overall spend, top keywords, monthly conversion and interaction by day.
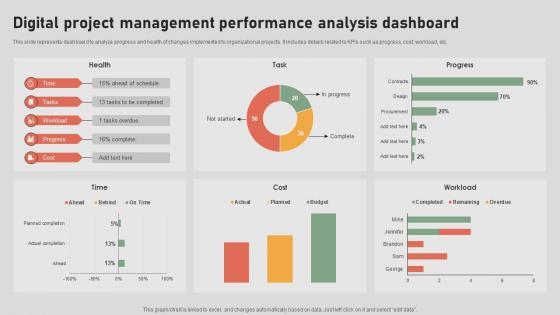
The Digital Project Managers Digital Project Management Performance Analysis Dashboard
This slide represents dashboard to analyze progress and health of changes implemented to organizational projects. It includes details related to KPIs such as progress, cost, workload, etc. Are you in need of a template that can accommodate all of your creative concepts This one is crafted professionally and can be altered to fit any style. Use it with Google Slides or PowerPoint. Include striking photographs, symbols, depictions, and other visuals. Fill, move around, or remove text boxes as desired. Test out color palettes and font mixtures. Edit and save your work, or work with colleagues. Download The Digital Project Managers Digital Project Management Performance Analysis Dashboard and observe how to make your presentation outstanding. Give an impeccable presentation to your group and make your presentation unforgettable. This slide represents dashboard to analyze progress and health of changes implemented to organizational projects. It includes details related to KPIs such as progress, cost, workload, etc.
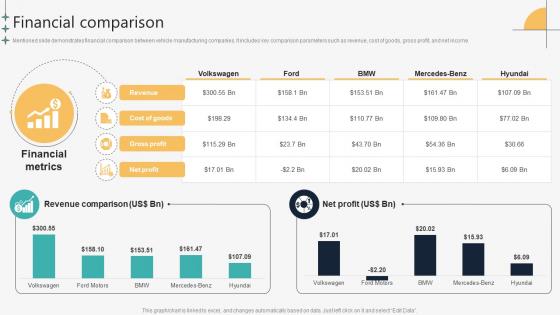
Financial Comparison Automotive Manufacturing Company Profile CP SS V
Mentioned slide demonstrates financial comparison between vehicle manufacturing companies. It includes key comparison parameters such as revenue, cost of goods, gross profit, and net income.Are you in need of a template that can accommodate all of your creative concepts This one is crafted professionally and can be altered to fit any style. Use it with Google Slides or PowerPoint. Include striking photographs, symbols, depictions, and other visuals. Fill, move around, or remove text boxes as desired. Test out color palettes and font mixtures. Edit and save your work, or work with colleagues. Download Financial Comparison Automotive Manufacturing Company Profile CP SS V and observe how to make your presentation outstanding. Give an impeccable presentation to your group and make your presentation unforgettable. Mentioned slide demonstrates financial comparison between vehicle manufacturing companies. It includes key comparison parameters such as revenue, cost of goods, gross profit, and net income.
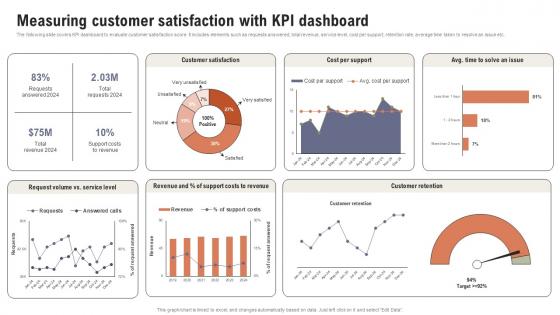
Measuring Customer Satisfaction With KPI Boosting Customer Retention Rate With Live Chat
The following slide covers KPI dashboard to evaluate customer satisfaction score. It includes elements such as requests answered, total revenue, service level, cost per support, retention rate, average time taken to resolve an issue etc. This modern and well-arranged Measuring Customer Satisfaction With KPI Boosting Customer Retention Rate With Live Chat provides lots of creative possibilities. It is very simple to customize and edit with the Powerpoint Software. Just drag and drop your pictures into the shapes. All facets of this template can be edited with Powerpoint, no extra software is necessary. Add your own material, put your images in the places assigned for them, adjust the colors, and then you can show your slides to the world, with an animated slide included. The following slide covers KPI dashboard to evaluate customer satisfaction score. It includes elements such as requests answered, total revenue, service level, cost per support, retention rate, average time taken to resolve an issue etc.
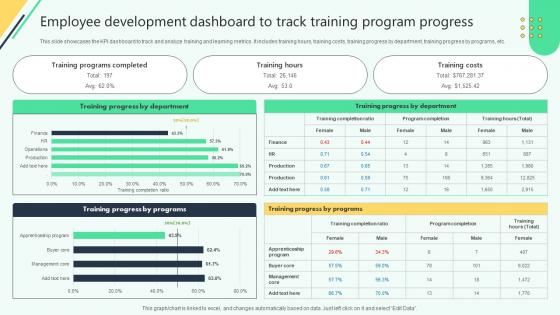
Employee Development Dashboard To Track Training Analysing Hr Data For Effective Decision Making
This slide showcases the KPI dashboard to track and analyze training and learning metrics. It includes training hours, training costs, training progress by department, training progress by programs, etc. Are you in need of a template that can accommodate all of your creative concepts This one is crafted professionally and can be altered to fit any style. Use it with Google Slides or PowerPoint. Include striking photographs, symbols, depictions, and other visuals. Fill, move around, or remove text boxes as desired. Test out color palettes and font mixtures. Edit and save your work, or work with colleagues. Download Employee Development Dashboard To Track Training Analysing Hr Data For Effective Decision Making and observe how to make your presentation outstanding. Give an impeccable presentation to your group and make your presentation unforgettable. This slide showcases the KPI dashboard to track and analyze training and learning metrics. It includes training hours, training costs, training progress by department, training progress by programs, etc.

Hr Recruitment Dashboard Showcasing Open Positions By Analysing Hr Data For Effective Decision Making
This slide showcases a dashboard that helps organizations track and monitor the hiring process. It includes total applicants, shortlisted candidates, hired candidates, rejected candidates, time to hire, cost to hire, etc. The Hr Recruitment Dashboard Showcasing Open Positions By Analysing Hr Data For Effective Decision Making is a compilation of the most recent design trends as a series of slides. It is suitable for any subject or industry presentation, containing attractive visuals and photo spots for businesses to clearly express their messages. This template contains a variety of slides for the user to input data, such as structures to contrast two elements, bullet points, and slides for written information. Slidegeeks is prepared to create an impression. This slide showcases a dashboard that helps organizations track and monitor the hiring process. It includes total applicants, shortlisted candidates, hired candidates, rejected candidates, time to hire, cost to hire, etc.
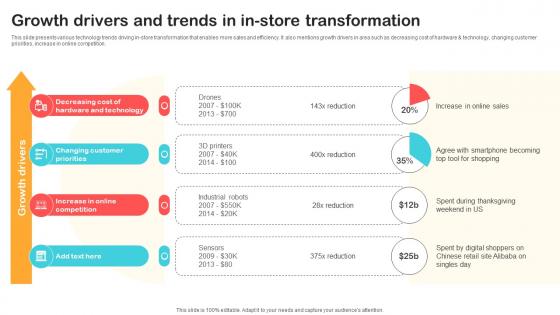
Growth Drivers And Trends In In Store Transformation Optimizing Retail Operations With Digital DT SS V
This slide presents various technology trends driving in-store transformation that enables more sales and efficiency. It also mentions growth drivers in area such as decreasing cost of hardware and technology, changing customer priorities, increase in online competition.Take your projects to the next level with our ultimate collection of Growth Drivers And Trends In In Store Transformation Optimizing Retail Operations With Digital DT SS V. Slidegeeks has designed a range of layouts that are perfect for representing task or activity duration, keeping track of all your deadlines at a glance. Tailor these designs to your exact needs and give them a truly corporate look with your own brand colors they will make your projects stand out from the rest This slide presents various technology trends driving in-store transformation that enables more sales and efficiency. It also mentions growth drivers in area such as decreasing cost of hardware and technology, changing customer priorities, increase in online competition.
B2B Marketing Techniques Dashboard For Tracking Social Media Marketing Campaign
This slide showcases social media marketing campaign performance tracking dashboard which helps identify most profitable advertising channel. It provides information regarding KPIs such as impressions, likes, comments, shares, clicks, followers, cost er sessions etc. This modern and well-arranged B2B Marketing Techniques Dashboard For Tracking Social Media Marketing Campaign provides lots of creative possibilities. It is very simple to customize and edit with the Powerpoint Software. Just drag and drop your pictures into the shapes. All facets of this template can be edited with Powerpoint, no extra software is necessary. Add your own material, put your images in the places assigned for them, adjust the colors, and then you can show your slides to the world, with an animated slide included. This slide showcases social media marketing campaign performance tracking dashboard which helps identify most profitable advertising channel. It provides information regarding KPIs such as impressions, likes, comments, shares, clicks, followers, cost er sessions etc.
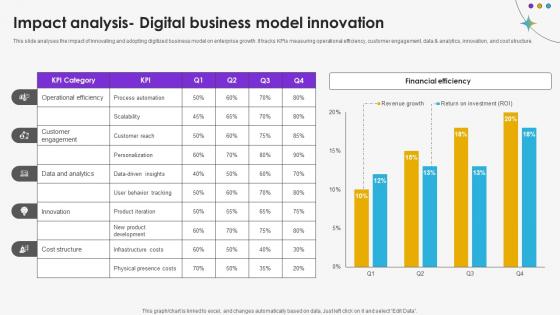
Impact Analysis Digital Business Model Innovation DT SS V
This slide analyses the impact of innovating and adopting digitized business model on enterprise growth. It tracks KPIs measuring operational efficiency, customer engagement, data and analytics, innovation, and cost structure.Do you have an important presentation coming up Are you looking for something that will make your presentation stand out from the rest Look no further than Impact Analysis Digital Business Model Innovation DT SS V. With our professional designs, you can trust that your presentation will pop and make delivering it a smooth process. And with Slidegeeks, you can trust that your presentation will be unique and memorable. So why wait Grab Impact Analysis Digital Business Model Innovation DT SS V today and make your presentation stand out from the rest. This slide analyses the impact of innovating and adopting digitized business model on enterprise growth. It tracks KPIs measuring operational efficiency, customer engagement, data and analytics, innovation, and cost structure.
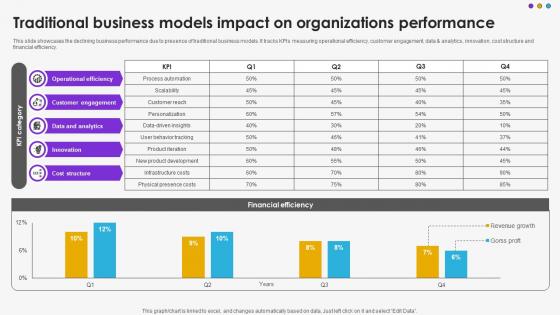
Traditional Business Models Impact On Organizations Performance DT SS V
This slide showcases the declining business performance due to presence of traditional business models. It tracks KPIs measuring operational efficiency, customer engagement, data and analytics, innovation, cost structure and financial efficiency.Do you have an important presentation coming up Are you looking for something that will make your presentation stand out from the rest Look no further than Traditional Business Models Impact On Organizations Performance DT SS V. With our professional designs, you can trust that your presentation will pop and make delivering it a smooth process. And with Slidegeeks, you can trust that your presentation will be unique and memorable. So why wait Grab Traditional Business Models Impact On Organizations Performance DT SS V today and make your presentation stand out from the rest This slide showcases the declining business performance due to presence of traditional business models. It tracks KPIs measuring operational efficiency, customer engagement, data and analytics, innovation, cost structure and financial efficiency.
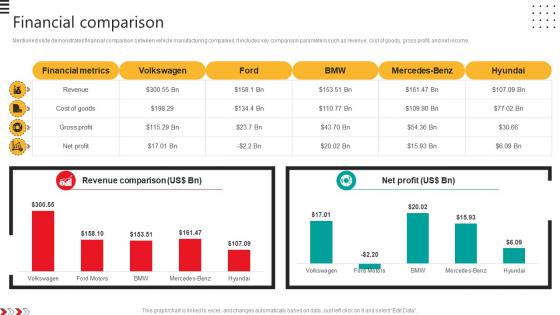
Financial Comparison Automobile Development Company Profile CP SS V
Mentioned slide demonstrates financial comparison between vehicle manufacturing companies. It includes key comparison parameters such as revenue, cost of goods, gross profit, and net income.Are you in need of a template that can accommodate all of your creative concepts This one is crafted professionally and can be altered to fit any style. Use it with Google Slides or PowerPoint. Include striking photographs, symbols, depictions, and other visuals. Fill, move around, or remove text boxes as desired. Test out color palettes and font mixtures. Edit and save your work, or work with colleagues. Download Financial Comparison Automobile Development Company Profile CP SS V and observe how to make your presentation outstanding. Give an impeccable presentation to your group and make your presentation unforgettable. Mentioned slide demonstrates financial comparison between vehicle manufacturing companies. It includes key comparison parameters such as revenue, cost of goods, gross profit, and net income.
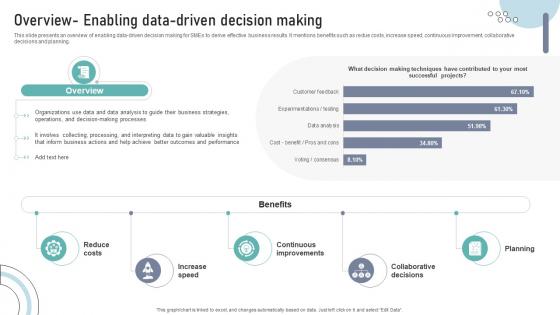
Overview Enabling Data Driven Decision Making DT SS V
This slide presents an overview of enabling data-driven decision making for SMEs to derive effective business results. It mentions benefits such as redue costs, increase speed, continuous improvement, collaborative decisions and planning.Crafting an eye-catching presentation has never been more straightforward. Let your presentation shine with this tasteful yet straightforward Overview Enabling Data Driven Decision Making DT SS V template. It offers a minimalistic and classy look that is great for making a statement. The colors have been employed intelligently to add a bit of playfulness while still remaining professional. Construct the ideal Overview Enabling Data Driven Decision Making DT SS V that effortlessly grabs the attention of your audience Begin now and be certain to wow your customers This slide presents an overview of enabling data-driven decision making for SMEs to derive effective business results. It mentions benefits such as redue costs, increase speed, continuous improvement, collaborative decisions and planning.

Visionary Guide To Blockchain Introduction To Cybersecurity Using Blockchain BCT SS V
This slide provides an overview of enhancing cybersecurity using blockchain technology integration and its key facts. Facts include reduction in costs, key enablers and influence on smart contracts. Slidegeeks has constructed Visionary Guide To Blockchain Introduction To Cybersecurity Using Blockchain BCT SS V after conducting extensive research and examination. These presentation templates are constantly being generated and modified based on user preferences and critiques from editors. Here, you will find the most attractive templates for a range of purposes while taking into account ratings and remarks from users regarding the content. This is an excellent jumping-off point to explore our content and will give new users an insight into our top-notch PowerPoint Templates. This slide provides an overview of enhancing cybersecurity using blockchain technology integration and its key facts. Facts include reduction in costs, key enablers and influence on smart contracts.

Perform Comprehensive Keyword Research Top Of The Funnel Digital Content Strategy SS V
The following slide represents key outcomes of detailed keyword research to direct efforts to fulfill customer demand. It includes elements such as volume, intent, results, keyword variation, keyword difficulty, cost per click CPC etc. Take your projects to the next level with our ultimate collection of Perform Comprehensive Keyword Research Top Of The Funnel Digital Content Strategy SS V. Slidegeeks has designed a range of layouts that are perfect for representing task or activity duration, keeping track of all your deadlines at a glance. Tailor these designs to your exact needs and give them a truly corporate look with your own brand colors they will make your projects stand out from the rest The following slide represents key outcomes of detailed keyword research to direct efforts to fulfill customer demand. It includes elements such as volume, intent, results, keyword variation, keyword difficulty, cost per click CPC etc.

Graph Illustrating Impact Of Prescriptive Analytics Data Analytics SS V
This slide showcases graph highlighting impact analysis of prescriptive analytics on businesses via use of major performance indicators. It provides information total revenue, inventory levels and labour costs with key insights.Take your projects to the next level with our ultimate collection of Graph Illustrating Impact Of Prescriptive Analytics Data Analytics SS V. Slidegeeks has designed a range of layouts that are perfect for representing task or activity duration, keeping track of all your deadlines at a glance. Tailor these designs to your exact needs and give them a truly corporate look with your own brand colors they will make your projects stand out from the rest This slide showcases graph highlighting impact analysis of prescriptive analytics on businesses via use of major performance indicators. It provides information total revenue, inventory levels and labour costs with key insights.
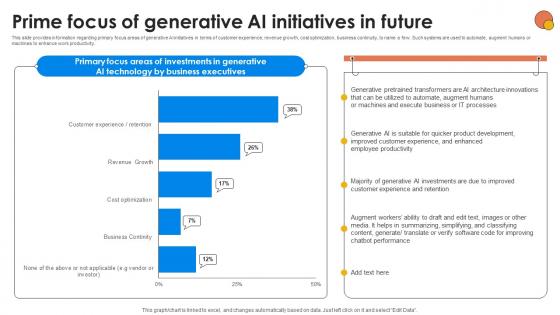
Prime Focus Of Generative AI Initiatives Generative AI For Better Productivity AI SS V
This slide provides information regarding primary focus areas of generative AI initiatives in terms of customer experience, revenue growth, cost optimization, business continuity, to name a few. Such systems are used to automate, augment humans or machines to enhance work productivity. Want to ace your presentation in front of a live audience Our Prime Focus Of Generative AI Initiatives Generative AI For Better Productivity AI SS V can help you do that by engaging all the users towards you. Slidegeeks experts have put their efforts and expertise into creating these impeccable powerpoint presentations so that you can communicate your ideas clearly. Moreover, all the templates are customizable, and easy-to-edit and downloadable. Use these for both personal and commercial use. This slide provides information regarding primary focus areas of generative AI initiatives in terms of customer experience, revenue growth, cost optimization, business continuity, to name a few. Such systems are used to automate, augment humans or machines to enhance work productivity.
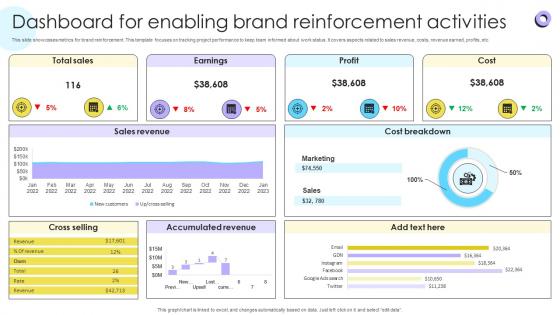
Dashboard For Enabling Brand Reinforcement Encouraging Repetitive Customer Purchase Ppt Slide
This slide showcases metrics for brand reinforcement. This template focuses on tracking project performance to keep team informed about work status. It covers aspects related to sales revenue, costs, revenue earned, profits, etc. From laying roadmaps to briefing everything in detail, our templates are perfect for you. You can set the stage with your presentation slides. All you have to do is download these easy-to-edit and customizable templates. Dashboard For Enabling Brand Reinforcement Encouraging Repetitive Customer Purchase Ppt Slide will help you deliver an outstanding performance that everyone would remember and praise you for. Do download this presentation today. This slide showcases metrics for brand reinforcement. This template focuses on tracking project performance to keep team informed about work status. It covers aspects related to sales revenue, costs, revenue earned, profits, etc.
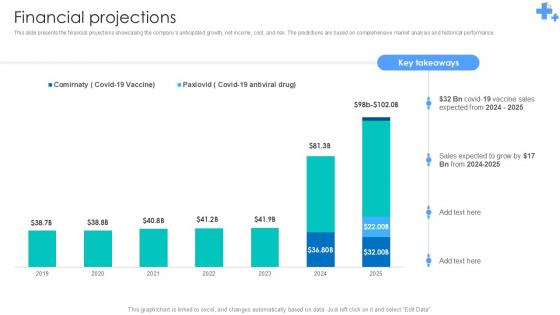
Financial Projections Undergoing Pharmaceutical Revolution Ppt Presentation BMC SS V
This slide presents the financial projections showcasing the companys anticipated growth, net income, cost, and risk. The predictions are based on comprehensive market analysis and historical performance. This Financial Projections Undergoing Pharmaceutical Revolution Ppt Presentation BMC SS V is perfect for any presentation, be it in front of clients or colleagues. It is a versatile and stylish solution for organizing your meetings. The Financial Projections Undergoing Pharmaceutical Revolution Ppt Presentation BMC SS V features a modern design for your presentation meetings. The adjustable and customizable slides provide unlimited possibilities for acing up your presentation. Slidegeeks has done all the homework before launching the product for you. So, do not wait, grab the presentation templates today This slide presents the financial projections showcasing the companys anticipated growth, net income, cost, and risk. The predictions are based on comprehensive market analysis and historical performance.
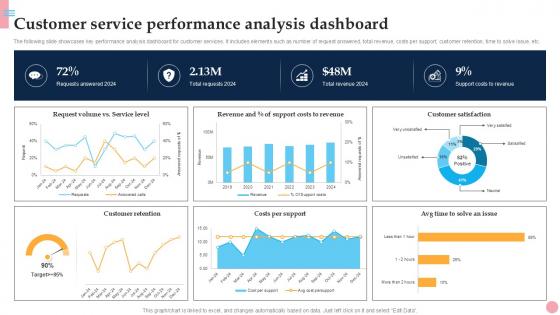
Customer Service Performance How To Improve Company PPT Sample Strategy SS V
The following slide showcases key performance analysis dashboard for customer services. It includes elements such as number of request answered, total revenue, costs per support, customer retention, time to solve issue, etc. Slidegeeks is here to make your presentations a breeze with Customer Service Performance How To Improve Company PPT Sample Strategy SS V With our easy-to-use and customizable templates, you can focus on delivering your ideas rather than worrying about formatting. With a variety of designs to choose from, you are sure to find one that suits your needs. And with animations and unique photos, illustrations, and fonts, you can make your presentation pop. So whether you are giving a sales pitch or presenting to the board, make sure to check out Slidegeeks first The following slide showcases key performance analysis dashboard for customer services. It includes elements such as number of request answered, total revenue, costs per support, customer retention, time to solve issue, etc.

Measuring Customer Satisfaction Improving Customer Retention PPT Template
The following slide covers KPI dashboard to evaluate customer satisfaction score. It includes elements such as requests answered, total revenue, service level, cost per support, retention rate, average time taken to resolve an issue etc. This modern and well-arranged Measuring Customer Satisfaction Improving Customer Retention PPT Template provides lots of creative possibilities. It is very simple to customize and edit with the Powerpoint Software. Just drag and drop your pictures into the shapes. All facets of this template can be edited with Powerpoint, no extra software is necessary. Add your own material, put your images in the places assigned for them, adjust the colors, and then you can show your slides to the world, with an animated slide included. The following slide covers KPI dashboard to evaluate customer satisfaction score. It includes elements such as requests answered, total revenue, service level, cost per support, retention rate, average time taken to resolve an issue etc.
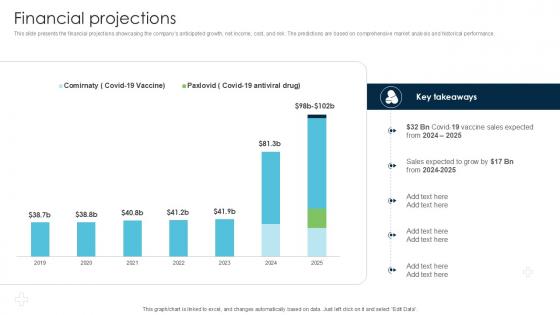
Financial Projections Strategies Driving Business Triumph Through Pfizer PPT Slide BMC SS V
This slide presents the financial projections showcasing the companys anticipated growth, net income, cost, and risk. The predictions are based on comprehensive market analysis and historical performance. This Financial Projections Strategies Driving Business Triumph Through Pfizer PPT Slide BMC SS V is perfect for any presentation, be it in front of clients or colleagues. It is a versatile and stylish solution for organizing your meetings. The Financial Projections Strategies Driving Business Triumph Through Pfizer PPT Slide BMC SS V features a modern design for your presentation meetings. The adjustable and customizable slides provide unlimited possibilities for acing up your presentation. Slidegeeks has done all the homework before launching the product for you. So, do not wait, grab the presentation templates today This slide presents the financial projections showcasing the companys anticipated growth, net income, cost, and risk. The predictions are based on comprehensive market analysis and historical performance.
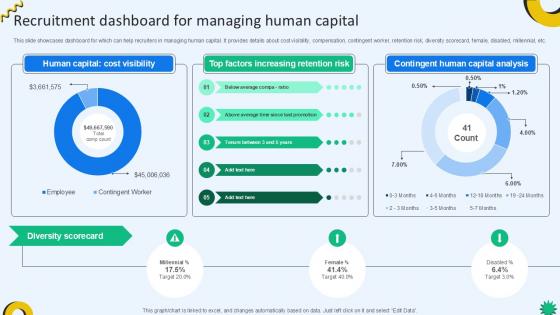
Recruitment Dashboard For Managing Cloud Recruiting Technologies PPT Example
This slide showcases dashboard for which can help recruiters in managing human capital. It provides details about cost visibility, compensation, contingent worker, retention risk, diversity scorecard, female, disabled, millennial, etc. The Recruitment Dashboard For Managing Cloud Recruiting Technologies PPT Example is a compilation of the most recent design trends as a series of slides. It is suitable for any subject or industry presentation, containing attractive visuals and photo spots for businesses to clearly express their messages. This template contains a variety of slides for the user to input data, such as structures to contrast two elements, bullet points, and slides for written information. Slidegeeks is prepared to create an impression. This slide showcases dashboard for which can help recruiters in managing human capital. It provides details about cost visibility, compensation, contingent worker, retention risk, diversity scorecard, female, disabled, millennial, etc.
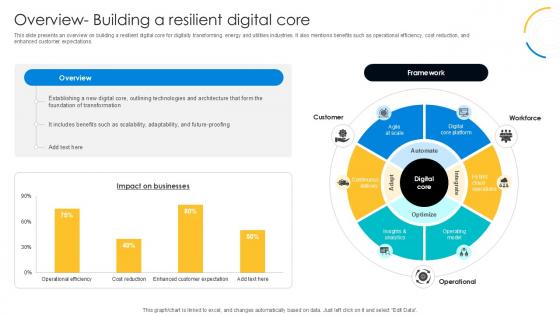
Overview Building A Resilient Digital Transformation Journey PPT PowerPoint DT SS V
This slide presents an overview on building a resilient digital core for digitally transforming energy and utilities industries. It also mentions benefits such as operational efficiency, cost reduction, and enhanced customer expectations. This modern and well-arranged Digital Core Platform, Hybrid Cloud Operations, Operating Model provides lots of creative possibilities. It is very simple to customize and edit with the Powerpoint Software. Just drag and drop your pictures into the shapes. All facets of this template can be edited with Powerpoint, no extra software is necessary. Add your own material, put your images in the places assigned for them, adjust the colors, and then you can show your slides to the world, with an animated slide included. This slide presents an overview on building a resilient digital core for digitally transforming energy and utilities industries. It also mentions benefits such as operational efficiency, cost reduction, and enhanced customer expectations.
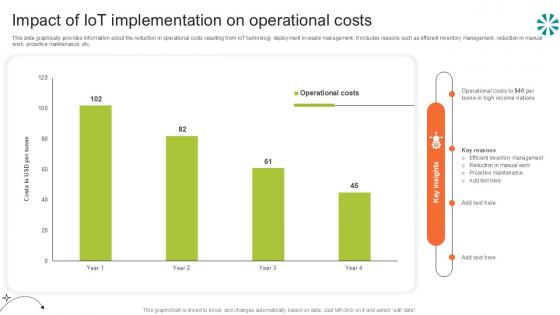
Impact Of Iot Implementation Step By Step Guide For Electronic Ppt PowerPoint
This slide graphically provides information about the reduction in operational costs resulting from IoT technology deployment in waste management. It includes reasons such as efficient inventory management, reduction in manual work, proactive maintenance, etc.Crafting an eye-catching presentation has never been more straightforward. Let your presentation shine with this tasteful yet straightforward Impact Of Iot Implementation Step By Step Guide For Electronic Ppt PowerPoint template. It offers a minimalistic and classy look that is great for making a statement. The colors have been employed intelligently to add a bit of playfulness while still remaining professional. Construct the ideal Impact Of Iot Implementation Step By Step Guide For Electronic Ppt PowerPoint that effortlessly grabs the attention of your audience Begin now and be certain to wow your customers This slide graphically provides information about the reduction in operational costs resulting from IoT technology deployment in waste management. It includes reasons such as efficient inventory management, reduction in manual work, proactive maintenance, etc.

Measuring Customer Satisfaction Enhancing Customer Experience Ppt Sample
The following slide covers KPI dashboard to evaluate customer satisfaction score. It includes elements such as requests answered, total revenue, service level, cost per support, retention rate, average time taken to resolve an issue etc. This modern and well-arranged Measuring Customer Satisfaction Enhancing Customer Experience Ppt Sample provides lots of creative possibilities. It is very simple to customize and edit with the Powerpoint Software. Just drag and drop your pictures into the shapes. All facets of this template can be edited with Powerpoint, no extra software is necessary. Add your own material, put your images in the places assigned for them, adjust the colors, and then you can show your slides to the world, with an animated slide included. The following slide covers KPI dashboard to evaluate customer satisfaction score. It includes elements such as requests answered, total revenue, service level, cost per support, retention rate, average time taken to resolve an issue etc.
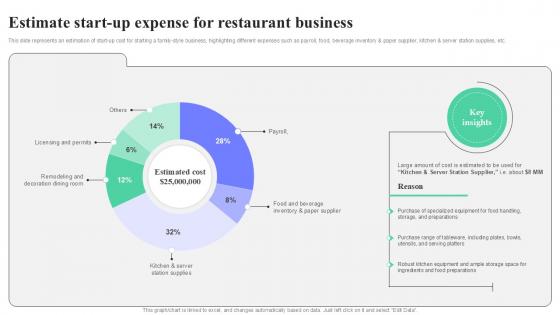
Estimate Start Up Expense For Restaurant Business Strategic Guide To Launching Ppt Sample
This slide represents an estimation of start-up cost for starting a family-style business, highlighting different expenses such as payroll, food, beverage inventory and paper supplier, kitchen and server station supplies, etc. Get a simple yet stunning designed Estimate Start Up Expense For Restaurant Business Strategic Guide To Launching Ppt Sample. It is the best one to establish the tone in your meetings. It is an excellent way to make your presentations highly effective. So, download this PPT today from Slidegeeks and see the positive impacts. Our easy-to-edit Estimate Start Up Expense For Restaurant Business Strategic Guide To Launching Ppt Sample can be your go-to option for all upcoming conferences and meetings. So, what are you waiting for Grab this template today. This slide represents an estimation of start-up cost for starting a family-style business, highlighting different expenses such as payroll, food, beverage inventory and paper supplier, kitchen and server station supplies, etc.
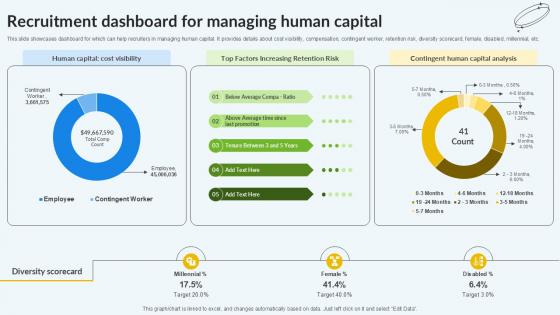
Recruitment Dashboard For Managing Human Capital PPT Example
This slide showcases dashboard for which can help recruiters in managing human capital. It provides details about cost visibility, compensation, contingent worker, retention risk, diversity scorecard, female, disabled, millennial, etc. The Recruitment Dashboard For Managing Human Capital PPT Example is a compilation of the most recent design trends as a series of slides. It is suitable for any subject or industry presentation, containing attractive visuals and photo spots for businesses to clearly express their messages. This template contains a variety of slides for the user to input data, such as structures to contrast two elements, bullet points, and slides for written information. Slidegeeks is prepared to create an impression. This slide showcases dashboard for which can help recruiters in managing human capital. It provides details about cost visibility, compensation, contingent worker, retention risk, diversity scorecard, female, disabled, millennial, etc.
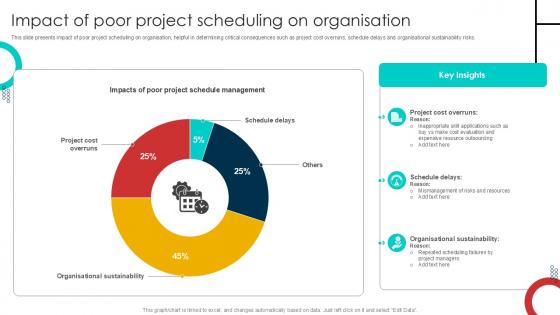
Impact Of Poor Project Scheduling On Schedule Management Techniques PPT Example
This slide presents impact of poor project scheduling on organisation, helpful in determining critical consequences such as project cost overruns, schedule delays and organisational sustainability risks. This Impact Of Poor Project Scheduling On Schedule Management Techniques PPT Example is perfect for any presentation, be it in front of clients or colleagues. It is a versatile and stylish solution for organizing your meetings. The Impact Of Poor Project Scheduling On Schedule Management Techniques PPT Example features a modern design for your presentation meetings. The adjustable and customizable slides provide unlimited possibilities for acing up your presentation. Slidegeeks has done all the homework before launching the product for you. So, do not wait, grab the presentation templates today This slide presents impact of poor project scheduling on organisation, helpful in determining critical consequences such as project cost overruns, schedule delays and organisational sustainability risks.
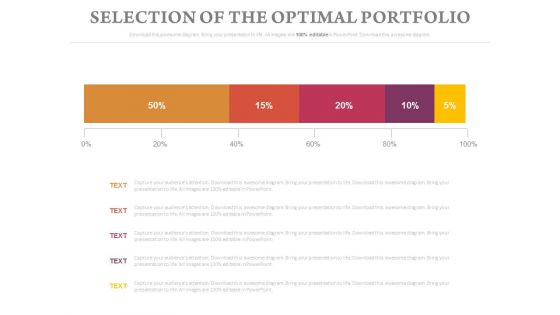
Selection Of The Optimal Portfolio Chart Ppt Slides
This is a selection of the optimal portfolio chart ppt slides. This is a five stage process. The stages in this process are business, finance, marketing.
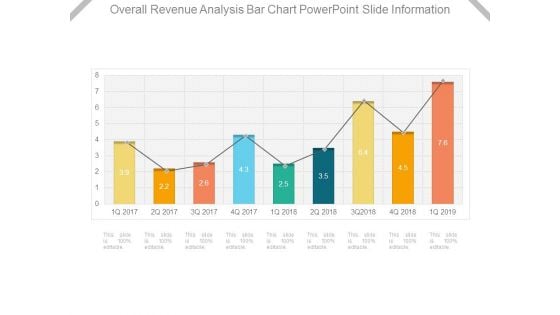
Overall Revenue Analysis Bar Chart Powerpoint Slide Information
This is a overall revenue analysis bar chart powerpoint slide information. This is a nine stage process. The stages in this process are finance, success, business, marketing, percentage.
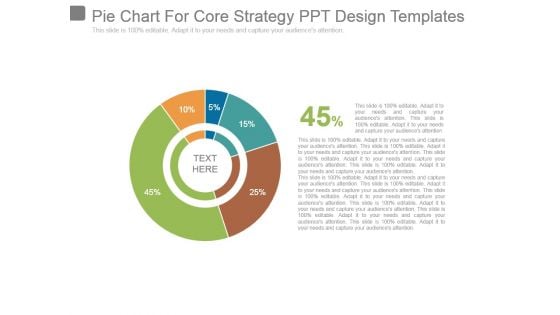
Pie Chart For Core Strategy Ppt Design Templates
This is a pie chart for core strategy ppt design templates. This is a five stage process. The stages in this process are business, marketing, strategy, finance, percentage.
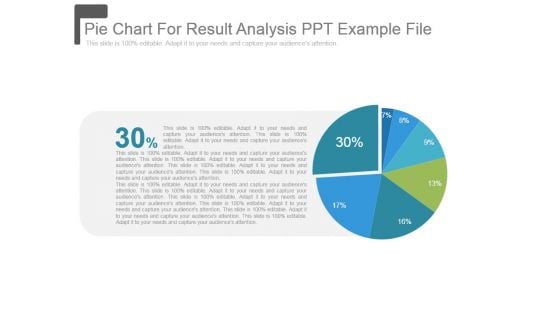
Pie Chart For Result Analysis Ppt Example File
This is a pie chart for result analysis ppt example file. This is a seven stage process. The stages in this process are pie, marketing, strategy, finance, percentage.
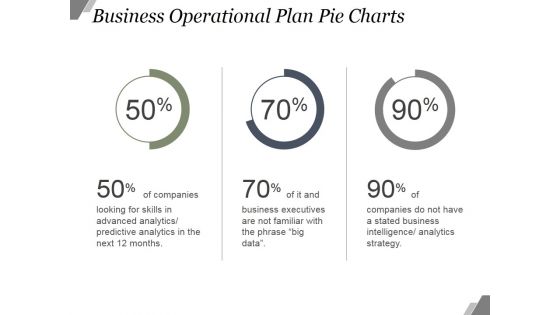
Business Operational Plan Pie Charts Ppt PowerPoint Presentation Templates
This is a business operational plan pie charts ppt powerpoint presentation templates. This is a three stage process. The stages in this process are finance, business, marketing, percentage.
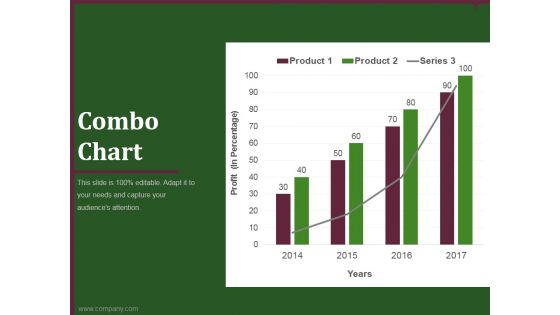
combo chart template 1 ppt powerpoint presentation show
This is a combo chart template 1 ppt powerpoint presentation show. This is a four stage process. The stages in this process are business, marketing, finance, analysis, growth.
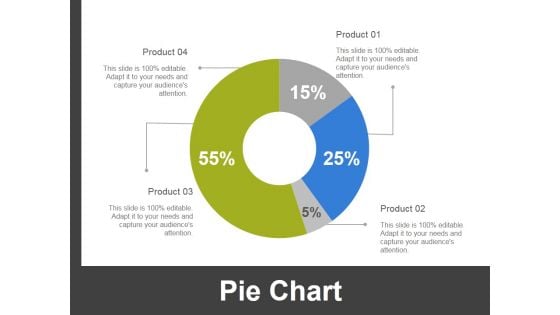
Pie Chart Ppt PowerPoint Presentation Infographic Template Deck
This is a pie chart ppt powerpoint presentation infographic template deck. This is a four stage process. The stages in this process are business, finance, marketing, strategy, analysis.
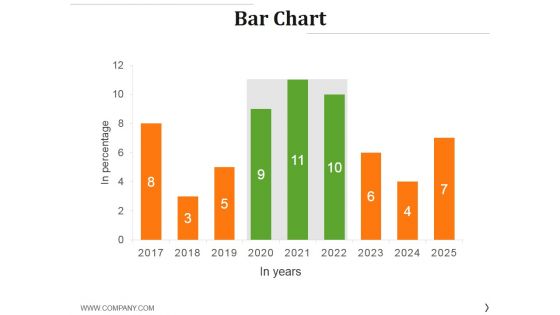
Bar Chart Ppt PowerPoint Presentation Styles Graphics Example
This is a bar chart ppt powerpoint presentation styles graphics example. This is a nine stage process. The stages in this process are graph, growth, success, business, finance.

Area Chart Ppt PowerPoint Presentation Show Graphic Images
This is a area chart ppt powerpoint presentation show graphic images. This is a two stage process. The stages in this process are business, marketing, management, finance, growth.
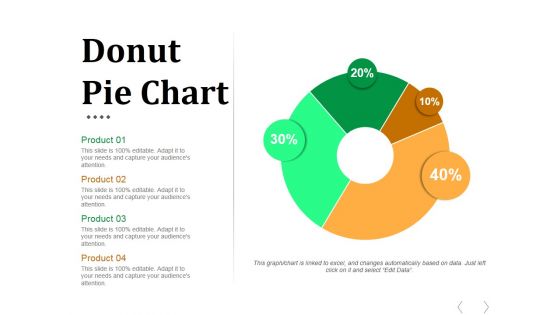
Donut Pie Chart Ppt PowerPoint Presentation Infographics Graphics
This is a donut pie chart ppt powerpoint presentation infographics graphics. This is a four stage process. The stages in this process are business, marketing, donut, finance, management.
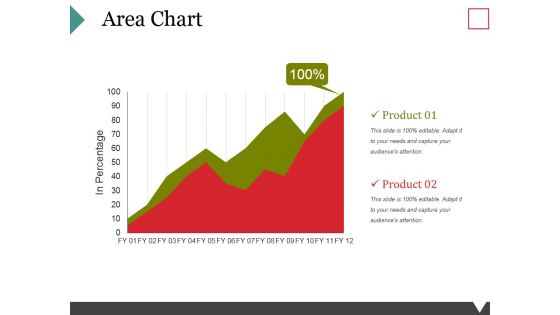
Area Chart Ppt PowerPoint Presentation Gallery Example Topics
This is a area chart ppt powerpoint presentation gallery example topics. This is a two stage process. The stages in this process are product, growth, finance, management, business.
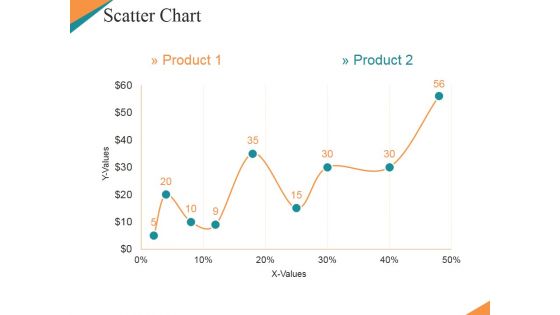
Scatter Chart Ppt PowerPoint Presentation Model Clipart Images
This is a scatter chart ppt powerpoint presentation model clipart images. This is a nine stage process. The stages in this process are finance, management, strategy, marketing, business.

 Home
Home