Bank Icon
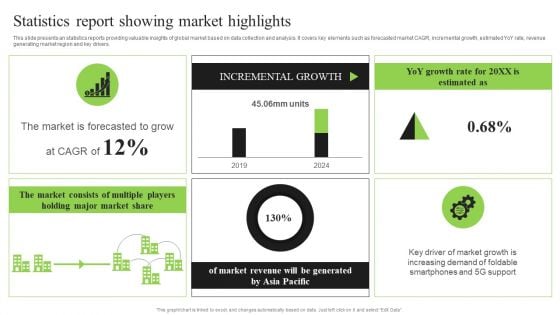
Guidebook For Executing Business Market Intelligence Statistics Report Showing Market Graphics PDF
This slide presents an statistics reports providing valuable insights of global market based on data collection and analysis. It covers key elements such as forecasted market CAGR, incremental growth, estimated YoY rate, revenue generating market region and key drivers. Do you have to make sure that everyone on your team knows about any specific topic I yes, then you should give Guidebook For Executing Business Market Intelligence Statistics Report Showing Market Graphics PDF a try. Our experts have put a lot of knowledge and effort into creating this impeccable Guidebook For Executing Business Market Intelligence Statistics Report Showing Market Graphics PDF. You can use this template for your upcoming presentations, as the slides are perfect to represent even the tiniest detail. You can download these templates from the Slidegeeks website and these are easy to edit. So grab these today.
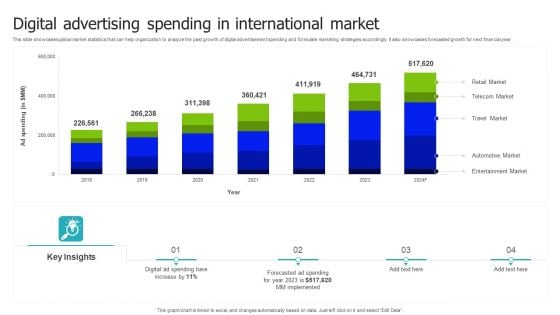
Digital Advertising Spending In International Market Demonstration PDF
This slide showcases global market statistics that can help organization to analyze the past growth of digital advertisement spending and formulate marketing strategies accordingly. It also showcases forecasted growth for next financial year. Showcasing this set of slides titled Digital Advertising Spending In International Market Demonstration PDF. The topics addressed in these templates are Retail Market, Telecom Market, Travel Market . All the content presented in this PPT design is completely editable. Download it and make adjustments in color, background, font etc. as per your unique business setting.
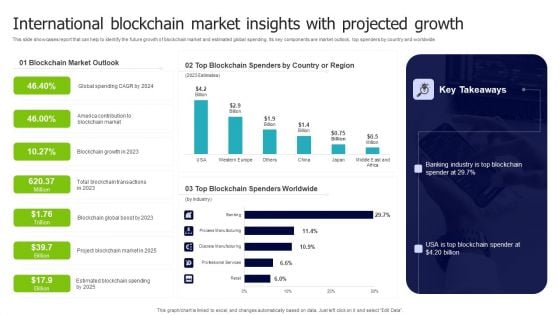
International Blockchain Market Insights With Projected Growth Microsoft PDF
This slide showcases report that can help to identify the future growth of blockchain market and estimated global spending. Its key components are market outlook, top spenders by country and worldwide. Showcasing this set of slides titled International Blockchain Market Insights With Projected Growth Microsoft PDF. The topics addressed in these templates are Blockchain Market Outlook, Blockchain Spenders, Country Region. All the content presented in this PPT design is completely editable. Download it and make adjustments in color, background, font etc. as per your unique business setting.
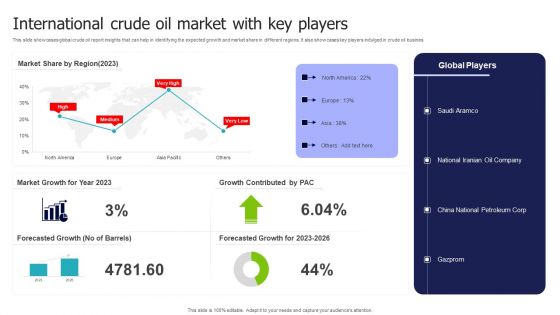
International Crude Oil Market With Key Players Demonstration PDF
This slide showcases global crude oil report insights that can help in identifying the expected growth and market share in different regions. It also showcases key players indulged in crude oil busines. Pitch your topic with ease and precision using this International Crude Oil Market With Key Players Demonstration PDF. This layout presents information on Market Share, Market Growth, Growth Contributed . It is also available for immediate download and adjustment. So, changes can be made in the color, design, graphics or any other component to create a unique layout.
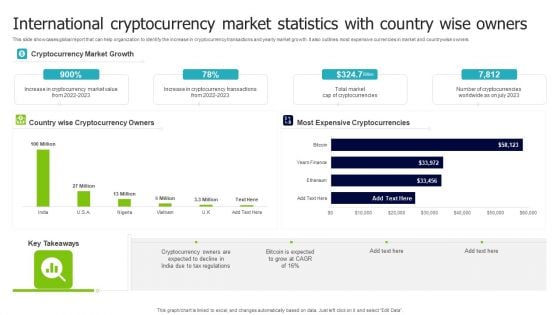
International Cryptocurrency Market Statistics With Country Wise Owners Formats PDF
This slide showcases global report that can help organization to identify the increase in cryptocurrency transactions and yearly market growth. It also outlines most expensive currencies in market and countrywise owners. Showcasing this set of slides titled International Cryptocurrency Market Statistics With Country Wise Owners Formats PDF. The topics addressed in these templates are Cryptocurrency Market Growth, Most Expensive Cryptocurrencies, Cryptocurrency Owners. All the content presented in this PPT design is completely editable. Download it and make adjustments in color, background, font etc. as per your unique business setting.

International Housing Market Trends With Key Drivers Inspiration PDF
This slide showcases global statistics that can help organizations to estimate the forecasted growth of housing market and identify stock by region. It also showcases key drivers contributing in new housing developments. Pitch your topic with ease and precision using this International Housing Market Trends With Key Drivers Inspiration PDF. This layout presents information on Key Drivers, Housing Market, Forecasted. It is also available for immediate download and adjustment. So, changes can be made in the color, design, graphics or any other component to create a unique layout.
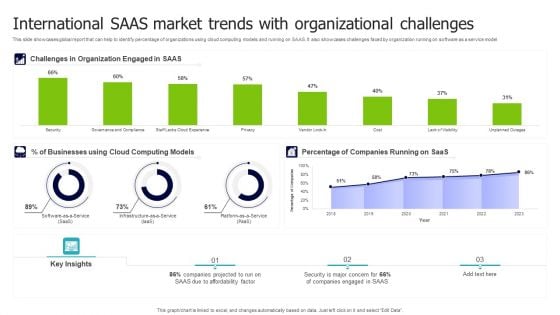
International SAAS Market Trends With Organizational Challenges Graphics PDF
This slide showcases global report that can help to identify percentage of organizations using cloud computing models and running on SAAS. It also showcases challenges faced by organization running on software as a service model. Showcasing this set of slides titled International SAAS Market Trends With Organizational Challenges Graphics PDF. The topics addressed in these templates are Challenges Organization, Businesses Using Cloud, Companies Running. All the content presented in this PPT design is completely editable. Download it and make adjustments in color, background, font etc. as per your unique business setting.
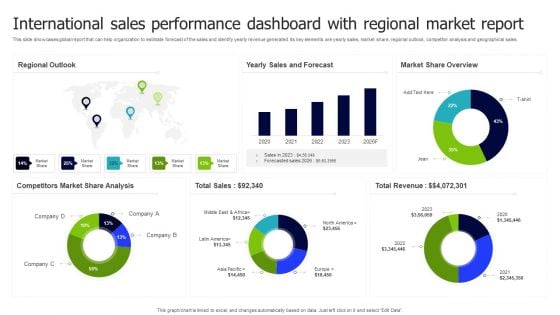
International Sales Performance Dashboard With Regional Market Report Inspiration PDF
This slide showcases global report that can help organization to estimate forecast of the sales and identify yearly revenue generated. Its key elements are yearly sales, market share, regional outlook, competitor analysis and geographical sales. Pitch your topic with ease and precision using this International Sales Performance Dashboard With Regional Market Report Inspiration PDF. This layout presents information on Regional Outlook, Sales And Forecast, Market Share Overview. It is also available for immediate download and adjustment. So, changes can be made in the color, design, graphics or any other component to create a unique layout.
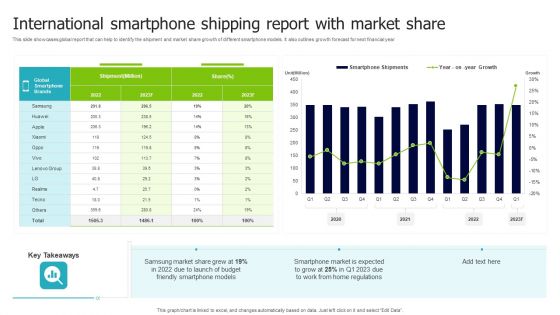
International Smartphone Shipping Report With Market Share Designs PDF
This slide showcases global report that can help to identify the shipment and market share growth of different smartphone models. It also outlines growth forecast for next financial year. Showcasing this set of slides titled International Smartphone Shipping Report With Market Share Designs PDF. The topics addressed in these templates are Shipment, Share, Global Smartphone Brands. All the content presented in this PPT design is completely editable. Download it and make adjustments in color, background, font etc. as per your unique business setting.
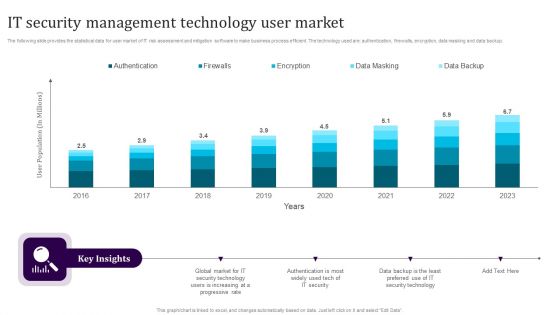
IT Security Management Technology User Market Guidelines PDF
The following slide provides the statistical data for user market of IT risk assessment and mitigation software to make business process efficient. The technology used are authentication, firewalls, encryption, data masking and data backup. Showcasing this set of slides titled IT Security Management Technology User Market Guidelines PDF. The topics addressed in these templates are Authentication, Firewalls, Encryption, Data Masking, Data Backup. All the content presented in this PPT design is completely editable. Download it and make adjustments in color, background, font etc. as per your unique business setting.
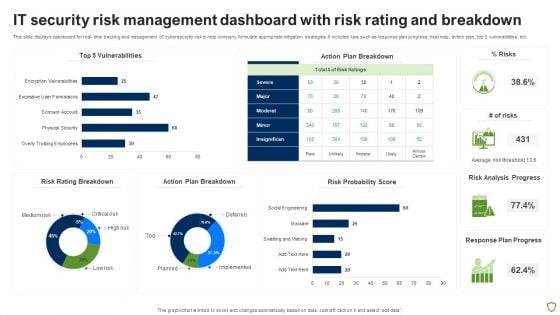
IT Security Risk Management Dashboard With Risk Rating And Breakdown Pictures PDF
This slide displays dashboard for real- time tracking and management of cybersecurity risk to help company formulate appropriate mitigation strategies. It includes kpis such as response plan progress, heat map, action plan, top 5 vulnerabilities, etc. Pitch your topic with ease and precision using this IT Security Risk Management Dashboard With Risk Rating And Breakdown Pictures PDF. This layout presents information on Risk Rating Breakdown, Action Plan Breakdown, Risk Probability Score, Risk Analysis Progress. It is also available for immediate download and adjustment. So, changes can be made in the color, design, graphics or any other component to create a unique layout.
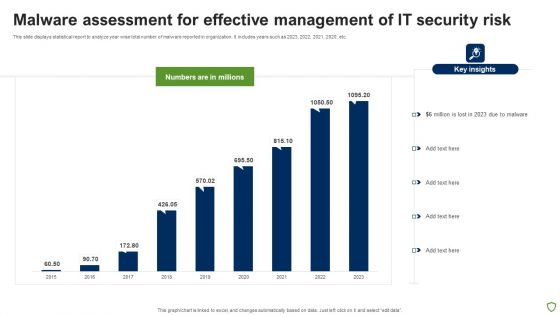
Malware Assessment For Effective Management Of IT Security Risk Portrait PDF
This slide displays statistical report to analyze year wise total number of malware reported in organization. It includes years such as 2023, 2022, 2021, 2020, etc. Showcasing this set of slides titled Malware Assessment For Effective Management Of IT Security Risk Portrait PDF. The topics addressed in these templates are Malware Assessment For Effective, Management IT Security Risk. All the content presented in this PPT design is completely editable. Download it and make adjustments in color, background, font etc. as per your unique business setting.
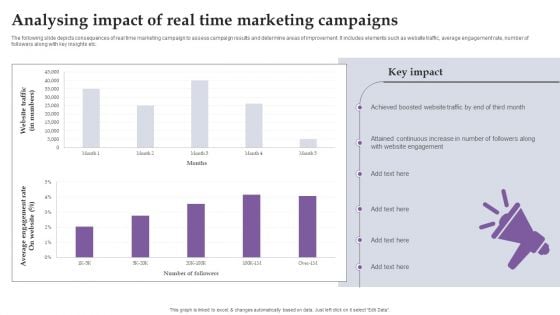
Analysing Impact Of Real Time Marketing Campaigns Ppt Show Graphic Images PDF
The following slide depicts consequences of real time marketing campaign to assess campaign results and determine areas of improvement. It includes elements such as website traffic, average engagement rate, number of followers along with key insights etc. Formulating a presentation can take up a lot of effort and time, so the content and message should always be the primary focus. The visuals of the PowerPoint can enhance the presenters message, so our Analysing Impact Of Real Time Marketing Campaigns Ppt Show Graphic Images PDF was created to help save time. Instead of worrying about the design, the presenter can concentrate on the message while our designers work on creating the ideal templates for whatever situation is needed. Slidegeeks has experts for everything from amazing designs to valuable content, we have put everything into Analysing Impact Of Real Time Marketing Campaigns Ppt Show Graphic Images PDF

Real Time Content Marketing Result Dashboard Ppt Infographic Template Example PDF
The following slide depicts real time content marketing KPI dashboard to monitor traffic flow and manage promotional efforts. It includes elements such as visitors by channel, conversion rate, search, direct, sessions, average time engaged etc. The Real Time Content Marketing Result Dashboard Ppt Infographic Template Example PDF is a compilation of the most recent design trends as a series of slides. It is suitable for any subject or industry presentation, containing attractive visuals and photo spots for businesses to clearly express their messages. This template contains a variety of slides for the user to input data, such as structures to contrast two elements, bullet points, and slides for written information. Slidegeeks is prepared to create an impression.
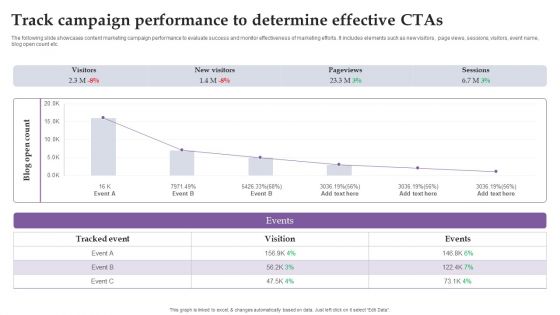
Track Campaign Performance To Determine Effective Ctas Ppt Infographic Template Vector PDF
The following slide showcases content marketing campaign performance to evaluate success and monitor effectiveness of marketing efforts. It includes elements such as new visitors, page views, sessions, visitors, event name, blog open count etc. Slidegeeks has constructed Track Campaign Performance To Determine Effective Ctas Ppt Infographic Template Vector PDF after conducting extensive research and examination. These presentation templates are constantly being generated and modified based on user preferences and critiques from editors. Here, you will find the most attractive templates for a range of purposes while taking into account ratings and remarks from users regarding the content. This is an excellent jumping-off point to explore our content and will give new users an insight into our top-notch PowerPoint Templates.
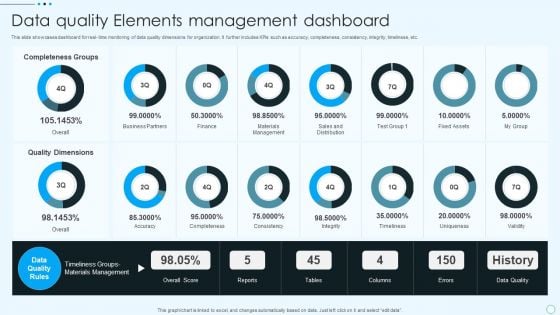
Data Quality Elements Management Dashboard Download PDF
This slide showcases dashboard for real- time monitoring of data quality dimensions for organization. It further includes KPIs such as accuracy, completeness, consistency, integrity, timeliness, etc. Showcasing this set of slides titled Data Quality Elements Management Dashboard Download PDF. The topics addressed in these templates are Quality Dimensions, Accuracy, Completeness, Consistency, Integrity, Timeliness. All the content presented in this PPT design is completely editable. Download it and make adjustments in color, background, font etc. as per your unique business setting.
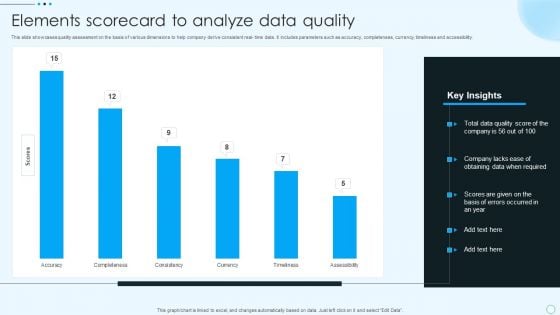
Elements Scorecard To Analyze Data Quality Structure PDF
This slide showcases quality assessment on the basis of various dimensions to help company derive consistent real- time data. It includes parameters such as accuracy, completeness, currency, timeliness and accessibility. Showcasing this set of slides titled Elements Scorecard To Analyze Data Quality Structure PDF. The topics addressed in these templates are Elements Scorecard, Analyze Data Quality. All the content presented in this PPT design is completely editable. Download it and make adjustments in color, background, font etc. as per your unique business setting.
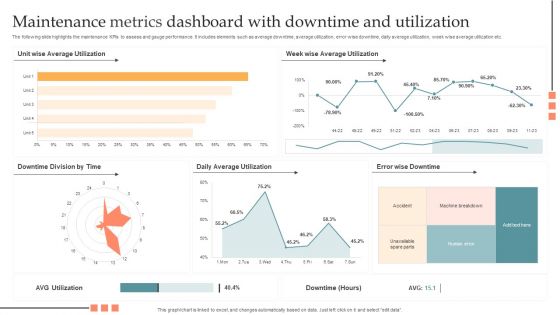
Maintenance Metrics Dashboard With Downtime And Utilization Pictures PDF
The following slide highlights the maintenance KPIs to assess and gauge performance. It includes elements such as average downtime, average utilization, error wise downtime, daily average utilization, week wise average utilization etc. Showcasing this set of slides titled Maintenance Metrics Dashboard With Downtime And Utilization Pictures PDF. The topics addressed in these templates are Maintenance Metrics Dashboard, Downtime And Utilization. All the content presented in this PPT design is completely editable. Download it and make adjustments in color, background, font etc. as per your unique business setting.
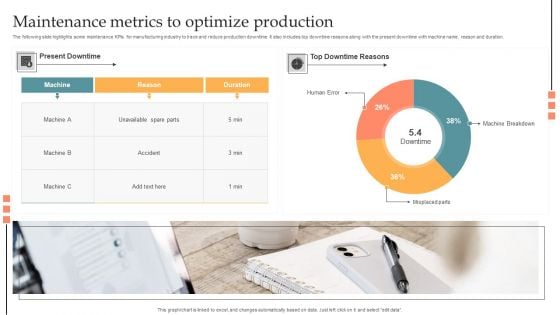
Maintenance Metrics To Optimize Production Information PDF
The following slide highlights some maintenance KPIs for manufacturing industry to trace and reduce production downtime. It also includes top downtime reasons along with the present downtime with machine name, reason and duration. Showcasing this set of slides titled Maintenance Metrics To Optimize Production Information PDF. The topics addressed in these templates are Human Error, Misplaced Parts, Machine Breakdown. All the content presented in this PPT design is completely editable. Download it and make adjustments in color, background, font etc. as per your unique business setting.
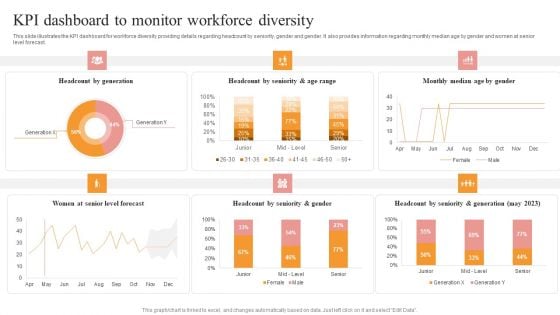
KPI Dashboard To Monitor Workforce Diversity Portrait PDF
This slide illustrates the KPI dashboard for workforce diversity providing details regarding headcount by seniority, gender and gender. It also provides information regarding monthly median age by gender and women at senior level forecast. Welcome to our selection of the KPI Dashboard To Monitor Workforce Diversity Portrait PDF. These are designed to help you showcase your creativity and bring your sphere to life. Planning and Innovation are essential for any business that is just starting out. This collection contains the designs that you need for your everyday presentations. All of our PowerPoints are 100 percent editable, so you can customize them to suit your needs. This multi purpose template can be used in various situations. Grab these presentation templates today.
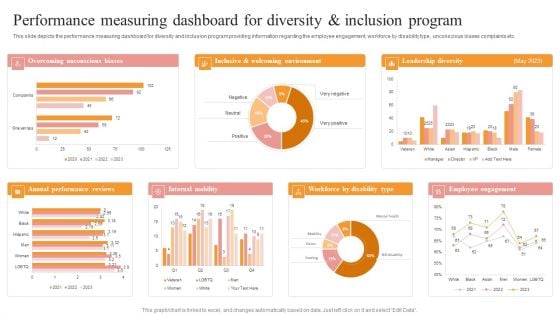
Performance Measuring Dashboard For Diversity And Inclusion Program Summary PDF
This slide depicts the performance measuring dashboard for diversity and inclusion program providing information regarding the employee engagement, workforce by disability type, unconscious biases complaints etc. Explore a selection of the finest Performance Measuring Dashboard For Diversity And Inclusion Program Summary PDF here. With a plethora of professionally designed and pre made slide templates, you can quickly and easily find the right one for your upcoming presentation. You can use our Performance Measuring Dashboard For Diversity And Inclusion Program Summary PDF to effectively convey your message to a wider audience. Slidegeeks has done a lot of research before preparing these presentation templates. The content can be personalized and the slides are highly editable. Grab templates today from Slidegeeks.
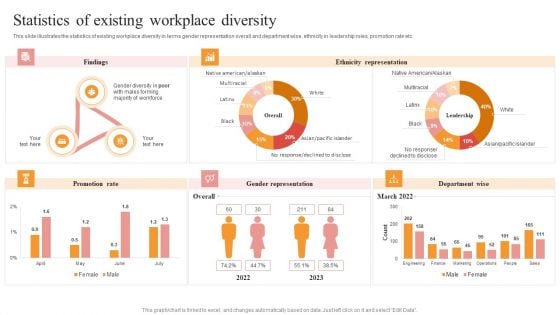
Statistics Of Existing Workplace Diversity Ideas PDF
This slide illustrates the statistics of existing workplace diversity in terms gender representation overall and department wise, ethnicity in leadership roles, promotion rate etc. The Statistics Of Existing Workplace Diversity Ideas PDF is a compilation of the most recent design trends as a series of slides. It is suitable for any subject or industry presentation, containing attractive visuals and photo spots for businesses to clearly express their messages. This template contains a variety of slides for the user to input data, such as structures to contrast two elements, bullet points, and slides for written information. Slidegeeks is prepared to create an impression.
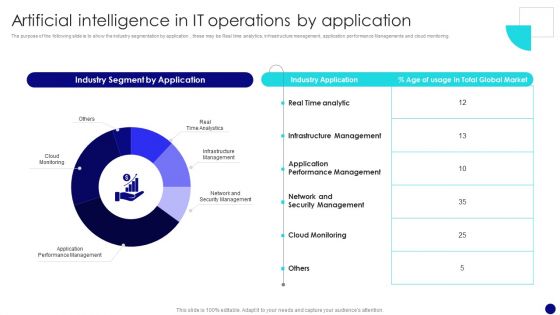
Information Technology Operations Administration With ML Artificial Intelligence In It Operations Introduction PDF
The purpose of the following slide is to show the industry segmentation by application , these may be Real time analytics, infrastructure management, application performance Managements and cloud monitoring. Are you in need of a template that can accommodate all of your creative concepts This one is crafted professionally and can be altered to fit any style. Use it with Google Slides or PowerPoint. Include striking photographs, symbols, depictions, and other visuals. Fill, move around, or remove text boxes as desired. Test out color palettes and font mixtures. Edit and save your work, or work with colleagues. Download Information Technology Operations Administration With ML Artificial Intelligence In It Operations Introduction PDF and observe how to make your presentation outstanding. Give an impeccable presentation to your group and make your presentation unforgettable.

Information Technology Operations Administration With ML Competitive Landscaping Graphics PDF
The purpose of the following slide is to show the industry segmentation by application , these may be Real time analytics, infrastructure management, application performance Managements and cloud monitoring. Formulating a presentation can take up a lot of effort and time, so the content and message should always be the primary focus. The visuals of the PowerPoint can enhance the presenters message, so our Information Technology Operations Administration With ML Competitive Landscaping Graphics PDF was created to help save time. Instead of worrying about the design, the presenter can concentrate on the message while our designers work on creating the ideal templates for whatever situation is needed. Slidegeeks has experts for everything from amazing designs to valuable content, we have put everything into Information Technology Operations Administration With ML Competitive Landscaping Graphics PDF.
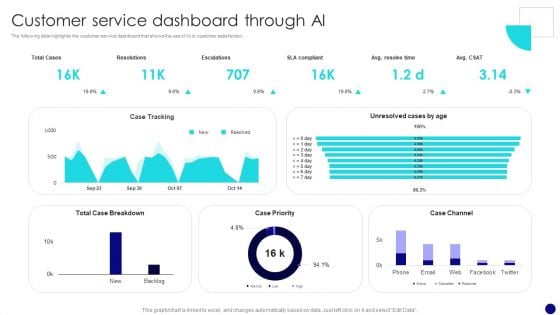
Information Technology Operations Administration With ML Customer Service Formats PDF
The following slide highlights the customer service dashboard that shows the use of AI in customer satisfaction. This modern and well arranged Information Technology Operations Administration With ML Customer Service Formats PDF provides lots of creative possibilities. It is very simple to customize and edit with the Powerpoint Software. Just drag and drop your pictures into the shapes. All facets of this template can be edited with Powerpoint no extra software is necessary. Add your own material, put your images in the places assigned for them, adjust the colors, and then you can show your slides to the world, with an animated slide included.
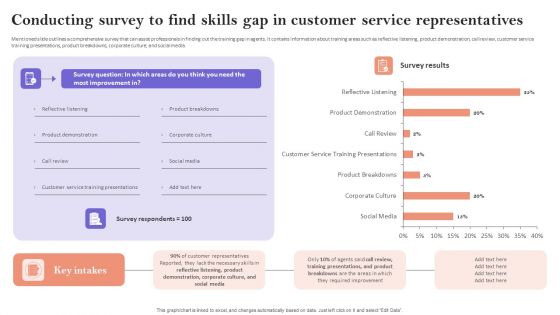
Conducting Survey To Find Skills Gap In Customer Service Representatives Structure PDF
Mentioned slide outlines a comprehensive survey that can assist professionals in finding out the training gap in agents. It contains information about training areas such as reflective listening, product demonstration, call review, customer service training presentations, product breakdowns, corporate culture, and social media. Present like a pro with Conducting Survey To Find Skills Gap In Customer Service Representatives Structure PDF Create beautiful presentations together with your team, using our easy to use presentation slides. Share your ideas in real time and make changes on the fly by downloading our templates. So whether you are in the office, on the go, or in a remote location, you can stay in sync with your team and present your ideas with confidence. With Slidegeeks presentation got a whole lot easier. Grab these presentations today.
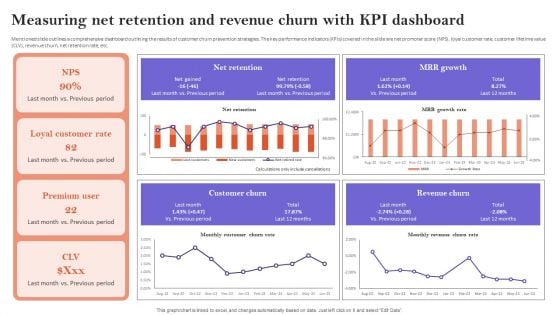
Measuring Net Retention And Revenue Churn With Kpi Dashboard Ideas PDF
Mentioned slide outlines a comprehensive dashboard outlining the results of customer churn prevention strategies. The key performance indicators KPIs covered in the slide are net promoter score NPS, loyal customer rate, customer lifetime value CLV, revenue churn, net retention rate, etc. The Measuring Net Retention And Revenue Churn With Kpi Dashboard Ideas PDF is a compilation of the most recent design trends as a series of slides. It is suitable for any subject or industry presentation, containing attractive visuals and photo spots for businesses to clearly express their messages. This template contains a variety of slides for the user to input data, such as structures to contrast two elements, bullet points, and slides for written information. Slidegeeks is prepared to create an impression.
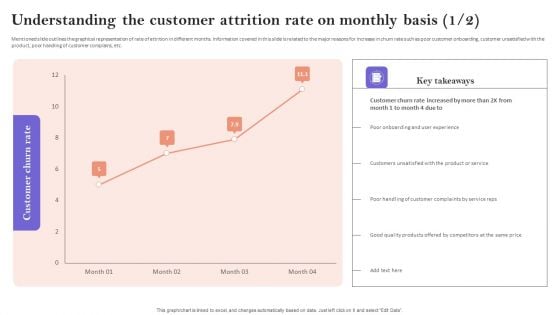
Understanding The Customer Attrition Rate On Monthly Basis Mockup PDF
Mentioned slide outlines the customer churn rate in four different months. The parameters used to calculate the attrition rate are customers at beginning of the month, total customers lost, churn rate, and customers at end of the month. The highest attrition rate is observed in last month. Create an editable Understanding The Customer Attrition Rate On Monthly Basis Mockup PDF that communicates your idea and engages your audience. Whether youre presenting a business or an educational presentation, pre designed presentation templates help save time. Understanding The Customer Attrition Rate On Monthly Basis Mockup PDF is highly customizable and very easy to edit, covering many different styles from creative to business presentations. Slidegeeks has creative team members who have crafted amazing templates. So, go and get them without any delay.
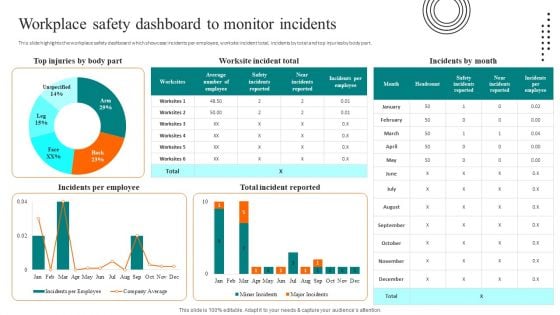
Workplace Safety Dashboard To Monitor Incidents Clipart PDF
This slide highlights the workplace safety dashboard which showcase incidents per employee, worksite incident total, incidents by total and top injuries by body part. There are so many reasons you need a Workplace Safety Dashboard To Monitor Incidents Clipart PDF. The first reason is you cannot spend time making everything from scratch, Thus, Slidegeeks has made presentation templates for you too. You can easily download these templates from our website easily.
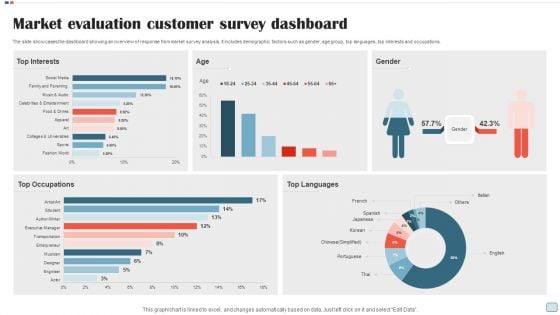
Market Evaluation Customer Survey Dashboard Topics PDF
The slide showcases the dashboard showing an overview of response from market survey analysis. It includes demographic factors such as gender, age group, top languages, top interests and occupations. Showcasing this set of slides titled Market Evaluation Customer Survey Dashboard Topics PDF. The topics addressed in these templates are Gender, Age Group, Top Languages, Top Interests And Occupations. All the content presented in this PPT design is completely editable. Download it and make adjustments in color, background, font etc. as per your unique business setting.
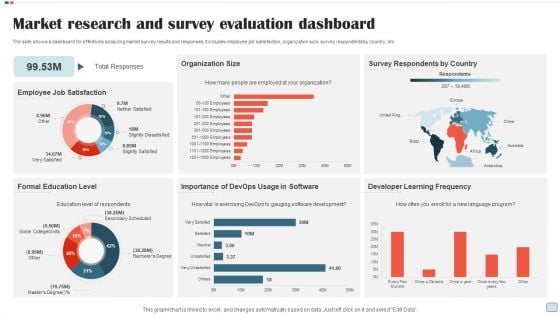
Market Research And Survey Evaluation Dashboard Rules PDF
The slide shows a dashboard for effectively analyzing market survey results and responses. It includes employee job satisfaction, organization size, survey respondents by country, etc. Pitch your topic with ease and precision using this Market Research And Survey Evaluation Dashboard Rules PDF. This layout presents information on Employee Job Satisfaction, Organization Size, Survey Respondents By Country. It is also available for immediate download and adjustment. So, changes can be made in the color, design, graphics or any other component to create a unique layout.
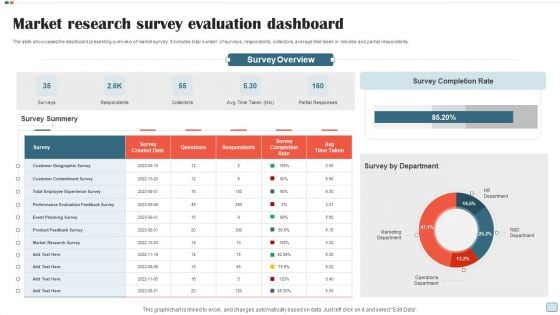
Market Research Survey Evaluation Dashboard Graphics PDF
The slide showcases the dashboard presenting overview of market survey. It includes total number of surveys, respondents, collectors, average time taken in minutes and partial respondents. Showcasing this set of slides titled Market Research Survey Evaluation Dashboard Graphics PDF. The topics addressed in these templates are Surveys, Respondents, Collectors, Partial Responses. All the content presented in this PPT design is completely editable. Download it and make adjustments in color, background, font etc. as per your unique business setting.
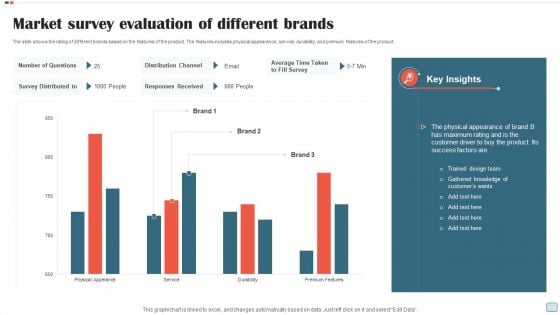
Market Survey Evaluation Of Different Brands Slides PDF
The slide shows the rating of different brands based on the features of the product. The features includes physical appearance, service, durability, and premium features of the product. Showcasing this set of slides titled Market Survey Evaluation Of Different Brands Slides PDF. The topics addressed in these templates are Physical Appearance, Service, Durability, Premium Features Product. All the content presented in this PPT design is completely editable. Download it and make adjustments in color, background, font etc. as per your unique business setting.
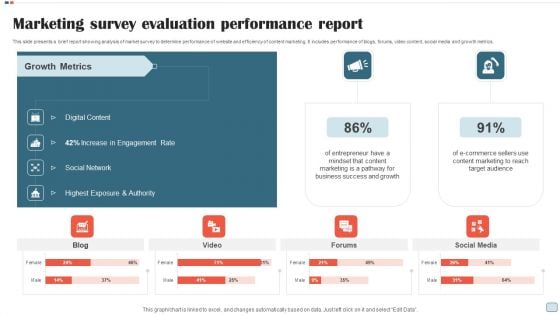
Marketing Survey Evaluation Performance Report Guidelines PDF
This slide presents a brief report showing analysis of market survey to determine performance of website and efficiency of content marketing. It includes performance of blogs, forums, video content, social media and growth metrics. Showcasing this set of slides titled Marketing Survey Evaluation Performance Report Guidelines PDF. The topics addressed in these templates are Digital Content, Engagement Rate, Social Network, Business Success, Growth. All the content presented in this PPT design is completely editable. Download it and make adjustments in color, background, font etc. as per your unique business setting.
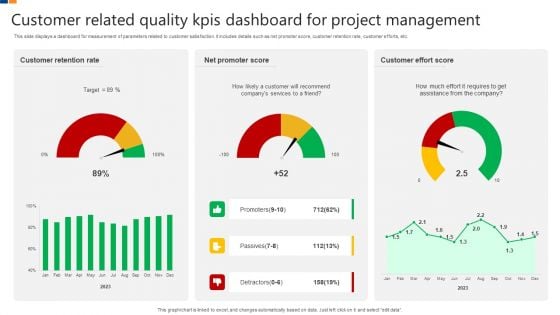
Customer Related Quality Kpis Dashboard For Project Management Brochure PDF
This slide displays a dashboard for measurement of parameters related to customer satisfaction. It includes details such as net promoter score, customer retention rate, customer efforts, etc. Showcasing this set of slides titled Customer Related Quality Kpis Dashboard For Project Management Brochure PDF. The topics addressed in these templates are Customer Retention Rate, Net Promoter Score, Customer Effort Score. All the content presented in this PPT design is completely editable. Download it and make adjustments in color, background, font etc. as per your unique business setting.
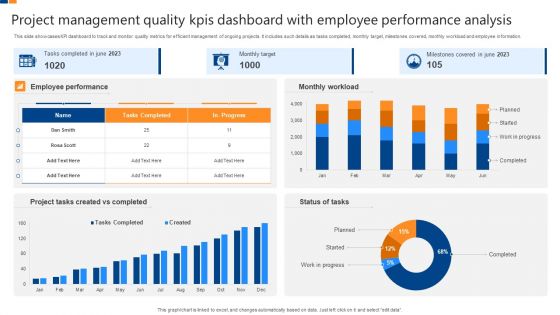
Project Management Quality Kpis Dashboard With Employee Performance Analysis Professional PDF
This slide showcases KPI dashboard to track and monitor quality metrics for efficient management of ongoing projects. It includes such details as tasks completed, monthly target, milestones covered, monthly workload and employee information. Showcasing this set of slides titled Project Management Quality Kpis Dashboard With Employee Performance Analysis Professional PDF. The topics addressed in these templates are Employee Performance, Monthly Workload, Milestones Covered, Monthly Target, Project Tasks Created Completed. All the content presented in this PPT design is completely editable. Download it and make adjustments in color, background, font etc. as per your unique business setting.
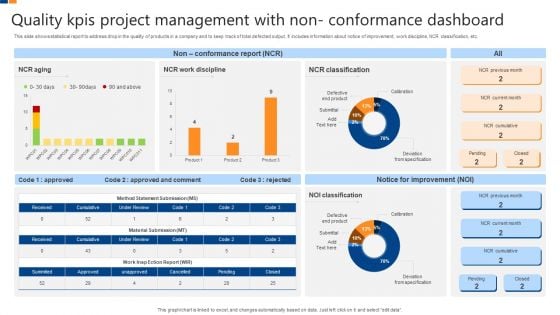
Quality Kpis Project Management With Non Conformance Dashboard Structure PDF
This slide shows statistical report to address drop in the quality of products in a company and to keep track of total defected output. It includes information about notice of improvement, work discipline, NCR classification, etc. Showcasing this set of slides titled Quality Kpis Project Management With Non Conformance Dashboard Structure PDF. The topics addressed in these templates are Quality Kpis Project Management, Non Conformance Dashboard. All the content presented in this PPT design is completely editable. Download it and make adjustments in color, background, font etc. as per your unique business setting.
Tracker For Time Based Quality Kpis In Project Management Ideas PDF
This slide displays project wise comparative analysis on the basis of planned and actual time it takes for completion. It includes details such as number of tasks and work completed, average number of hours, start and end dates, etc. Pitch your topic with ease and precision using this Tracker For Time Based Quality Kpis In Project Management Ideas PDF. This layout presents information on Time, Work Completed, Avg Number, Hours Per Task. It is also available for immediate download and adjustment. So, changes can be made in the color, design, graphics or any other component to create a unique layout.
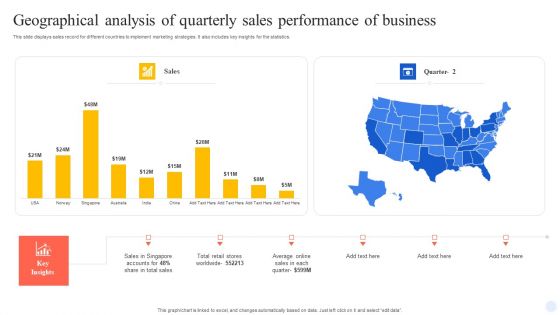
Geographical Analysis Of Quarterly Sales Performance Of Business Portrait PDF
This slide displays sales record for different countries to implement marketing strategies. It also includes key insights for the statistics. Pitch your topic with ease and precision using this Geographical Analysis Of Quarterly Sales Performance Of Business Portrait PDF. This layout presents information on Geographical Analysis, Quarterly Sales, Performance Of Business. It is also available for immediate download and adjustment. So, changes can be made in the color, design, graphics or any other component to create a unique layout.
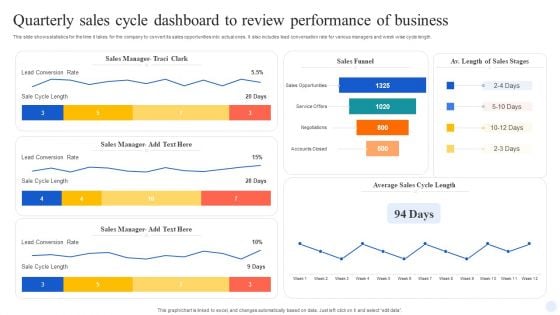
Quarterly Sales Cycle Dashboard To Review Performance Of Business Demonstration PDF
This slide shows statistics for the time it takes for the company to convert its sales opportunities into actual ones. It also includes lead conversation rate for various managers and week wise cycle length. Showcasing this set of slides titled Quarterly Sales Cycle Dashboard To Review Performance Of Business Demonstration PDF. The topics addressed in these templates are Sales Manager, Sales Funnel, Lead Conversion Rate. All the content presented in this PPT design is completely editable. Download it and make adjustments in color, background, font etc. as per your unique business setting.

Quarterly Sales Performance Of Business Analysis With Key Insights Information PDF
In this slide sales performance of each product is recorded as their percentage share in total sales first quarter of company. The goods include headphones, joystick, mouse pad, bluetooth speaker, etc. Pitch your topic with ease and precision using this Quarterly Sales Performance Of Business Analysis With Key Insights Information PDF. This layout presents information on Wireless Mouse, Keyboard, Mouse Pad, Joystick, Headsets. It is also available for immediate download and adjustment. So, changes can be made in the color, design, graphics or any other component to create a unique layout.
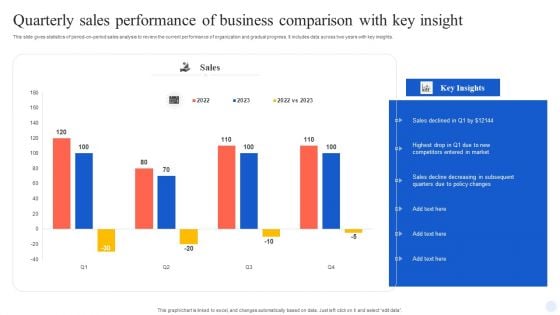
Quarterly Sales Performance Of Business Comparison With Key Insight Guidelines PDF
This slide gives statistics of period-on-period sales analysis to review the current performance of organization and gradual progress. It includes data across two years with key insights. Showcasing this set of slides titled Quarterly Sales Performance Of Business Comparison With Key Insight Guidelines PDF. The topics addressed in these templates are Quarterly Sales Performance, Business Comparison, Key Insight. All the content presented in this PPT design is completely editable. Download it and make adjustments in color, background, font etc. as per your unique business setting.
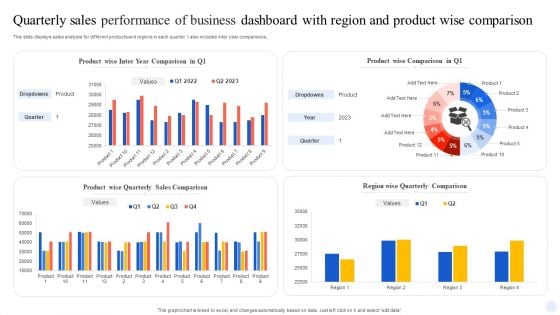
Quarterly Sales Performance Of Business Dashboard With Region And Product Wise Comparison Guidelines PDF
This slide displays sales analysis for different products and regions in each quarter. t also includes inter year comparisons. Pitch your topic with ease and precision using this Quarterly Sales Performance Of Business Dashboard With Region And Product Wise Comparison Guidelines PDF. This layout presents information on Product Wise Quarterly Sales, Comparison. It is also available for immediate download and adjustment. So, changes can be made in the color, design, graphics or any other component to create a unique layout.
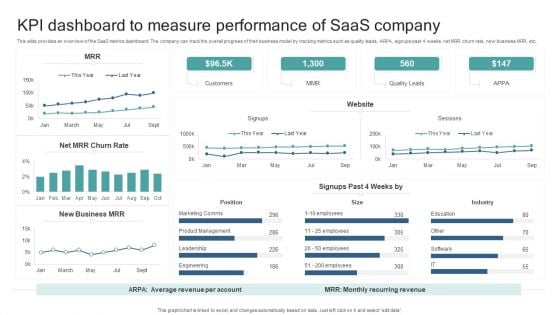
KPI Dashboard To Measure Performance Of Saas Company Introduction PDF
This slide provides an overview of the SaaS metrics dashboard. The company can track the overall progress of their business model by tracking metrics such as quality leads, ARPA, signups past 4 weeks, net MRR churn rate, new business MRR, etc. Pitch your topic with ease and precision using this KPI Dashboard To Measure Performance Of Saas Company Introduction PDF. This layout presents information on Industry, Position, Customers, Quality Leads. It is also available for immediate download and adjustment. So, changes can be made in the color, design, graphics or any other component to create a unique layout.
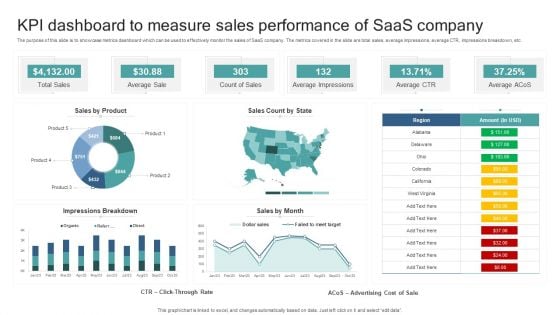
KPI Dashboard To Measure Sales Performance Of Saas Company Summary PDF
The purpose of this slide is to showcase metrics dashboard which can be used to effectively monitor the sales of SaaS company. The metrics covered in the slide are total sales, average impressions, average CTR, impressions breakdown, etc. Showcasing this set of slides titled KPI Dashboard To Measure Sales Performance Of Saas Company Summary PDF. The topics addressed in these templates are Total Sales, Average Sale, Count Of Sales, Average Impressions, Average Ctr. All the content presented in this PPT design is completely editable. Download it and make adjustments in color, background, font etc. as per your unique business setting.
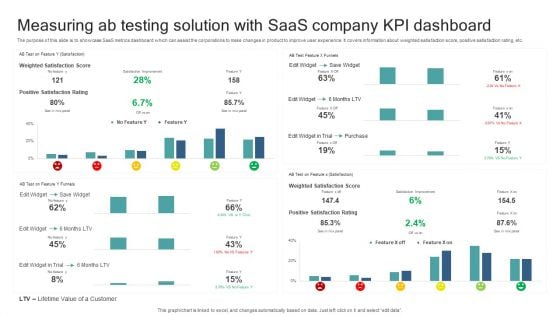
Measuring Ab Testing Solution With Saas Company KPI Dashboard Guidelines PDF
The purpose of this slide is to showcase SaaS metrics dashboard which can assist the corporations to make changes in product to improve user experience. It covers information about weighted satisfaction score, positive satisfaction rating, etc. Pitch your topic with ease and precision using this Measuring Ab Testing Solution With Saas Company KPI Dashboard Guidelines PDF. This layout presents information on Lifetime Value Customer, Positive Satisfaction Rating, Save Widget, Weighted Satisfaction Score. It is also available for immediate download and adjustment. So, changes can be made in the color, design, graphics or any other component to create a unique layout.
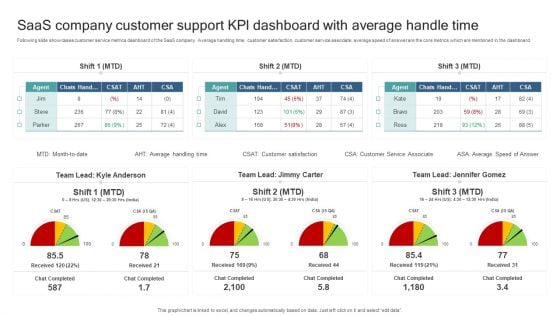
Saas Company Customer Support Kpl Dashboard With Average Handle Time Microsoft PDF
Following slide showcases customer service metrics dashboard of the SaaS company. Average handling time, customer satisfaction, customer service associate, average speed of answer are the core metrics which are mentioned in the dashboard. Showcasing this set of slides titled Saas Company Customer Support Kpl Dashboard With Average Handle Time Microsoft PDF. The topics addressed in these templates are Saas Company Customer Support, Kpl Dashboard, Average Handle Time. All the content presented in this PPT design is completely editable. Download it and make adjustments in color, background, font etc. as per your unique business setting.
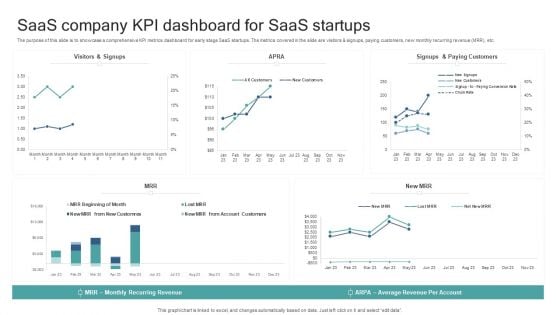
Saas Company KPI Dashboard For Saas Startups Background PDF
The purpose of this slide is to showcase a comprehensive KPI metrics dashboard for early stage SaaS startups. The metrics covered in the slide are visitors and signups, paying customers, new monthly recurring revenue MRR, etc. Showcasing this set of slides titled Saas Company KPI Dashboard For Saas Startups Background PDF. The topics addressed in these templates are Average Revenue Per Account, Monthly Recurring Revenue. All the content presented in this PPT design is completely editable. Download it and make adjustments in color, background, font etc. as per your unique business setting.
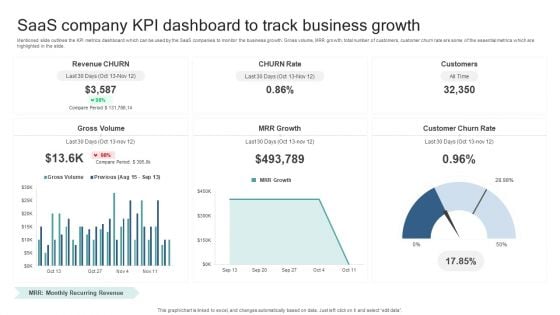
Saas Company KPI Dashboard To Track Business Growth Guidelines PDF
Mentioned slide outlines the KPI metrics dashboard which can be used by the SaaS companies to monitor the business growth. Gross volume, MRR growth, total number of customers, customer churn rate are some of the essential metrics which are highlighted in the slide. Showcasing this set of slides titled Saas Company KPI Dashboard To Track Business Growth Guidelines PDF. The topics addressed in these templates are Gross Volume, Mrr Growth, Customer Churn Rate. All the content presented in this PPT design is completely editable. Download it and make adjustments in color, background, font etc. as per your unique business setting.
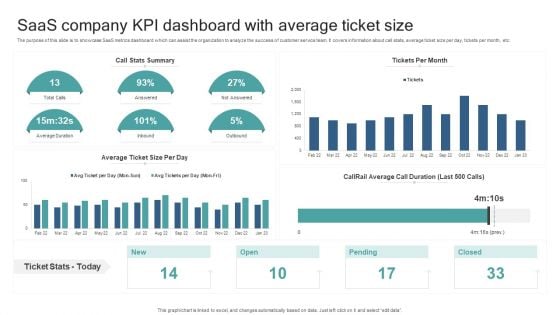
Saas Company KPI Dashboard With Average Ticket Size Sample PDF
The purpose of this slide is to showcase SaaS metrics dashboard which can assist the organization to analyze the success of customer service team. It covers information about call stats, average ticket size per day, tickets per month, etc. Showcasing this set of slides titled Saas Company KPI Dashboard With Average Ticket Size Sample PDF. The topics addressed in these templates are Saas Company Kpi, Dashboard, Average Ticket Size. All the content presented in this PPT design is completely editable. Download it and make adjustments in color, background, font etc. as per your unique business setting.
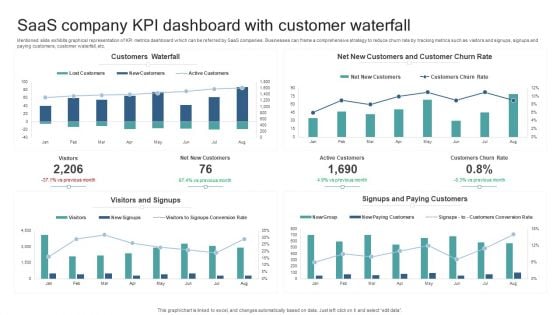
Saas Company KPI Dashboard With Customer Waterfall Slides PDF
Mentioned slide exhibits graphical representation of KPI metrics dashboard which can be referred by SaaS companies. Businesses can frame a comprehensive strategy to reduce churn rate by tracking metrics such as visitors and signups, signups and paying customers, customer waterfall, etc. Pitch your topic with ease and precision using this Saas Company KPI Dashboard With Customer Waterfall Slides PDF. This layout presents information on Customers Waterfall, Visitors And Signups, Signups And Paying Customers. It is also available for immediate download and adjustment. So, changes can be made in the color, design, graphics or any other component to create a unique layout.
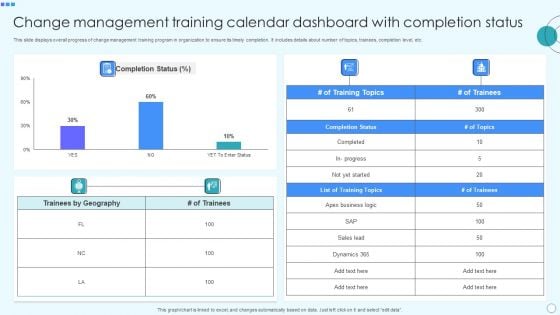
Change Management Training Calendar Dashboard With Completion Status Portrait PDF
This slide displays overall progress of change management training program in organization to ensure its timely completion. It includes details about number of topics, trainees, completion level, etc. Pitch your topic with ease and precision using this Change Management Training Calendar Dashboard With Completion Status Portrait PDF. This layout presents information on Business Logic, Geography, Completion Status, Sales Lead, Dynamics. It is also available for immediate download and adjustment. So, changes can be made in the color, design, graphics or any other component to create a unique layout.
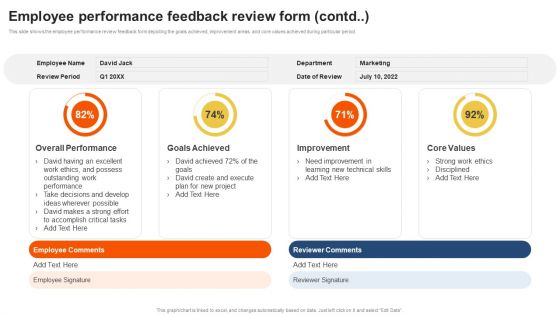
Staff Performance Evaluation Process Employee Performance Feedback Review Form Contd Infographics PDF
This slide shows the employee performance review feedback form depicting the goals achieved, improvement areas and core values achieved during particular period. From laying roadmaps to briefing everything in detail, our templates are perfect for you. You can set the stage with your presentation slides. All you have to do is download these easy to edit and customizable templates. Staff Performance Evaluation Process Employee Performance Feedback Review Form Contd Infographics PDF will help you deliver an outstanding performance that everyone would remember and praise you for. Do download this presentation today.
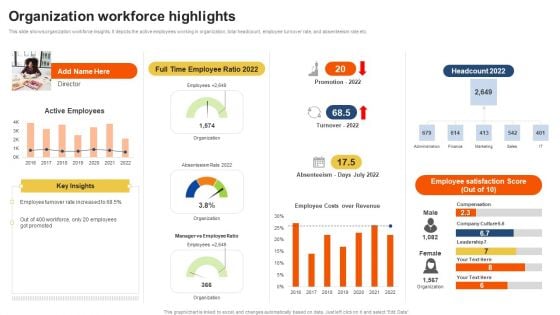
Staff Performance Evaluation Process Organization Workforce Highlights Guidelines PDF
This slide shows organization workforce insights. It depicts the active employees working in organization, total headcount, employee turnover rate, and absenteeism rate etc. Make sure to capture your audiences attention in your business displays with our gratis customizable Staff Performance Evaluation Process Organization Workforce Highlights Guidelines PDF. These are great for business strategies, office conferences, capital raising or task suggestions. If you desire to acquire more customers for your tech business and ensure they stay satisfied, create your own sales presentation with these plain slides.
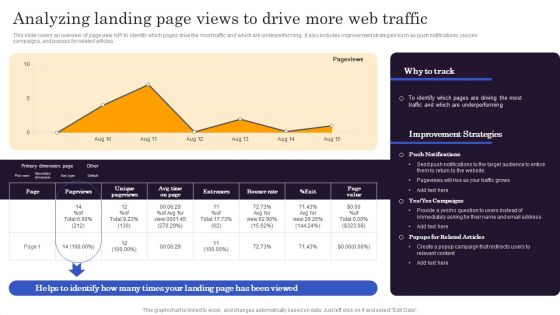
Marketers Guide To Data Analysis Optimization Analyzing Landing Page Views To Drive More Web Traffic Rules PDF
This slide covers an overview of page view KPI to identify which pages drive the most traffic and which are underperforming. It also includes improvement strategies such as push notifications, yes yes campaigns, and popups for related articles. Do you have an important presentation coming up Are you looking for something that will make your presentation stand out from the rest Look no further than Marketers Guide To Data Analysis Optimization Analyzing Landing Page Views To Drive More Web Traffic Rules PDF. With our professional designs, you can trust that your presentation will pop and make delivering it a smooth process. And with Slidegeeks, you can trust that your presentation will be unique and memorable. So why wait Grab Marketers Guide To Data Analysis Optimization Analyzing Landing Page Views To Drive More Web Traffic Rules PDF today and make your presentation stand out from the rest.
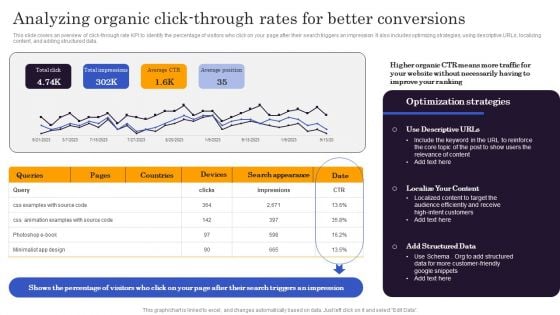
Marketers Guide To Data Analysis Optimization Analyzing Organic Click Through Rates For Better Conversions Structure PDF
This slide covers an overview of click-through rate KPI to identify the percentage of visitors who click on your page after their search triggers an impression. It also includes optimizing strategies, using descriptive URLs, localizing content, and adding structured data. Find highly impressive Marketers Guide To Data Analysis Optimization Analyzing Organic Click Through Rates For Better Conversions Structure PDF on Slidegeeks to deliver a meaningful presentation. You can save an ample amount of time using these presentation templates. No need to worry to prepare everything from scratch because Slidegeeks experts have already done a huge research and work for you. You need to download Marketers Guide To Data Analysis Optimization Analyzing Organic Click Through Rates For Better Conversions Structure PDF for your upcoming presentation. All the presentation templates are 100 percent editable and you can change the color and personalize the content accordingly. Download now.
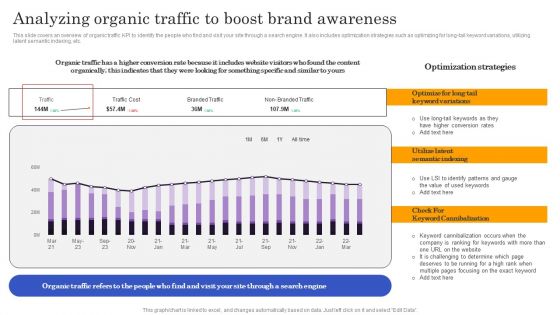
Marketers Guide To Data Analysis Optimization Analyzing Organic Traffic To Boost Brand Awareness Download PDF
This slide covers an overview of organic traffic KPI to identify the people who find and visit your site through a search engine. It also includes optimization strategies such as optimizing for long-tail keyword variations, utilizing latent semantic indexing, etc. If your project calls for a presentation, then Slidegeeks is your go to partner because we have professionally designed, easy to edit templates that are perfect for any presentation. After downloading, you can easily edit Marketers Guide To Data Analysis Optimization Analyzing Organic Traffic To Boost Brand Awareness Download PDF and make the changes accordingly. You can rearrange slides or fill them with different images. Check out all the handy templates
Marketers Guide To Data Analysis Optimization Dashboard For Tracking Business Blog Kpis Infographics PDF
This slide covers the dashboard for analyzing blogging KPIs such as performance, published posts, views, new blog subscribers, top blog posts by pageviews, top blog posts by CTR, etc. Coming up with a presentation necessitates that the majority of the effort goes into the content and the message you intend to convey. The visuals of a PowerPoint presentation can only be effective if it supplements and supports the story that is being told. Keeping this in mind our experts created Marketers Guide To Data Analysis Optimization Dashboard For Tracking Business Blog Kpis Infographics PDF to reduce the time that goes into designing the presentation. This way, you can concentrate on the message while our designers take care of providing you with the right template for the situation.
Marketers Guide To Data Analysis Optimization KPI Dashboard For Tracking Email Marketing Campaign Infographics PDF
This slide covers the dashboard for analyzing email marketing metrics such as overall open rate, click-through rate, click-to-open ratio, unsubscribe rate, hard bounce rate, soft rate, monthly open rate, total monthly subscribers, etc. Presenting this PowerPoint presentation, titled Marketers Guide To Data Analysis Optimization KPI Dashboard For Tracking Email Marketing Campaign Infographics PDF, with topics curated by our researchers after extensive research. This editable presentation is available for immediate download and provides attractive features when used. Download now and captivate your audience. Presenting this Marketers Guide To Data Analysis Optimization KPI Dashboard For Tracking Email Marketing Campaign Infographics PDF. Our researchers have carefully researched and created these slides with all aspects taken into consideration. This is a completely customizable Marketers Guide To Data Analysis Optimization KPI Dashboard For Tracking Email Marketing Campaign Infographics PDF that is available for immediate downloading. Download now and make an impact on your audience. Highlight the attractive features available with our PPTs.
Marketers Guide To Data Analysis Optimization KPI Dashboard For Tracking SEO Analytics Template PDF
This slide covers the KPI dashboard for analyzing SEO metrics such as authority score, organic traffic, organic keywords, paid keywords, ref. Domains, site audit, link-building tool, organic traffic, on-page SEO checker, backlink audit, etc. This Marketers Guide To Data Analysis Optimization KPI Dashboard For Tracking SEO Analytics Template PDF from Slidegeeks makes it easy to present information on your topic with precision. It provides customization options, so you can make changes to the colors, design, graphics, or any other component to create a unique layout. It is also available for immediate download, so you can begin using it right away. Slidegeeks has done good research to ensure that you have everything you need to make your presentation stand out. Make a name out there for a brilliant performance.


 Continue with Email

 Home
Home


