Bank Icon
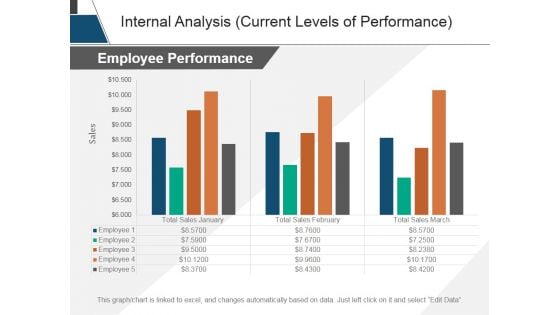
Internal Analysis Current Levels Of Performance Ppt PowerPoint Presentation Tips
This is a internal analysis current levels of performance ppt powerpoint presentation tips. This is a three stage process. The stages in this process are sales, employee performance, years, business, marketing.
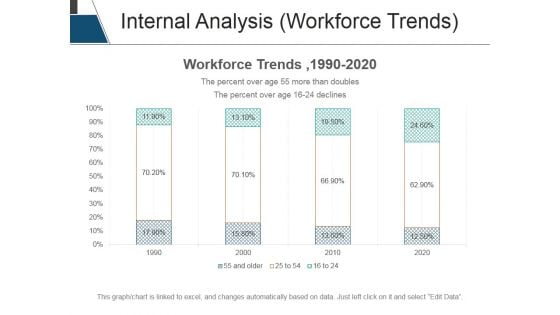
Internal Analysis Workforce Trends Ppt PowerPoint Presentation Summary Example Topics
This is a internal analysis workforce trends ppt powerpoint presentation summary example topics. This is a four stage process. The stages in this process are workforce trends, percentage, business, marketing, management.
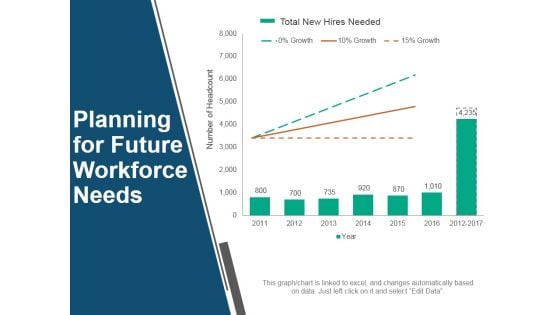
Planning For Future Workforce Needs Ppt PowerPoint Presentation Outline Templates
This is a planning for future workforce needs ppt powerpoint presentation outline templates. This is a seven stage process. The stages in this process are total new hires needed, planning, business, marketing, success.
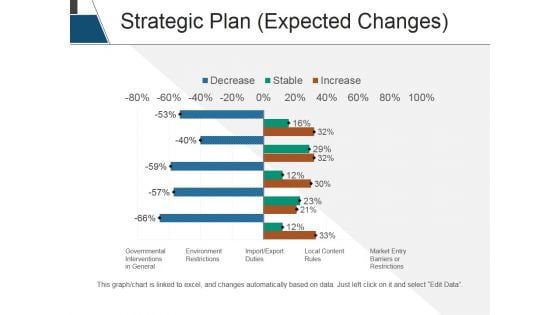
Strategic Plan Expected Changes Ppt PowerPoint Presentation Pictures Vector
This is a strategic plan expected changes ppt powerpoint presentation pictures vector. This is a two stage process. The stages in this process are government interventions in general, environment restrictions, import export duties, local content rules, market entry barriers or restrictions.
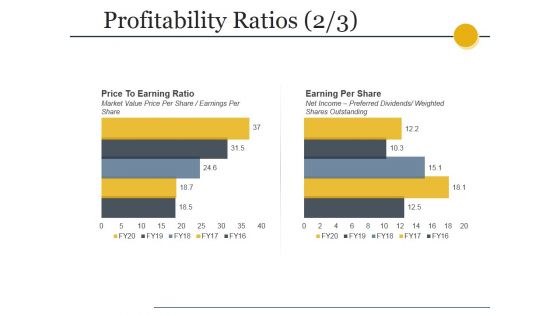
Profitability Ratios Template 2 Ppt PowerPoint Presentation Gallery Designs
This is a profitability ratios template 2 ppt powerpoint presentation gallery designs. This is a two stage process. The stages in this process are price to earning ratio, market value price per share earnings per share, earning per share, net income preferred dividends, weighted shares outstanding.
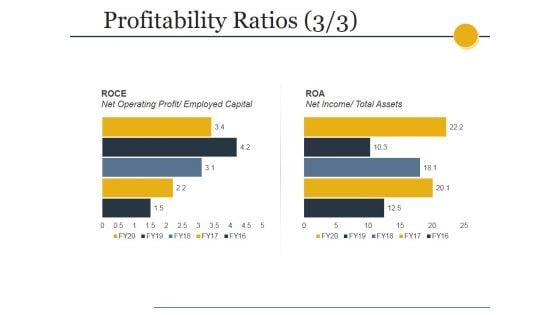
Profitability Ratios Template 3 Ppt PowerPoint Presentation Show Graphics Download
This is a profitability ratios template 3 ppt powerpoint presentation show graphics download. This is a two stage process. The stages in this process are roce, net operating profit, employed capital, roa, net income, total assets.
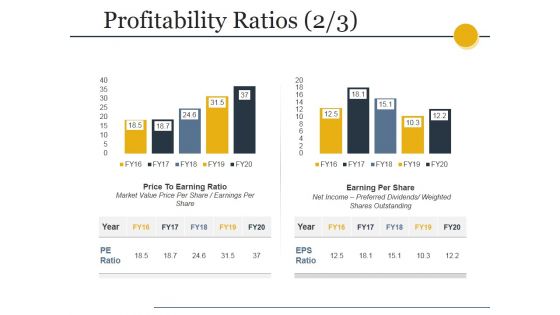
Profitability Ratios Template 4 Ppt PowerPoint Presentation Professional Deck
This is a profitability ratios template 4 ppt powerpoint presentation professional deck. This is a two stage process. The stages in this process are price to earning ratio, market value price per share earnings per share, earning per share, net income preferred dividends, weighted shares outstanding.
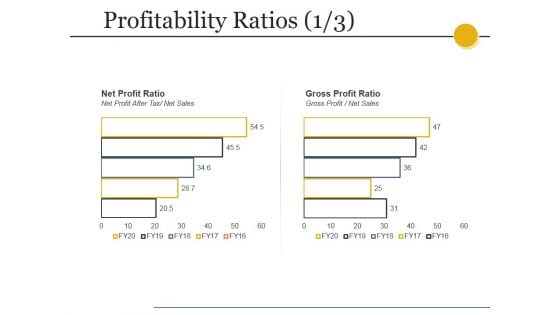
Profitability Ratios Template Ppt PowerPoint Presentation Styles Slide
This is a profitability ratios template ppt powerpoint presentation styles slide. This is a two stage process. The stages in this process are net profit ratio, net profit after tax net sales, gross profit ratio, gross profit net sales.
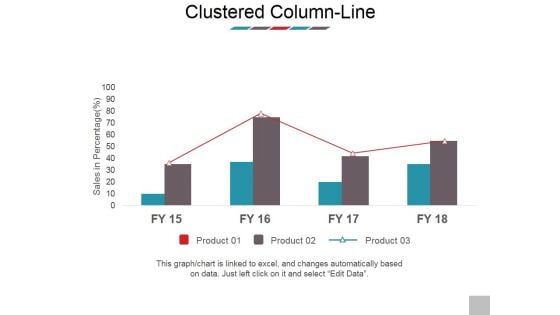
Clustered Column Line Ppt PowerPoint Presentation Model Images
This is a clustered column line ppt powerpoint presentation model images. This is a four stage process. The stages in this process are sales in percentage, product, business, marketing, bar graph.
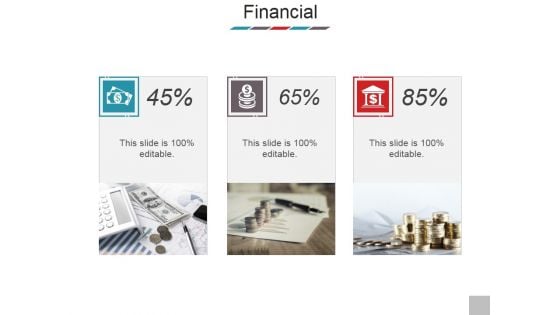
Financial Ppt PowerPoint Presentation Ideas Shapes
This is a financial ppt powerpoint presentation ideas shapes. This is a three stage process. The stages in this process are financial, strategy, business, marketing, success.
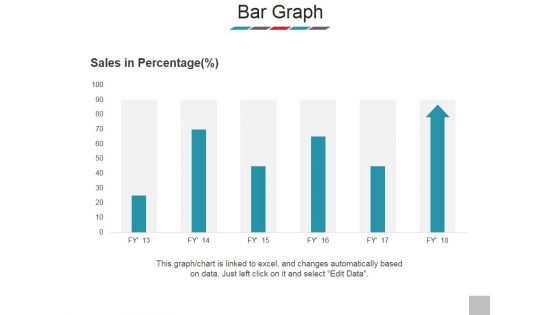
Bar Graph Ppt PowerPoint Presentation Model Clipart
This is a bar graph ppt powerpoint presentation model clipart. This is a six stage process. The stages in this process are sales in percentage, product, bar graph, business, marketing.
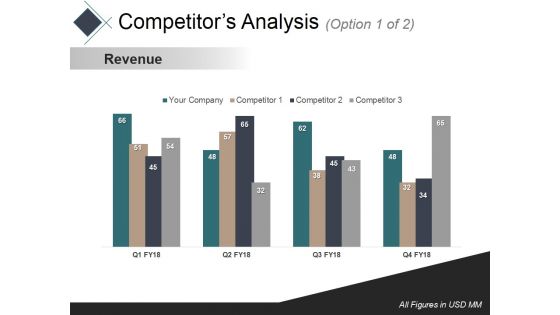
Competitors Analysis 1 Ppt PowerPoint Presentation Outline Templates
This is a competitors analysis 1 ppt powerpoint presentation outline templates. This is a four stage process. The stages in this process are revenue, business, marketing, bar, success.
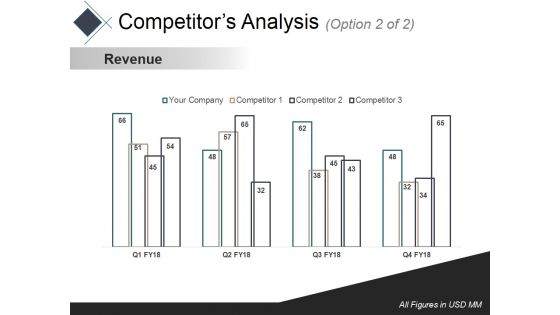
Competitors Analysis 2 Ppt PowerPoint Presentation Slides Gallery
This is a competitors analysis 2 ppt powerpoint presentation slides gallery. This is a four stage process. The stages in this process are revenue, business, marketing, bar, success.
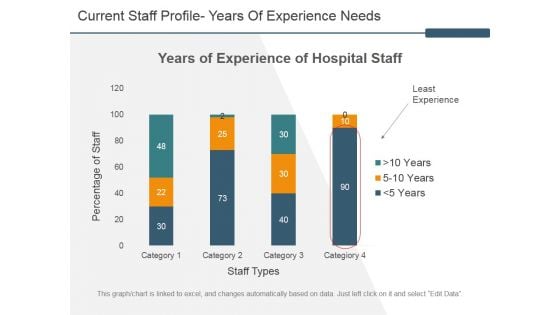
Current Staff Profile Years Of Experience Needs Ppt PowerPoint Presentation Layouts Influencers
This is a current staff profile years of experience needs ppt powerpoint presentation layouts influencers. This is a four stage process. The stages in this process are years of experience of hospital staff, percentage of staff, staff types, least experience.
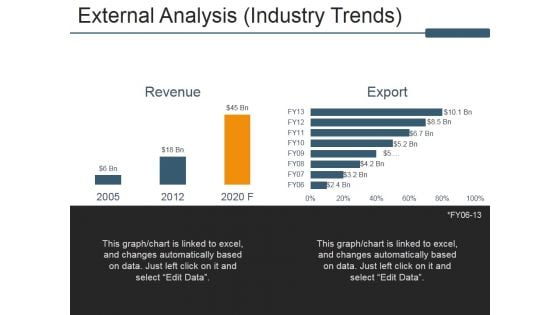
External Analysis Industry Trends Ppt PowerPoint Presentation Infographic Template Summary
This is a external analysis industry trends ppt powerpoint presentation infographic template summary. This is a two stage process. The stages in this process are revenue, export, external analysis, business, marketing.
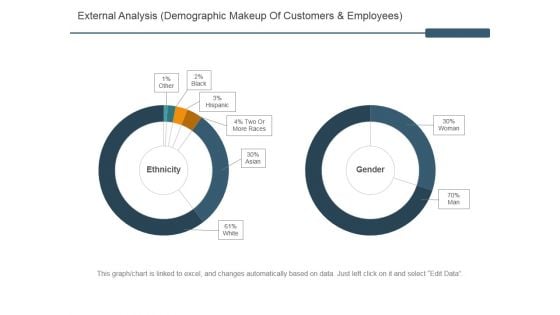
External Analysis Ppt PowerPoint Presentation Infographics Information
This is a external analysis ppt powerpoint presentation infographics information. This is a seven stage process. The stages in this process are education, police, hm forces, local government, civil service.
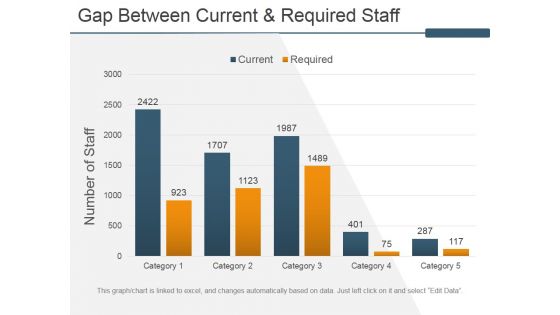
Gap Between Current And Required Staff Ppt PowerPoint Presentation Inspiration Slides
This is a gap between current and required staff ppt powerpoint presentation inspiration slides. This is a five stage process. The stages in this process are number of staff, bar graph, business, marketing, success.
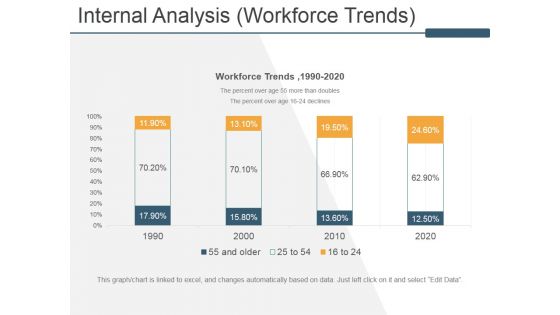
Internal Analysis Workforce Trends Ppt PowerPoint Presentation Model Infographics
This is a internal analysis workforce trends ppt powerpoint presentation model infographics. This is a four stage process. The stages in this process are workforce trends, internal analysis, business, marketing, success.
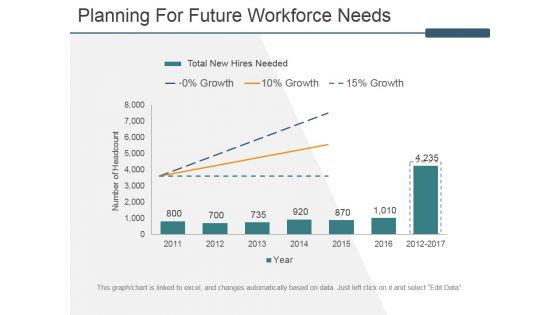
Planning For Future Workforce Needs Ppt PowerPoint Presentation Ideas Design Ideas
This is a planning for future workforce needs ppt powerpoint presentation ideas design ideas. This is a seven stage process. The stages in this process are total new hires needed, growth, business, marketing, success.
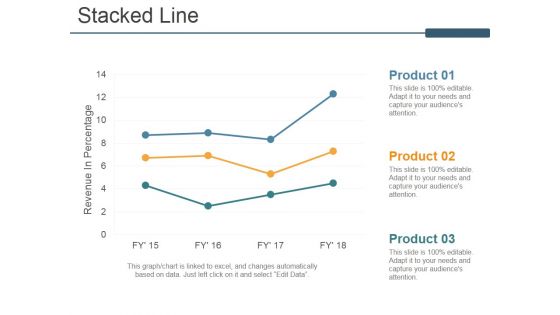
Stacked Line Ppt PowerPoint Presentation Ideas Model
This is a stacked line ppt powerpoint presentation ideas model. This is a three stage process. The stages in this process are revenue in percentage, stacked line, product, business, marketing.
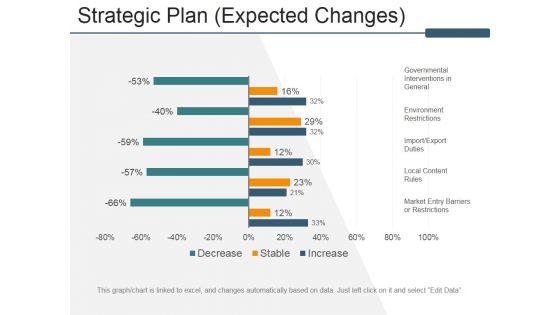
Strategic Plan Expected Changes Ppt PowerPoint Presentation Outline Graphics Tutorials
This is a strategic plan expected changes ppt powerpoint presentation outline graphics tutorials. This is a two stage process. The stages in this process are governmental interventions in general, environment restrictions, import export duties, local content rules, market entry barriers or restrictions.
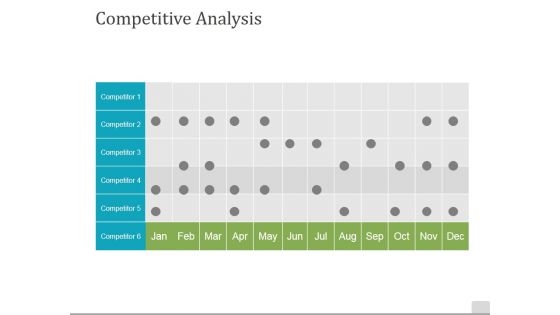
Competitive Analysis Template 2 Ppt PowerPoint Presentation Pictures Slide
This is a competitive analysis template 2 ppt powerpoint presentation pictures slide. This is a six stage process. The stages in this process are competitive, analysis, business, marketing, competitor.
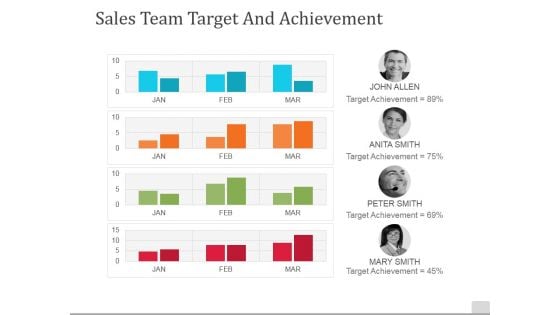
Sales Team Target And Achievement Ppt PowerPoint Presentation Pictures Deck
This is a sales team target and achievement ppt powerpoint presentation pictures deck. This is a four stage process. The stages in this process are john allen, anita smith, peter smith, mary smith.
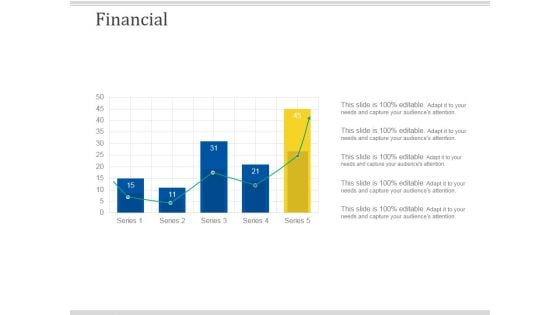
Financial Ppt PowerPoint Presentation File Infographic Template
This is a financial ppt powerpoint presentation file infographic template. This is a five stage process. The stages in this process are financial, business, marketing, presentation, success.
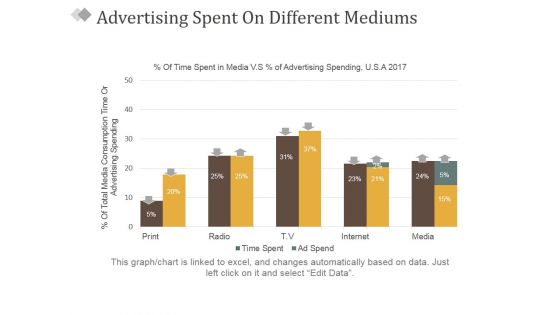
Advertising Spent On Different Mediums Ppt PowerPoint Presentation Show Example
This is a advertising spent on different mediums ppt powerpoint presentation show example. This is a five stage process. The stages in this process are business, marketing, success, tables, plan.
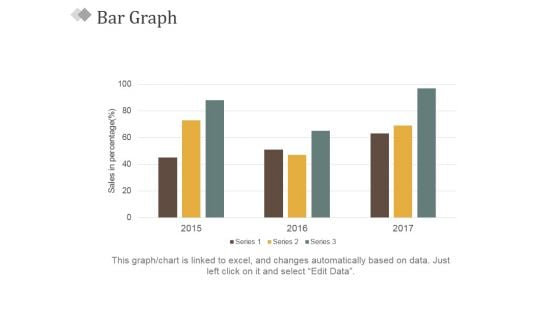
Bar Graph Ppt PowerPoint Presentation Slides Visual Aids
This is a bar graph ppt powerpoint presentation slides visual aids. This is a three stage process. The stages in this process are sales in percentage, bar graph, business, marketing, success.
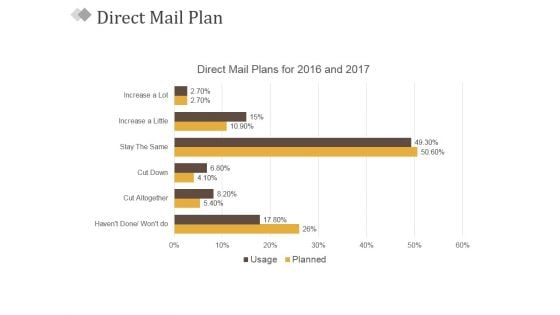
Direct Mail Plan Ppt PowerPoint Presentation Slides Shapes
This is a direct mail plan ppt powerpoint presentation slides shapes. This is a six stage process. The stages in this process are direct mail plans for 2016 and 2017, business, marketing, success, management.
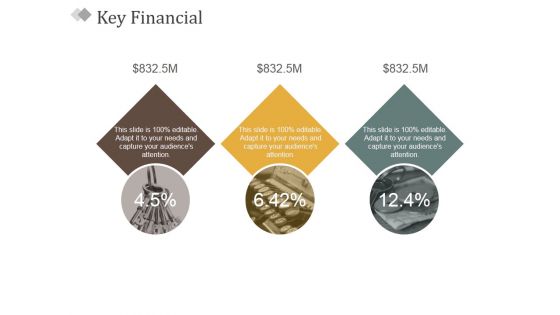
Key Financial Ppt PowerPoint Presentation Inspiration Design Ideas
This is a key financial ppt powerpoint presentation inspiration design ideas. This is a three stage process. The stages in this process are financial, business, sales, marketing, success.
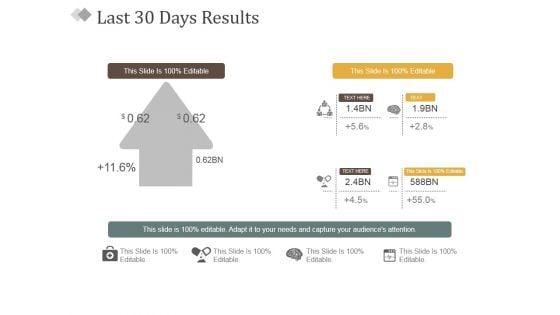
Last 30 Days Results Ppt PowerPoint Presentation Infographic Template Example
This is a last 30 days results ppt powerpoint presentation infographic template example. This is a two stage process. The stages in this process are results, business, presentation, marketing, success.
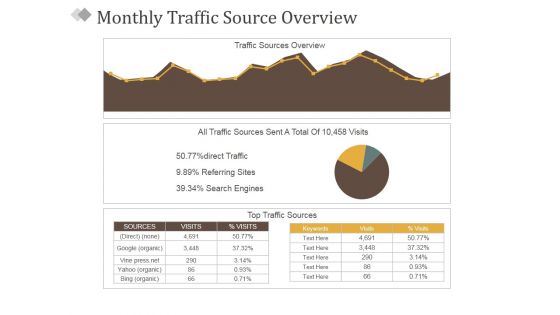
Monthly Traffic Source Overview Ppt PowerPoint Presentation Portfolio Example Topics
This is a monthly traffic source overview ppt powerpoint presentation portfolio example topics. This is a three stage process. The stages in this process are all traffic sources sent a total of 10,458 visits, top traffic sources, visits, sources, keywords.
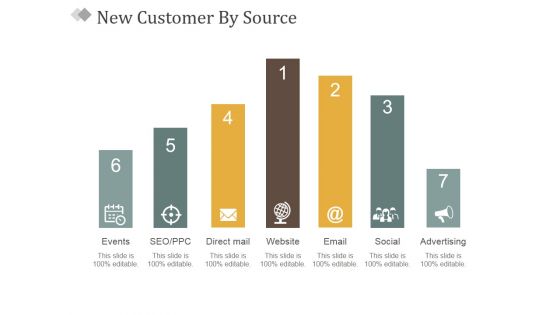
New Customer By Source Ppt PowerPoint Presentation Model Samples
This is a new customer by source ppt powerpoint presentation model samples. This is a seven stage process. The stages in this process are events, seo ppc, direct mail, website, email, social.

Organic Vs Paid Search Traffic Ppt PowerPoint Presentation Ideas Inspiration
This is a organic vs paid search traffic ppt powerpoint presentation ideas inspiration. This is a one stage process. The stages in this process are google, yahoo, bing, aol.
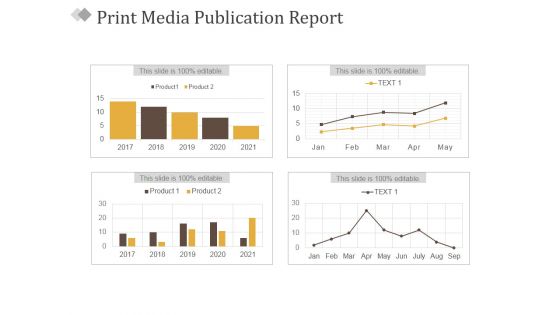
Print Media Publication Report Ppt PowerPoint Presentation Summary Information
This is a print media publication report ppt powerpoint presentation summary information. This is a four stage process. The stages in this process are business, product, marketing, management, success.
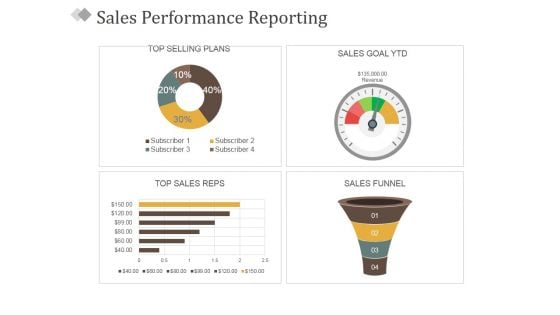
Sales Performance Reporting Ppt PowerPoint Presentation Ideas Aids
This is a sales performance reporting ppt powerpoint presentation ideas aids. This is a four stage process. The stages in this process are top selling plans, sales goal ytd, top sales reps, sales funnel.
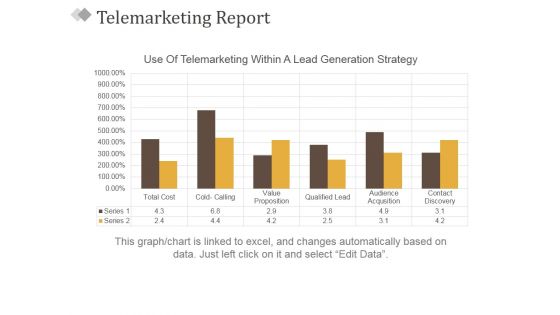
Telemarketing Report Template 2 Ppt PowerPoint Presentation Styles Model
This is a telemarketing report template 2 ppt powerpoint presentation styles model. This is a six stage process. The stages in this process are use of telemarketing within a lead generation strategy, business, bar graph, marketing, success.
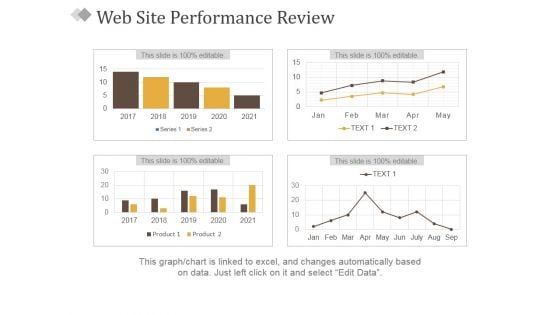
Web Site Performance Review Ppt PowerPoint Presentation Inspiration Designs Download
This is a web site performance review ppt powerpoint presentation inspiration designs download. This is a four stage process. The stages in this process are business, tables, marketing, success, planning.
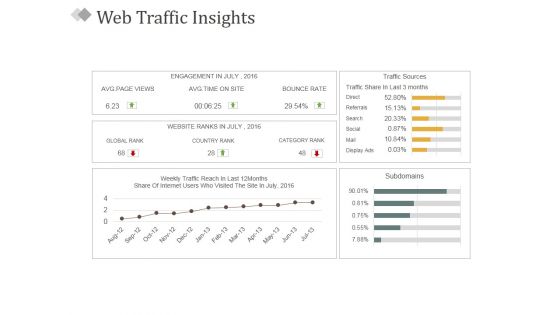
Web Traffic Insights Ppt PowerPoint Presentation Pictures Slides
This is a web traffic insights ppt powerpoint presentation pictures slides. This is a five stage process. The stages in this process are engagement in july, avg page views, global rank, country rank, category rank, bounce rate.
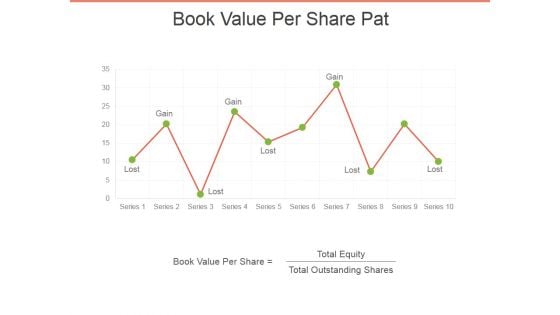
Book Value Per Share Pat Ppt PowerPoint Presentation Ideas Influencers
This is a book value per share pat ppt powerpoint presentation ideas influencers. This is a one stage process. The stages in this process are book value per share, total equity, total outstanding shares.
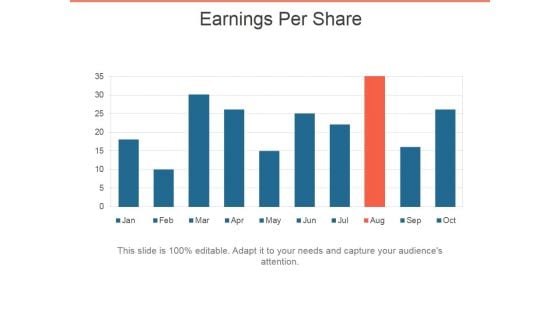
Earnings Per Share Ppt PowerPoint Presentation Layouts Ideas
This is a earnings per share ppt powerpoint presentation layouts ideas. This is a ten stage process. The stages in this process are business, years, planning, management, marketing.
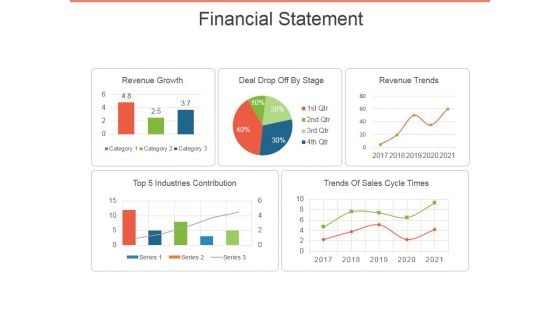
Financial Statement Ppt PowerPoint Presentation Outline Layout Ideas
This is a financial statement ppt powerpoint presentation outline layout ideas. This is a five stage process. The stages in this process are revenue growth, deal drop off by stage, revenue trends, top 5 industries contribution, trends of sales cycle times.
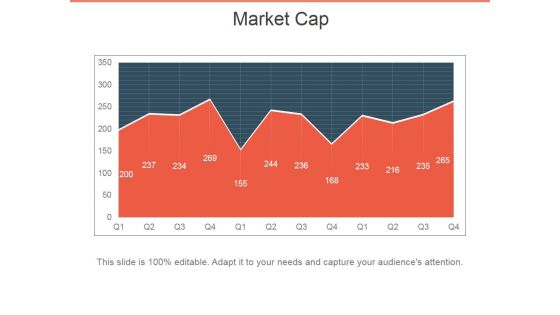
Market Cap Ppt PowerPoint Presentation File Display
This is a market cap ppt powerpoint presentation file display. This is a two stage process. The stages in this process are market cap, business, marketing, success, graph.
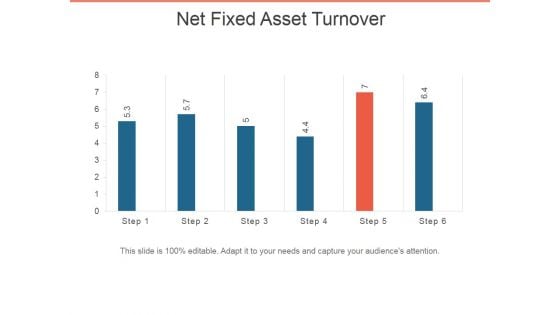
Net Fixed Asset Turnover Ppt PowerPoint Presentation Infographic Template Pictures
This is a net fixed asset turnover ppt powerpoint presentation infographic template pictures. This is a six stage process. The stages in this process are bar graph, business, marketing, presentation, success.
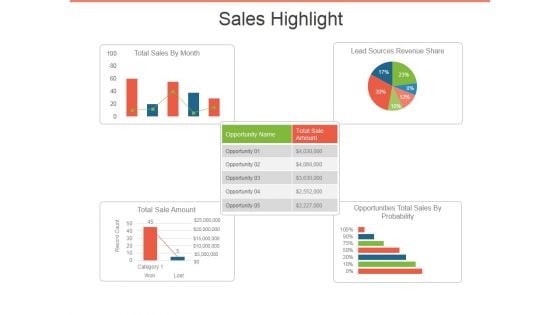
Sales Highlight Ppt PowerPoint Presentation Ideas Design Templates
This is a sales highlight ppt powerpoint presentation ideas design templates. This is a five stage process. The stages in this process are total sales by month, lead sources revenue share, opportunities total sales by probability, total sale amount.
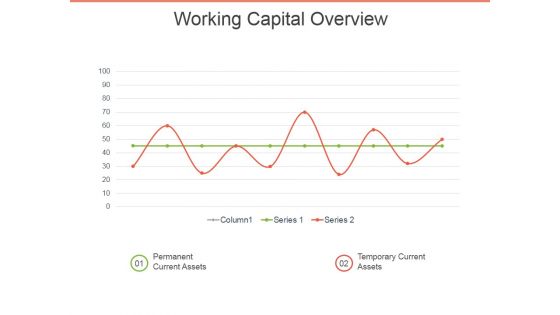
Working Capital Overview Ppt PowerPoint Presentation Model Graphics Template
This is a working capital overview ppt powerpoint presentation model graphics template. This is a two stage process. The stages in this process are permanent current assets, temporary current assets.
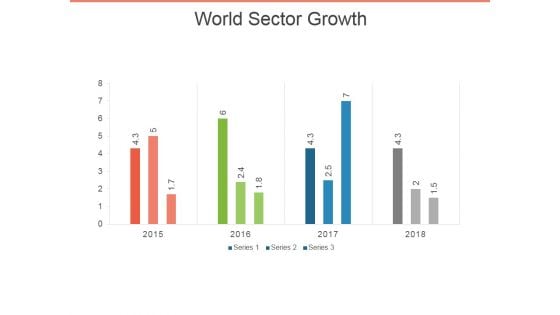
World Sector Growth Ppt PowerPoint Presentation Infographics Objects
This is a world sector growth ppt powerpoint presentation infographics objects. This is a four stage process. The stages in this process are bar graph, business, marketing, success, presentation.
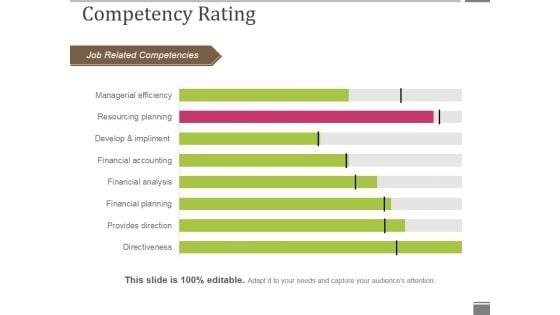
Competency Rating Template 1 Ppt PowerPoint Presentation Outline Smartart
This is a competency rating template 1 ppt powerpoint presentation outline smartart. This is a eight stage process. The stages in this process are job related competencies, competency rating, bar graph, business, marketing.
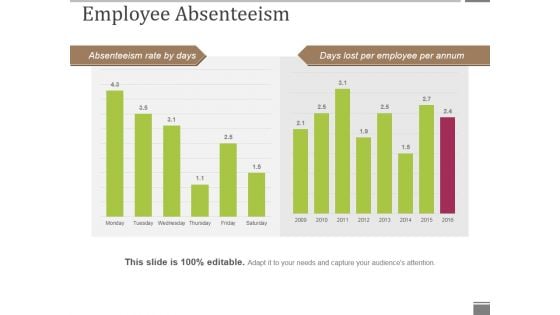
Employee Absenteeism Ppt PowerPoint Presentation Styles Show
This is a employee absenteeism ppt powerpoint presentation styles show. This is a two stage process. The stages in this process are absenteeism rate by days, days lost per employee per annum, business, planning, management.
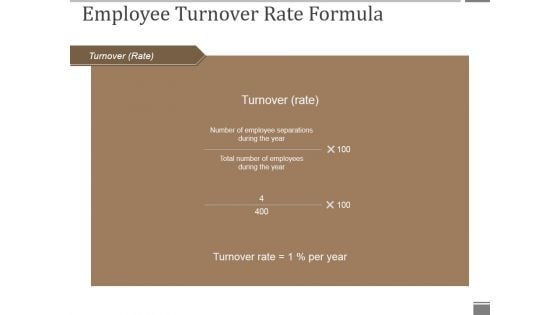
Employee Turnover Rate Formula Ppt PowerPoint Presentation Pictures Aids
This is a employee turnover rate formula ppt powerpoint presentation pictures aids. This is a five stage process. The stages in this process are employee turnover, rate of tune over, business, marketing, bar graph.
Financial Ppt PowerPoint Presentation Slides Inspiration
This is a financial ppt powerpoint presentation slides inspiration. This is a three stage process. The stages in this process are financial, business, marketing, management, sales.
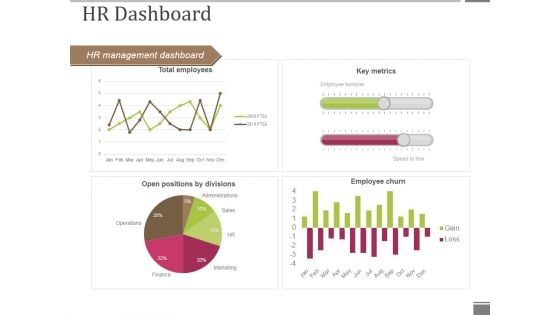
Hr Dashboard Template 1 Ppt PowerPoint Presentation Infographic Template Format Ideas
This is a hr dashboard template 1 ppt powerpoint presentation infographic template format ideas. This is a four stage process. The stages in this process are hr management dashboard, key metrics, employee churn, open positions by divisions, total employees.
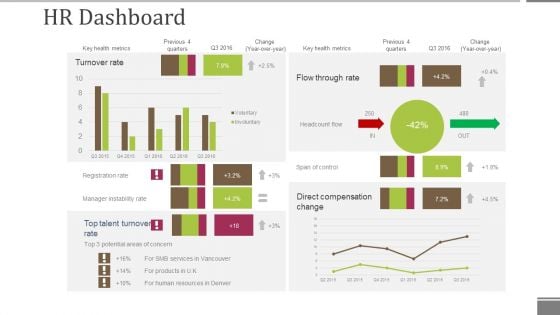
Hr Dashboard Template 2 Ppt PowerPoint Presentation File Grid
This is a hr dashboard template 2 ppt powerpoint presentation file grid. This is a four stage process. The stages in this process are turnover rate, direct compensation change, span of control, headcount flow, flow through rate.
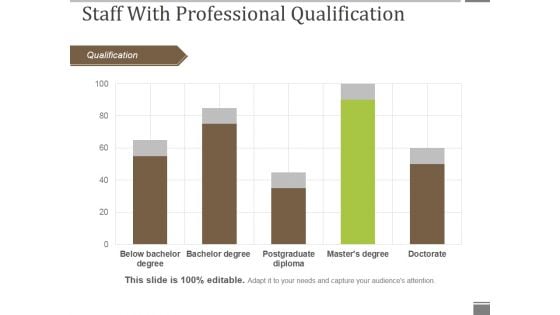
Staff With Professional Qualification Ppt PowerPoint Presentation Gallery Graphics Pictures
This is a staff with professional qualification ppt powerpoint presentation gallery graphics pictures. This is a five stage process. The stages in this process are qualification, bar graph, business, marketing, success.
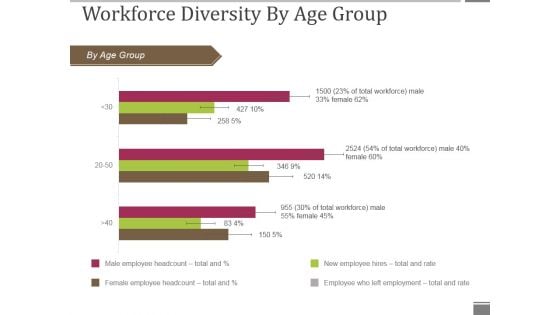
Workforce Diversity By Age Group Ppt PowerPoint Presentation Visual Aids Gallery
This is a workforce diversity by age group ppt powerpoint presentation visual aids gallery. This is a three stage process. The stages in this process are by age group, bar graph, business, marketing, presentation.
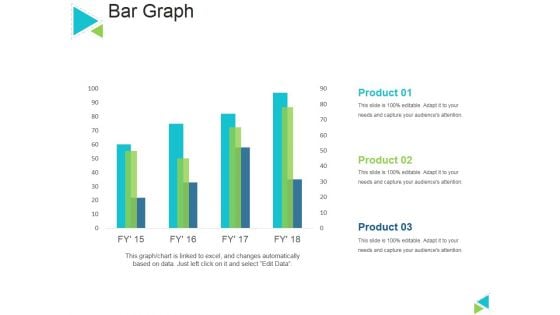
Bar Graph Ppt PowerPoint Presentation Outline Layout
This is a bar graph ppt powerpoint presentation outline layout. This is a four stage process. The stages in this process are sales in percentage, product, bar graph, business, marketing.
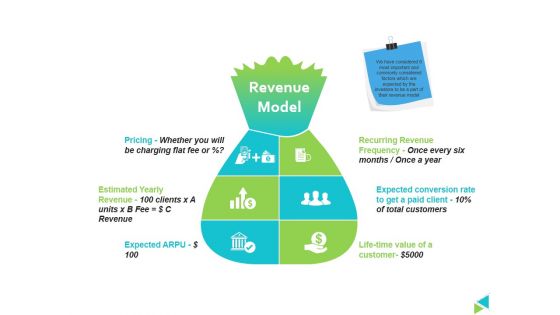
Revenue Model Ppt PowerPoint Presentation File Designs Download
This is a revenue model ppt powerpoint presentation file designs download. This is a six stage process. The stages in this process are pricing, estimated yearly revenue, life time value of a customer, recurring revenue frequency once every six months once a year.
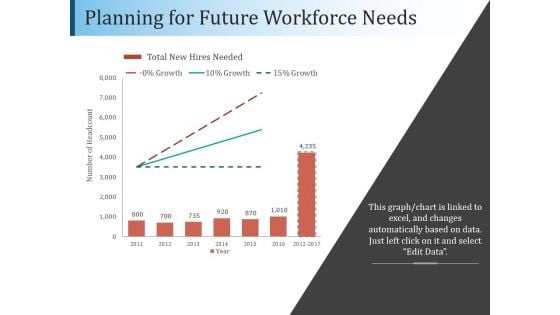
Planning For Future Workforce Needs Ppt PowerPoint Presentation Portfolio Graphics Template
This is a planning for future workforce needs ppt powerpoint presentation portfolio graphics template. This is a seven stage process. The stages in this process are hiring, business, growth, planning, success.
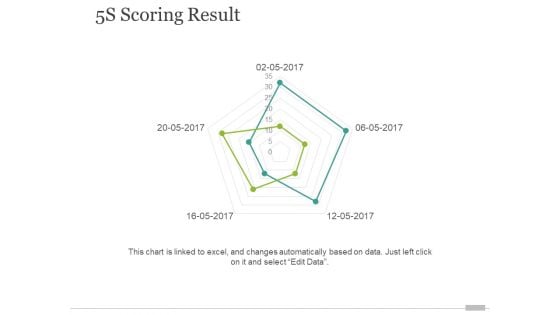
5S Scoring Result Ppt PowerPoint Presentation Portfolio Slideshow
This is a 5s scoring result ppt powerpoint presentation portfolio slideshow. This is a two stage process. The stages in this process are business, marketing, management, strategy, planning.
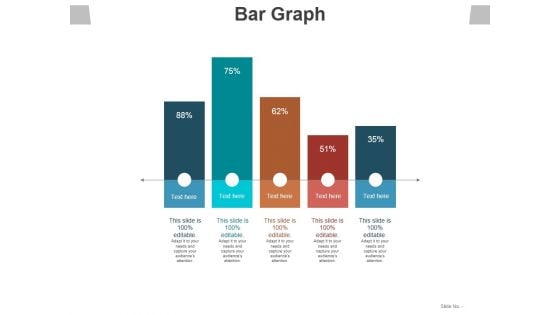
Bar Graph Ppt PowerPoint Presentation Slides Designs
This is a bar graph ppt powerpoint presentation slides designs. This is a five stage process. The stages in this process are bar graph, business, marketing, plan, financial.
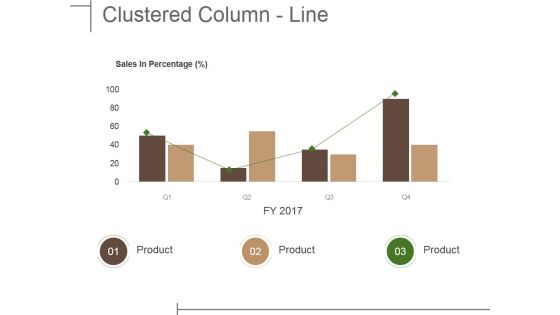
Clustered Column Line Ppt PowerPoint Presentation File Shapes
This is a clustered column line ppt powerpoint presentation file shapes. This is a four stage process. The stages in this process are business, marketing, strategy, bar, success.
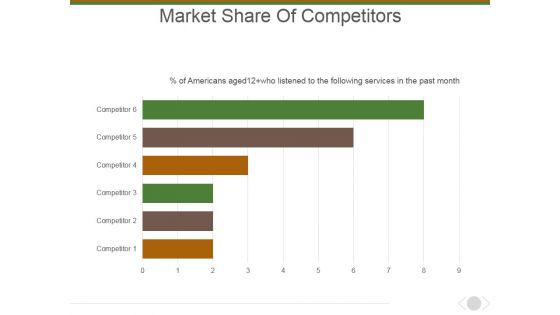
Market Share Of Competitors Ppt PowerPoint Presentation Layouts Picture
This is a market share of competitors ppt powerpoint presentation layouts picture. This is a six stage process. The stages in this process are marketing, business, management, bar graph, presentation.
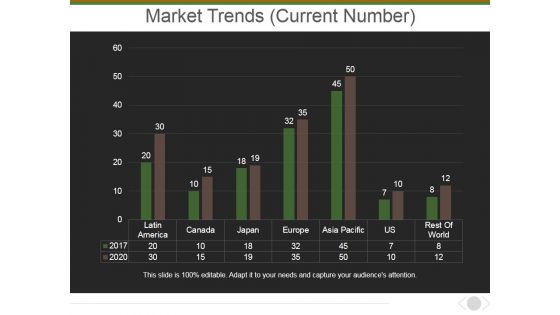
Market Trends Current Number Ppt PowerPoint Presentation Outline Rules
This is a market trends current number ppt powerpoint presentation outline rules. This is a seven stage process. The stages in this process are market, bar graph, business, country, planning.
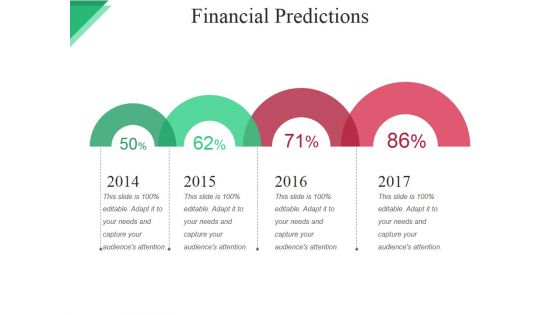
Financial Predictions Ppt PowerPoint Presentation File Clipart Images
This is a financial predictions ppt powerpoint presentation file clipart images. This is a three stage process. The stages in this process are revenue, expense, aggregate net income, monthly breakeven, aggregate breakeven.
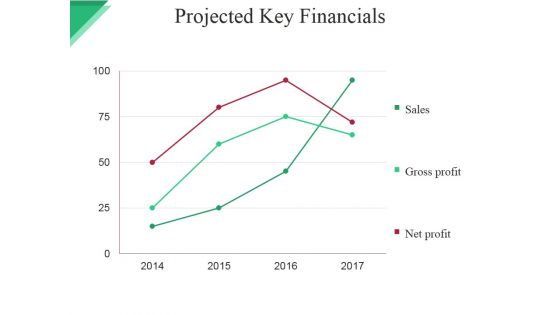
Projected Key Financials Template Ppt PowerPoint Presentation File Graphic Images
This is a projected key financials template ppt powerpoint presentation file graphic images. This is a four stage process. The stages in this process are sales, gross profit, net profit.
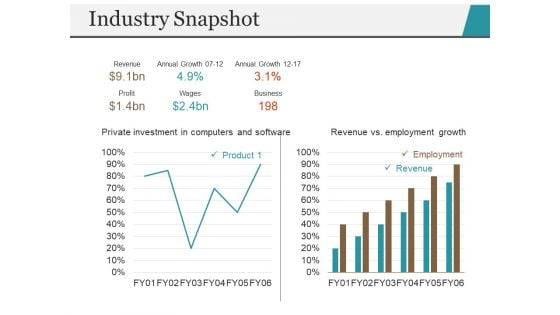
Industry Snapshot Template 1 Ppt PowerPoint Presentation Professional Design Inspiration
This is a industry snapshot template 1 ppt powerpoint presentation professional design inspiration. This is a two stage process. The stages in this process are revenue vs employment growth, employment, revenue, business, annual growth.
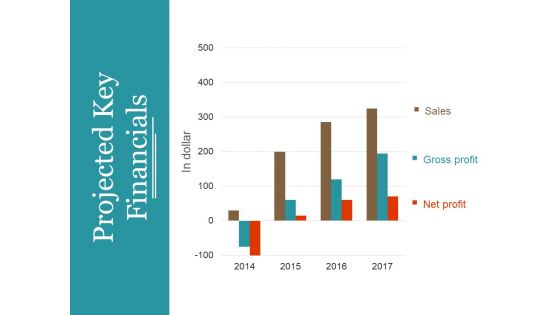
Projected Key Financials Template 1 Ppt PowerPoint Presentation Summary Professional
This is a projected key financials template 1 ppt powerpoint presentation summary professional. This is a three stage process. The stages in this process are in dollar, sales, gross profit, net profit, graph, year.
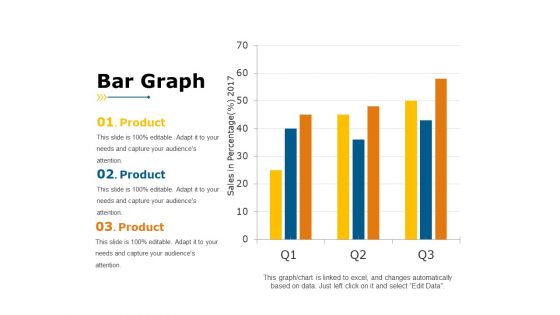
Bar Graph Ppt PowerPoint Presentation Portfolio Example
This is a bar graph ppt powerpoint presentation portfolio example. This is a three stage process. The stages in this process are sales in percentage, year, business, product, business, graph.
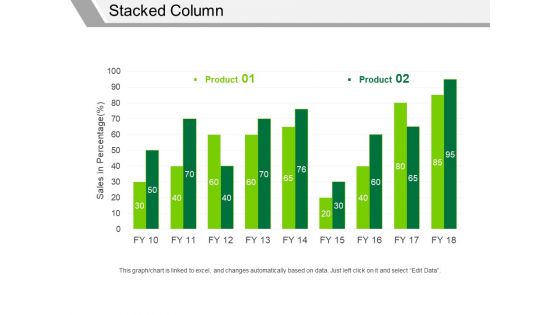
Stacked Column Ppt PowerPoint Presentation Infographics Samples
This is a stacked column ppt powerpoint presentation infographics samples. This is a two stage process. The stages in this process are product, sales in percentage, business, marketing, graph.
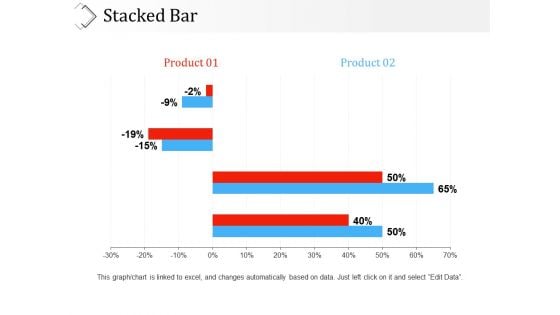
Stacked Bar Ppt PowerPoint Presentation Infographic Template Clipart
This is a stacked bar ppt powerpoint presentation infographic template clipart. This is a two stage process. The stages in this process are product, percentage, business, marketing, graph.
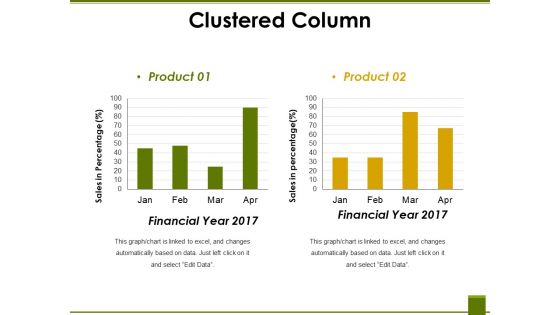
Clustered Column Ppt PowerPoint Presentation Ideas Graphic Tips
This is a clustered column ppt powerpoint presentation ideas graphic tips. This is a two stage process. The stages in this process are financial year, sales in percentage, product, graph, business.
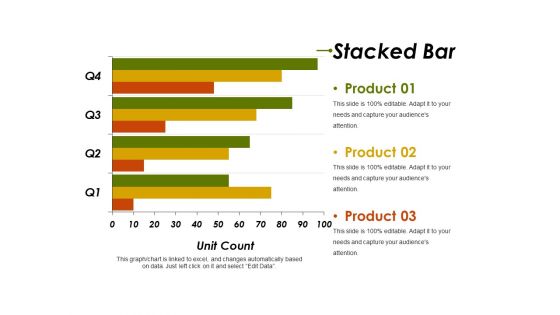
Stacked Bar Ppt PowerPoint Presentation Summary Infographics
This is a stacked bar ppt powerpoint presentation summary infographics. This is a four stage process. The stages in this process are product, unit count, business, marketing, graph.
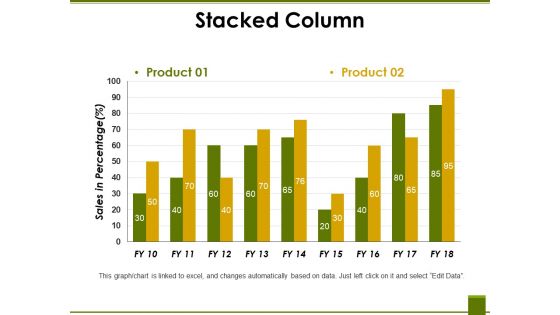
Stacked Column Ppt PowerPoint Presentation Professional Vector
This is a stacked column ppt powerpoint presentation professional vector. This is a two stage process. The stages in this process are product, sales in percentage, business, marketing, graph.
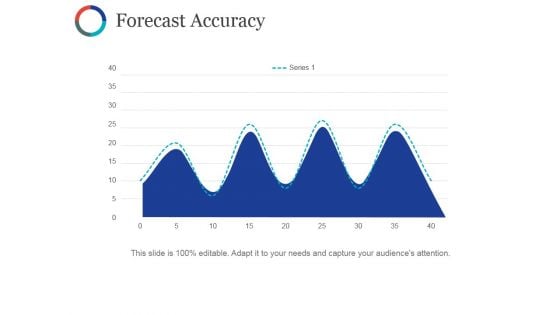
Forecast Accuracy Template Ppt PowerPoint Presentation Styles Format Ideas
This is a forecast accuracy template ppt powerpoint presentation styles format ideas. This is a four stage process. The stages in this process are business, marketing, strategy, graph, planning.
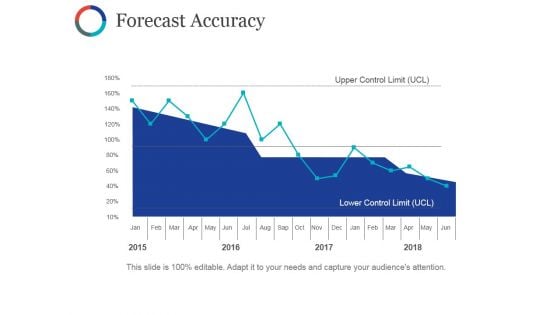
Forecast Accuracy Ppt PowerPoint Presentation Professional Graphics Template
This is a forecast accuracy ppt powerpoint presentation professional graphics template. This is a four stage process. The stages in this process are business, marketing, strategy, graph, planning.
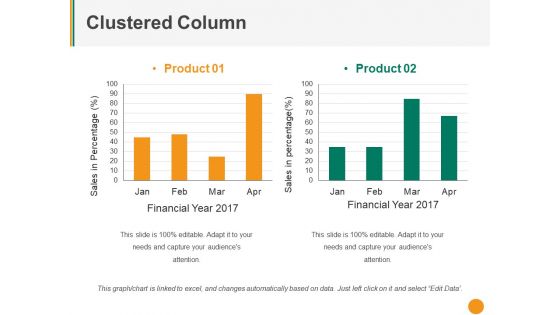
Clustered Column Ppt PowerPoint Presentation Pictures Mockup
This is a clustered column ppt powerpoint presentation pictures mockup. This is a two stage process. The stages in this process are product, sales in percentage, financial year, graph, business.
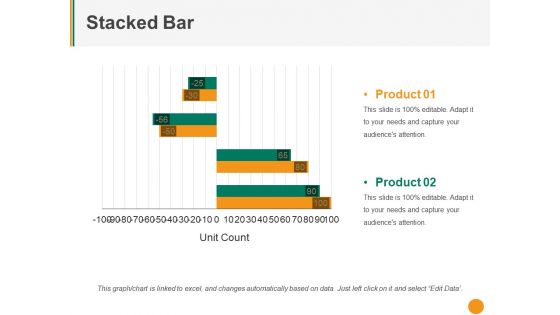
Stacked Bar Ppt PowerPoint Presentation Templates
This is a stacked bar ppt powerpoint presentation templates. This is a two stage process. The stages in this process are product, unit count, graph, business, marketing.
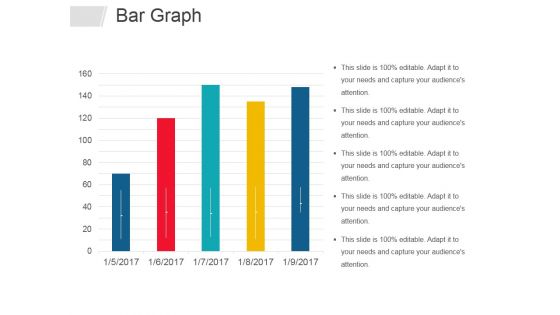
Bar Graph Ppt PowerPoint Presentation Infographics Graphics Design
This is a bar graph ppt powerpoint presentation infographics graphics design. This is a five stage process. The stages in this process are bar graph, business, years, marketing, management.
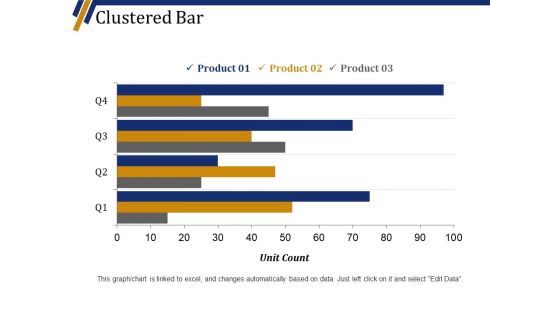
Clustered Bar Ppt PowerPoint Presentation Show Slide Portrait
This is a clustered bar ppt powerpoint presentation show slide portrait. This is a four stage process. The stages in this process are product, unit count, graph, business, marketing.
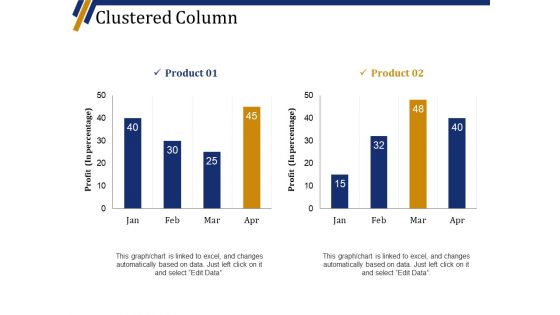
Clustered Column Ppt PowerPoint Presentation Professional Graphic Tips
This is a clustered column ppt powerpoint presentation professional graphic tips. This is a two stage process. The stages in this process are product, profit in percentage, graph, business, marketing.
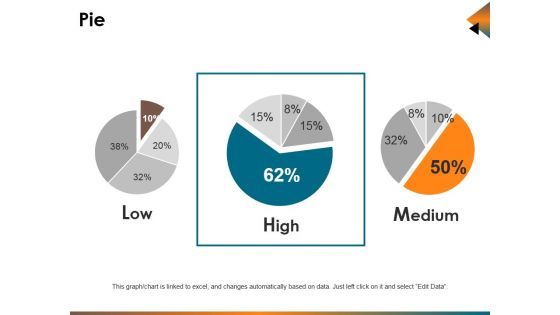
Pie Ppt PowerPoint Presentation Deck
This is a pie ppt powerpoint presentation deck. This is a three stage process. The stages in this process are low, high, medium.

Executive Summary Ppt PowerPoint Presentation Inspiration Maker
This is a executive summary ppt powerpoint presentation inspiration maker. This is a four stage process. The stages in this process are company s vision, promoters and shareholding, company s mission, background, capabilities.
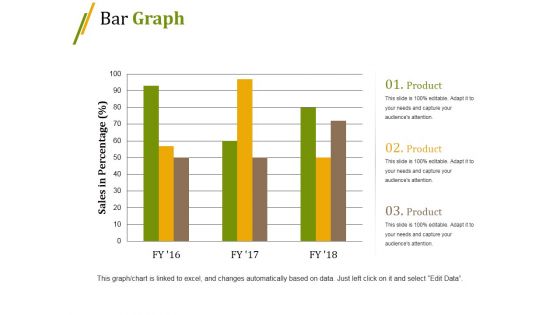
Bar Graph Ppt PowerPoint Presentation Professional Gridlines
This is a bar graph ppt powerpoint presentation professional gridlines. This is a three stage process. The stages in this process are bar, marketing, strategy, planning, growth.
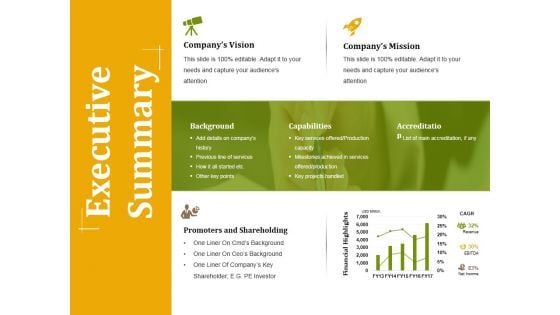
Executive Summary Ppt PowerPoint Presentation Professional Example
This is a executive summary ppt powerpoint presentation professional example. This is a four stage process. The stages in this process are background, capabilities, accreditation, promoters and shareholding, financial highlights.
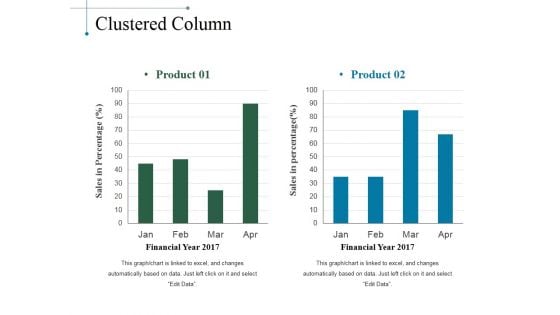
Clustered Column Ppt PowerPoint Presentation Slides Smartart
This is a clustered column ppt powerpoint presentation slides smartart. This is a two stage process. The stages in this process are product, sales in percentage, financial year, bar graph.
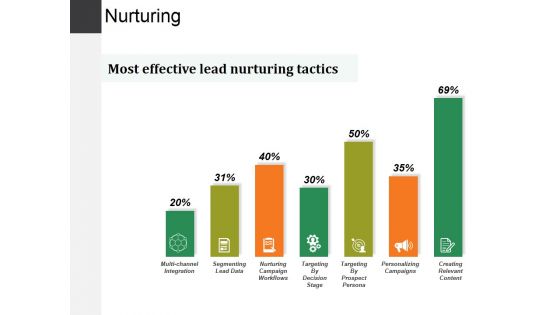
Nurturing Ppt PowerPoint Presentation Summary Brochure
This is a nurturing ppt powerpoint presentation summary brochure. This is a seven stage process. The stages in this process are segmenting lead data, nurturing campaign workflows, targeting by prospect persona, personalizing campaigns, creating relevant content.
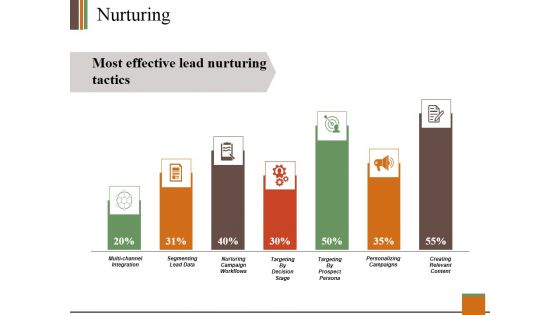
Nurturing Ppt PowerPoint Presentation Show Smartart
This is a nurturing ppt powerpoint presentation show smartart. This is a seven stage process. The stages in this process are segmenting lead data, personalizing campaigns, multi channel integration.
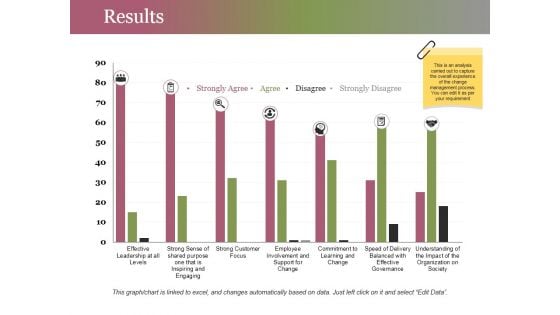
Results Ppt PowerPoint Presentation Summary Inspiration
This is a results ppt powerpoint presentation summary inspiration. This is a seven stage process. The stages in this process are effective leadership at all levels, strong customer focus, commitment to learning and change.
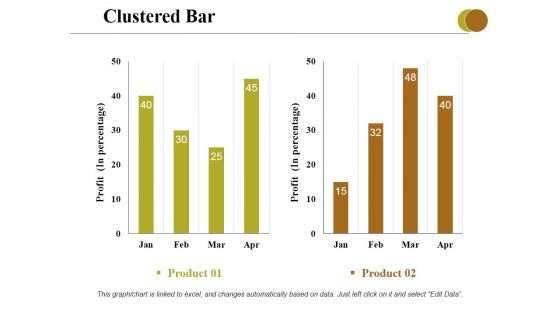
Clustered Bar Ppt PowerPoint Presentation Professional Grid
This is a clustered bar ppt powerpoint presentation professional grid. This is a two stage process. The stages in this process are profit, business, marketing, graph, strategy.
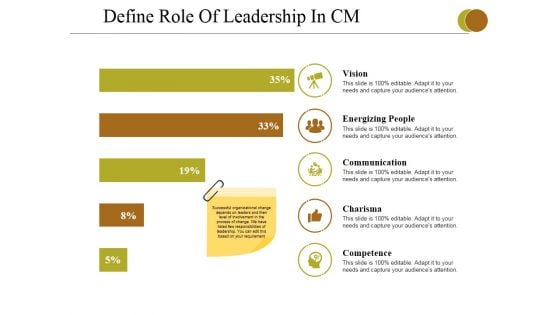
Define Role Of Leadership In Cm Ppt PowerPoint Presentation Outline Picture
This is a define role of leadership in cm ppt powerpoint presentation outline picture. This is a five stage process. The stages in this process are vision, energizing people, communication, charisma, competence.
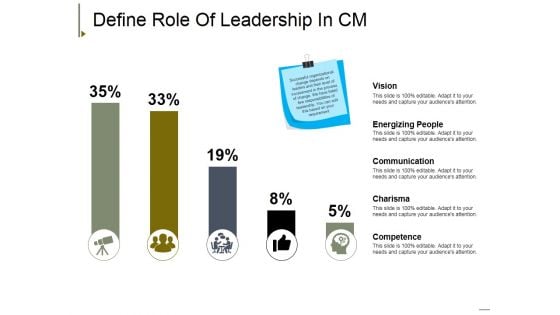
Define Role Of Leadership In Cm Ppt PowerPoint Presentation Model Example Introduction
This is a define role of leadership in cm ppt powerpoint presentation model example introduction. This is a five stage process. The stages in this process are vision, energizing people, communication, charisma, competence.
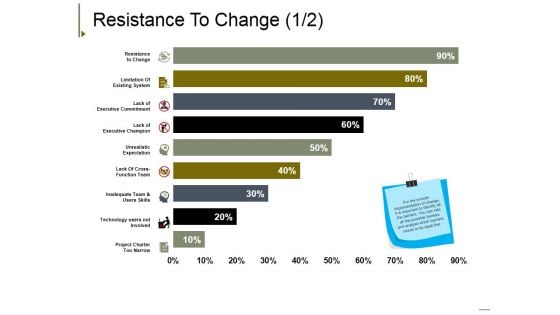
Resistance To Change Template 1 Ppt PowerPoint Presentation Slides Outline
This is a resistance to change template 1 ppt powerpoint presentation slides outline. This is a nine stage process. The stages in this process are resistance to change, limitation of existing system, lack of executive commitment, lack of executive champion, unrealistic expectation.
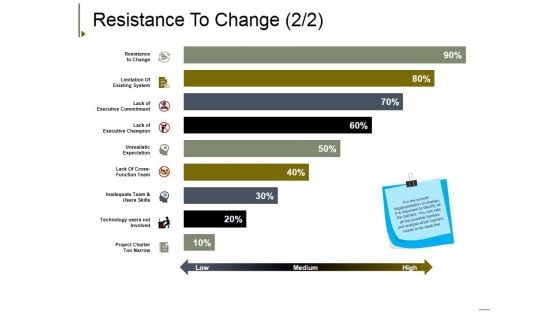
Resistance To Change Template 2 Ppt PowerPoint Presentation Summary Slide Download
This is a resistance to change template 2 ppt powerpoint presentation summary slide download. This is a nine stage process. The stages in this process are resistance to change, limitation of existing system, lack of executive commitment, lack of executive champion, unrealistic expectation.
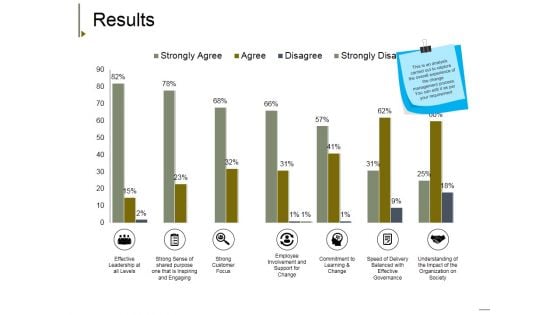
Results Ppt PowerPoint Presentation Model Gallery
This is a results ppt powerpoint presentation model gallery. This is a seven stage process. The stages in this process are effective leadership at all levels, strong sense of shared purpose one that is inspiring and engaging, strong customer focus, employee involvement and support for change, understanding of the impact of the organization on society.
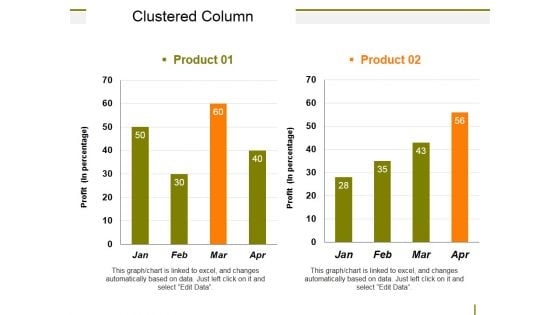
Clustered Column Ppt PowerPoint Presentation Inspiration Layouts
This is a clustered column ppt powerpoint presentation inspiration layouts. This is a two stage process. The stages in this process are business, marketing, bar, planning, strategy.
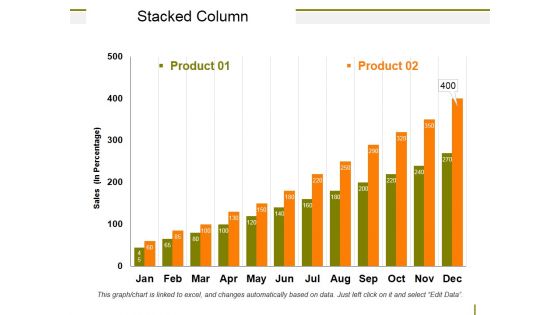
Stacked Column Ppt PowerPoint Presentation Show Tips
This is a stacked column ppt powerpoint presentation show tips. This is a two stage process. The stages in this process are business, marketing, bar, planning, strategy.
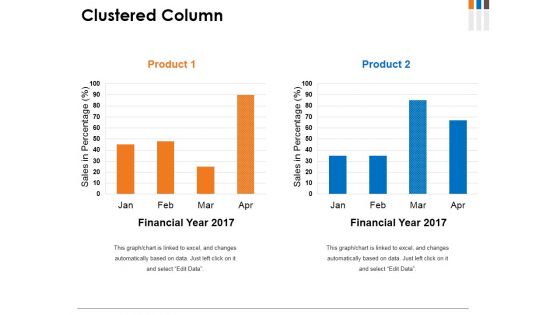
Clustered Column Ppt PowerPoint Presentation File Graphics
This is a clustered column ppt powerpoint presentation file graphics. This is a two stage process. The stages in this process are product, financial year, sales in percentage, graph, growth.
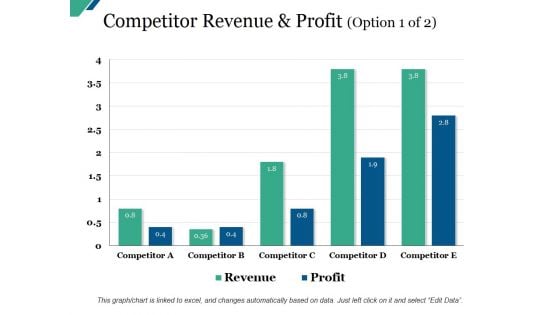
Competitor Revenue And Profit Template Ppt PowerPoint Presentation Model Design Inspiration
This is a competitor revenue and profit template ppt powerpoint presentation model design inspiration. This is a five stage process. The stages in this process are business, marketing, graph, success, growth.
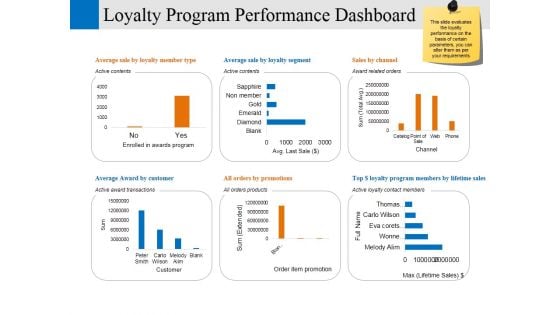
Loyalty Program Performance Dashboard Ppt PowerPoint Presentation Professional Model
This is a loyalty program performance dashboard ppt powerpoint presentation professional model. This is a six stage process. The stages in this process are enrolled in awards program, customer, order item promotion, channel, business.
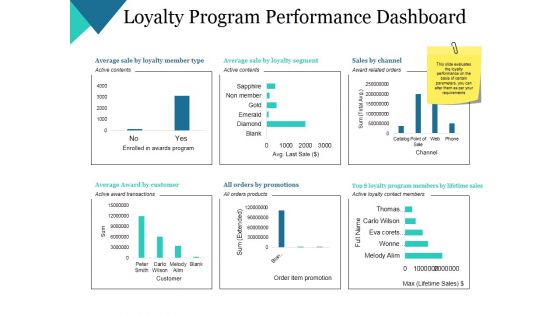
Loyalty Program Performance Dashboard Ppt PowerPoint Presentation Summary Grid
This is a loyalty program performance dashboard ppt powerpoint presentation summary grid. This is a six stage process. The stages in this process are average sale by loyalty member type, average award by customer, all orders by promotions, average sale by loyalty segment, sales by channel.
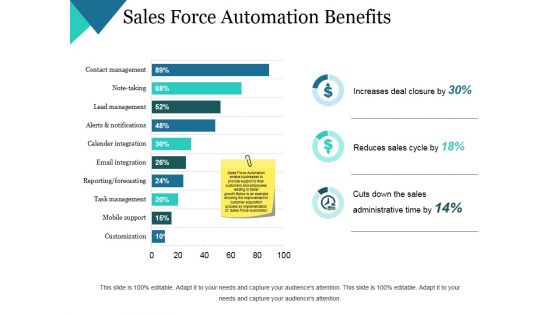
Sales Force Automation Benefits Ppt PowerPoint Presentation Infographics Samples
This is a sales force automation benefits ppt powerpoint presentation infographics samples. This is a two stage process. The stages in this process are increases deal closure by, reduces sales cycle by, cuts down the sales administrative time by, business, marketing.
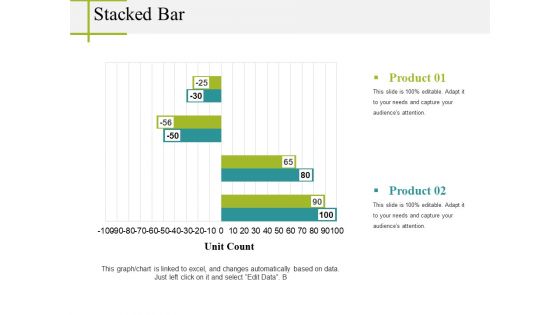
Stacked Bar Ppt PowerPoint Presentation Infographics Portrait
This is a stacked bar ppt powerpoint presentation infographics portrait. This is a two stage process. The stages in this process are unit count, business, marketing, graph, strategy.
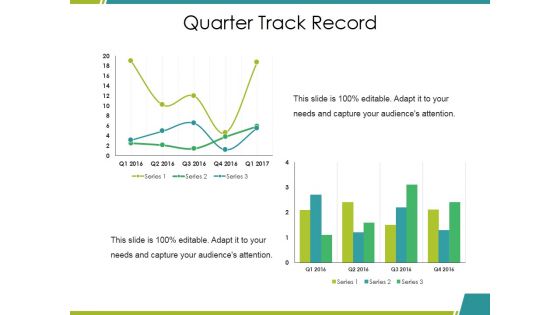
Quarter Track Record Ppt PowerPoint Presentation File Clipart Images
This is a quarter track record ppt powerpoint presentation file clipart images. This is a two stage process. The stages in this process are bar graph, growth, success, business, marketing.
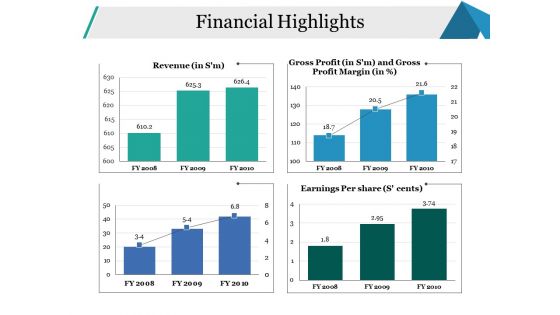
Financial Highlights Ppt PowerPoint Presentation File Background Designs
This is a financial highlights ppt powerpoint presentation file background designs. This is a four stage process. The stages in this process are revenue, earnings per share, financial, business, marketing.
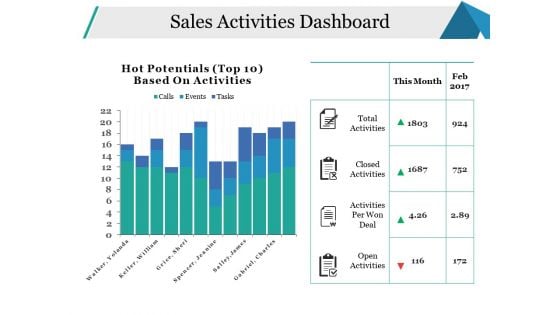
Sales Activities Dashboard Ppt PowerPoint Presentation Pictures Model
This is a sales activities dashboard ppt powerpoint presentation pictures model. This is a two stage process. The stages in this process are open activities, activities per won deal, closed activities, total activities, business.
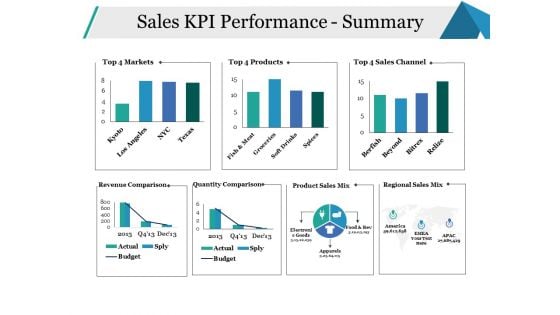
Sales KPI Performance Summary Ppt PowerPoint Presentation Infographics Model
This is a sales kpi performance summary ppt powerpoint presentation infographics model. This is a seven stage process. The stages in this process are sales channel, revenue comparison, quantity comparison, business, marketing.
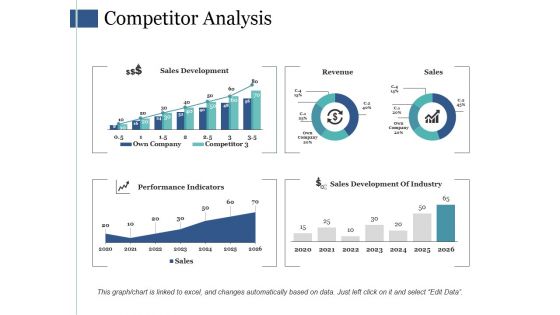
Competitor Analysis Ppt PowerPoint Presentation Slides Visuals
This is a competitor analysis ppt powerpoint presentation slides visuals. This is a four stage process. The stages in this process are sales development, revenue, sales, performance, indicators.
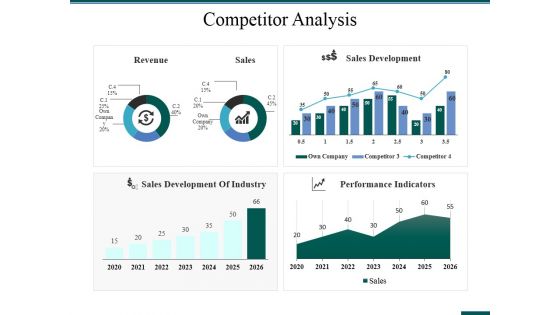
Competitor Analysis Ppt PowerPoint Presentation Model Visual Aids
This is a competitor analysis ppt powerpoint presentation model visual aids. This is a four stage process. The stages in this process are competitor analysis, revenue, sales, sales development, performance indicators.

Sales Kpi Performance Summary Ppt PowerPoint Presentation Ideas Graphics Template
This is a sales kpi performance summary ppt powerpoint presentation ideas graphics template. This is a seven stage process. The stages in this process are revenue comparison, quantity comparison, product sales mix, regional sales mix.
Sales Kpi Tracker Ppt PowerPoint Presentation Pictures Designs
This is a sales kpi tracker ppt powerpoint presentation pictures designs. This is a two stage process. The stages in this process are leads created, sales ratio, opportunities won, top products in revenue, win ratio vs last yr.
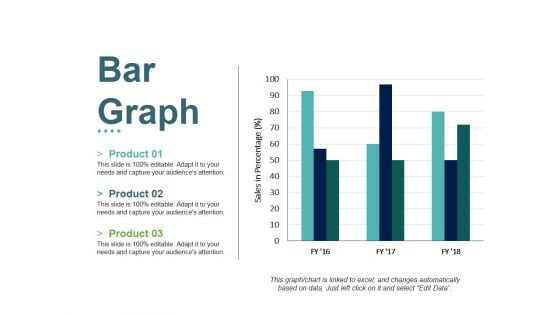
Bar Graph Ppt PowerPoint Presentation File Slides
This is a bar graph ppt powerpoint presentation file slides. This is a three stage process. The stages in this process are product, sales in percentage, bar graph, growth, success.
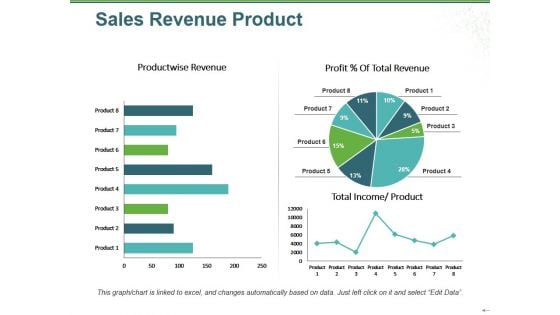
Sales Revenue Product Ppt PowerPoint Presentation Infographic Template Infographic Template
This is a sales revenue product ppt powerpoint presentation infographic template infographic template. This is a three stage process. The stages in this process are product wise revenue, total income, product, profit total revenue, pie.
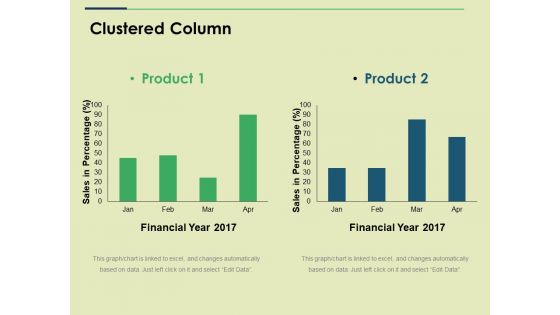
Clustered Column Ppt PowerPoint Presentation Show Graphics
This is a clustered column ppt powerpoint presentation show graphics. This is a two stage process. The stages in this process are financial year, sales in percentage, business, marketing, graph.
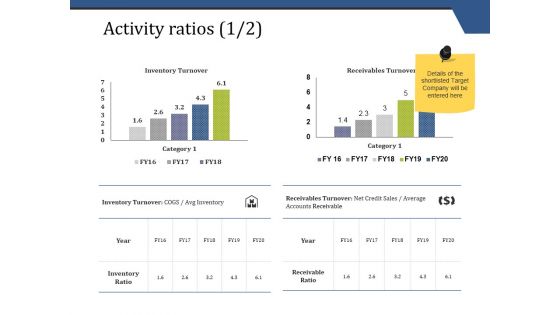
Activity Ratios Template 1 Ppt PowerPoint Presentation Show Graphics
This is a activity ratios template 1 ppt powerpoint presentation show graphics. This is a two stage process. The stages in this process are inventory turnover, receivables turnover, inventory ratio, receivable ratio.
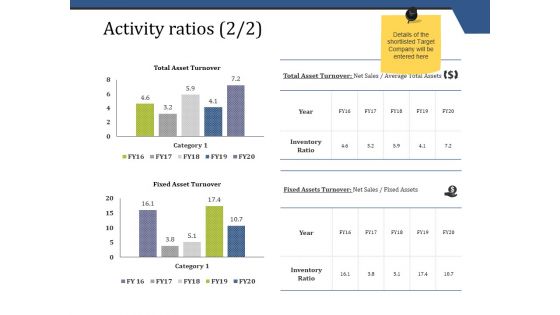
Activity Ratios Template 2 Ppt PowerPoint Presentation Pictures Template
This is a activity ratios template 2 ppt powerpoint presentation pictures template. This is a two stage process. The stages in this process are total asset turnover, fixed asset turnover.
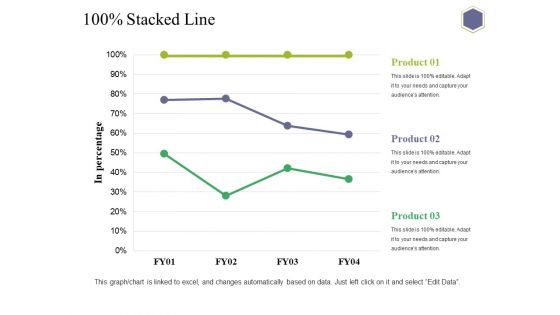
Stacked Line Ppt PowerPoint Presentation Professional Introduction
This is a stacked line ppt powerpoint presentation professional introduction. This is a three stage process. The stages in this process are in percentage, business, marketing, strategy, graph.
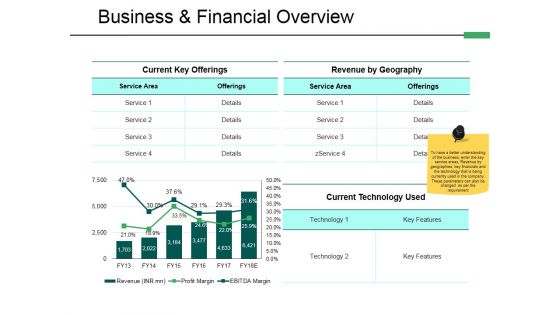
Business And Financial Overview Ppt PowerPoint Presentation Pictures Visuals
This is a business and financial overview ppt powerpoint presentation pictures visuals. This is a two stage process. The stages in this process are current key offerings, revenue by geography, current technology used, business financial overview.
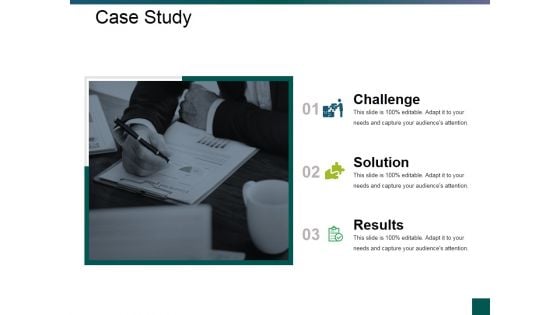
Case Study Ppt PowerPoint Presentation Slides Layouts
This is a case study ppt powerpoint presentation slides layouts. This is a three stage process. The stages in this process are Challenge, Solution, Results.
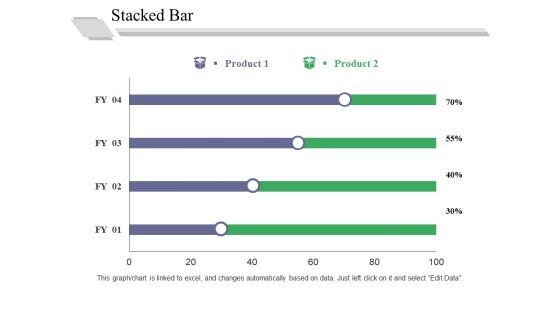
Stacked Bar Template 1 Ppt PowerPoint Presentation Outline Good
This is a stacked bar template 1 ppt powerpoint presentation outline good. This is a two stage process. The stages in this process are in percentage, business, marketing, graph, strategy.
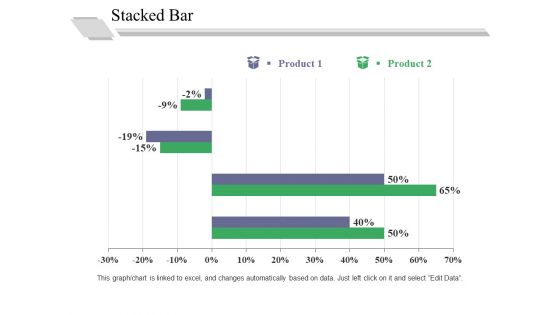
Stacked Bar Template 2 Ppt PowerPoint Presentation Professional Graphics Pictures
This is a stacked bar template 2 ppt powerpoint presentation professional graphics pictures. This is a two stage process. The stages in this process are in percentage, business, marketing, graph, strategy.
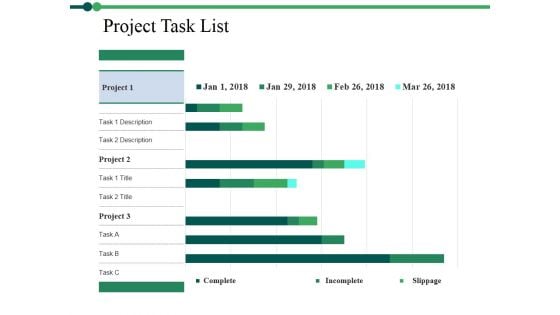
Project Task List Template 2 Ppt PowerPoint Presentation Inspiration Designs
This is a project task list template 2 ppt powerpoint presentation inspiration designs. This is a three stage process. The stages in this process are complete, incomplete, slippage.
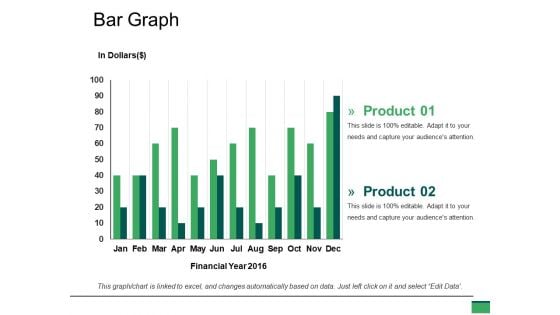
Bar Graph Ppt PowerPoint Presentation Model Vector
This is a bar graph ppt powerpoint presentation model vector. This is a two stage process. The stages in this process are graph, financial, year, business, marketing.

 Home
Home