Bank Management
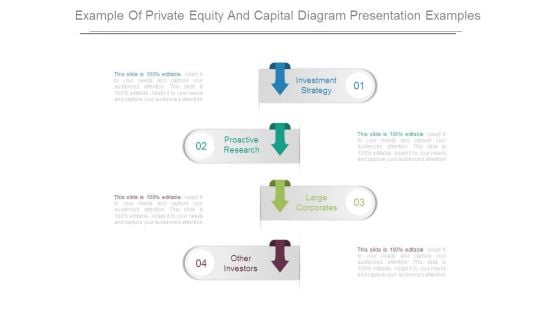
Example Of Private Equity And Capital Diagram Presentation Examples
This is a example of private equity and capital diagram presentation examples. This is a four stage process. The stages in this process are investment strategy, proactive research, large corporates, other investors.
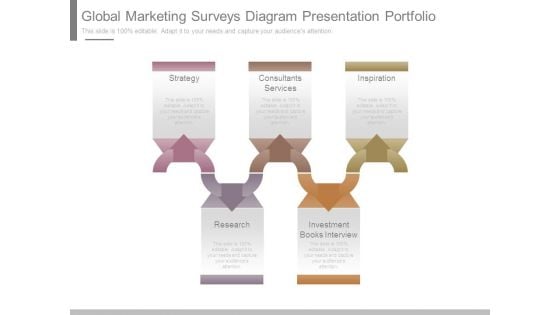
Global Marketing Surveys Diagram Presentation Portfolio
This is a global marketing surveys diagram presentation portfolio. This is a five stage process. The stages in this process are strategy, consultants services, inspiration, research, investment books interview.
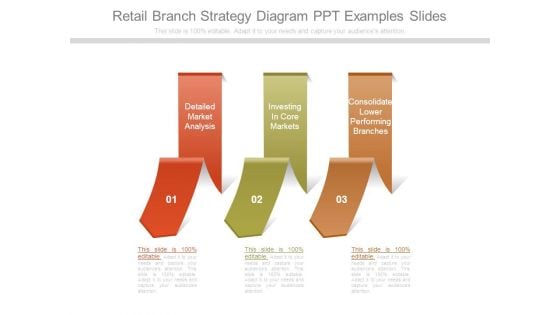
Retail Branch Strategy Diagram Ppt Examples Slides
This is a retail branch strategy diagram ppt examples slides. This is a three stage process. The stages in this process are detailed market analysis, investing in core markets, consolidate lower performing branches.
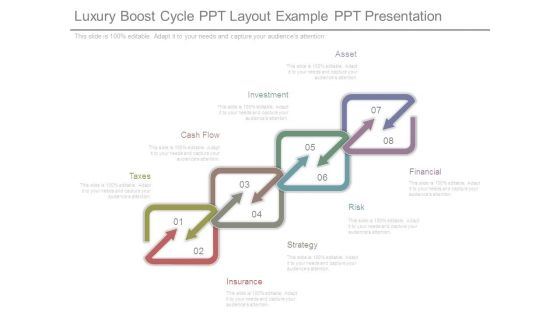
Luxury Boost Cycle Ppt Layout Example Ppt Presentation
This is a luxury boost cycle ppt layout example ppt presentation. This is a eight stage process. The stages in this process are taxes, insurance, cash flow, strategy, investment, risk, asset, financial.
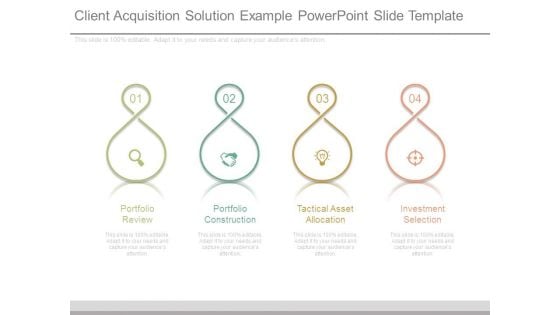
Client Acquisition Solution Example Powerpoint Slide Template
This is a client acquisition solution example powerpoint slide template. This is a four stage process. The stages in this process are portfolio review, portfolio construction, tactical asset allocation, investment selection.
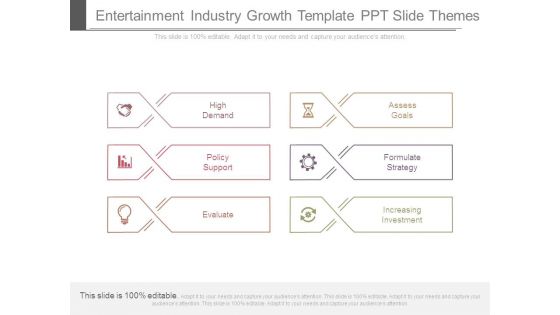
Entertainment Industry Growth Template Ppt Slide Themes
This is a entertainment industry growth template ppt slide themes. This is a six stage process. The stages in this process are high demand, policy support, evaluate, assess goals, formulate strategy, increasing investment.
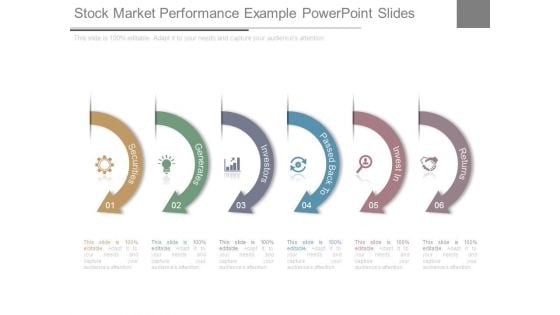
Stock Market Performance Example Powerpoint Slides
This is a stock market performance example powerpoint slides. This is a six stage process. The stages in this process are securities, generates, investors, passed back to, invest in, returns.

Roi Of Sales Promotions Template Powerpoint Templates Microsoft
This is a roi of sales promotions template powerpoint templates microsoft. This is a six stage process. The stages in this process are sales, return on investment, net income, marketing, price, market share.

Global Business Insight Diagram Powerpoint Slide Design Ideas
This is a global business insight diagram powerpoint slide design ideas. This is a five stage process. The stages in this process are doing business, global market, licensing, adaptation country student, foreign direct investment.
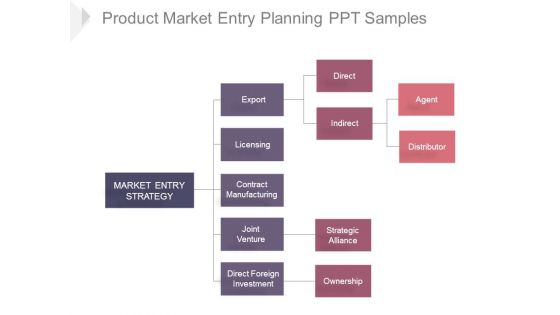
Product Market Entry Planning Ppt Samples
This is a product market entry planning ppt samples. This is a four stage process. The stages in this process are export, direct, agent, distributor, indirect, licensing, ownership, strategic alliance, joint venture, contract manufacturing, direct foreign investment, market entry strategy.
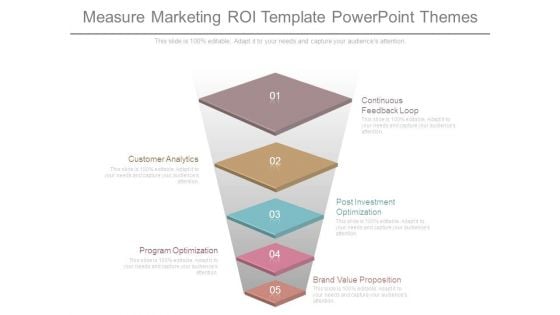
Measure Marketing Roi Template Powerpoint Themes
This is a measure marketing roi template powerpoint themes. This is a five stage process. The stages in this process are continuous feedback loop, post investment optimization, brand value proposition, customer analytics, program optimization.

Expected Return And Variance Chart Powerpoint Slide Deck Template
This is a expected return and variance chart powerpoint slide deck template. This is a one stage process. The stages in this process are investment reward, reward matrix, high, med, low.
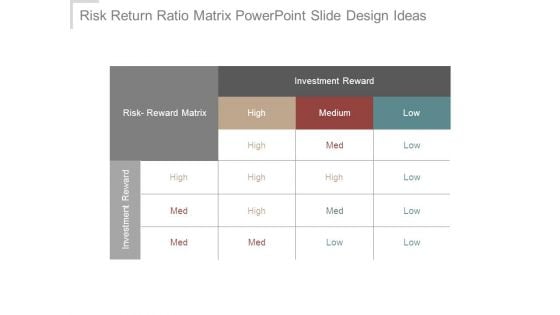
Risk Return Ratio Matrix Powerpoint Slide Design Ideas
This is a risk return ratio matrix powerpoint slide design ideas. This is a three stage process. The stages in this process are risk reward matrix, investment reward, high, medium, low.
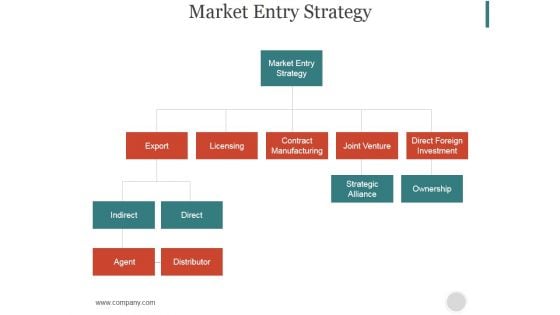
Market Entry Strategy Ppt PowerPoint Presentation Inspiration
This is a market entry strategy ppt powerpoint presentation inspiration. This is a three stage process. The stages in this process are market entry strategy, export, licensing, contract manufacturing, joint venture, direct foreign investment, strategic alliance.
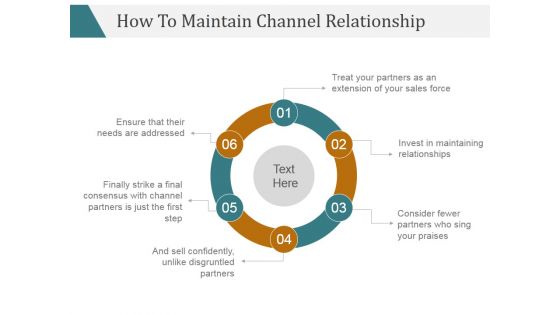
How To Maintain Channel Relationship Ppt PowerPoint Presentation Design Ideas
This is a how to maintain channel relationship ppt powerpoint presentation design ideas. This is a six stage process. The stages in this process are invest in maintaining relationships, business, marketing.
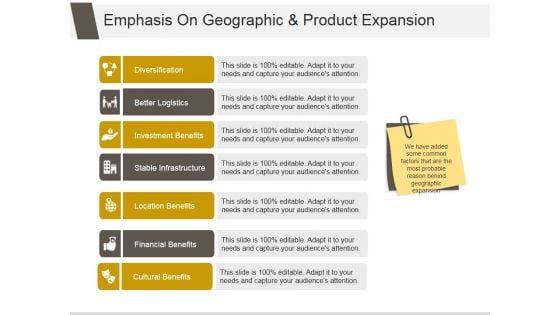
Emphasis On Geographic And Product Expansion Ppt PowerPoint Presentation Templates
This is a emphasis on geographic and product expansion ppt powerpoint presentation templates. This is a seven stage process. The stages in this process are diversification, better logistics, investment benefits, stable infrastructure, location benefits, financial benefits, cultural benefits.
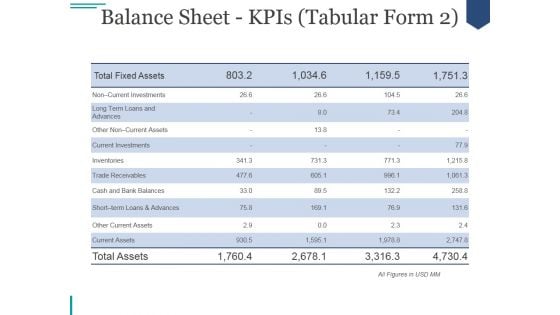
Balance Sheet Kpis Ppt PowerPoint Presentation Graphics
This is a balance sheet kpis ppt powerpoint presentation graphics. This is a five stage process. The stages in this process are long term loans and advances, other non current assets, current investments, inventories, inventories.
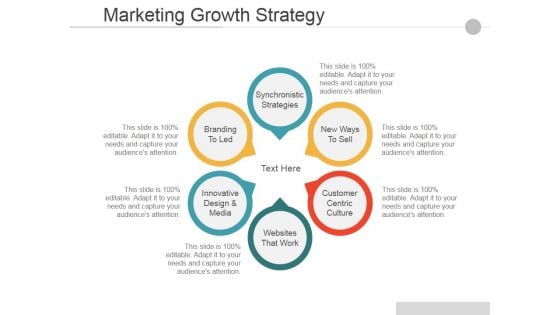
Marketing Growth Strategy Ppt PowerPoint Presentation Portfolio Rules
This is a marketing growth strategy ppt powerpoint presentation portfolio rules. This is a four stage process. The stages in this process are develop or withdraw, invest grow, harvest divest, maintain protect.
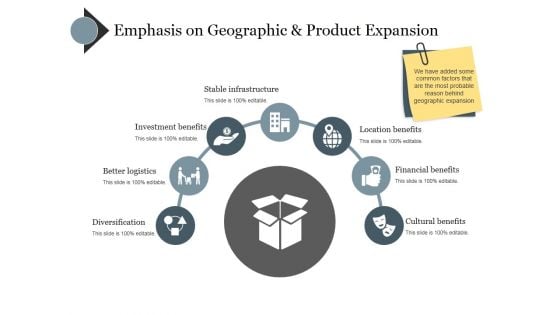
Emphasis On Geographic And Product Expansion Ppt PowerPoint Presentation Template
This is a emphasis on geographic and product expansion ppt powerpoint presentation template. This is a seven stage process. The stages in this process are diversification, better logistics, investment benefits, stable infrastructure, location benefits.
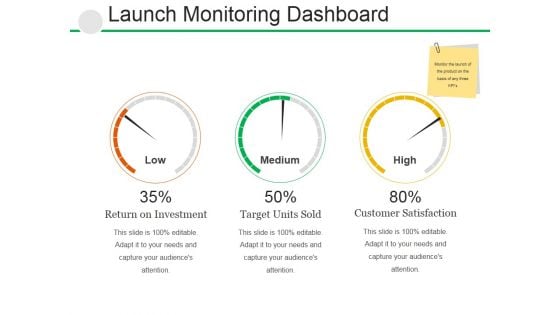
Launch Monitoring Dashboard Ppt PowerPoint Presentation Slides Structure
This is a launch monitoring dashboard ppt powerpoint presentation slides structure. This is a three stage process. The stages in this process are return on investment, target units sold, customer satisfaction.

Key Financial Ratios Template 1 Ppt PowerPoint Presentation Slides Styles
This is a key financial ratios template 1 ppt powerpoint presentation slides styles. This is a six stage process. The stages in this process are debt to equity ratio, current ratio, assets, return on, equity, return on, investment.

Emphasis Geographic And Product Expansion Ppt PowerPoint Presentation Inspiration Graphics Design
This is a emphasis geographic and product expansion ppt powerpoint presentation inspiration graphics design. This is a seven stage process. The stages in this process are diversification, better logistics, investment benefits, stable infrastructure, location benefits.
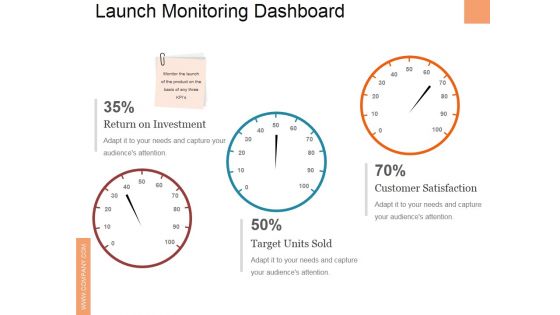
Launch Monitoring Dashboard Ppt PowerPoint Presentation File Clipart
This is a launch monitoring dashboard ppt powerpoint presentation file clipart. This is a three stage process. The stages in this process are return on investment, target units sold, customer satisfaction.
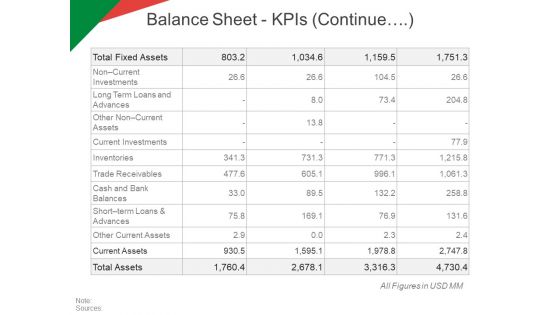
Balance Sheet Kpls Template 2 Ppt PowerPoint Presentation Pictures Rules
This is a balance sheet kpls template 2 ppt powerpoint presentation pictures rules. This is a four stage process. The stages in this process are current investments, inventories, trade receivables, other current assets, current assets.
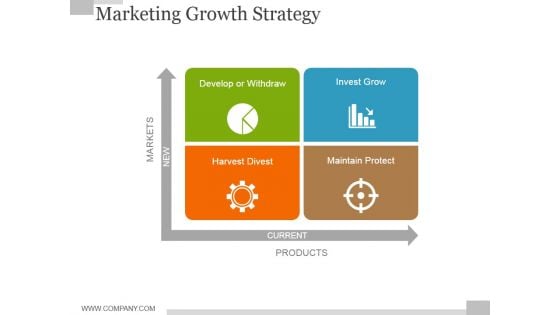
Marketing Growth Strategy Template 1 Ppt PowerPoint Presentation Professional Display
This is a marketing growth strategy template 1 ppt powerpoint presentation professional display. This is a four stage process. The stages in this process are develop or withdraw, invest grow, markets, products, current.
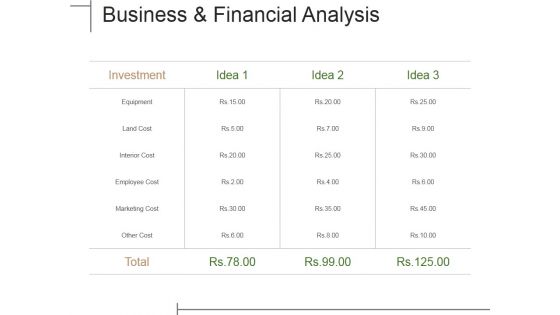
Business And Financial Analysis Ppt PowerPoint Presentation Portfolio Templates
This is a business and financial analysis ppt powerpoint presentation portfolio templates. This is a four stage process. The stages in this process are investment, tables, data analysis, marketing, equipment.
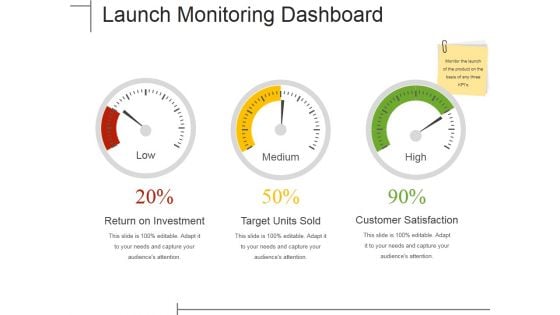
Launch Monitoring Dashboard Ppt PowerPoint Presentation Gallery Professional
This is a launch monitoring dashboard ppt powerpoint presentation gallery professional. This is a three stage process. The stages in this process are return on investment, target units sold, customer satisfaction.
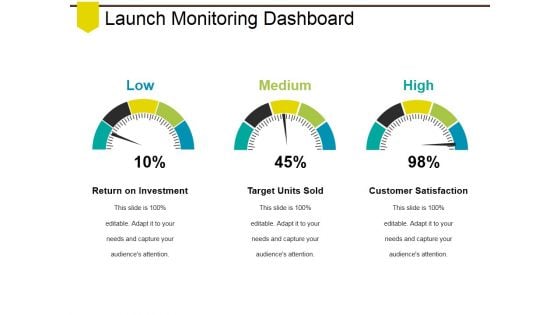
Launch Monitoring Dashboard Ppt PowerPoint Presentation Professional Inspiration
This is a launch monitoring dashboard ppt powerpoint presentation professional inspiration. This is a three stage process. The stages in this process are return on investment, target units sold, customer satisfaction.
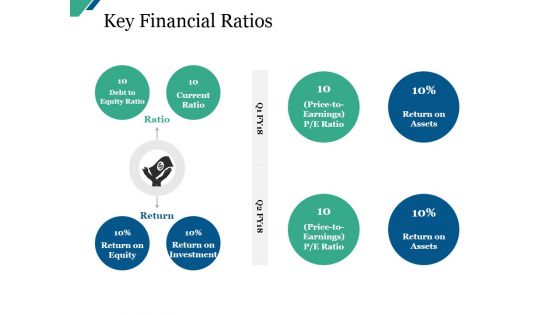
Key Financial Ratios Ppt PowerPoint Presentation Infographic Template Master Slide
This is a key financial ratios ppt powerpoint presentation infographic template master slide. This is a eight stage process. The stages in this process are debt to equity ratio, current ratio, return on equity, return on investment.
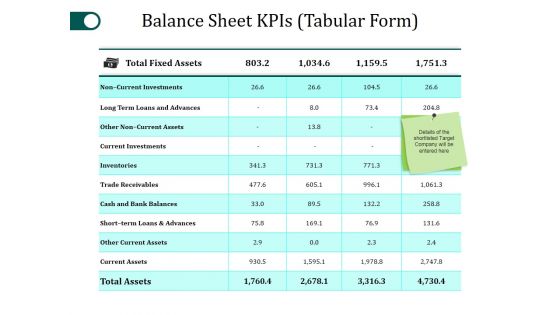
Balance Sheet Kpis Template 1 Ppt PowerPoint Presentation Pictures Example Introduction
This is a balance sheet kpis template 1 ppt powerpoint presentation pictures example introduction. This is a four stage process. The stages in this process are total fixed assets, non current investments, inventories, trade receivables.
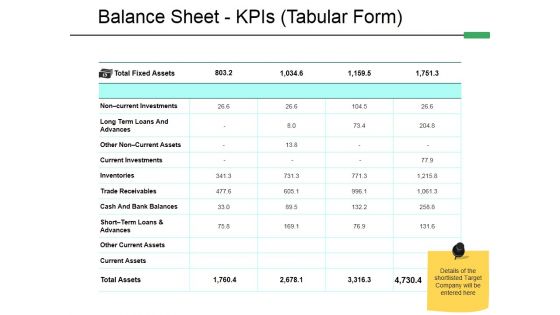
Balance Sheet Kpis Tabular Form Template 2 Ppt PowerPoint Presentation Styles Model
This is a balance sheet kpis tabular form template 2 ppt powerpoint presentation styles model. This is a four stage process. The stages in this process are advances, inventories, trade receivables, current investments, current assets, other current assets.
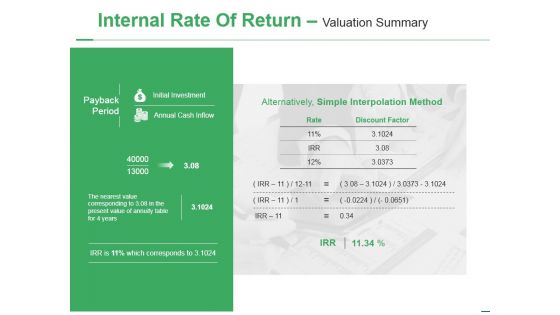
Internal Rate Of Return Valuation Summary Ppt PowerPoint Presentation Layouts Smartart
This is a internal rate of return valuation summary ppt powerpoint presentation layouts smartart. This is a two stage process. The stages in this process are payback period, initial investment, annual cash inflow, discount factor, rate.
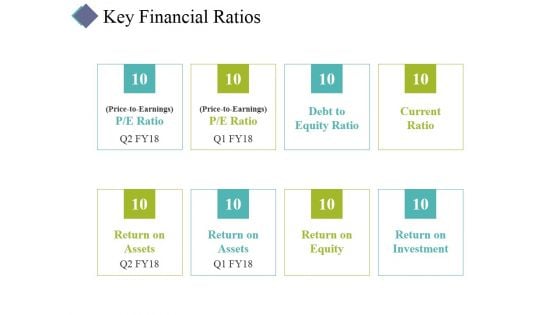
Key Financial Ratios Ppt PowerPoint Presentation Styles Portfolio
This is a key financial ratios ppt powerpoint presentation styles portfolio. This is a eight stage process. The stages in this process are return on assets, return on equity, return on investment, current ratio, debt to equity ratio.
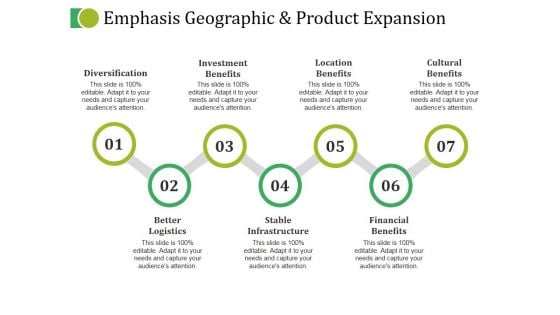
Emphasis Geographic And Product Expansion Ppt PowerPoint Presentation Show Example
This is a emphasis geographic and product expansion ppt powerpoint presentation show example. This is a seven stage process. The stages in this process are diversification, investment benefits, location benefits, cultural benefits, better logistics.
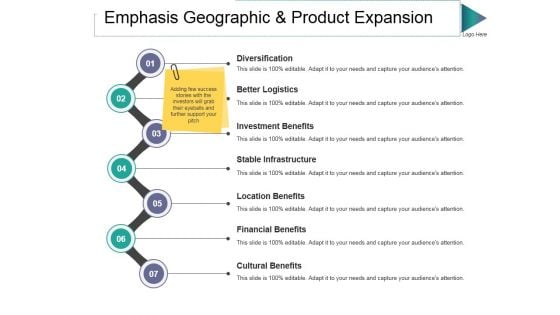
Emphasis Geographic And Product Expansion Ppt PowerPoint Presentation Show Layout Ideas
This is a emphasis geographic and product expansion ppt powerpoint presentation show layout ideas. This is a seven stage process. The stages in this process are diversification, better logistics, investment benefits, cultural benefits, location benefits.
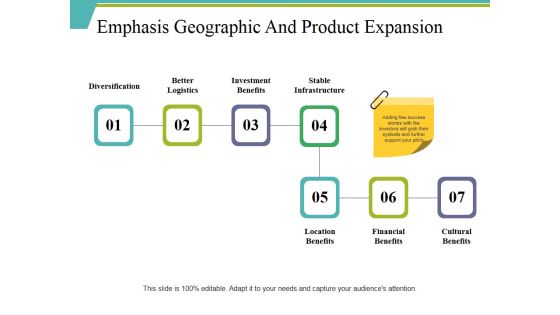
Emphasis Geographic And Product Expansion Ppt PowerPoint Presentation Gallery Rules
This is a emphasis geographic and product expansion ppt powerpoint presentation gallery rules. This is a seven stage process. The stages in this process are diversification, investment benefits, stable infrastructure, financial benefits, cultural benefits.
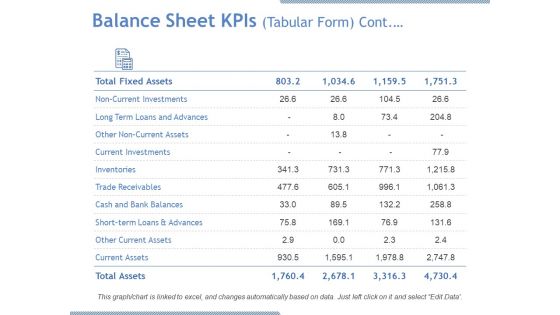
Balance Sheet Kpis Tabular Form Continuous Ppt PowerPoint Presentation Model Graphic Images
This is a balance sheet kpis tabular form continuous ppt powerpoint presentation model graphic images. This is a four stage process. The stages in this process are current investments, inventories, current assets, total assets, trade receivables.
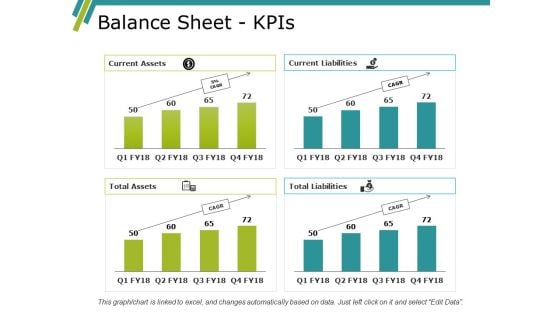
Balance Sheet Kpis Ppt PowerPoint Presentation Inspiration Information
This is a balance sheet kpis ppt powerpoint presentation inspiration information. This is a four stage process. The stages in this process are long term loans and advances, current investments, inventories, trade receivables.

Balance Sheet Kpis Tabular Form Cont Ppt PowerPoint Presentation Model Graphics Tutorials
This is a balance sheet kpis tabular form cont ppt powerpoint presentation model graphics tutorials. This is a four stage process. The stages in this process are long term loans and advances, current investments, inventories, trade receivables.
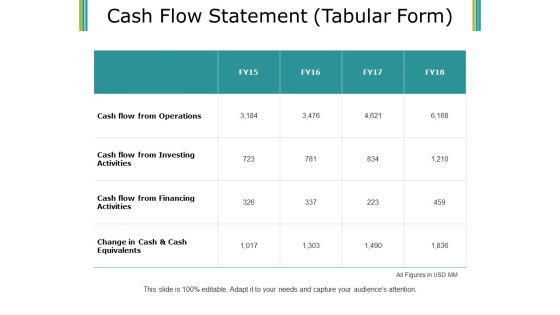
Cash Flow Statement Ppt PowerPoint Presentation Model Slideshow
This is a cash flow statement ppt powerpoint presentation model slideshow. This is a four stage process. The stages in this process are cash flow from operations, cash flow from investing activities, cash flow statement.
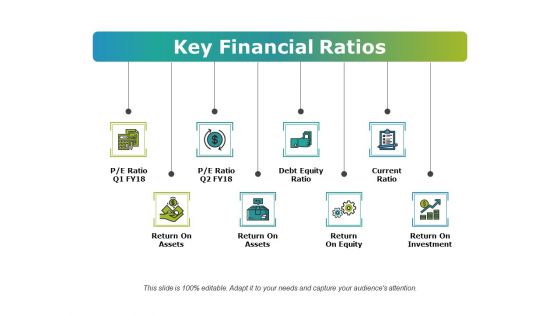
Key Financial Ratios Ppt PowerPoint Presentation Gallery Example
This is a key financial ratios ppt powerpoint presentation gallery example. This is a eight stage process. The stages in this process are return on assets, return on equity, return on investment, current ratio, debt equity ratio.
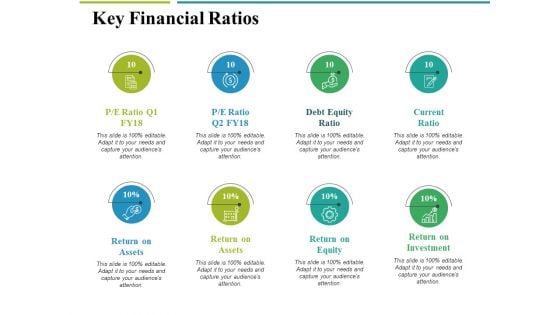
Key Financial Ratios Ppt PowerPoint Presentation Portfolio Summary
This is a key financial ratios ppt powerpoint presentation portfolio summary. This is a eight stage process. The stages in this process are return on assets, return on equity, return on investment, debt equity ratio, current ratio.
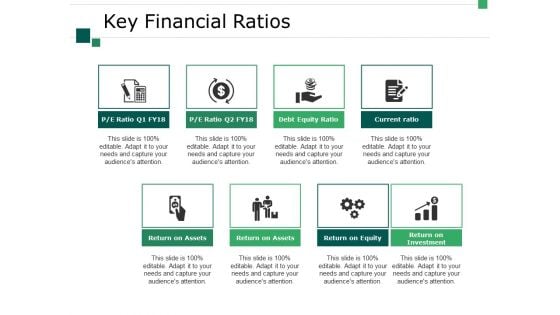
Key Financial Ratios Ppt PowerPoint Presentation Outline Slide
This is a key financial ratios ppt powerpoint presentation outline slide. This is a eight stage process. The stages in this process are return on assets, return on equity, return on investment, current ratio, debt equity ratio.
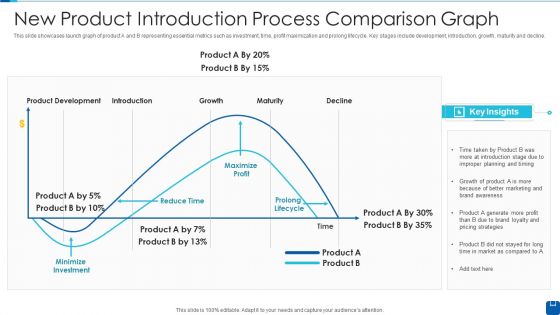
New Product Introduction Process Comparison Graph Slides PDF
This slide showcases launch graph of product A and B representing essential metrics such as investment, time, profit maximization and prolong lifecycle. Key stages include development, introduction, growth, maturity and decline.Showcasing this set of slides titled New Product Introduction Process Comparison Graph Slides PDF The topics addressed in these templates are Product Development, Improper Planning, Minimize Investment All the content presented in this PPT design is completely editable. Download it and make adjustments in color, background, font etc. as per your unique business setting.
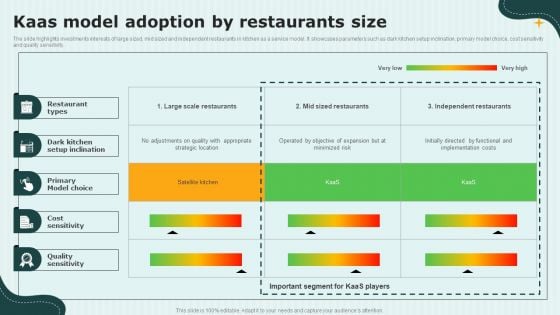
International Cloud Kitchen Industry Analysis Kaas Model Adoption By Restaurants Size Information PDF
The slide highlights investments interests of large sized, mid sized and independent restaurants in kitchen as a service model. It showcases parameters such as dark kitchen setup inclination, primary model choice, cost sensitivity and quality sensitivity. The best PPT templates are a great way to save time, energy, and resources. Slidegeeks have 100 percent editable powerpoint slides making them incredibly versatile. With these quality presentation templates, you can create a captivating and memorable presentation by combining visually appealing slides and effectively communicating your message. Download International Cloud Kitchen Industry Analysis Kaas Model Adoption By Restaurants Size Information PDF from Slidegeeks and deliver a wonderful presentation.
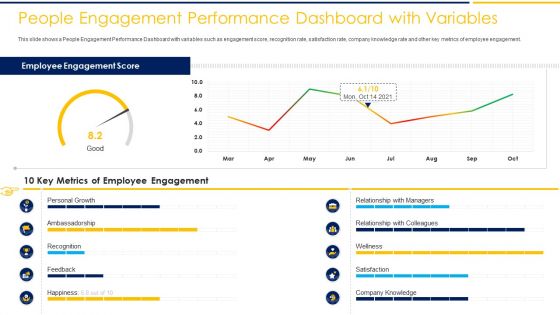
People Engagement Performance Dashboard With Variables Growth Ppt Summary Example PDF
This slide shows a People Engagement Performance Dashboard with variables such as engagement score, recognition rate, satisfaction rate, company knowledge rate and other key metrics of employee engagement. Deliver and pitch your topic in the best possible manner with this people engagement performance dashboard with variables growth ppt summary example pdf. Use them to share invaluable insights on 10 key metrics of employee engagement, employee engagement score and impress your audience. This template can be altered and modified as per your expectations. So, grab it now.
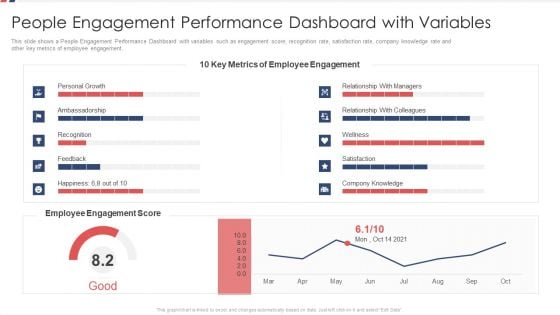
People Engagement Performance Dashboard With Variables Ppt Gallery Example File PDF
This slide shows a People Engagement Performance Dashboard with variables such as engagement score, recognition rate, satisfaction rate, company knowledge rate and other key metrics of employee engagement. Deliver and pitch your topic in the best possible manner with this people engagement performance dashboard with variables ppt gallery example file pdf. Use them to share invaluable insights on personal growth, employee engagement score, employee engagement metrics and impress your audience. This template can be altered and modified as per your expectations. So, grab it now.
Optimization Of Product Development Life Cycle Impact Of Customized Products On Customer Spending Icons PDF
This slide shows impact of customized products on customer spending which includes number of purchased items, value to average order and net promoter score. Deliver an awe inspiring pitch with this creative optimization of product development life cycle impact of customized products on customer spending icons pdf bundle. Topics like number of items purchased, values of the average order, net promoter scores can be discussed with this completely editable template. It is available for immediate download depending on the needs and requirements of the user.
Bar Graph Representing Accomplishment Metrics For Customer Service Team Icons PDF
This slide shows the graphical representation of success metrics that helps to measure the customer service team which includes customer lifetime value, customer churn, net promoter score, revenues churn, customer experience score, customer renewals, etc. Showcasing this set of slides titled bar graph representing accomplishment metrics for customer service team icons pdf. The topics addressed in these templates are importance level, least important. All the content presented in this PPT design is completely editable. Download it and make adjustments in color, background, font etc. as per your unique business setting.
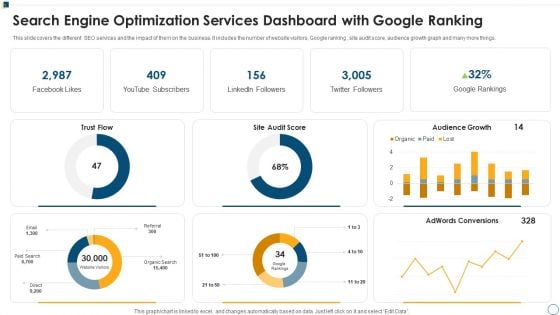
Search Engine Optimization Services Dashboard With Google Ranking Ppt Gallery Demonstration PDF
This slide covers the different SEO services and the impact of them on the business. It includes the number of website visitors, Google ranking , site audit score, audience growth graph and many more things. Pitch your topic with ease and precision using this Search Engine Optimization Services Dashboard With Google Ranking Ppt Gallery Demonstration PDF. This layout presents information on Audience Growth Paid, Adwords Conversions Score. It is also available for immediate download and adjustment. So, changes can be made in the color, design, graphics or any other component to create a unique layout.
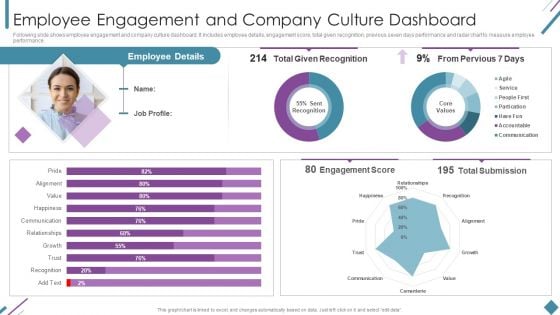
Metrics To Measure Business Performance Employee Engagement And Company Culture Demonstration PDF
Following slide shows employee engagement and company culture dashboard. It includes employee details, engagement score, total given recognition, previous seven days performance and radar chart to measure employee performance. Deliver and pitch your topic in the best possible manner with this Metrics To Measure Business Performance Employee Engagement And Company Culture Demonstration PDF. Use them to share invaluable insights on Employee Details, Total Given Recognition, Engagement Score and impress your audience. This template can be altered and modified as per your expectations. So, grab it now.
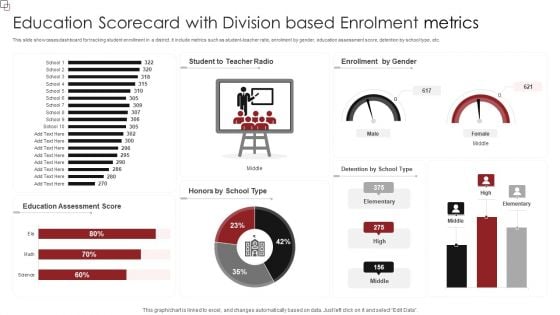
Education Scorecard With Division Based Enrolment Metrics Professional PDF
This slide showcases dashboard for tracking student enrollment in a district. It include metrics such as student-teacher ratio, enrolment by gender, education assessment score, detention by school type, etc. Pitch your topic with ease and precision using this Education Scorecard With Division Based Enrolment Metrics Professional PDF. This layout presents information on Education Assessment Score, Enrollment Gender. It is also available for immediate download and adjustment. So, changes can be made in the color, design, graphics or any other component to create a unique layout.
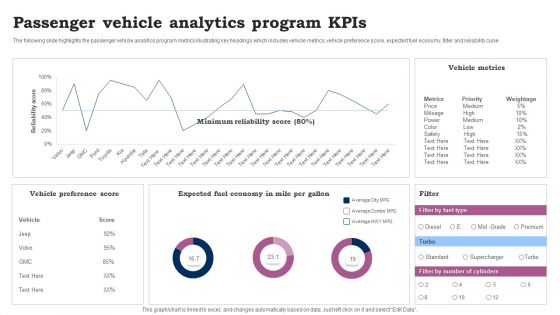
Passenger Vehicle Analytics Program Kpis Ppt Pictures Demonstration PDF
The following slide highlights the passenger vehicle analytics program metrics illustrating key headings which includes vehicle metrics, vehicle preference score, expected fuel economy, filter and reliability curve. Showcasing this set of slides titled Passenger Vehicle Analytics Program Kpis Ppt Pictures Demonstration PDF. The topics addressed in these templates are Vehicle Preference Score, Vehicle Metrics, Expected Fuel Economy. All the content presented in this PPT design is completely editable. Download it and make adjustments in color, background, font etc. as per your unique business setting.
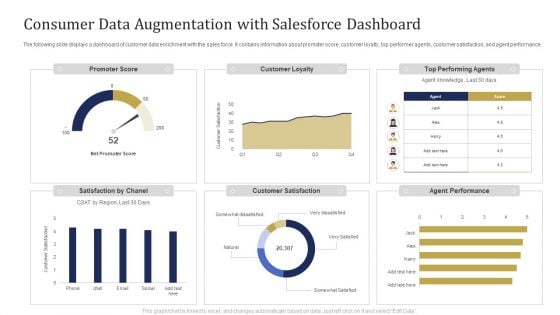
Consumer Data Augmentation With Salesforce Dashboard Ppt Pictures Portrait PDF
The following slide displays a dashboard of customer data enrichment with the sales force. It contains information about promoter score, customer loyalty, top performer agents, customer satisfaction, and agent performance. Showcasing this set of slides titled Consumer Data Augmentation With Salesforce Dashboard Ppt Pictures Portrait PDF. The topics addressed in these templates are Promoter Score, Customer Loyalty, Top Performing Agents. All the content presented in this PPT design is completely editable. Download it and make adjustments in color, background, font etc. as per your unique business setting.
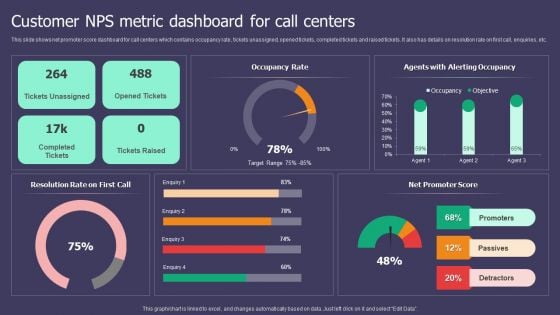
Customer NPS Metric Dashboard For Call Centers Ppt Inspiration Smartart PDF
This slide shows net promoter score dashboard for call centers which contains occupancy rate, tickets unassigned, opened tickets, completed tickets and raised tickets. It also has details on resolution rate on first call, enquiries, etc. Pitch your topic with ease and precision using this Customer NPS Metric Dashboard For Call Centers Ppt Inspiration Smartart PDF. This layout presents information on Occupancy Rate, Resolution Rate, Net Promoter Score. It is also available for immediate download and adjustment. So, changes can be made in the color, design, graphics or any other component to create a unique layout.
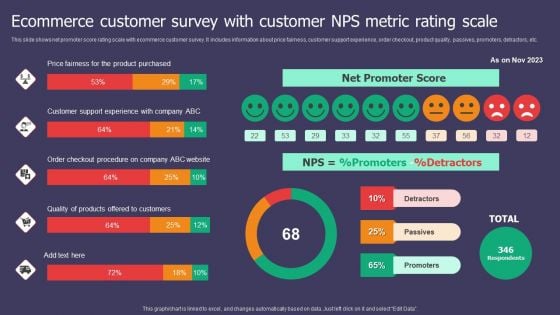
Ecommerce Customer Survey With Customer NPS Metric Rating Scale Ppt Inspiration Visual Aids PDF
This slide shows net promoter score rating scale with ecommerce customer survey. It includes information about price fairness, customer support experience, order checkout, product quality, passives, promoters, detractors, etc. Pitch your topic with ease and precision using this Ecommerce Customer Survey With Customer NPS Metric Rating Scale Ppt Inspiration Visual Aids PDF. This layout presents information on Net Promoter Score, Price Fairness, Product Purchased. It is also available for immediate download and adjustment. So, changes can be made in the color, design, graphics or any other component to create a unique layout.
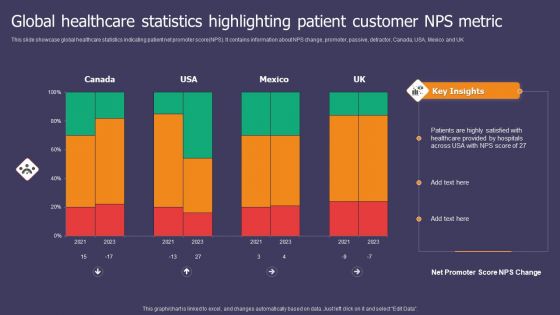
Global Healthcare Statistics Highlighting Patient Customer NPS Metric Ppt Summary Graphics Pictures PDF
This slide showcase global healthcare statistics indicating patient net promoter score NPS. It contains information about NPS change, promoter, passive, detractor, Canada, USA, Mexico and UK. Showcasing this set of slides titled Global Healthcare Statistics Highlighting Patient Customer NPS Metric Ppt Summary Graphics Pictures PDF. The topics addressed in these templates are Healthcare Provided, Hospitals Across, NPS Score. All the content presented in this PPT design is completely editable. Download it and make adjustments in color, background, font etc. as per your unique business setting.
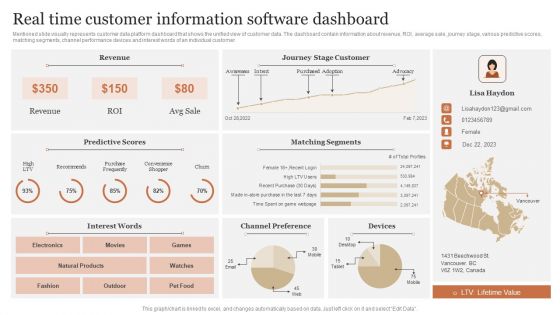
Real Time Customer Information Software Dashboard Portrait PDF
Mentioned slide visually represents customer data platform dashboard that shows the unified view of customer data. The dashboard contain information about revenue, ROI, average sale, journey stage, various predictive scores, matching segments, channel performance devices and interest words of an individual customer. Showcasing this set of slides titled Real Time Customer Information Software Dashboard Portrait PDF. The topics addressed in these templates are Predictive Scores, Matching Segments, Channel Preference. All the content presented in this PPT design is completely editable. Download it and make adjustments in color, background, font etc. as per your unique business setting.

Consumer Risk Assessment Dashboard Reporting Ppt Layouts Ideas PDF
This slide showcases the customer risk assessment dashboard with major kpis. It includes reporting risks summary, risk mitigation, risk profile, and detail. It also reflects the risk score and score distribution across different areas and activities. Pitch your topic with ease and precision using this Consumer Risk Assessment Dashboard Reporting Ppt Layouts Ideas PDF. This layout presents information on Risk Summary, Customer Risk Dashboard, Risk Profile. It is also available for immediate download and adjustment. So, changes can be made in the color, design, graphics or any other component to create a unique layout.
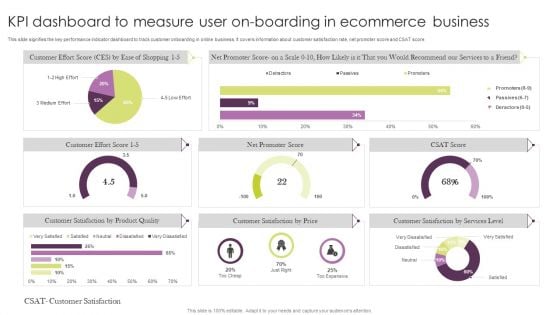
KPI Dashboard To Measure User On Boarding In Ecommerce Business Microsoft PDF


 Continue with Email

 Home
Home


