Bank Marketing
Icons For Cloud Computing PowerPoint Template
Develop competitive advantage with our above template which contains a diagram of cloud network. This diagram may used to depict concepts like cloud computing and technology. This slide provides an effective way of displaying information.
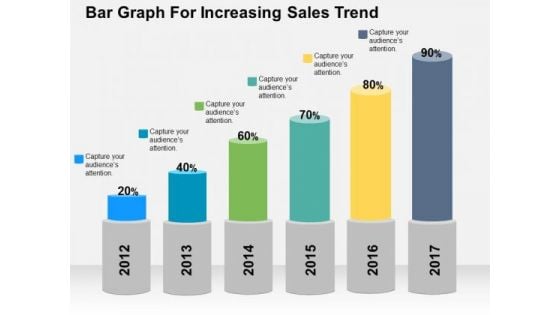
Bar Graph For Increasing Sales Trend PowerPoint Template
Deliver amazing presentations with our above template showing bar graph with percentage values. You may download this slide to depict increase in sales trends. Capture the attention of your audience using this diagram.
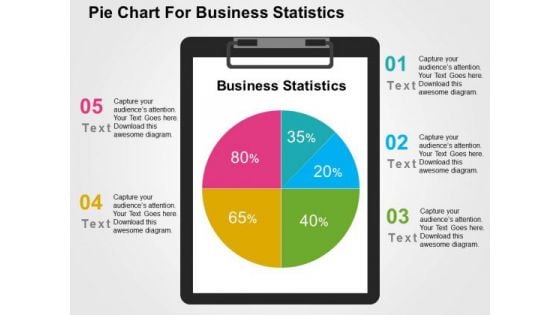
Pie Chart For Business Statistics PowerPoint Template
Visually support your presentation with our above template showing pie chart. This slide has been professionally designed to present business statistics. This template offers an excellent background to build impressive presentation.
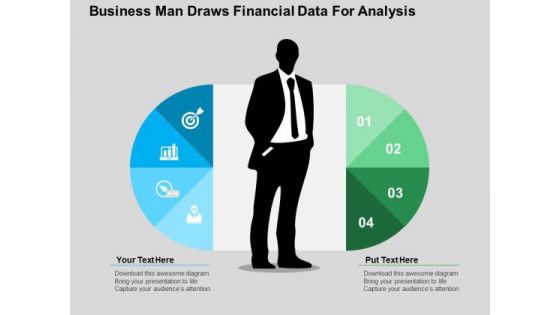
Business Man Draws Financial Data For Analysis PowerPoint Templates
This PowerPoint slide has a theme for financial data analysis. This image has been designed to display concept of financial planning and analysis. Deliver amazing presentations to mesmerize your audience using this image

Four Steps For Interpretation Of Financial Data PowerPoint Templates
Our PPT above slide displays graphics of four text boxes with icons. This template may be used to depict interpretation of financial data. You can present your opinions using this impressive slide.
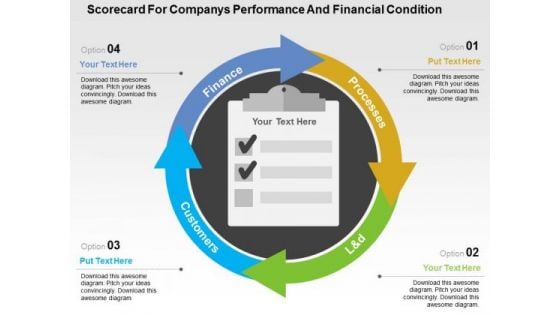
Scorecard For Companys Performance And Financial Condition PowerPoint Templates
Use this PPT slide to display companies performance financial planning. This slide contains graphics of circular scorecard. Trigger the imagination of your audience with this professional diagram.
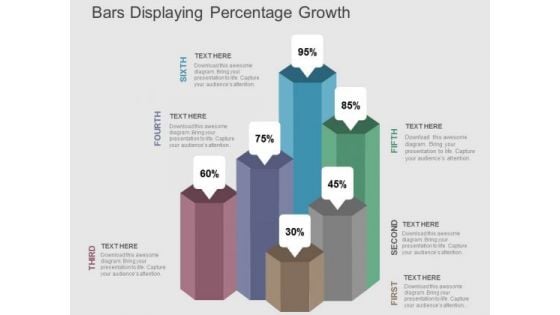
Bars Displaying Percentage Growth PowerPoint Templates
Our above PPT slide contains bar graph displaying percentage growth. This diagram of bar graph helps to depict statistical information. Use this diagram to impart more clarity to data and to create more sound impact on viewers.
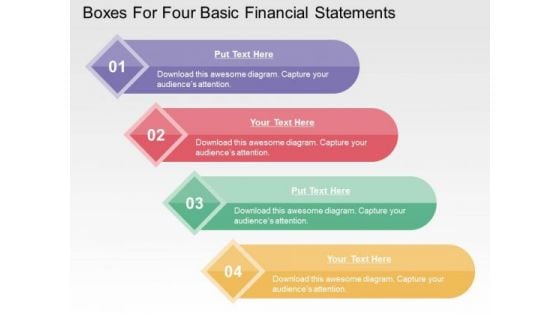
Boxes For Four Basic Financial Statements PowerPoint Templates
This business slide contains graphics of four text boxes. This diagram is suitable to present four basic financial statements. Visual effect of this diagram helps in maintaining the flow of the discussion and provides more clarity to the subject.
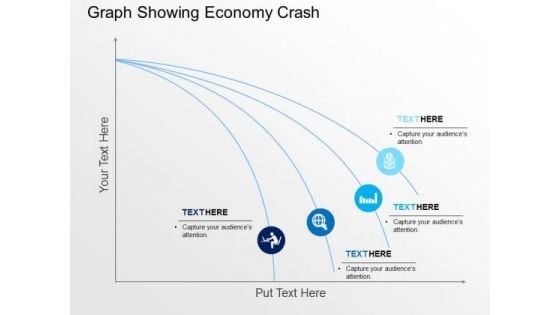
Graph Showing Economy Crash PowerPoint Templates
This business slide contains design of graph. This diagram is suitable to present downfall and economy crash. Visual effect of this diagram helps in maintaining the flow of the discussion and provides more clarity to the subject.

Illustration Of Dollar Growth Graph PowerPoint Template
This business slide contains graphics of dollar symbols on graph. This diagram helps to portray concept of financial planning. Present your views using this innovative slide and be assured of leaving a lasting impression.
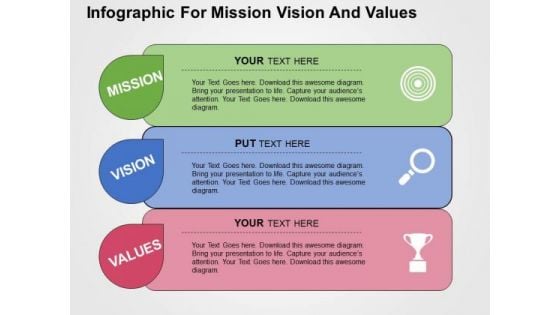
Infographic For Mission Vision And Values PowerPoint Template
This slide contains the infographic diagram. Download this exclusive business diagram to present business mission, vision and values. This diagram can be useful for business presentations.
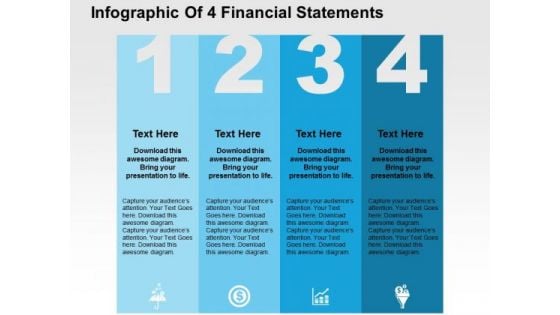
Infographic Of 4 Financial Statements PowerPoint Template
Four financial statements can be displayed in this business diagram. This slide contains the graphic of four text boxes with icons Use this editable slide to build quality presentation for your viewers.
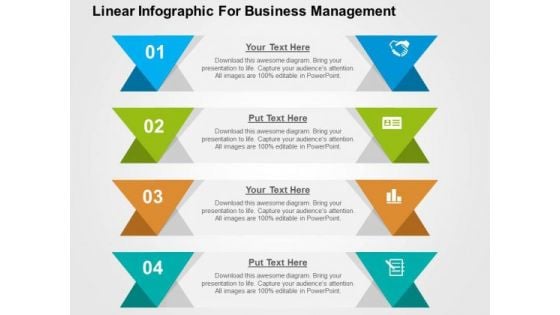
Linear Infographic For Business Management PowerPoint Template
Graphic of tags in linear flow has been used to design this business diagram. This diagram slide may be used to depict business steps in linear flow. Download this diagram for business research and analysis.
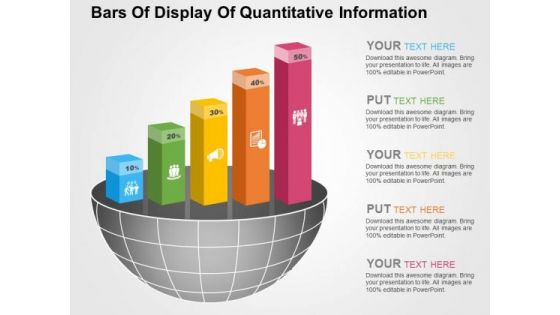
Bars Of Display Of Quantitative Information PowerPoint Templates
Visually support your presentation with our above template illustrating quantitative information. It contains graphics of bars. Etch your views in the brains of your audience with this diagram slide.
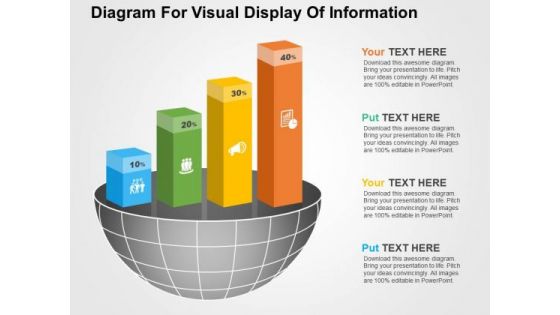
Diagram For Visual Display Of Information PowerPoint Templates
Visually support your presentation with our above template illustrating quantitative information. It contains graphics of bars. Etch your views in the brains of your audience with this diagram slide.
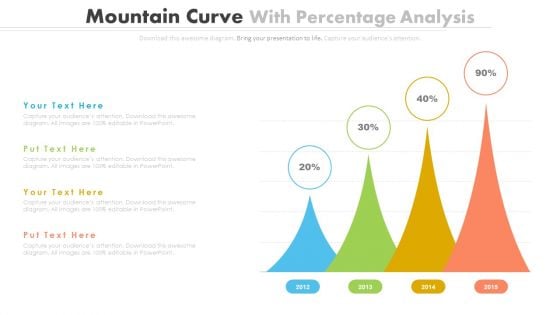
Percentage Data Growth Chart Powerpoint Slides
This PowerPoint template has been designed with percentage data growth chart. Download this PPT chart to depict financial ratio analysis. This PowerPoint slide is of great help in the business sector to make realistic presentations and provides effective way of presenting your newer thoughts.
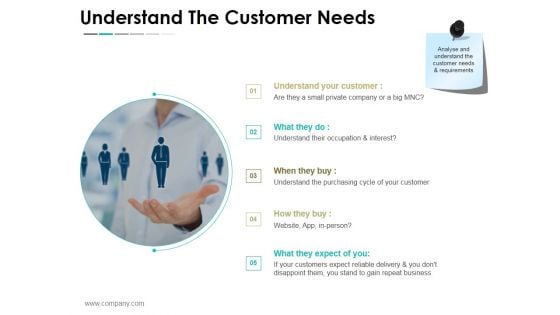
Understand The Customer Needs Template 2 Ppt PowerPoint Presentation Show Graphics Pictures
This is a understand the customer needs template 2 ppt powerpoint presentation show graphics pictures. This is a five stage process. The stages in this process are understand your customer, what they do, when they buy, how they buy, what they expect of you.
Sample Financial Analysis Report Manufacturing Ppt PowerPoint Presentation Complete Deck With Slides
This is a sample financial analysis report manufacturing ppt powerpoint presentation complete deck with slides. This is a one stage process. The stages in this process are sample, financial, analysis, report, manufacturing.
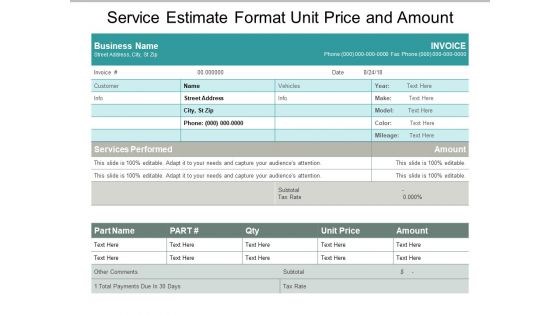
Service Estimate Format Unit Price And Amount Ppt PowerPoint Presentation Ideas Guidelines
This is a service estimate format unit price and amount ppt powerpoint presentation ideas guidelines. This is a two stage process. The stages in this process are estimate, guess, evaluate.
Portfolio Performance Dashboard Ppt PowerPoint Presentation Icon Designs Download
Presenting this set of slides with name portfolio performance dashboard ppt powerpoint presentation icon designs download. The topics discussed in these slides are assets management, portfolio performance. This is a completely editable PowerPoint presentation and is available for immediate download. Download now and impress your audience.
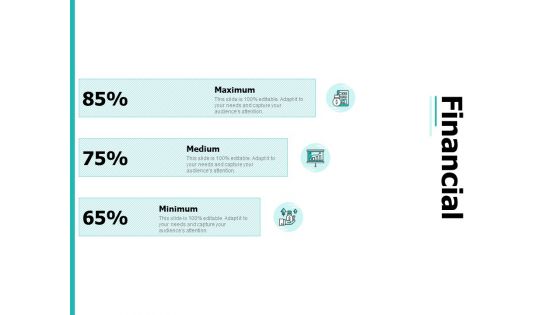
Financial Ppt PowerPoint Presentation Infographics Display
Presenting this set of slides with name financial ppt powerpoint presentation infographics display. This is a three stage process. The stages in this process are maximum, medium, minimum. This is a completely editable PowerPoint presentation and is available for immediate download. Download now and impress your audience.
Profitable Social Enterprise Business Ideas Diagram Ppt Icon
This is a profitable social enterprise business ideas diagram ppt icon. This is a four stage process. The stages in this process are increased industry demand for ethical cotton, increased consumer demand for ethical cotton, promoting ethical supply chains, textile industry events, public events, media publicity pr, product manufacture outsourced, relationship building, signature product sales, grant funding, ethically sourced cotton, social impact outputs, business model, inputs.\n\n
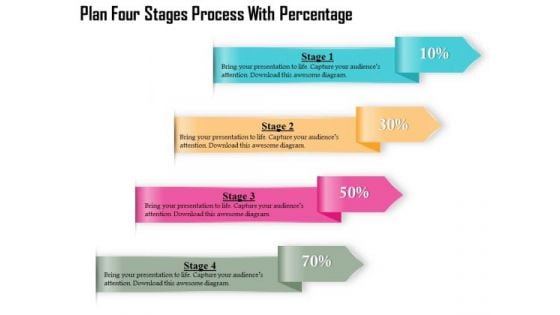
Business Diagram Four Stages Process With Percentage Presentation Template
Four multicolored tags in vertical order has been used to decorate this business diagram. This diagram contains the concept of financial data display with percent values. This diagram can be used for management and finance related presentations.

Business Diagram Three Stages Process Percentage Presentation Template
Three multicolored tags in vertical order has been used to decorate this business diagram. This diagram contains the concept of financial data display with percent values. This diagram can be used for management and finance related presentations.
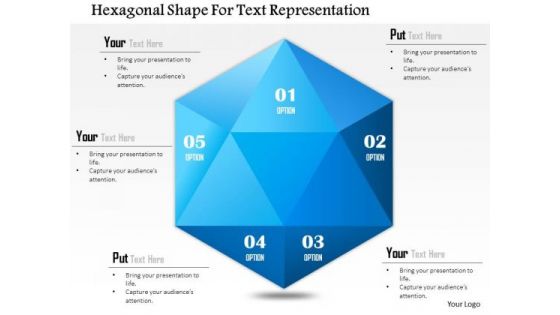
Business Diagram Hexagonal Shape For Text Representation Presentation Template
Graphic of hexagonal shape has been used to design this business diagram. This business slide can be used to represent business information. Use this diagram for your business and finance related presentations.
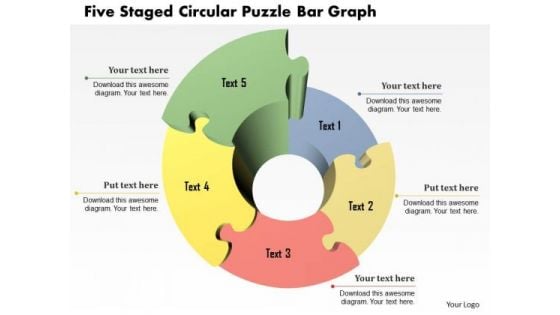
Business Diagram Five Staged Circular Puzzle Bar Graph Presentation Template
Five staged circular puzzle bar graph been used to design this power point template. This PPT contains the concept of business timeline. Show timelines for your business achievements and use this PPT for your business and finance related presentations.
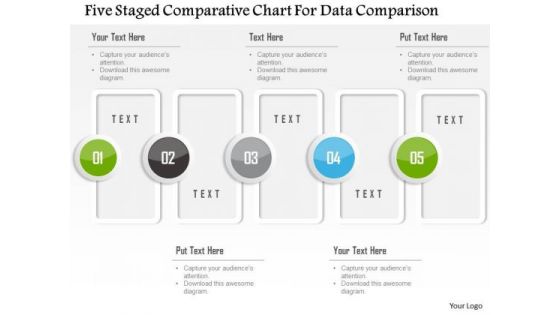
Business Diagram Five Staged Comparative Chart For Data Comparison Presentation Template
Five staged comparative chart has been used to design this power point template. This PPT contains the concept of data comparison. Use this PPT for your business and finance based data comparison in any financial presentation.
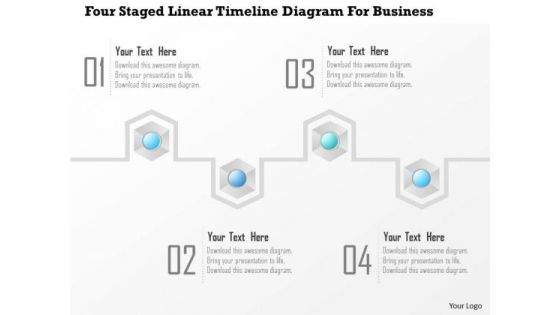
Business Diagram Four Staged Linear Timeline Diagram For Business Presentation Template
Four staged linear timeline diagram has been used d to decorate this Power Point template. This PPT contains the concept of process flow. Use this PPT and build quality presentation for business and finance related presentation.
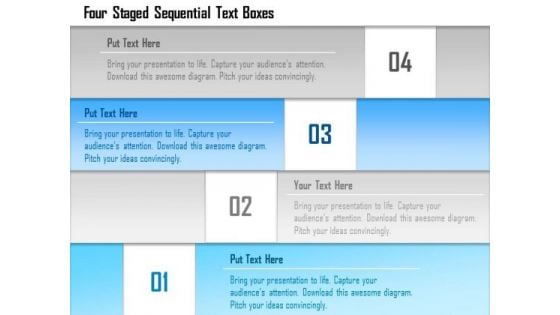
Business Diagram Four Staged Sequential Text Boxes Presentation Template
Four staged sequential stair designed text boxes are used to design this power point template. This PPT contains the concept of data flow. Use this PPT for your business and finance related presentations.
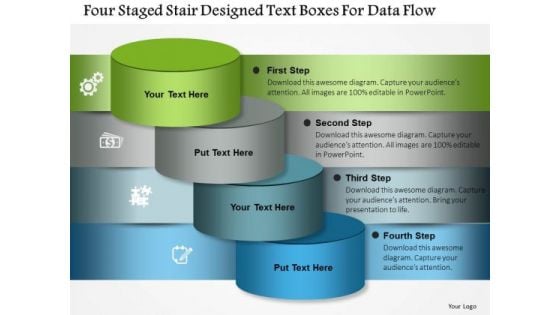
Business Diagram Four Staged Stair Designed Text Boxes For Data Flow Presentation Template
Four staged stair designed text boxes are used to design this power point template. This PPT contains the concept of data flow. Use this PPT for your business and finance related presentations.
Icons On Puzzles For Property Deals PowerPoint Template
Concepts of real estate and finance have been displayed in this business diagram slide. This professional diagram contains diagram of puzzle Infographic. Use this slide to build unique presentations for your viewers.
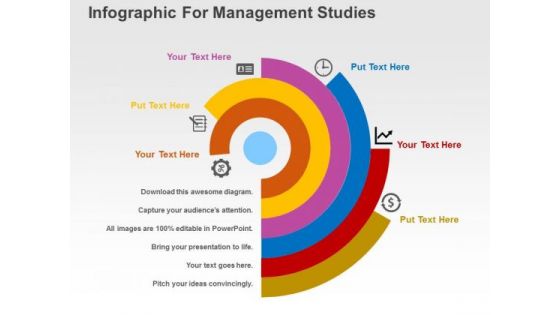
Infographic For Management Studies PowerPoint Templates
Our above slide has been designed with concentric semi circles. This infographic slide is best to describe concept of managerial finance. You can provide a fantastic explanation of the topic with this slide.
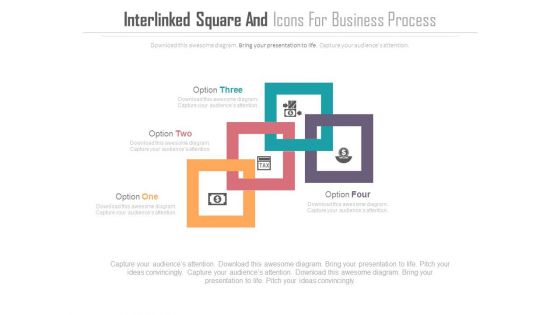
Infographics For Business Management Strategic Planning Powerpoint Template
This Power Point template has been designed with infographic diagram. This PPT diagram may be used for concepts like business management and strategic planning. Use this PPT diagram for business and finance related presentations.
Semi Circle Of Five Business Icons Powerpoint Template
This Power Point template has been crafted designed with semicircle of five business icons. This PPT diagram contains the concept of business strategy and planning process. Use this PPT diagram for business and finance related presentations.
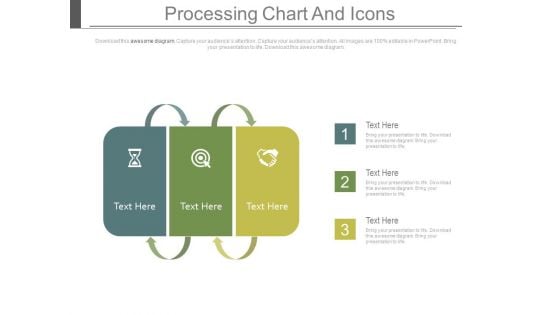
Three Steps Strategic Planning Model Powerpoint Template
This Power Point template has been designed with three steps strategic planning model. This PPT slide portrays the concept of business planning. Use this PPT diagram for business and finance related presentations.
Circles With Dollar Home Message And Target Icons Powerpoint Template
The above PPT template displays four icons of dollar, home, message and target. This diagram is excellent visual tools for explaining concept of home finance. Download this slide to attract the attention of your audience.
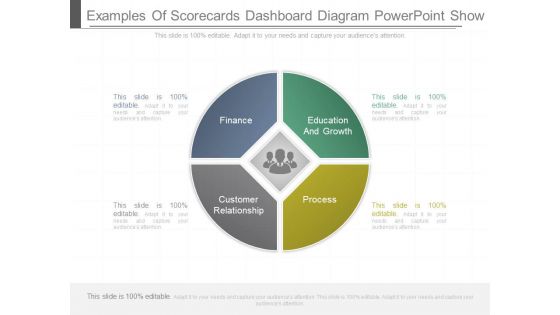
Examples Of Scorecards Dashboard Diagram Powerpoint Show
This is a examples of scorecards dashboard diagram powerpoint show. This is a four stage process. The stages in this process are finance, education and growth, customer relationship, process.
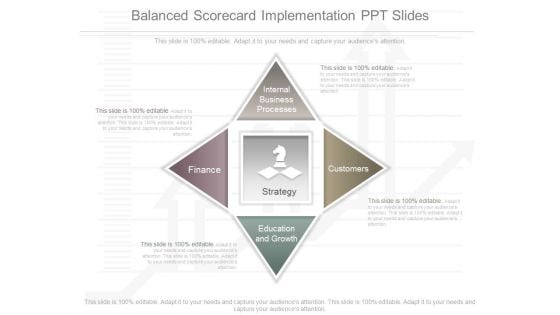
Balanced Scorecard Implementation Ppt Slides
This is a balanced scorecard implementation ppt slides. This is a four stage process. The stages in this process are internal business processes, finance, strategy, customers, education and growth.
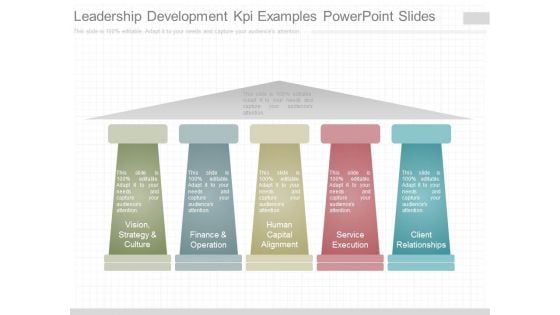
Leadership Development Kpi Examples Powerpoint Slides
This is a leadership development kpi examples powerpoint slides. This is a five stage process. The stages in this process are vision, strategy and culture, finance and operation, human capital alignment, service execution, client relationships.
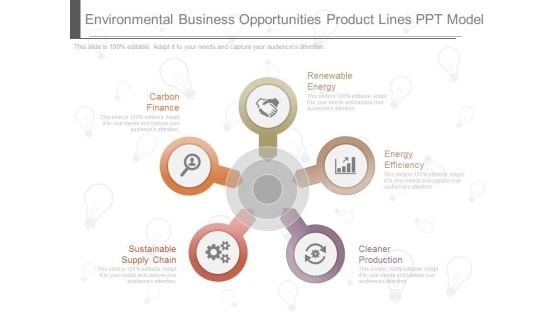
Environmental Business Opportunities Product Lines Ppt Model
This is a environmental business opportunities product lines ppt model. This is a five stage process. The stages in this process are carbon finance, renewable energy, sustainable supply chain, energy efficiency, cleaner production.\n\n\n\n\n\n\n\n\n\n

Customer Distribution Requirement Plan Template Ppt Slide Styles
This is a customer distribution requirement plan template ppt slide styles. This is a five stage process. The stages in this process are operations, executive, services, sales, finance, business one.\n\n\n
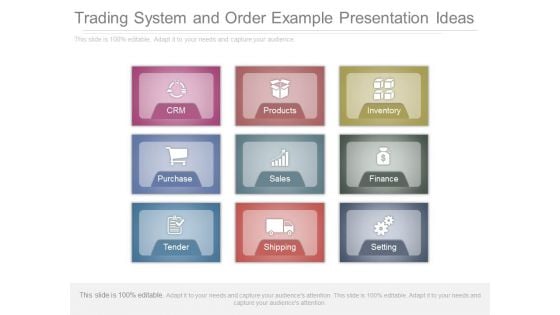
Trading System And Order Example Presentation Ideas
This is a trading system and order example presentation ideas. This is a nine stage process. The stages in this process are setting, shipping, tender, purchase, sales, finance, inventory.
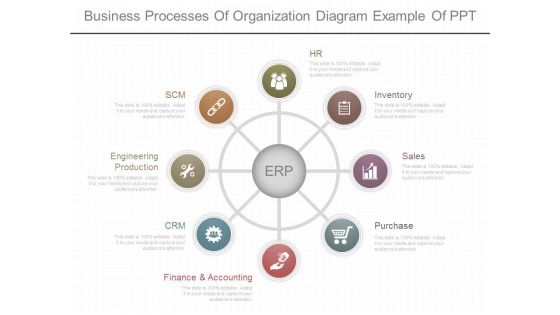
Business Processes Of Organization Diagram Example Of Ppt
This is a business processes of organization diagram example of ppt. This is a eight stage process. The stages in this process are hr, inventory, sales, purchase, finance and accounting, crm, engineering production, scm.
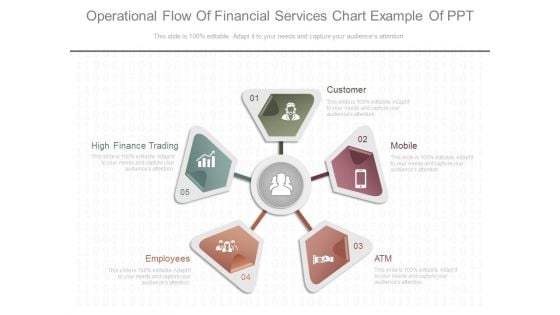
Operational Flow Of Financial Services Chart Example Of Ppt
This is a operational flow of financial services chart example of ppt. This is a five stage process. The stages in this process are customer, mobile, atm, employees, high finance trading.
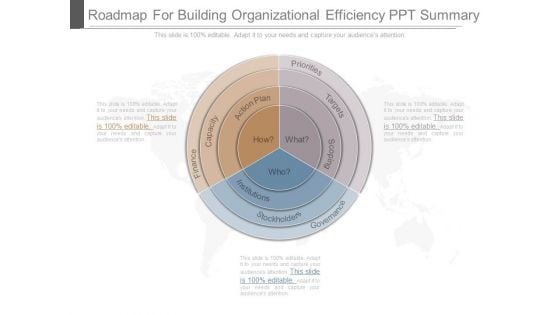
Roadmap For Building Organizational Efficiency Ppt Summary
This is a roadmap for building organizational efficiency ppt summary. This is a three stage process. The stages in this process are priorities, governance, finance, capacity, stockholders, targets, institutions, action plan, scoping, who, how, what.

International Trade And Management Consulting Diagram Ppt
This is a international trade and management consulting diagram ppt. This is a nine stage process. The stages in this process are documents, incoterms, logistics transport, international finance, export department, exporting, customs, methods of payment, international contracts.
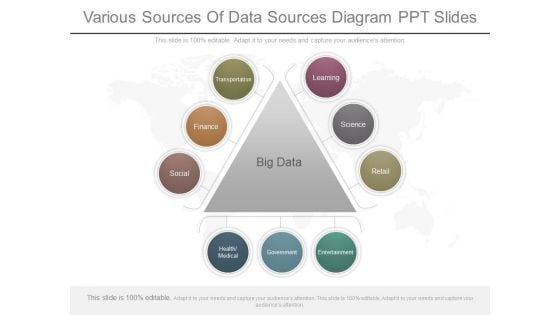
Various Sources Of Data Sources Diagram Ppt Slides
This is a various sources of data sources diagram ppt slides. This is a three stage process. The stages in this process are learning, science, retail, entertainment, government, health medical, social, finance, transportation.
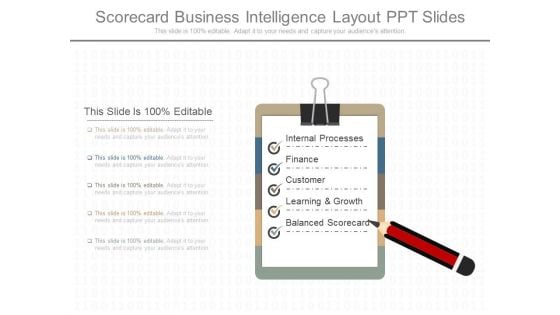
Scorecard Business Intelligence Layout Ppt Slides
This is a scorecard business intelligence layout ppt slides. This is a five stage process. The stages in this process are internal processes, finance, customer, learning and growth, balanced scorecard.

Actual Project Management Linguistic Presentation Visual Aids
This is a actual project management linguistic presentation visual aids. This is a four stage process. The stages in this process are area, kpi name, target compliance, actual, linguistic, project management, engineering, finance.
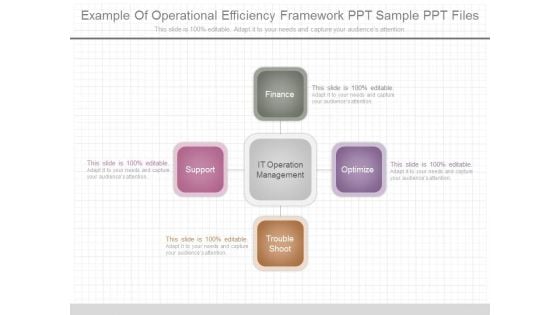
Example Of Operational Efficiency Framework Ppt Sample Ppt Files
This is a example of operational efficiency framework ppt sample ppt files. This is a four stage process. The stages in this process are finance, optimize, troubleshoot, support, it operation management.

Management For Product Managers Diagram Example Of Ppt
This is a management for product managers diagram example of ppt. This is a ten stage process. The stages in this process are technical debt, infrastructure, security, technology, business, sales, finance, legal, operations support, product manager.
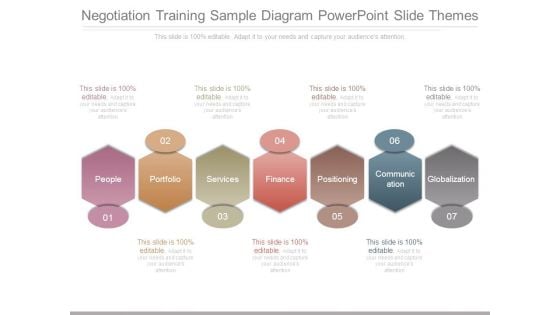
Negotiation Training Sample Diagram Powerpoint Slide Themes
This is a negotiation training sample diagram powerpoint slide themes. This is a seven stage process. The stages in this process are people, portfolio, services, finance, positioning, communication, globalization.
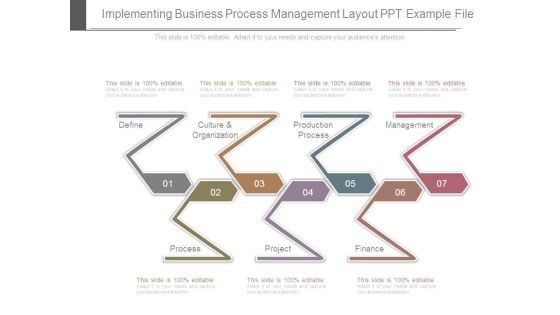
Implementing Business Process Management Layout Ppt Example File
This is a implementing business process management layout ppt example file. This is a seven stage process. The stages in this process are define, culture and organization, production process, management, finance, project, process.
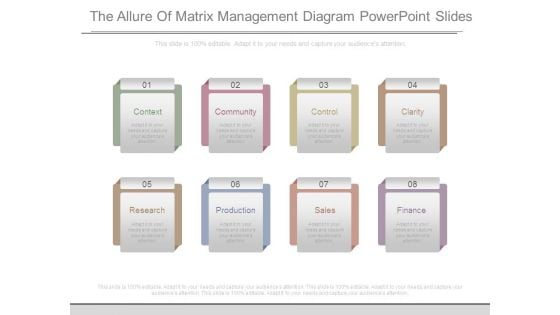
The Allure Of Matrix Management Diagram Powerpoint Slides
This is a the allure of matrix management diagram powerpoint slides. This is a eight stage process. The stages in this process are context, community, control, clarity, research, production, sales, finance.
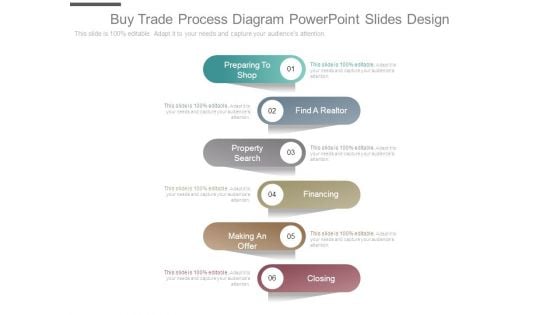
Buy Trade Process Diagram Powerpoint Slides Design
This is a buy trade process diagram powerpoint slides design. This is a six stage process. The stages in this process are preparing to shop, find a realtor, property search, financing, making an offer, closing.
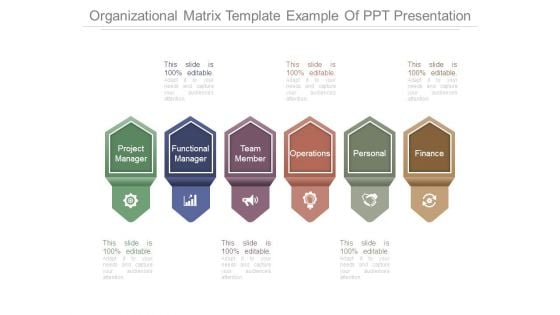
Organizational Matrix Template Example Of Ppt Presentation
This is a organizational matrix template example of ppt presentation. This is a six stage process. The stages in this process are project manager, functional manager, team member, operations, personal, finance.
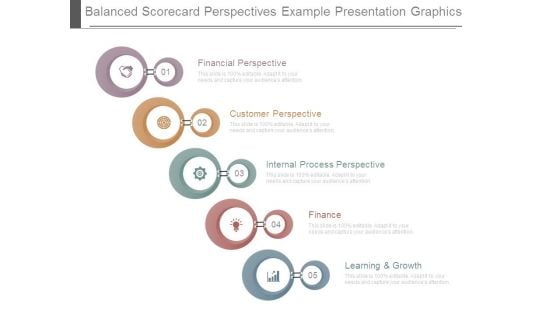
Balanced Scorecard Perspectives Example Presentation Graphics
This is a balanced scorecard perspectives example presentation graphics. This is a five stage process. The stages in this process are financial perspective, customer perspective, internal process perspective, finance, learning and growth.
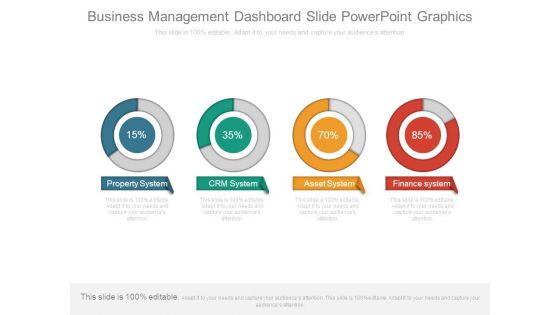
Business Management Dashboard Slide Powerpoint Graphics
This is a business management dashboard slide powerpoint graphics. This is a four stage process. The stages in this process are property system, crm system, asset system, finance system.
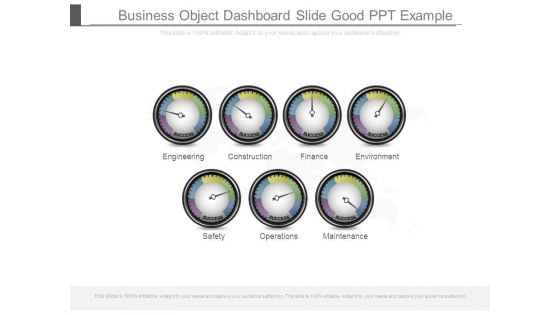
Business Object Dashboard Slide Good Ppt Example
This is a business object dashboard slide good ppt example. This is a seven stage process. The stages in this process are engineering, construction, finance, environment, safety, operations, maintenance.
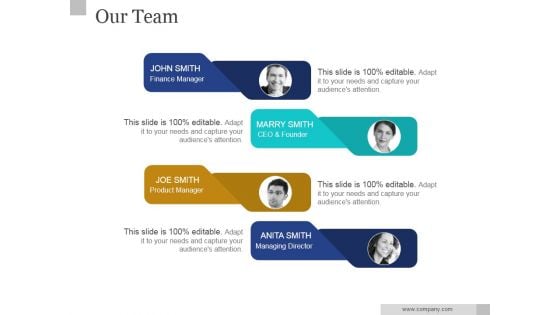
Our Team Ppt PowerPoint Presentation Rules
This is a our team ppt powerpoint presentation rules. This is a four stage process. The stages in this process are john smith finance manager, marry smith ceo and founder, joe smith product manager.


 Continue with Email

 Home
Home


