Bank Marketing
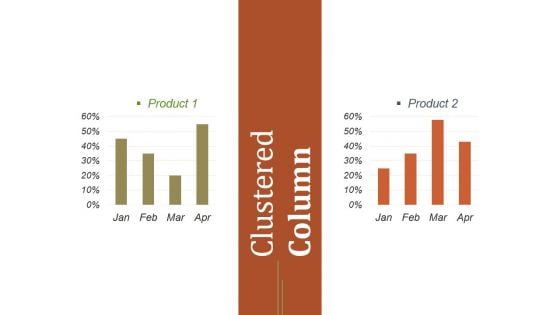
Clustered Column Ppt PowerPoint Presentation Example
This is a clustered column ppt powerpoint presentation example. This is a two stage process. The stages in this process are product, clustered column, business, planning, marketing.
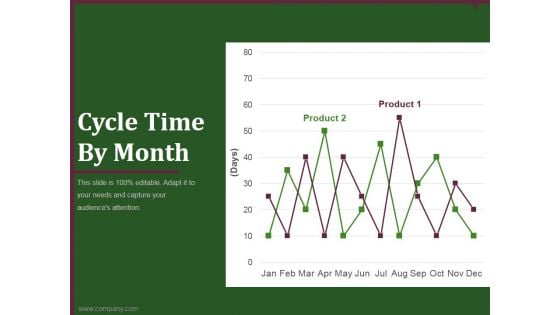
cycle time by month ppt powerpoint presentation introduction
This is a cycle time by month ppt powerpoint presentation introduction. This is a two stage process. The stages in this process are business, marketing, product, analysis, timeline.
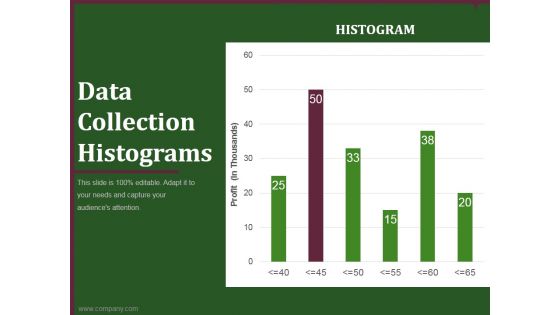
data collection histograms ppt powerpoint presentation example
This is a data collection histograms ppt powerpoint presentation example. This is a six stage process. The stages in this process are business, planning, marketing, histograms, graph.
Bar Graph Ppt PowerPoint Presentation Icon Diagrams
This is a bar graph ppt powerpoint presentation icon diagrams. This is a nine stage process. The stages in this process are product, bar graph, marketing, success.
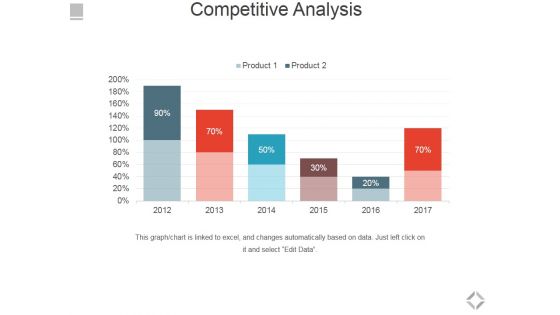
Competitive Analysis Ppt PowerPoint Presentation Slides Design Templates
This is a competitive analysis ppt powerpoint presentation slides design templates. This is a six stage process. The stages in this process are business, marketing, management, success, presentation.
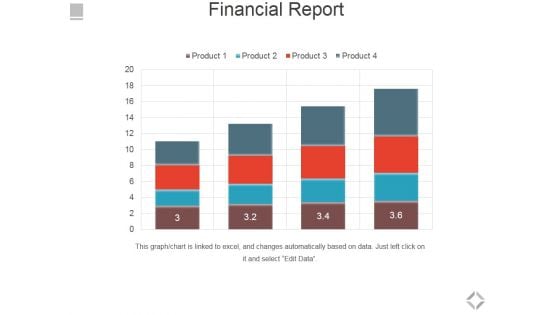
Financial Report Ppt PowerPoint Presentation Styles Skills
This is a financial report ppt powerpoint presentation styles skills. This is a four stage process. The stages in this process are bar graph, business, marketing, success, growth.
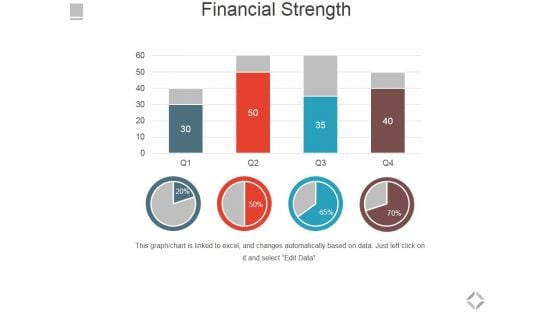
Financial Strength Ppt PowerPoint Presentation Summary Ideas
This is a financial strength ppt powerpoint presentation summary ideas. This is a four stage process. The stages in this process are bar graph, business, marketing, success, growth.
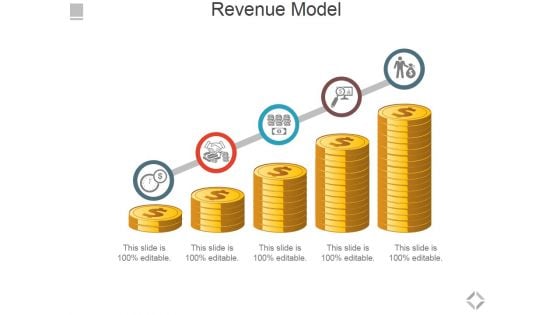
Revenue Model Ppt PowerPoint Presentation Slides Format
This is a revenue model ppt powerpoint presentation slides format. This is a five stage process. The stages in this process are business, financials, currency, growth, marketing.

Financial Ppt PowerPoint Presentation Model Rules
This is a financial ppt powerpoint presentation model rules. This is a three stage process. The stages in this process are financial, sales, sales plan, business, marketing.
Area Chart Ppt PowerPoint Presentation Icon Good
This is a area chart ppt powerpoint presentation icon good. This is a two stage process. The stages in this process are business, marketing, growth, planning, strategy.
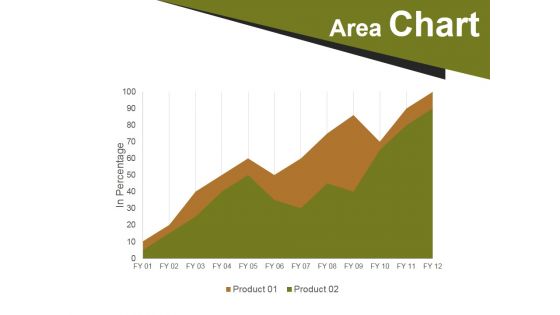
Area Chart Ppt PowerPoint Presentation Pictures Rules
This is a area chart ppt powerpoint presentation pictures rules. This is a two stage process. The stages in this process are area chart, business, marketing, strategy, success.
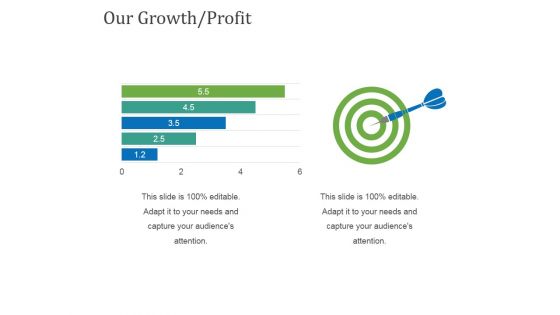
Our Growth Profit Ppt PowerPoint Presentation Outline Ideas
This is a our growth profit ppt powerpoint presentation outline ideas. This is a two stage process. The stages in this process are business, marketing, success, process, targets.
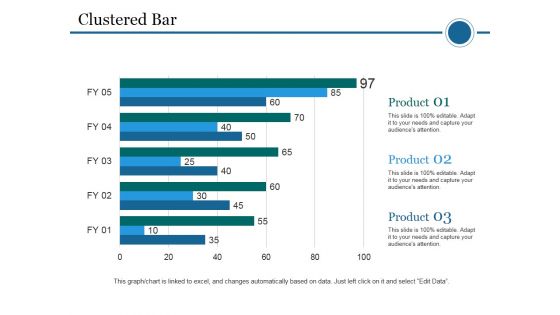
Clustered Bar Ppt PowerPoint Presentation File Topics
This is a clustered bar ppt powerpoint presentation file topics. This is a five stage process. The stages in this process are clustered bar, product, planning, business, marketing.
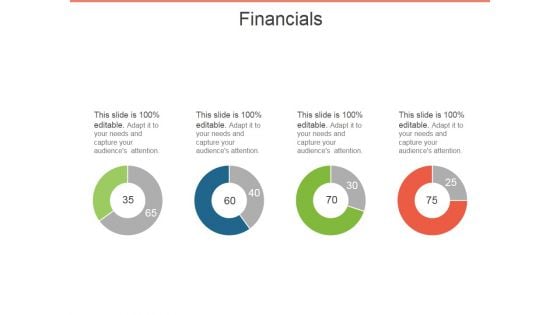
Financials Ppt PowerPoint Presentation Model Background
This is a financials ppt powerpoint presentation model background. This is a four stage process. The stages in this process are financials, business, process, marketing, success.
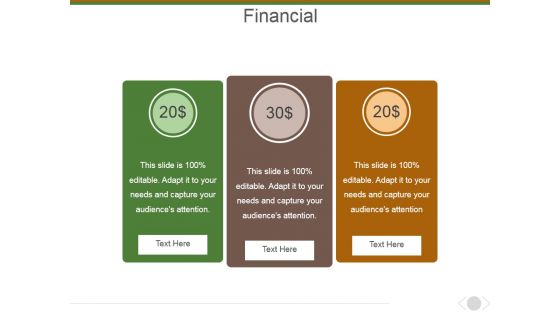
Financial Ppt PowerPoint Presentation Infographic Template Template
This is a financial ppt powerpoint presentation infographic template template. This is a three stage process. The stages in this process are financial, business, sales, management, marketing.
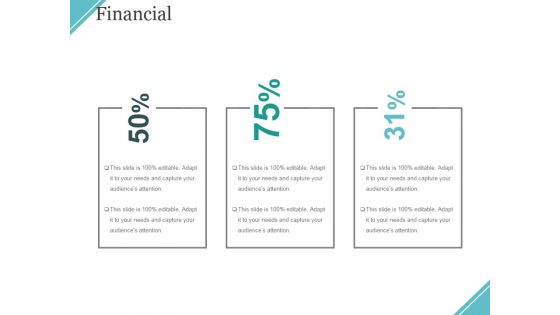
Financial Ppt PowerPoint Presentation Layouts Background Designs
This is a financial ppt powerpoint presentation layouts background designs. This is a three stage process. The stages in this process are financial, business, marketing, management, sales.
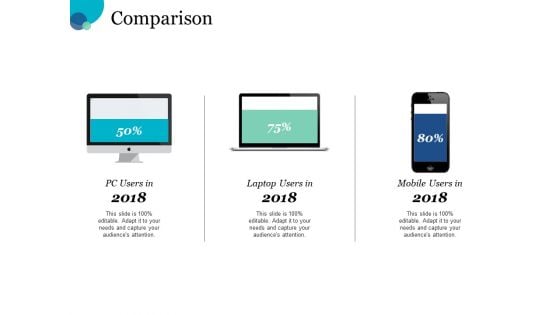
Comparison Technology Ppt PowerPoint Presentation Professional Sample
This is a comparison technology ppt powerpoint presentation professional sample. This is a three stage process. The stages in this process are comparison, male, female, marketing, strategy.

Introduction To Mobile SEM KPI Metrics Dashboard To Monitor Mobile SEO Performance Diagrams PDF
The purpose of this slide is to outline key performance indicator KPI dashboard which will assist the marketer to analyze mobile search engine optimization SEO performance. The key metrics mentioned in the slide are total sessions, search engine rankings etc. Take your projects to the next level with our ultimate collection of Introduction To Mobile SEM KPI Metrics Dashboard To Monitor Mobile SEO Performance Diagrams PDF. Slidegeeks has designed a range of layouts that are perfect for representing task or activity duration, keeping track of all your deadlines at a glance. Tailor these designs to your exact needs and give them a truly corporate look with your own brand colors they will make your projects stand out from the rest.
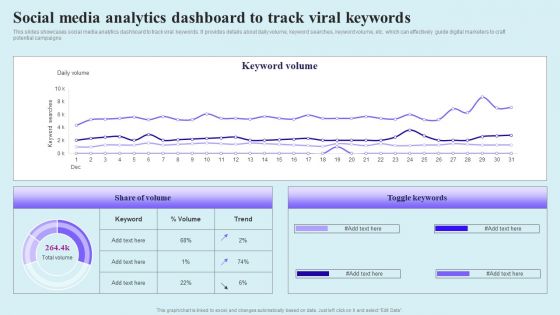
Go Viral Campaign Strategies To Increase Engagement Social Media Analytics Dashboard Track Viral Graphics PDF
This slides showcases social media analytics dashboard to track viral keywords. It provides details about daily volume, keyword searches, keyword volume, etc. which can effectively guide digital marketers to craft potential campaigns Are you searching for a Go Viral Campaign Strategies To Increase Engagement Social Media Analytics Dashboard Track Viral Graphics PDF that is uncluttered, straightforward, and original Its easy to edit, and you can change the colors to suit your personal or business branding. For a presentation that expresses how much effort you have put in, this template is ideal. With all of its features, including tables, diagrams, statistics, and lists, its perfect for a business plan presentation. Make your ideas more appealing with these professional slides. Download Go Viral Campaign Strategies To Increase Engagement Social Media Analytics Dashboard Track Viral Graphics PDF from Slidegeeks today.
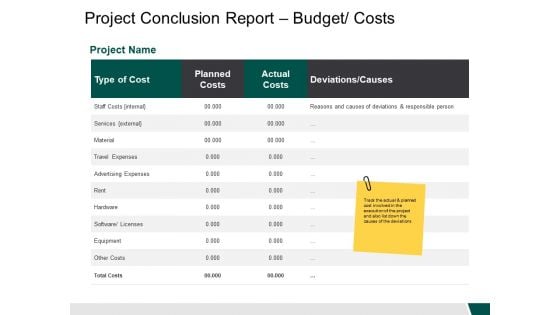
Project Conclusion Report Budget Costs Project Name Ppt PowerPoint Presentation Ideas Visual Aids
This is a project conclusion report budget costs project name ppt powerpoint presentation ideas visual aids. This is a three stage process. The stages in this process are business, management, strategy, analysis, marketing.
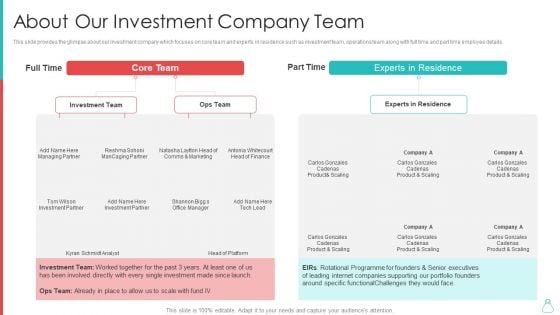
Raising Funds From Venture Capitalist About Our Investment Company Team Slides PDF
This slide provides the glimpse about our investment company which focuses on core team and experts in residence such as investment team, operations team along with full time and part time employee details. Deliver an awe inspiring pitch with this creative raising funds from venture capitalist about our investment company team slides pdf bundle. Topics like investment, marketing, finance, portfolio, executives can be discussed with this completely editable template. It is available for immediate download depending on the needs and requirements of the user.
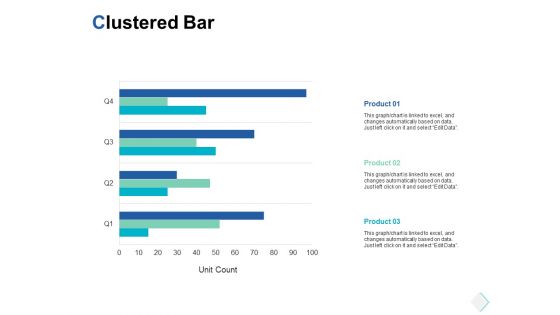
Clustered Bar Finance Ppt PowerPoint Presentation Slides Guidelines
Presenting this set of slides with name clustered bar finance ppt powerpoint presentation slides guidelines. The topics discussed in these slides are finance, marketing, management, investment, analysis. This is a completely editable PowerPoint presentation and is available for immediate download. Download now and impress your audience.
Clustered Column Line Finance Ppt PowerPoint Presentation Pictures Icons
Presenting this set of slides with name clustered column line finance ppt powerpoint presentation pictures icons. The topics discussed in these slides are finance, marketing, management, investment, analysis. This is a completely editable PowerPoint presentation and is available for immediate download. Download now and impress your audience.
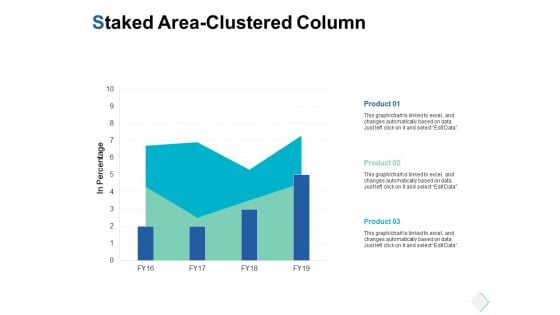
Staked Area Clustered Column Finance Ppt PowerPoint Presentation Ideas Pictures
Presenting this set of slides with name staked area clustered column finance ppt powerpoint presentation ideas pictures. The topics discussed in these slides are finance, marketing, management, investment, analysis. This is a completely editable PowerPoint presentation and is available for immediate download. Download now and impress your audience.
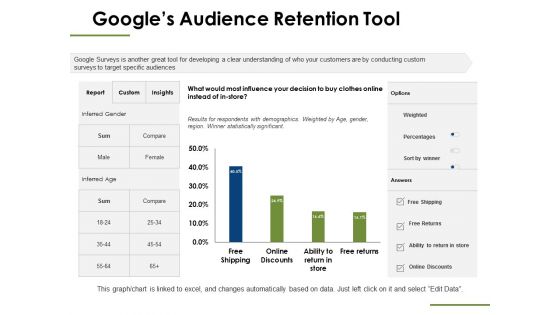
Googles Audience Retention Tool Ppt PowerPoint Presentation Infographics Summary
This is a googles audience retention tool ppt powerpoint presentation infographics summary. This is a four stage process. The stages in this process are business, finance, marketing, investment, analysis.
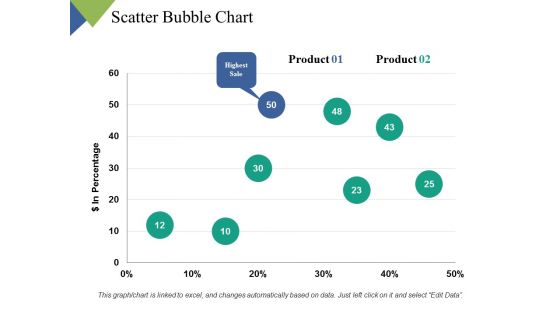
Scatter Bubble Chart Ppt PowerPoint Presentation Inspiration Graphics Tutorials
This is a scatter bubble chart ppt powerpoint presentation inspiration graphics tutorials. This is a two stage process. The stages in this process are finance, marketing, management, investment, analysis.
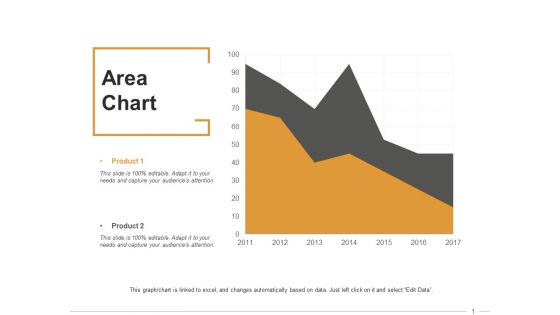
Area Chart Ppt PowerPoint Presentation Infographic Template Clipart Images
This is a area chart ppt powerpoint presentation infographic template clipart images. This is a two stage process. The stages in this process are finance, marketing, management, investment, analysis.
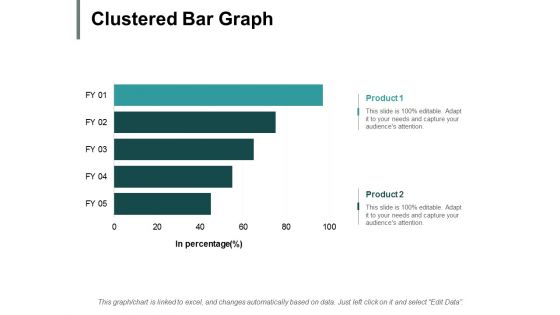
Clustered Bar Graph Ppt PowerPoint Presentation Pictures Example File
This is a clustered bar graph ppt powerpoint presentation pictures example file. This is a two stage process. The stages in this process are finance, marketing, management, investment, analysis.
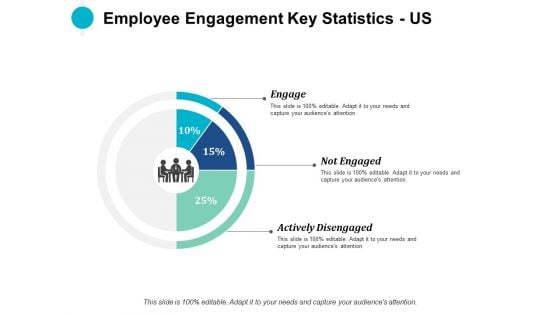
Employee Engagement Key Statistics US Ppt PowerPoint Presentation Infographic Template Graphics Example
This is a employee engagement key statistics us ppt powerpoint presentation infographic template graphics example. This is a three stage process. The stages in this process are finance, marketing, management, investment, analysis.

Employee Engagement Key Statistics Us Ppt Powerpoint Presentation Show Graphic Tips
This is a employee engagement key statistics us ppt powerpoint presentation show graphic tips. This is a three stage process. The stages in this process are finance, marketing, management, investment, analysis.
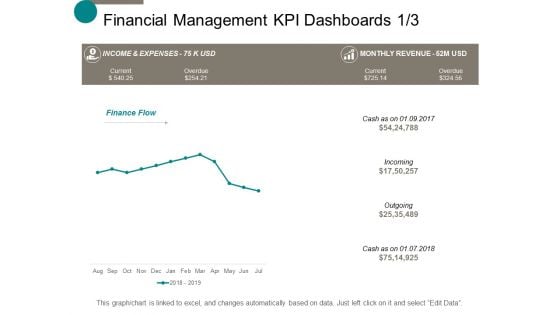
Financial Management Kpi Dashboards Business Ppt Powerpoint Presentation Show Gridlines
This is a financial management kpi dashboards business ppt powerpoint presentation show gridlines. This is a four stage process. The stages in this process are finance, marketing, management, investment, analysis.
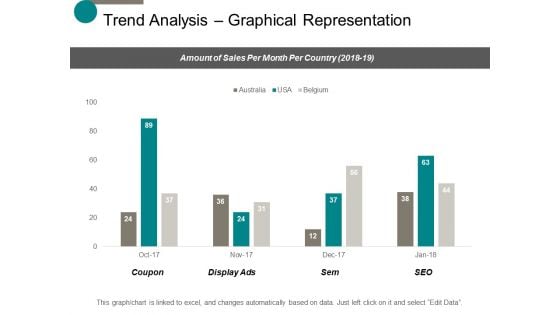
Trend Analysis Graphical Representation Ppt Powerpoint Presentation Slides Deck
This is a trend analysis graphical representation ppt powerpoint presentation slides deck. This is a four stage process. The stages in this process are finance, marketing, management, investment, analysis.

Trend Analysis Yearly Comparison Ppt Powerpoint Presentation Professional Example
This is a trend analysis yearly comparison ppt powerpoint presentation professional example. This is a two stage process. The stages in this process are finance, marketing, management, investment, analysis.
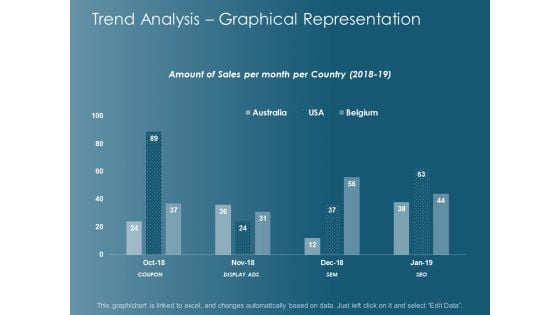
Trend Analysis Graphical Representation Ppt Powerpoint Presentation Gallery Graphic Images
This is a trend analysis graphical representation ppt powerpoint presentation gallery graphic images. This is a four stage process. The stages in this process are finance, marketing, management, investment, analysis.
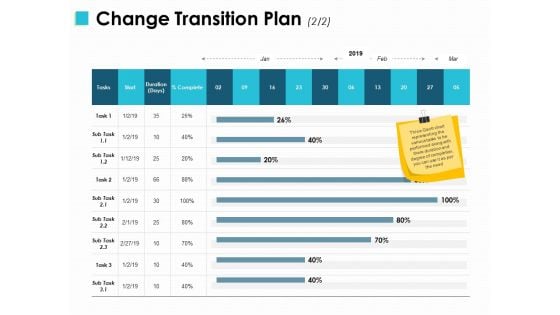
Change Transition Plan Compare Ppt PowerPoint Presentation File Rules
This is a change transition plan compare ppt powerpoint presentation file rules. This is a two stage process. The stages in this process are finance, marketing, management, investment, analysis.
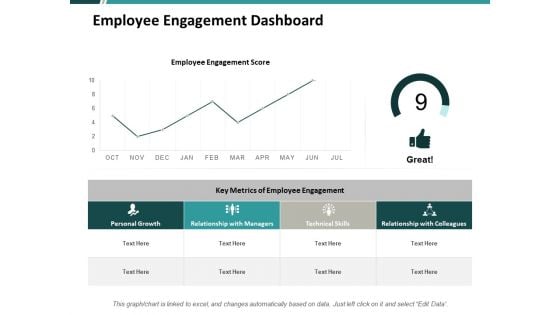
Employee Engagement Dashboard Ppt PowerPoint Presentation Professional File Formats
This is a employee engagement dashboard ppt powerpoint presentation professional file formats. This is a four stage process. The stages in this process are finance, marketing, management, investment, analysis.
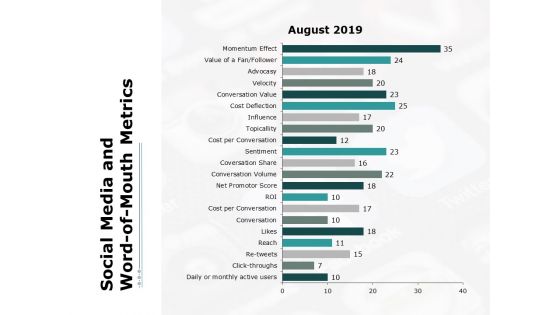
Social Media And Word Of Mouth Metrics Ppt PowerPoint Presentation Layouts Graphics
This is a social media and word of mouth metrics ppt powerpoint presentation layouts graphics. This is a three stage process. The stages in this process are finance, marketing, management, investment, analysis.
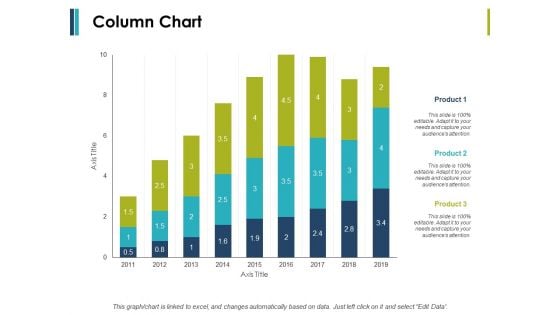
Column Chart And Graph Ppt PowerPoint Presentation File Introduction
This is a column chart and graph ppt powerpoint presentation file introduction. This is a three stage process. The stages in this process are finance, marketing, management, investment, analysis.
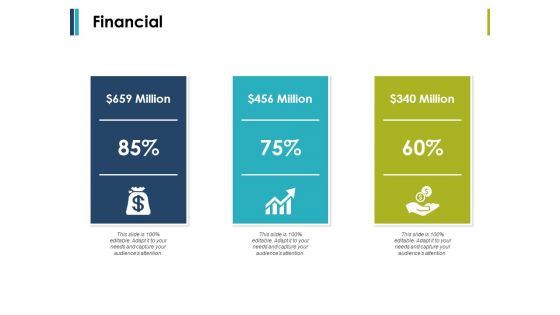
Financial Business Management Ppt PowerPoint Presentation Infographics File Formats
This is a financial business management ppt powerpoint presentation infographics file formats. This is a three stage process. The stages in this process are Finance, Marketing, Management, Investment, Analysis.
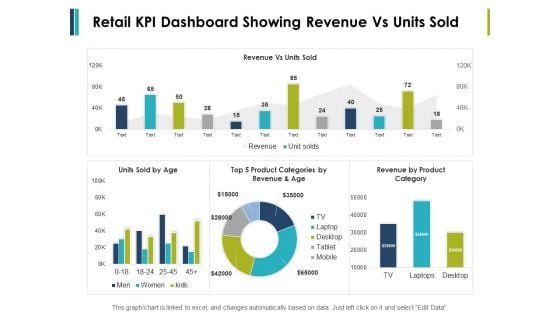
Retail Kpi Dashboard Showing Revenue Vs Units Sold Ppt PowerPoint Presentation File Formats
This is a retail kpi dashboard showing revenue vs units sold ppt powerpoint presentation file formats. This is a three stage process. The stages in this process are finance, marketing, management, investment, analysis.
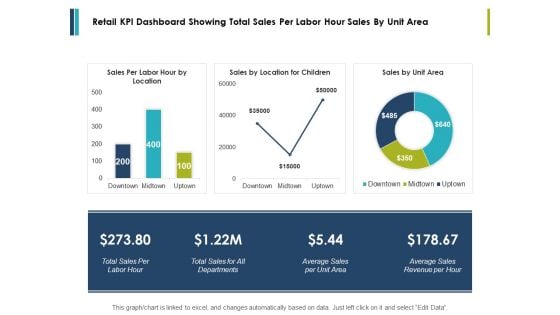
Retail Kpi Dashboard Showing Total Sales Per Labor Hour Sales By Unit Area Ppt PowerPoint Presentation Styles Influencers
This is a retail kpi dashboard showing total sales per labor hour sales by unit area ppt powerpoint presentation styles influencers. This is a three stage process. The stages in this process are finance, marketing, management, investment, analysis.
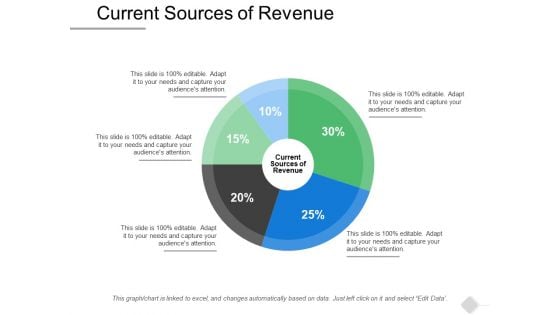
Current Sources Of Revenue Ppt PowerPoint Presentation File Design Inspiration
This is a current sources of revenue ppt powerpoint presentation file design inspiration. This is a five stage process. The stages in this process are finance, marketing, management, investment, analysis.
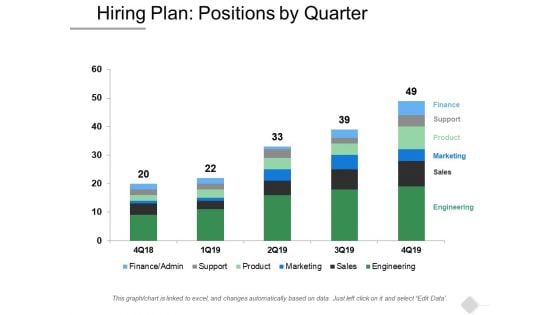
Hiring Plan Positions By Quarter Ppt PowerPoint Presentation Styles Visual Aids
This is a hiring plan positions by quarter ppt powerpoint presentation styles visual aids. This is a six stage process. The stages in this process are finance, marketing, management, investment, analysis.
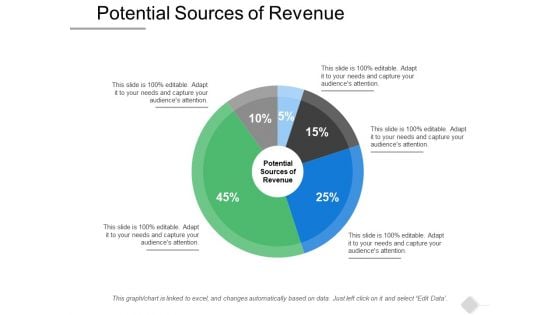
Potential Sources Of Revenue Ppt PowerPoint Presentation Outline Themes
This is a potential sources of revenue ppt powerpoint presentation outline themes. This is a five stage process. The stages in this process are finance, marketing, management, investment, analysis.
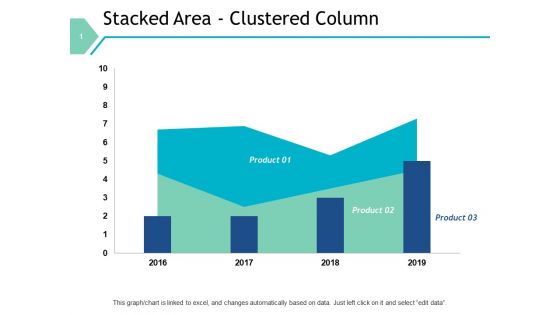
Stacked Area Clustered Column Graph Ppt PowerPoint Presentation File Designs Download
This is a stacked area clustered column graph ppt powerpoint presentation file designs download. This is a three stage process. The stages in this process are finance, marketing, management, investment, analysis.
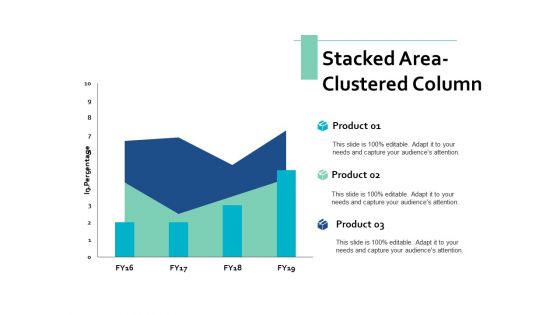
Stacked Area Clustered Column Ppt PowerPoint Presentation Pictures Professional
This is a stacked area clustered column ppt powerpoint presentation pictures professional. This is a three stage process. The stages in this process are finance, marketing, management, investment, analysis.
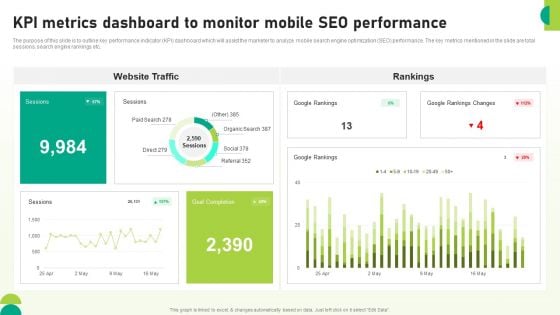
Utilizing SEO To Boost Customer KPI Metrics Dashboard To Monitor Mobile Seo Performance Download PDF
The purpose of this slide is to outline key performance indicator KPI dashboard which will assist the marketer to analyze mobile search engine optimization SEO performance. The key metrics mentioned in the slide are total sessions, search engine rankings etc. Coming up with a presentation necessitates that the majority of the effort goes into the content and the message you intend to convey. The visuals of a PowerPoint presentation can only be effective if it supplements and supports the story that is being told. Keeping this in mind our experts created Utilizing SEO To Boost Customer KPI Metrics Dashboard To Monitor Mobile Seo Performance Download PDF to reduce the time that goes into designing the presentation. This way, you can concentrate on the message while our designers take care of providing you with the right template for the situation.
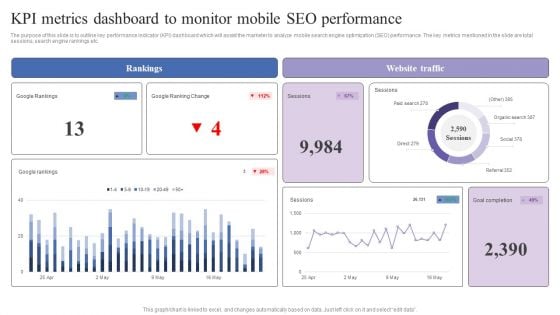
KPI Metrics Dashboard To Monitor Mobile Seo Performance Mobile Search Engine Optimization Guide Professional PDF
The purpose of this slide is to outline key performance indicator KPI dashboard which will assist the marketer to analyze mobile search engine optimization SEO performance. The key metrics mentioned in the slide are total sessions, search engine rankings etc. Slidegeeks has constructed KPI Metrics Dashboard To Monitor Mobile Seo Performance Mobile Search Engine Optimization Guide Professional PDF after conducting extensive research and examination. These presentation templates are constantly being generated and modified based on user preferences and critiques from editors. Here, you will find the most attractive templates for a range of purposes while taking into account ratings and remarks from users regarding the content. This is an excellent jumping-off point to explore our content and will give new users an insight into our top-notch PowerPoint Templates.
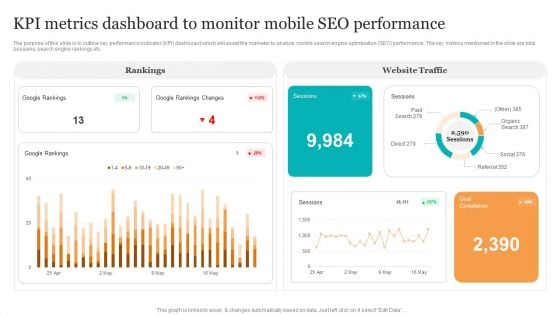
KPI Metrics Dashboard To Monitor Mobile Seo Performance Search Engine Optimization Services To Minimize Graphics PDF
The purpose of this slide is to outline key performance indicator KPI dashboard which will assist the marketer to analyze mobile search engine optimization SEO performance. The key metrics mentioned in the slide are total sessions, search engine rankings etc. Present like a pro with KPI Metrics Dashboard To Monitor Mobile Seo Performance Search Engine Optimization Services To Minimize Graphics PDF Create beautiful presentations together with your team, using our easy-to-use presentation slides. Share your ideas in real-time and make changes on the fly by downloading our templates. So whether you are in the office, on the go, or in a remote location, you can stay in sync with your team and present your ideas with confidence. With Slidegeeks presentation got a whole lot easier. Grab these presentations today.
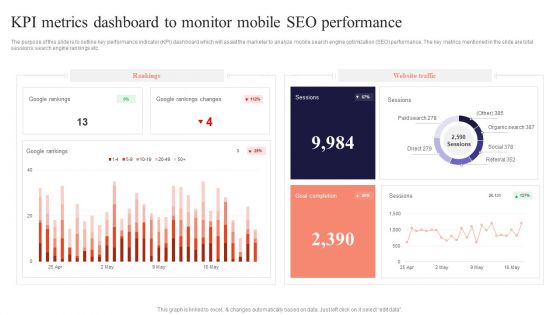
KPI Metrics Dashboard To Monitor Mobile Performing Mobile SEO Audit To Analyze Web Traffic Graphics PDF
The purpose of this slide is to outline key performance indicator KPI dashboard which will assist the marketer to analyze mobile search engine optimization SEO performance. The key metrics mentioned in the slide are total sessions, search engine rankings etc.Find highly impressive KPI Metrics Dashboard To Monitor Mobile Performing Mobile SEO Audit To Analyze Web Traffic Graphics PDF on Slidegeeks to deliver a meaningful presentation. You can save an ample amount of time using these presentation templates. No need to worry to prepare everything from scratch because Slidegeeks experts have already done a huge research and work for you. You need to download KPI Metrics Dashboard To Monitor Mobile Performing Mobile SEO Audit To Analyze Web Traffic Graphics PDF for your upcoming presentation. All the presentation templates are 100 precent editable and you can change the color and personalize the content accordingly. Download now.
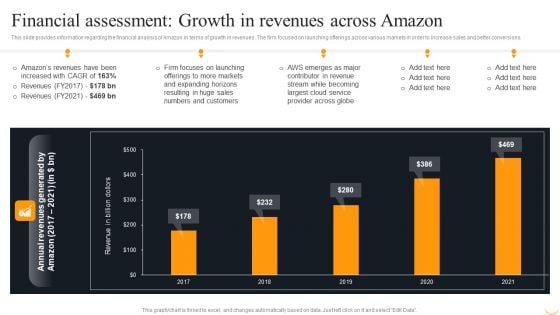
Financial Assessment Growth In Revenues Across Amazon Infographics PDF
This slide provides information regarding the financial analysis of Amazon in terms of growth in revenues. The firm focused on launching offerings across various markets in order to increase sales and better conversions. Slidegeeks is here to make your presentations a breeze with Financial Assessment Growth In Revenues Across Amazon Infographics PDF With our easy to use and customizable templates, you can focus on delivering your ideas rather than worrying about formatting. With a variety of designs to choose from, you are sure to find one that suits your needs. And with animations and unique photos, illustrations, and fonts, you can make your presentation pop. So whether you are giving a sales pitch or presenting to the board, make sure to check out Slidegeeks first.
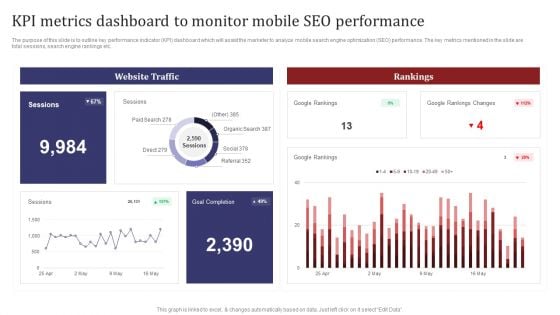
Mobile Search Engine Optimization Plan KPI Metrics Dashboard To Monitor Mobile SEO Performance Inspiration PDF
The purpose of this slide is to outline key performance indicator KPI dashboard which will assist the marketer to analyze mobile search engine optimization SEO performance. The key metrics mentioned in the slide are total sessions, search engine rankings etc. This Mobile Search Engine Optimization Plan KPI Metrics Dashboard To Monitor Mobile SEO Performance Inspiration PDF from Slidegeeks makes it easy to present information on your topic with precision. It provides customization options, so you can make changes to the colors, design, graphics, or any other component to create a unique layout. It is also available for immediate download, so you can begin using it right away. Slidegeeks has done good research to ensure that you have everything you need to make your presentation stand out. Make a name out there for a brilliant performance.
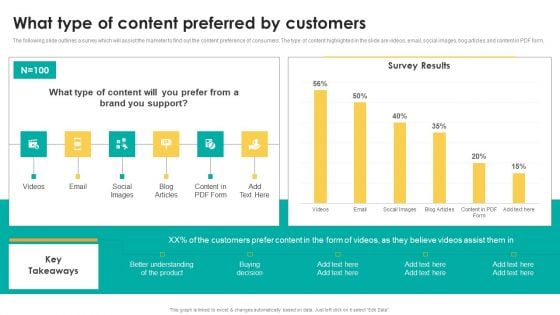
What Type Of Content Preferred By Customers Inspiration PDF
The following slide outlines a survey which will assist the marketer to find out the content preference of consumers. The type of content highlighted in the slide are videos, email, social images, bog articles and content in PDF form. Retrieve professionally designed What Type Of Content Preferred By Customers Inspiration PDF to effectively convey your message and captivate your listeners. Save time by selecting pre made slideshows that are appropriate for various topics, from business to educational purposes. These themes come in many different styles, from creative to corporate, and all of them are easily adjustable and can be edited quickly. Access them as PowerPoint templates or as Google Slides themes. You do not have to go on a hunt for the perfect presentation because Slidegeeks got you covered from everywhere.
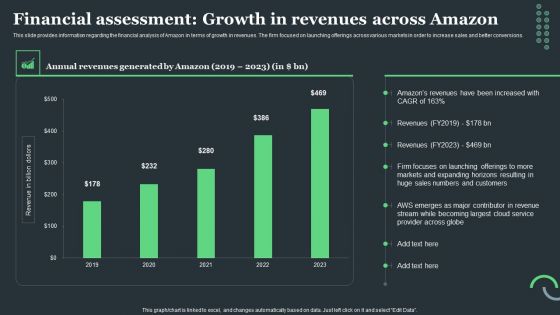
Amazon Tactical Plan Financial Assessment Growth In Revenues Across Amazon Information PDF
This slide provides information regarding the financial analysis of Amazon in terms of growth in revenues. The firm focused on launching offerings across various markets in order to increase sales and better conversions. Slidegeeks is here to make your presentations a breeze with Amazon Tactical Plan Financial Assessment Growth In Revenues Across Amazon Information PDF With our easy-to-use and customizable templates, you can focus on delivering your ideas rather than worrying about formatting. With a variety of designs to choose from, you are sure to find one that suits your needs. And with animations and unique photos, illustrations, and fonts, you can make your presentation pop. So whether you are giving a sales pitch or presenting to the board, make sure to check out Slidegeeks first.
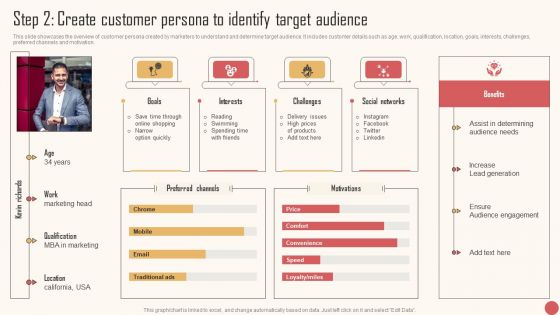
Step 2 Create Customer Persona To Identify Target Audience Summary PDF
This slide showcases the overview of customer persona created by marketers to understand and determine target audience. It includes customer details such as age, work, qualification, location, goals, interests, challenges, preferred channels and motivation. Do you have to make sure that everyone on your team knows about any specific topic I yes, then you should give Step 2 Create Customer Persona To Identify Target Audience Summary PDFa try. Our experts have put a lot of knowledge and effort into creating this impeccable Step 2 Create Customer Persona To Identify Target Audience Summary PDF. You can use this template for your upcoming presentations, as the slides are perfect to represent even the tiniest detail. You can download these templates from the Slidegeeks website and these are easy to edit. So grab these today
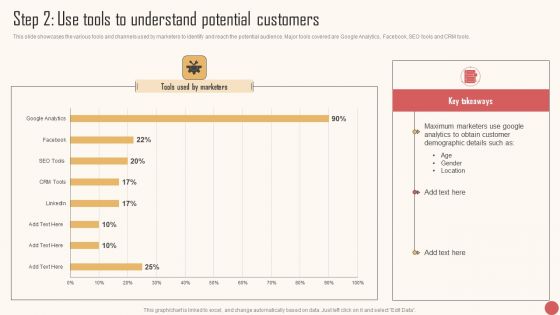
Step 2 Use Tools To Understand Potential Customers Themes PDF
This slide showcases the various tools and channels used by marketers to identify and reach the potential audience. Major tools covered are Google Analytics, Facebook, SEO tools and CRM tools. Get a simple yet stunning designed Step 2 Use Tools To Understand Potential Customers Themes PDF. It is the best one to establish the tone in your meetings. It is an excellent way to make your presentations highly effective. So, download this PPT today from Slidegeeks and see the positive impacts. Our easy-to-edit Step 2 Use Tools To Understand Potential Customers Themes PDF can be your go-to option for all upcoming conferences and meetings. So, what are you waiting for Grab this template today.
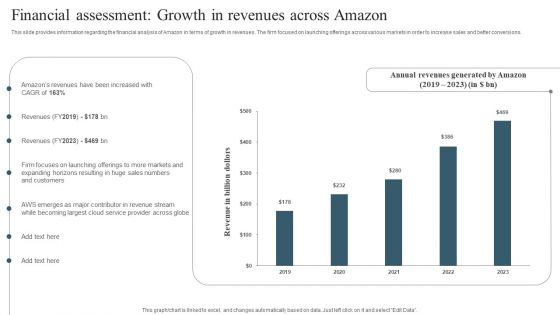
Financial Assessment Growth In Revenues Across Amazon Demonstration PDF
This slide provides information regarding the financial analysis of Amazon in terms of growth in revenues. The firm focused on launching offerings across various markets in order to increase sales and better conversions. Do you have to make sure that everyone on your team knows about any specific topic I yes, then you should give Financial Assessment Growth In Revenues Across Amazon Demonstration PDF a try. Our experts have put a lot of knowledge and effort into creating this impeccable Financial Assessment Growth In Revenues Across Amazon Demonstration PDF. You can use this template for your upcoming presentations, as the slides are perfect to represent even the tiniest detail. You can download these templates from the Slidegeeks website and these are easy to edit. So grab these today
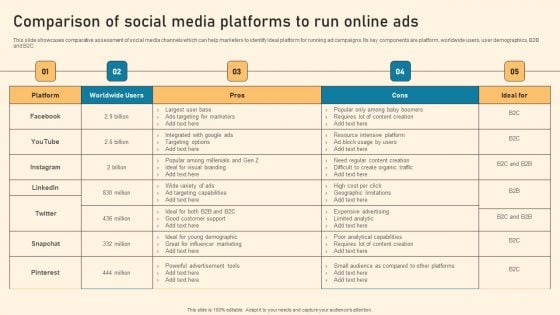
Comparison Of Social Media Platforms To Run Online Ads Ppt PowerPoint Presentation Diagram Graph Charts PDF
This slide showcases comparative assessment of social media channels which can help marketers to identify ideal platform for running ad campaigns. Its key components are platform, worldwide users, user demographics, B2B and B2C Slidegeeks is here to make your presentations a breeze with Comparison Of Social Media Platforms To Run Online Ads Ppt PowerPoint Presentation Diagram Graph Charts PDF With our easy to use and customizable templates, you can focus on delivering your ideas rather than worrying about formatting. With a variety of designs to choose from, you are sure to find one that suits your needs. And with animations and unique photos, illustrations, and fonts, you can make your presentation pop. So whether you are giving a sales pitch or presenting to the board, make sure to check out Slidegeeks first.
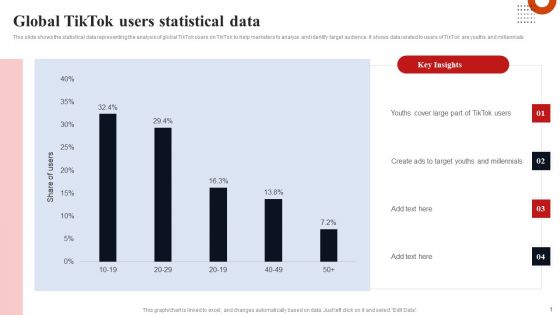
Global Tiktok Users Statistical Data Portrait PDF
This slide shows the statistical data representing the analysis of global TikTok users on TikTok to help marketers to analyze and identify target audience. It shows data related to users of TikTok are youths and millennials. If you are looking for a format to display your unique thoughts, then the professionally designed Global Tiktok Users Statistical Data Portrait PDF is the one for you. You can use it as a Google Slides template or a PowerPoint template. Incorporate impressive visuals, symbols, images, and other charts. Modify or reorganize the text boxes as you desire. Experiment with shade schemes and font pairings. Alter, share or cooperate with other people on your work. Download Global Tiktok Users Statistical Data Portrait PDF and find out how to give a successful presentation. Present a perfect display to your team and make your presentation unforgettable.
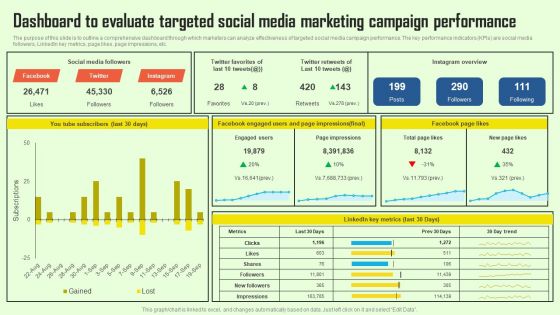
Increasing Consumer Engagement With Database Dashboard To Evaluate Targeted Social Media Portrait PDF
The purpose of this slide is to outline a comprehensive dashboard through which marketers can analyze effectiveness of targeted social media campaign performance. The key performance indicators KPIs are social media followers, LinkedIn key metrics, page likes, page impressions, etc. If you are looking for a format to display your unique thoughts, then the professionally designed Increasing Consumer Engagement With Database Dashboard To Evaluate Targeted Social Media Portrait PDF is the one for you. You can use it as a Google Slides template or a PowerPoint template. Incorporate impressive visuals, symbols, images, and other charts. Modify or reorganize the text boxes as you desire. Experiment with shade schemes and font pairings. Alter, share or cooperate with other people on your work. Download Increasing Consumer Engagement With Database Dashboard To Evaluate Targeted Social Media Portrait PDF and find out how to give a successful presentation. Present a perfect display to your team and make your presentation unforgettable.


 Continue with Email

 Home
Home


