Bank Presentation
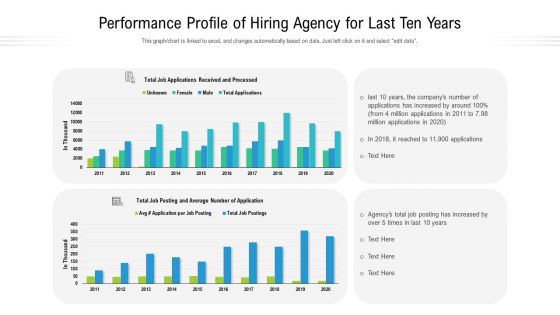
Performance Profile Of Hiring Agency For Last Ten Years Ppt Show Styles PDF
This graph to chart is linked to excel, and changes automatically based on data. Just left click on it and select edit data. Showcasing this set of slides titled performance profile of hiring agency for last ten years ppt show styles pdf. The topics addressed in these templates are performance profile of hiring agency for last ten years. All the content presented in this PPT design is completely editable. Download it and make adjustments in color, background, font etc. as per your unique business setting.

Internet Security Threat Analysis Report Chart Introduction PDF
Following slide exhibits security and data breach report chart it includes major statistics such as- loss or theft of data, failure to redirect data and data posting to incorrect recipient. Pitch your topic with ease and precision using this internet security threat analysis report chart introduction pdf. This layout presents information on internet security threat analysis report chart. It is also available for immediate download and adjustment. So, changes can be made in the color, design, graphics or any other component to create a unique layout.
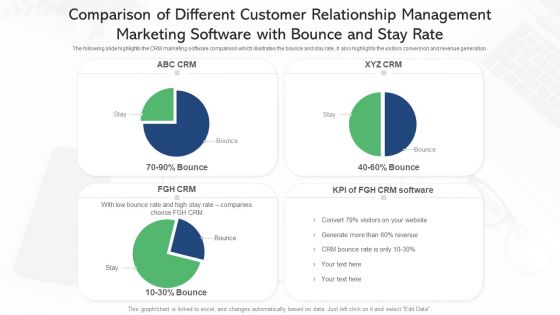
Comparison Of Different Customer Relationship Management Marketing Software With Bounce And Stay Rate Mockup PDF
The following slide highlights the CRM marketing software comparison which illustrates the bounce and stay rate, It also highlights the visitors conversion and revenue generation. Showcasing this set of slides titled comparison of different customer relationship management marketing software with bounce and stay rate mockup pdf. The topics addressed in these templates are comparison of different customer relationship management marketing software with bounce and stay rate. All the content presented in this PPT design is completely editable. Download it and make adjustments in color, background, font etc. as per your unique business setting.

Determine Growth Drivers Of Local Advertising Revenue Demonstration PDF
This slide caters details about growth drivers of local advertising revenues in terms of local sources such as advertisement deliveries, new revenues generated through salespeople, etc. Presenting determine growth drivers of local advertising revenue demonstration pdf to provide visual cues and insights. Share and navigate important information on three stages that need your due attention. This template can be used to pitch topics like recurring revenues, advertisements delivery, revenues generated. In addtion, this PPT design contains high resolution images, graphics, etc, that are easily editable and available for immediate download.
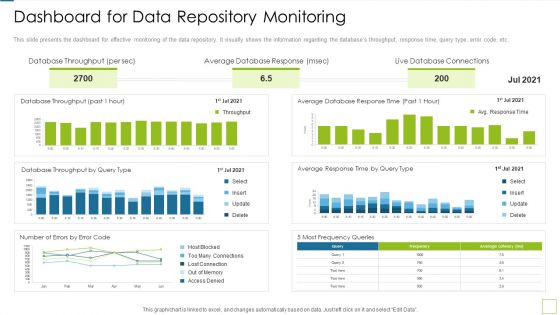
Database Expansion And Optimization Dashboard For Data Repository Monitoring Ppt Model Infographic Template
This slide presents the dashboard for effective monitoring of the data repository. It visually shows the information regarding the databases throughput, response time, query type, error code, etc. Deliver and pitch your topic in the best possible manner with this database expansion and optimization dashboard for data repository monitoring ppt model infographic template. Use them to share invaluable insights on database throughput, average database response, live database connections and impress your audience. This template can be altered and modified as per your expectations. So, grab it now.
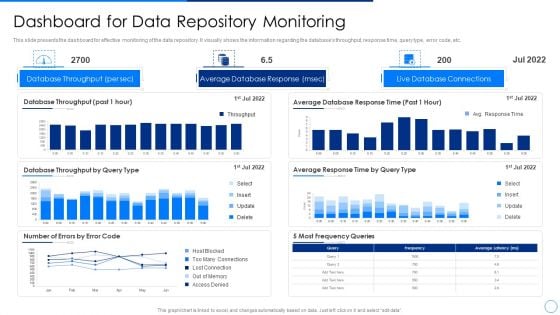
Scale Up Plan For Data Inventory Model Dashboard For Data Repository Monitoring Information PDF
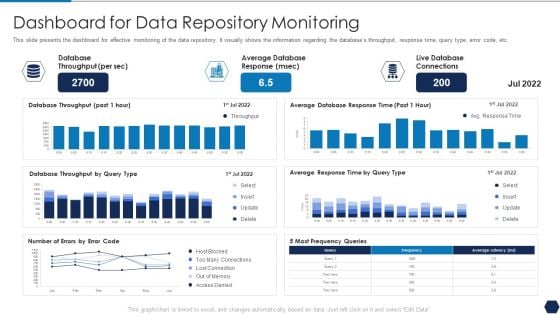
Tactical Plan For Upgrading DBMS Dashboard For Data Repository Monitoring Diagrams PDF
This slide presents the dashboard for effective monitoring of the data repository. It visually shows the information regarding the databases throughput, response time, query type, error code, etc. Deliver and pitch your topic in the best possible manner with this tactical plan for upgrading dbms dashboard for data repository monitoring diagrams pdf. Use them to share invaluable insights on database throughput, average database response, live database connections and impress your audience. This template can be altered and modified as per your expectations. So, grab it now.
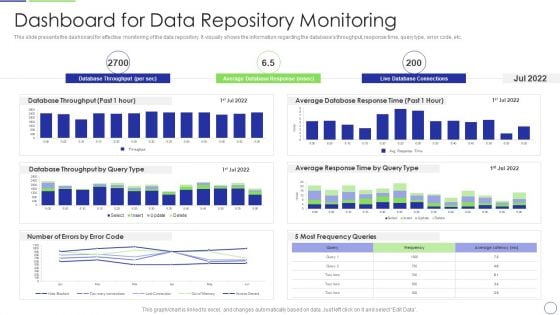
Developing Organization Primary Data Storage Action Plan Dashboard For Data Repository Monitoring Information PDF
This slide presents the dashboard for effective monitoring of the data repository. It visually shows the information regarding the databases throughput, response time, query type, error code, etc. Deliver and pitch your topic in the best possible manner with this developing organization primary data storage action plan dashboard for data repository monitoring information pdf. Use them to share invaluable insights on dashboard for data repository monitoring and impress your audience. This template can be altered and modified as per your expectations. So, grab it now.
Bar Graph Representing Accomplishment Metrics For Customer Service Team Icons PDF
This slide shows the graphical representation of success metrics that helps to measure the customer service team which includes customer lifetime value, customer churn, net promoter score, revenues churn, customer experience score, customer renewals, etc. Showcasing this set of slides titled bar graph representing accomplishment metrics for customer service team icons pdf. The topics addressed in these templates are importance level, least important. All the content presented in this PPT design is completely editable. Download it and make adjustments in color, background, font etc. as per your unique business setting.
Sales Performance Monthly Strategy Dashboard Icons PDF
Below slide showcases the monthly dashboard of sales performance . Company can measure and evaluate their monthly sales performance using key factors that are sales comparison, monthly sales, planned vs actual sales and gross margin by Pitch your topic with ease and precision using this sales performance monthly strategy dashboard icons pdf. This layout presents information on sales performance monthly strategy dashboard. It is also available for immediate download and adjustment. So, changes can be made in the color, design, graphics or any other component to create a unique layout.
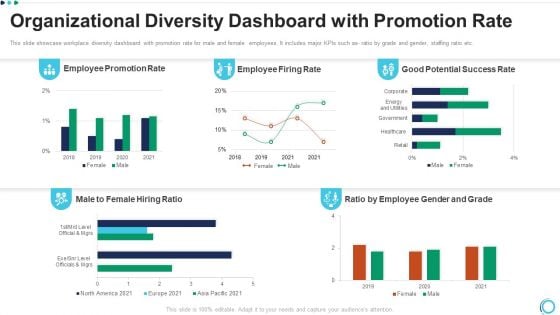
Organizational Diversity Dashboard With Promotion Rate Topics PDF
This slide showcase workplace diversity dashboard with promotion rate for male and female employees. It includes major KPIs such as ratio by grade and gender, staffing ratio etc. Showcasing this set of slides titled organizational diversity dashboard with promotion rate topics pdf. The topics addressed in these templates are employee promotion rate, employee firing rate, good potential success rate. All the content presented in this PPT design is completely editable. Download it and make adjustments in color, background, font etc. as per your unique business setting.
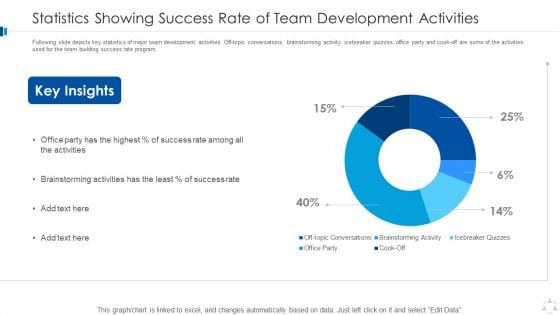
Statistics Showing Success Rate Of Team Development Activities Download PDF
Following slide depicts key statistics of major team development activities. Off topic conversations, brainstorming activity, icebreaker quizzes, office party and cook off are some of the activities used for the team building success rate program. Showcasing this set of slides titled statistics showing success rate of team development activities download pdf. The topics addressed in these templates are statistics showing success rate of team development activities. All the content presented in this PPT design is completely editable. Download it and make adjustments in color, background, font etc. as per your unique business setting.
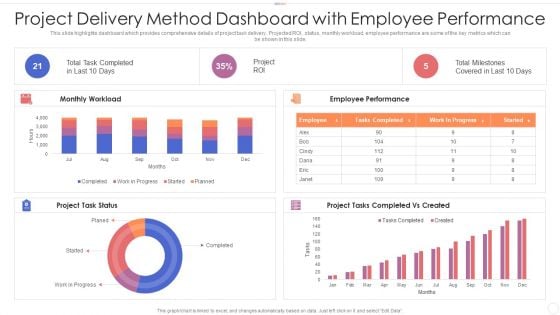
Project Delivery Method Dashboard With Employee Performance Introduction PDF
This slide highlights dashboard which provides comprehensive details of project task delivery. Projected ROI, status, monthly workload, employee performance are some of the key metrics which can be shown in this slide. Showcasing this set of slides titled project delivery method dashboard with employee performance introduction pdf. The topics addressed in these templates are project delivery method dashboard with employee performance. All the content presented in this PPT design is completely editable. Download it and make adjustments in color, background, font etc. as per your unique business setting.
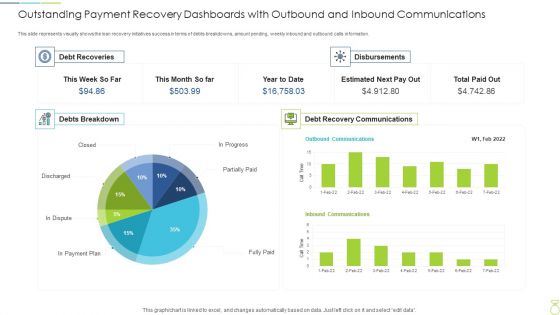
Outstanding Payment Recovery Dashboards With Outbound And Inbound Communications Graphics PDF
This slide represents visually shows the loan recovery initiatives success in terms of debts breakdowns, amount pending, weekly inbound and outbound calls information. Pitch your topic with ease and precision using this outstanding payment recovery dashboards with outbound and inbound communications graphics pdf. This layout presents information on outstanding payment recovery dashboards with outbound and inbound communications. It is also available for immediate download and adjustment. So, changes can be made in the color, design, graphics or any other component to create a unique layout.
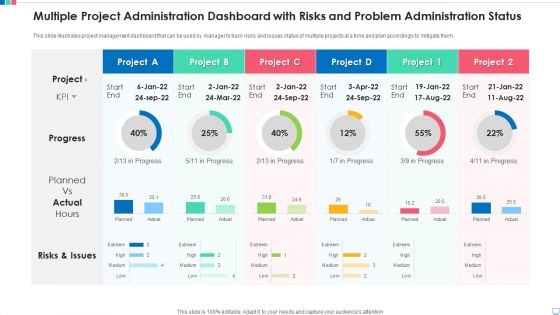
Multiple Project Administration Dashboard With Risks And Problem Administration Status Background PDF
This slide illustrates project management dashboard that can be used by manager to track risks and issues status of multiple projects at a time and plan accordingly to mitigate them. Showcasing this set of slides titled multiple project administration dashboard with risks and problem administration status background pdf. The topics addressed in these templates are multiple project administration dashboard with risks and problem administration status. All the content presented in this PPT design is completely editable. Download it and make adjustments in color, background, font etc. as per your unique business setting.
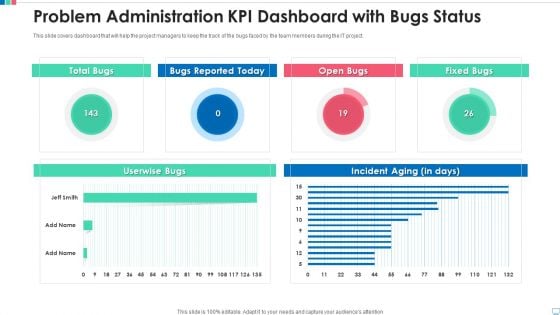
Problem Administration Kpi Dashboard With Bugs Status Ideas PDF
This slide covers dashboard that will help the project managers to keep the track of the bugs faced by the team members during the IT project. Pitch your topic with ease and precision using this problem administration kpi dashboard with bugs status ideas pdf. This layout presents information on problem administration kpi dashboard with bugs status. It is also available for immediate download and adjustment. So, changes can be made in the color, design, graphics or any other component to create a unique layout.
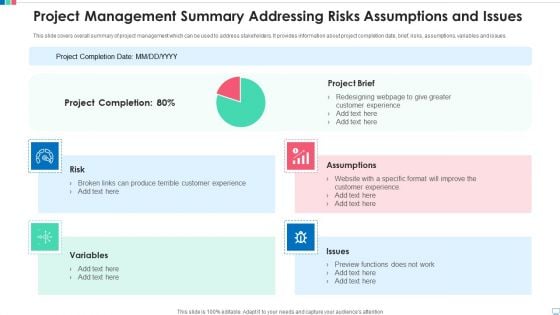
Project Management Summary Addressing Risks Assumptions And Issues Brochure PDF
This slide covers overall summary of project management which can be used to address stakeholders. It provides information about project completion date, brief, risks, assumptions, variables and issues. Pitch your topic with ease and precision using this project management summary addressing risks assumptions and issues brochure pdf. This layout presents information on project brief, assumptions, risk, variables, issues. It is also available for immediate download and adjustment. So, changes can be made in the color, design, graphics or any other component to create a unique layout.
Project Problem Administration Tracking Dashboard Infographics PDF
This slide covers dashboard which helps the project managers to keep the track of all issues in detail. It also includes project name, department, project owner, detail of the issue, priority and status. Showcasing this set of slides titled project problem administration tracking dashboard infographics pdf. The topics addressed in these templates are project problem administration tracking dashboard. All the content presented in this PPT design is completely editable. Download it and make adjustments in color, background, font etc. as per your unique business setting.
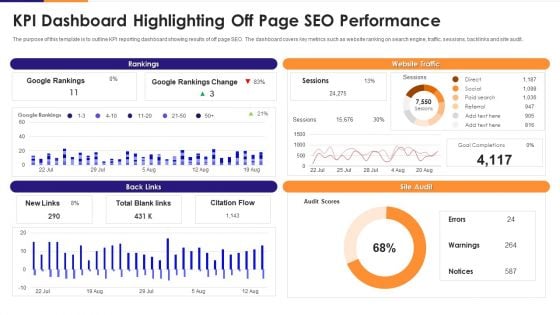
KPI Dashboard Highlighting Off Page Seo Performance Rules PDF
The purpose of this template is to outline KPI reporting dashboard showing results of off page SEO. The dashboard covers key metrics such as website ranking on search engine, traffic, sessions, backlinks and site audit. Showcasing this set of slides titled kpi dashboard highlighting off page seo performance rules pdf. The topics addressed in these templates are kpi dashboard highlighting off page seo performance. All the content presented in this PPT design is completely editable. Download it and make adjustments in color, background, font etc. as per your unique business setting.
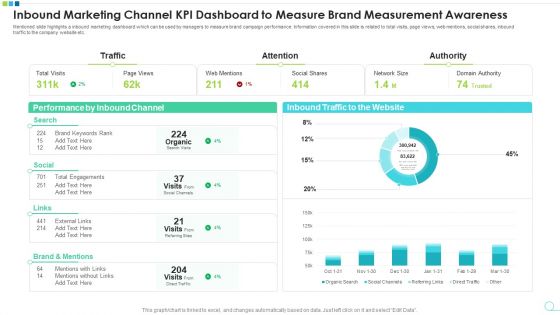
Inbound Marketing Channel KPI Dashboard To Measure Brand Measurement Awareness Pictures PDF
Mentioned slide highlights a inbound marketing dashboard which can be used by managers to measure brand campaign performance. Information covered in this slide is related to total visits, page views, web mentions, social shares, inbound traffic to the company website etc. Pitch your topic with ease and precision using this inbound marketing channel kpi dashboard to measure brand measurement awareness pictures pdf. This layout presents information on inbound marketing channel kpi dashboard to measure brand measurement awareness. It is also available for immediate download and adjustment. So, changes can be made in the color, design, graphics or any other component to create a unique layout.
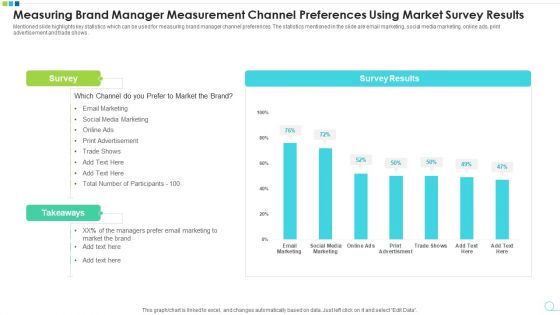
Measuring Brand Manager Measurement Channel Preferences Using Market Survey Results Professional PDF
Mentioned slide highlights key statistics which can be used for measuring brand manager channel preferences. The statistics mentioned in the slide are email marketing, social media marketing, online ads, print advertisement and trade shows. Pitch your topic with ease and precision using this measuring brand manager measurement channel preferences using market survey results professional pdf. This layout presents information on measuring brand manager measurement channel preferences using market survey results. It is also available for immediate download and adjustment. So, changes can be made in the color, design, graphics or any other component to create a unique layout.
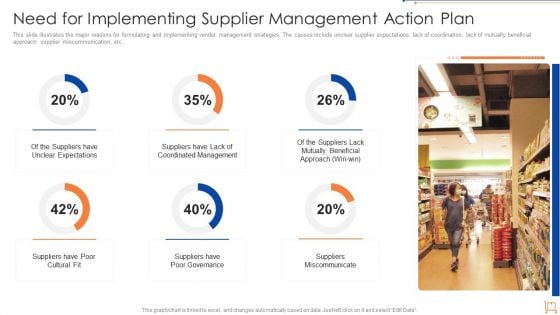
Need For Implementing Supplier Management Action Plan Professional PDF
This slide illustrates the major reasons for formulating and implementing vendor management strategies. The causes include unclear supplier expectations, lack of coordination, lack of mutually beneficial approach, supplier miscommunication, etc. Showcasing this set of slides titled need for implementing supplier management action plan professional pdf. The topics addressed in these templates are need for implementing supplier management action plan. All the content presented in this PPT design is completely editable. Download it and make adjustments in color, background, font etc. as per your unique business setting.
Procurement Kpi Dashboard For Tracking Supplier Action Plan Impact Graphics PDF
This slide covers procurement spend analysis dashboard for tracking new supplier strategy results. It include KPIs such as invoice count, invoices information, due dates, spend by payment terms, supplier payment terms, spend by entity, spend by category, spend by country. Showcasing this set of slides titled procurement kpi dashboard for tracking supplier action plan impact graphics pdf. The topics addressed in these templates are procurement kpi dashboard for tracking supplier action plan impact. All the content presented in this PPT design is completely editable. Download it and make adjustments in color, background, font etc. as per your unique business setting.
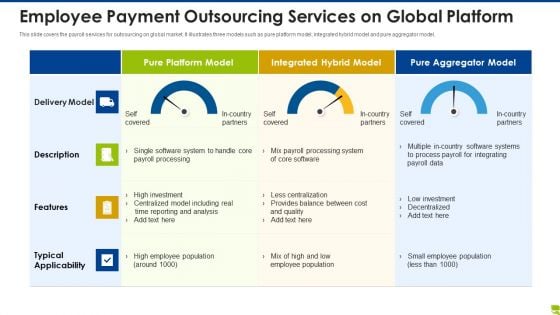
Employee Payment Outsourcing Services On Global Platform Inspiration PDF
This slide covers the payroll services for outsourcing on global market. It illustrates three models such as pure platform model, integrated hybrid model and pure aggregator model. Pitch your topic with ease and precision using this employee payment outsourcing services on global platform inspiration pdf. This layout presents information on employee payment outsourcing services on global platform. It is also available for immediate download and adjustment. So, changes can be made in the color, design, graphics or any other component to create a unique layout.
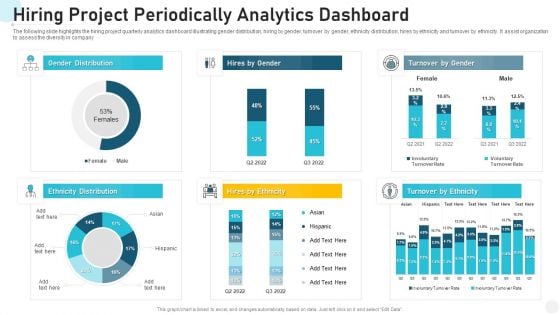
Hiring Project Periodically Analytics Dashboard Summary PDF
The following slide highlights the hiring project quarterly analytics dashboard illustrating gender distribution, hiring by gender, turnover by gender, ethnicity distribution, hires by ethnicity and turnover by ethnicity. It assist organization to assess the diversity in company Showcasing this set of slides titled hiring project periodically analytics dashboard summary pdf. The topics addressed in these templates are hiring project periodically analytics dashboard. All the content presented in this PPT design is completely editable. Download it and make adjustments in color, background, font etc. as per your unique business setting.
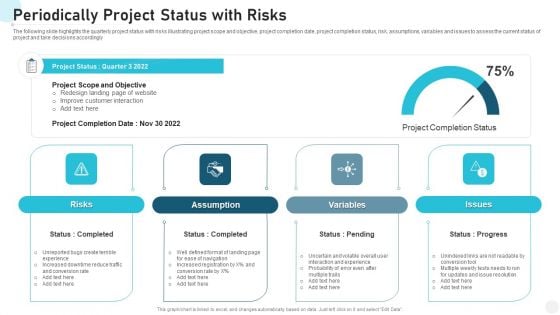
Periodically Project Status With Risks Designs PDF
The following slide highlights the quarterly project status with risks illustrating project scope and objective, project completion date, project completion status, risk, assumptions, variables and issues to assess the current status of project and take decisions accordingly Pitch your topic with ease and precision using this periodically project status with risks designs pdf. This layout presents information on risks, assumption, variables, issues. It is also available for immediate download and adjustment. So, changes can be made in the color, design, graphics or any other component to create a unique layout.
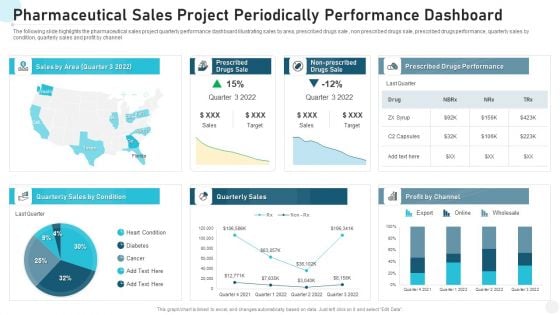
Pharmaceutical Sales Project Periodically Performance Dashboard Brochure PDF
The following slide highlights the pharmaceutical sales project quarterly performance dashboard illustrating sales by area, prescribed drugs sale , non prescribed drugs sale, prescribed drugs performance, quarterly sales by condition, quarterly sales and profit by channel Showcasing this set of slides titled pharmaceutical sales project periodically performance dashboard brochure pdf. The topics addressed in these templates are pharmaceutical sales project periodically performance dashboard. All the content presented in this PPT design is completely editable. Download it and make adjustments in color, background, font etc. as per your unique business setting.
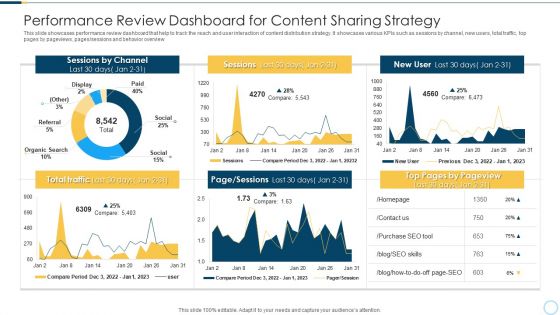
Performance Review Dashboard For Content Sharing Strategy Designs PDF
This slide showcases performance review dashboard that help to track the reach and user interaction of content distribution strategy. It showcases various KPIs such as sessions by channel, new users, total traffic, top pages by pageviews, pages or sessions and behavior overview Showcasing this set of slides titled performance review dashboard for content sharing strategy designs pdf. The topics addressed in these templates are performance review dashboard for content sharing strategy. All the content presented in this PPT design is completely editable. Download it and make adjustments in color, background, font etc. as per your unique business setting.
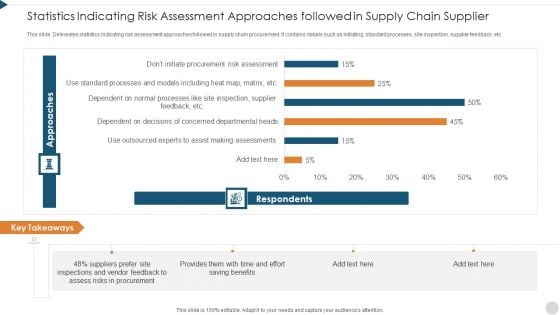
Statistics Indicating Risk Assessment Approaches Followed In Supply Chain Supplier Designs PDF
This slide. Delineates statistics indicating risk assessment approaches followed in supply chain procurement. It contains details such as initiating, standard processes, site inspection, supplier feedback, etc. Pitch your topic with ease and precision using this statistics indicating risk assessment approaches followed in supply chain supplier designs pdf. This layout presents information on key takeaways, approaches, respondents. It is also available for immediate download and adjustment. So, changes can be made in the color, design, graphics or any other component to create a unique layout.
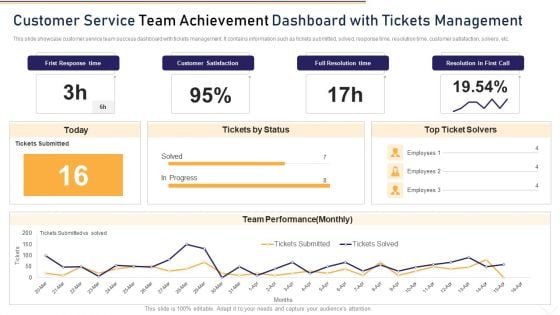
Customer Service Team Achievement Dashboard With Tickets Management Rules PDF
This slide showcase customer service team success dashboard with tickets management. It contains information such as tickets submitted, solved, response time, resolution time, customer satisfaction, solvers, etc. Showcasing this set of slides titled customer service team achievement dashboard with tickets management rules pdf. The topics addressed in these templates are customer satisfaction, full resolution time, resolution in first call. All the content presented in this PPT design is completely editable. Download it and make adjustments in color, background, font etc. as per your unique business setting.
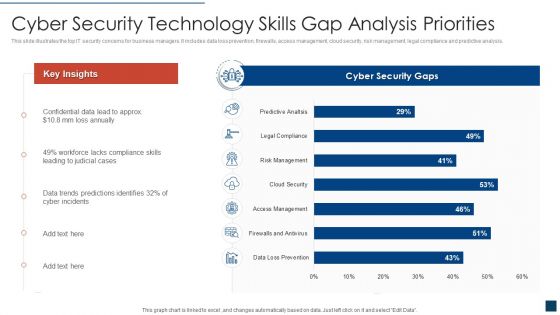
Cyber Security Technology Skills Gap Analysis Priorities Clipart PDF
This slide illustrates the top IT security concerns for business managers. It includes data loss prevention, firewalls, access management, cloud security, risk management, legal compliance and predictive analysis. Showcasing this set of slides titled cyber security technology skills gap analysis priorities clipart pdf. The topics addressed in these templates are cyber security technology skills gap analysis priorities. All the content presented in this PPT design is completely editable. Download it and make adjustments in color, background, font etc. as per your unique business setting.
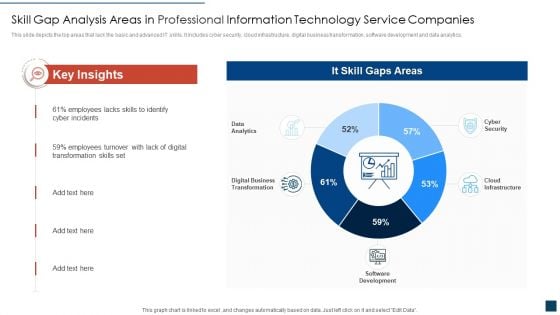
Skill Gap Analysis Areas In Professional Information Technology Service Companies Ideas PDF
This slide depicts the top areas that lack the basic and advanced IT skills. It includes cyber security, cloud infrastructure, digital business transformation, software development and data analytics. Showcasing this set of slides titled skill gap analysis areas in professional information technology service companies ideas pdf. The topics addressed in these templates are skill gap analysis areas in professional information technology service companies. All the content presented in this PPT design is completely editable. Download it and make adjustments in color, background, font etc. as per your unique business setting.
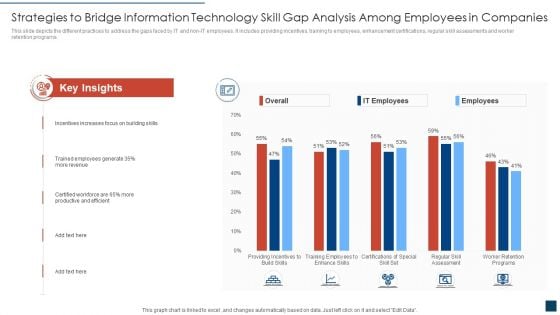
Strategies To Bridge Information Technology Skill Gap Analysis Among Employees In Companies Formats PDF
This slide depicts the different practices to address the gaps faced by IT and non-IT employees. It includes providing incentives, training to employees, enhancement certifications, regular skill assessments and worker retention programs. Pitch your topic with ease and precision using this strategies to bridge information technology skill gap analysis among employees in companies formats pdf. This layout presents information on strategies to bridge information technology skill gap analysis among employees in companies. It is also available for immediate download and adjustment. So, changes can be made in the color, design, graphics or any other component to create a unique layout.
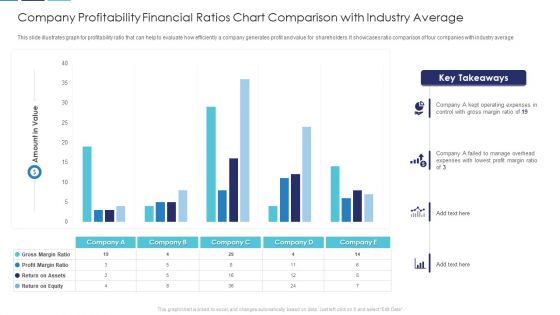
Company Profitability Financial Ratios Chart Comparison With Industry Average Download PDF
This slide illustrates graph for profitability ratio that can help to evaluate how efficiently a company generates profit and value for shareholders. It showcases ratio comparison of four companies with industry average Showcasing this set of slides titled company profitability financial ratios chart comparison with industry average download pdf. The topics addressed in these templates are company profitability financial ratios chart comparison with industry average. All the content presented in this PPT design is completely editable. Download it and make adjustments in color, background, font etc. as per your unique business setting.
Company Turnover Financial Ratios Chart Comparison Icons PDF
This slide illustrates graph for turnover ratios that are accounts receivable, inventory turnover, accounts payable turnover, fixed asset turnover and total assets turnover ratio. It showcases comparison of three companies. Pitch your topic with ease and precision using this company turnover financial ratios chart comparison icons pdf. This layout presents information on company turnover financial ratios chart comparison. It is also available for immediate download and adjustment. So, changes can be made in the color, design, graphics or any other component to create a unique layout.
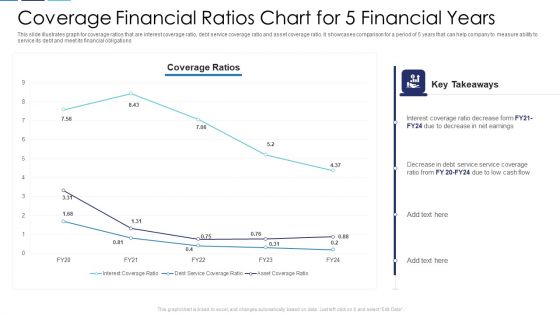
Coverage Financial Ratios Chart For 5 Financial Years Themes PDF
This slide illustrates graph for coverage ratios that are interest coverage ratio, debt service coverage ratio and asset coverage ratio. It showcases comparison for a period of 5 years that can help company to measure ability to service its debt and meet its financial obligations Showcasing this set of slides titled coverage financial ratios chart for 5 financial years themes pdf. The topics addressed in these templates are coverage financial ratios chart for 5 financial years. All the content presented in this PPT design is completely editable. Download it and make adjustments in color, background, font etc. as per your unique business setting.
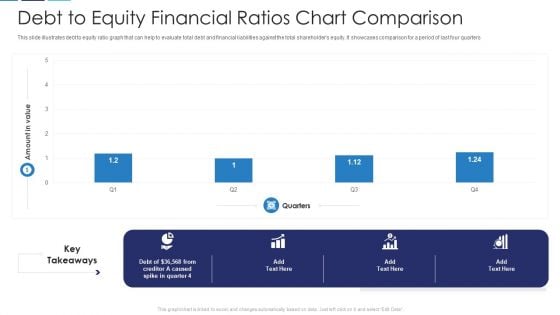
Debt To Equity Financial Ratios Chart Comparison Download PDF
This slide illustrates debt to equity ratio graph that can help to evaluate total debt and financial liabilities against the total shareholders equity. It showcases comparison for a period of last four quarters Pitch your topic with ease and precision using this debt to equity financial ratios chart comparison download pdf. This layout presents information on debt to equity financial ratios chart comparison. It is also available for immediate download and adjustment. So, changes can be made in the color, design, graphics or any other component to create a unique layout.

Dividend Payout Financial Ratios Chart Comparison Themes PDF
This slide showcases dividend payout ratio graph that can help organization to determine the percentage of the companys earnings that is paid out to shareholders by way of dividend. It showcases comparison for a period of 8 years Showcasing this set of slides titled dividend payout financial ratios chart comparison themes pdf. The topics addressed in these templates are dividend payout financial ratios chart comparison. All the content presented in this PPT design is completely editable. Download it and make adjustments in color, background, font etc. as per your unique business setting.
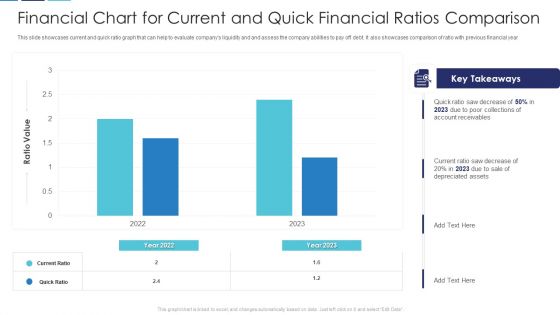
Financial Chart For Current And Quick Financial Ratios Comparison Brochure PDF
This slide showcases current and quick ratio graph that can help to evaluate companys liquidity and and assess the company abilities to pay off debt. It also showcases comparison of ratio with previous financial year Pitch your topic with ease and precision using this financial chart for current and quick financial ratios comparison brochure pdf. This layout presents information on financial chart for current and quick financial ratios comparison. It is also available for immediate download and adjustment. So, changes can be made in the color, design, graphics or any other component to create a unique layout.
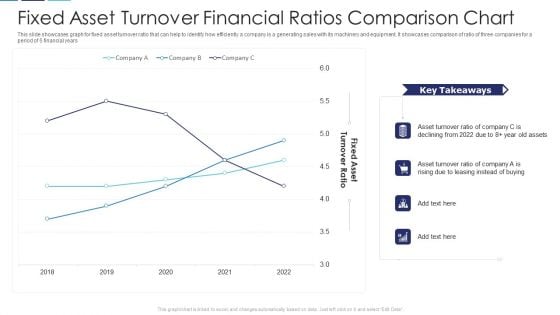
Fixed Asset Turnover Financial Ratios Comparison Chart Structure PDF
This slide showcases graph for fixed asset turnover ratio that can help to identify how efficiently a company is a generating sales with its machinery and equipment. It showcases comparison of ratio of three companies for a period of 5 financial years Showcasing this set of slides titled fixed asset turnover financial ratios comparison chart structure pdf. The topics addressed in these templates are fixed asset turnover financial ratios comparison chart. All the content presented in this PPT design is completely editable. Download it and make adjustments in color, background, font etc. as per your unique business setting.
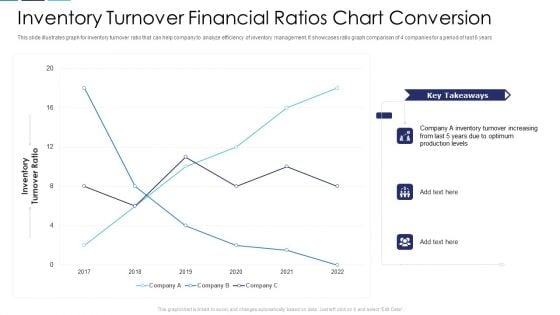
Inventory Turnover Financial Ratios Chart Conversion Portrait PDF
This slide illustrates graph for inventory turnover ratio that can help company to analyze efficiency of inventory management. It showcases ratio graph comparison of 4 companies for a period of last 6 years Pitch your topic with ease and precision using this inventory turnover financial ratios chart conversion portrait pdf. This layout presents information on inventory turnover financial ratios chart conversion. It is also available for immediate download and adjustment. So, changes can be made in the color, design, graphics or any other component to create a unique layout.
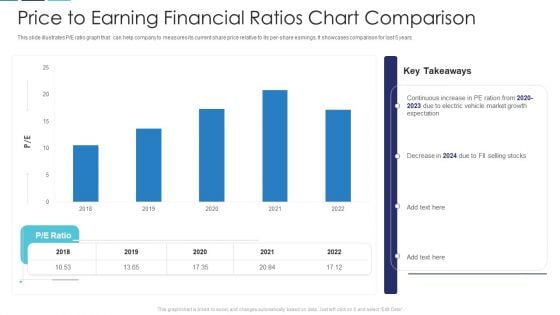
Price To Earning Financial Ratios Chart Comparison Slides PDF
This slide illustrates P or E ratio graph that can help company to measures its current share price relative to its per-share earnings. It showcases comparison for last 5 years Showcasing this set of slides titled price to earning financial ratios chart comparison slides pdf. The topics addressed in these templates are price to earning financial ratios chart comparison. All the content presented in this PPT design is completely editable. Download it and make adjustments in color, background, font etc. as per your unique business setting.
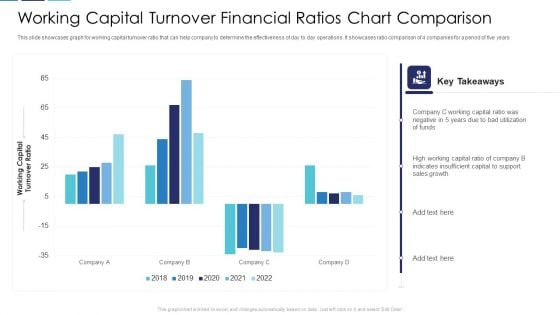
Working Capital Turnover Financial Ratios Chart Comparison Clipart PDF
This slide showcases graph for working capital turnover ratio that can help company to determine the effectiveness of day to day operations. It showcases ratio comparison of 4 companies for a period of five years Pitch your topic with ease and precision using this working capital turnover financial ratios chart comparison clipart pdf. This layout presents information on working capital turnover financial ratios chart comparison. It is also available for immediate download and adjustment. So, changes can be made in the color, design, graphics or any other component to create a unique layout.
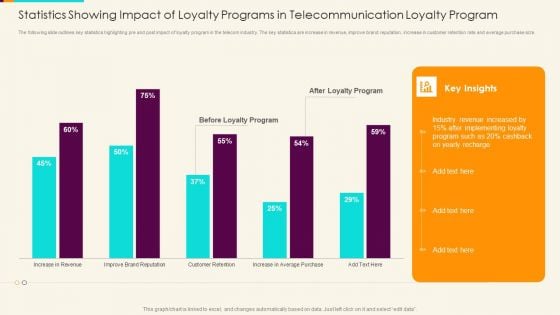
Statistics Showing Impact Of Loyalty Programs In Telecommunication Loyalty Program Sample PDF
The following slide outlines key statistics highlighting pre and post impact of loyalty program in the telecom industry. The key statistics are increase in revenue, improve brand reputation, increase in customer retention rate and average purchase size. Showcasing this set of slides titled statistics showing impact of loyalty programs in telecommunication loyalty program sample pdf. The topics addressed in these templates are statistics showing impact of loyalty programs in telecommunication loyalty program. All the content presented in this PPT design is completely editable. Download it and make adjustments in color, background, font etc. as per your unique business setting.
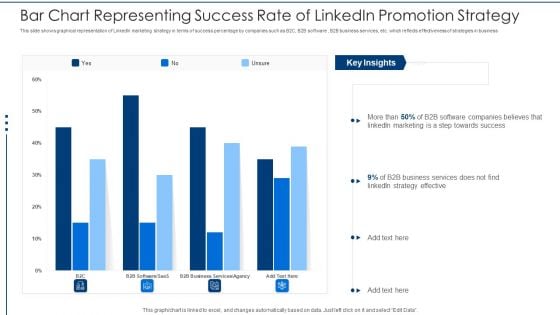
Bar Chart Representing Success Rate Of Linkedin Promotion Strategy Rules PDF
This slide shows graphical representation of LinkedIn marketing strategy in terms of success percentage by companies such as B2C, B2B software , B2B business services, etc. which reflects effectiveness of strategies in business Pitch your topic with ease and precision using this bar chart representing success rate of linkedin promotion strategy rules pdf. This layout presents information on bar chart representing success rate of linkedin promotion strategy. It is also available for immediate download and adjustment. So, changes can be made in the color, design, graphics or any other component to create a unique layout.
Supplier Compensation Due Tracking Dashboard With Paid Invoices Topics PDF
This slide showcases dashboard that can help organization to track the outstanding payment of different vendors and take timely action in case of delay. Its key elements are due by age summary, top 5 vendor by purchases, top 5 vendors by amount due and total invoice vs paid invoices. Pitch your topic with ease and precision using this supplier compensation due tracking dashboard with paid invoices topics pdf. This layout presents information on supplier compensation due tracking dashboard with paid invoices. It is also available for immediate download and adjustment. So, changes can be made in the color, design, graphics or any other component to create a unique layout.
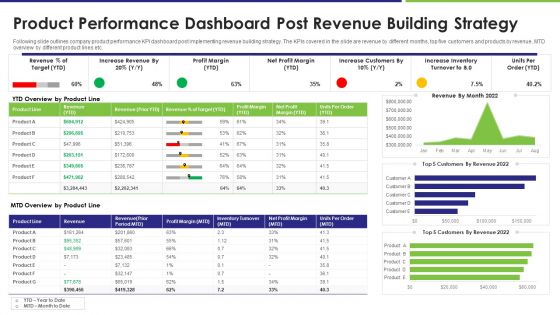
Product Performance Dashboard Post Revenue Building Strategy Brochure PDF
Following slide outlines company product performance KPI dashboard post implementing revenue building strategy. The KPIs covered in the slide are revenue by different months, top five customers and products by revenue, MTD overview by different product lines etc. Showcasing this set of slides titled product performance dashboard post revenue building strategy brochure pdf. The topics addressed in these templates are revenue, target, profit margin. All the content presented in this PPT design is completely editable. Download it and make adjustments in color, background, font etc. as per your unique business setting.
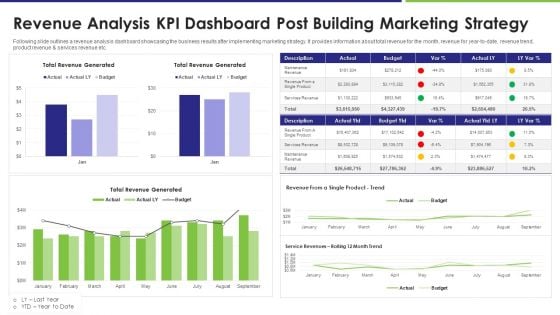
Revenue Analysis KPI Dashboard Post Building Marketing Strategy Infographics PDF
Following slide outlines a revenue analysis dashboard showcasing the business results after implementing marketing strategy. It provides information about total revenue for the month, revenue for year to date, revenue trend, product revenue and services revenue etc. Pitch your topic with ease and precision using this revenue analysis kpi dashboard post building marketing strategy infographics pdf. This layout presents information on revenue analysis kpi dashboard post building marketing strategy. It is also available for immediate download and adjustment. So, changes can be made in the color, design, graphics or any other component to create a unique layout.
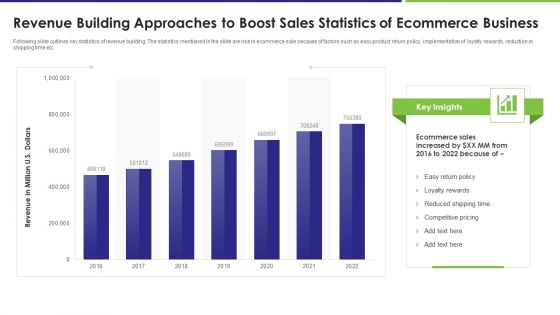
Revenue Building Approaches To Boost Sales Statistics Of Ecommerce Business Demonstration PDF
Following slide outlines key statistics of revenue building. The statistics mentioned in the slide are rise in ecommerce sale because of factors such as easy product return policy, implementation of loyalty rewards, reduction in shipping time etc. Showcasing this set of slides titled revenue building approaches to boost sales statistics of ecommerce business demonstration pdf. The topics addressed in these templates are sales, ecommerce. All the content presented in this PPT design is completely editable. Download it and make adjustments in color, background, font etc. as per your unique business setting.
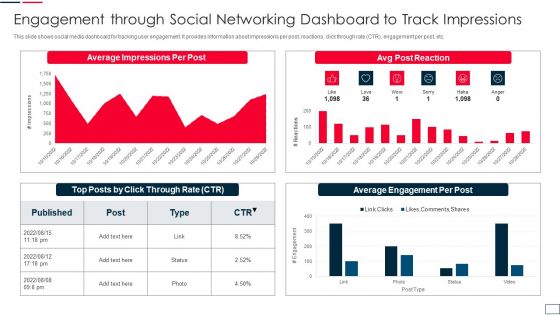
Engagement Through Social Networking Dashboard To Track Impressions Template PDF
This slide shows social media dashboard for tracking user engagement. It provides information about impressions per post, reactions, click through rate CTR, engagement per post, etc. Showcasing this set of slides titled engagement through social networking dashboard to track impressions template pdf. The topics addressed in these templates are engagement through social networking dashboard to track impressions. All the content presented in this PPT design is completely editable. Download it and make adjustments in color, background, font etc. as per your unique business setting.
Application Sources For Recruitment On Social Media Tracking Dashboard Microsoft PDF
This slide covers the dashboard for tracking the count of applicants profiles from various sources. It includes the open positions, new roles, total roles, candidates placed , application sources, client decline rates and commission received. Pitch your topic with ease and precision using this application sources for recruitment on social media tracking dashboard microsoft pdf. This layout presents information on application sources for recruitment on social media tracking dashboard. It is also available for immediate download and adjustment. So, changes can be made in the color, design, graphics or any other component to create a unique layout.
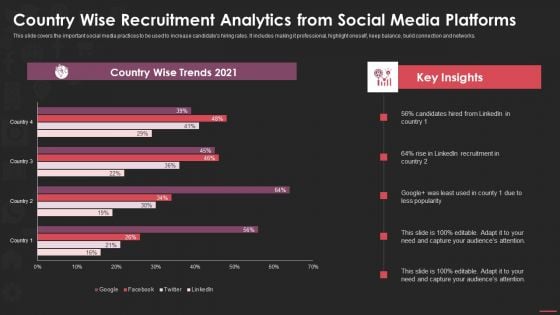
Country Wise Recruitment Analytics From Social Media Platforms Clipart PDF
This slide covers the important social media practices to be used to increase candidates hiring rates. It includes making it professional, highlight oneself, keep balance, build connection and networks. Showcasing this set of slides titled country wise recruitment analytics from social media platforms clipart pdf. The topics addressed in these templates are country wise recruitment analytics from social media platforms. All the content presented in this PPT design is completely editable. Download it and make adjustments in color, background, font etc. as per your unique business setting.

Hiring Managers On Social Media Presence For Recruitment Survey Brochure PDF
This slide illustrates the need for online presence to find suitable applicants. It includes a survey conducted to check that being socially active can help to meet the needs of candidate and hiring managers. Showcasing this set of slides titled hiring managers on social media presence for recruitment survey brochure pdf. The topics addressed in these templates are hiring managers on social media presence for recruitment survey. All the content presented in this PPT design is completely editable. Download it and make adjustments in color, background, font etc. as per your unique business setting.
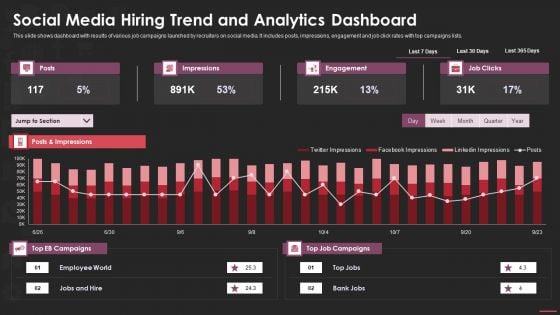
Social Media Hiring Trend And Analytics Dashboard Microsoft PDF
This slide shows dashboard with results of various job campaigns launched by recruiters on social media. It includes posts, impressions, engagement and job click rates with top campaigns lists. Pitch your topic with ease and precision using this social media hiring trend and analytics dashboard microsoft pdf. This layout presents information on social media hiring trend and analytics dashboard. It is also available for immediate download and adjustment. So, changes can be made in the color, design, graphics or any other component to create a unique layout.
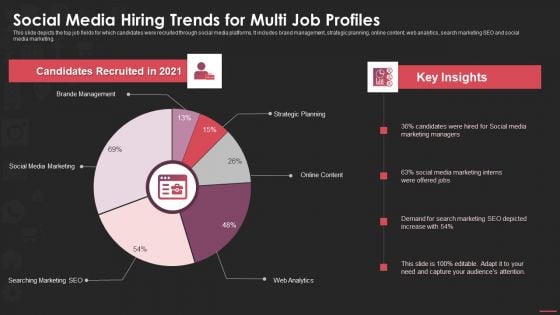
Social Media Hiring Trends For Multi Job Profiles Guidelines PDF
This slide depicts the top job fields for which candidates were recruited through social media platforms. It includes brand management, strategic planning, online content, web analytics, search marketing SEO and social media marketing. Showcasing this set of slides titled social media hiring trends for multi job profiles guidelines pdf. The topics addressed in these templates are social media, marketing, recruited. All the content presented in this PPT design is completely editable. Download it and make adjustments in color, background, font etc. as per your unique business setting.

Social Media Platforms Used By Recruitment Managers For Hiring Summary PDF
This slide depicts the various social networking sites for both jobs and job candidates. It includes Facebook, LinkedIn, Instagram , twitter and Google plus. Pitch your topic with ease and precision using this social media platforms used by recruitment managers for hiring summary pdf. This layout presents information on social media platforms used by recruitment managers for hiring. It is also available for immediate download and adjustment. So, changes can be made in the color, design, graphics or any other component to create a unique layout.
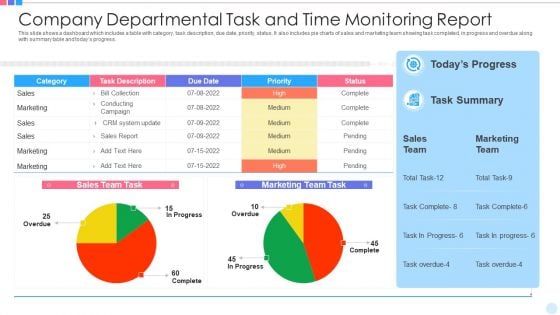
Company Departmental Task And Time Monitoring Report Clipart PDF
This slide shows a dashboard which includes a table with category, task description, due date, priority, status. It also includes pie charts of sales and marketing team showing task completed, in progress and overdue along with summary table and todays progress. Showcasing this set of slides titled company departmental task and time monitoring report clipart pdf. The topics addressed in these templates are system, sales, marketing. All the content presented in this PPT design is completely editable. Download it and make adjustments in color, background, font etc. as per your unique business setting.
Data Mining Dashboard Of Gender And Age Demographics Icons PDF
The following slide highlights the data profiling dashboard of gender and age demographics illustrating gender and age per month, gender and general age, average age per month and individual per age group to find the gender and age composition of area Showcasing this set of slides titled data mining dashboard of gender and age demographics icons pdf . The topics addressed in these templates are data mining dashboard of gender and age demographics . All the content presented in this PPT design is completely editable. Download it and make adjustments in color, background, font etc. as per your unique business setting.
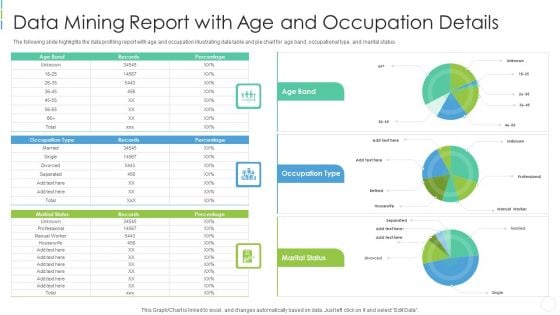
Data Mining Report With Age And Occupation Details Background PDF
The following slide highlights the data profiling report with age and occupation illustrating data table and pie chart for age band, occupational type, and marital status Showcasing this set of slides titled data mining report with age and occupation details background pdf . The topics addressed in these templates are data mining report with age and occupation details . All the content presented in this PPT design is completely editable. Download it and make adjustments in color, background, font etc. as per your unique business setting.
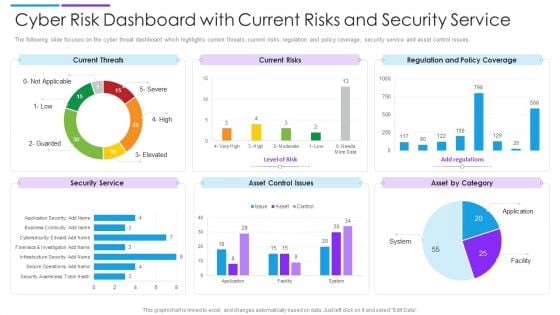
Cyber Risk Dashboard With Current Risks And Security Service Formats PDF
The following slide focuses on the cyber threat dashboard which highlights current threats, current risks, regulation and policy coverage, security service and asset control issues. Pitch your topic with ease and precision using this cyber risk dashboard with current risks and security service formats pdf. This layout presents information on current threats, current risks, regulation and policy coverage. It is also available for immediate download and adjustment. So, changes can be made in the color, design, graphics or any other component to create a unique layout.


 Continue with Email

 Home
Home


