Bank Presentation

Stock Photo 3d House With Sale Board PowerPoint Slide
Concept of sale in real-estate is well defined in this graphic image. To display this concept we have used graphic of 3d house with sale board. This image is designed for real-estate and marketing strategy related topics.
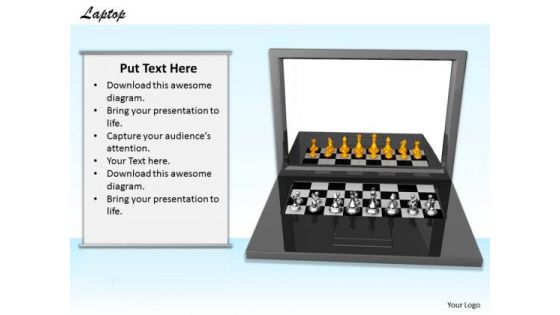
Stock Photo Laptop With Chess Pieces PowerPoint Slide
This image is professionally designed with graphics of laptop with chess pieces. Display concept of online games using this image. The same may also be used to describe the concept of technology. Cement your ideas in the minds of your listeners.
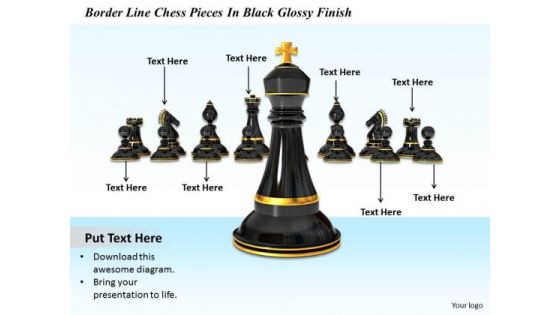
0814 Stock Photo Black Chess King Standing Ahead PowerPoint Slide
The above image designed with black king standing ahead. This image relates to concepts of game, strategy, ledaerhsip, win etc. Our ready backdrop leaves a lasting impression.

Stock Photo Chess King In Golden Color PowerPoint Slide
This image shows graphic of chess king. Our professional image will link your ideas into a chain of thought. Increase the strength of your overall concept. Audience also understands the concepts easily when you show clear picture of the topic.
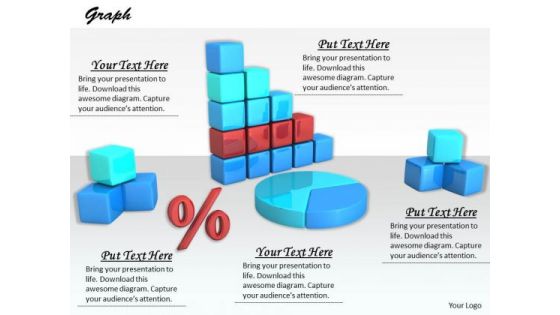
Stock Photo Graphics Of Business Reports And Charts PowerPoint Slide
The above slide displays an image of business charts and reports. Use this professionally designed image to make your message to be spread in a more effective manner. This can add up spice to corporate displays.

Stock Photo 3d White Chess Elephant PowerPoint Slide
The rook piece of chess game moves straight ahead, back, or side to side. It is a forceful piece

Stock Photo Glossy Black Chess Elephant PowerPoint Slide
The rook piece of chess game moves straight ahead, back, or side to side. It is a forceful piece

Stock Photo Black And White Football Game PowerPoint Slide
This quality image is designed with graphics of black and white football. This image can be used to show the various concepts like game, sports, team strategy etc. This image is best to communicate your ideas.
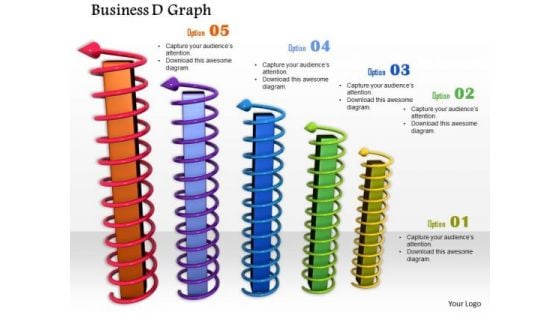
Stock Photo Twisted Arrows Around Bars PowerPoint Slide
This conceptual image displays graphics of bar graph. This image of bar graph can be used to show growth in sales or profit. Pass your ideas through this image slide in relation to profit growth.

Stock Photo 3d Sale Text With Upward Arrow PowerPoint Slide
You can illustrate your ideas and imprint them in the minds of your team with this image. It contains 3d sale word with upward arrow. You have some highly profitable plans. Display those plans with the use if this professional image graphics.

Stock Photo Arrow Jumping Over Hurdles PowerPoint Slide
You can illustrate your ideas and imprint them in the minds of your team with this image. It caintains image of arrow jumping over hurdles. This image is meant to depict hurdles, challenges, deadlines, competition and a contest.

Stock Photo 4 Colors And Golden Footballs Leadership PowerPoint Slide
This quality image is designed with graphics of colorful footballs. This image can be used to show the various concepts like game, sports, team strategy etc. This image is best to communicate your ideas.

Stock Photo Four Colors Footballs For Game PowerPoint Slide
This quality image is designed with graphics of footballs. This image can be used to show the various concepts like game, sports, team strategy etc. This image is best to communicate your ideas.
Stock Photo Red Arrow Moving Upwards In Stairs PowerPoint Slide
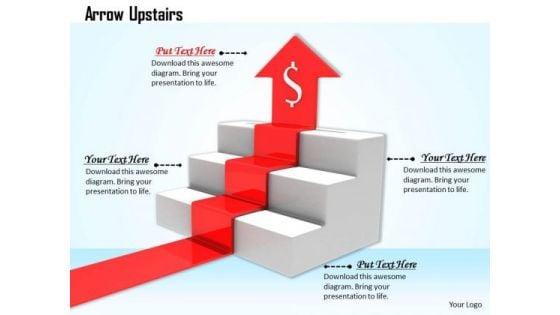
This image has been designed with red arrow moving upward on stairs with dollar symbol. This Image clearly relates to concept of financial growth. Use our image to drive the point to your audience and constantly attract their attention.

Stock Photo Maze With Arrows Jumping Over It PowerPoint Slide
This symbolic image displays maze graphics with arrow jumping over it. Use this amazing image to display concept of problem solving and solution. Ideas are best expressed with the help of this image.

Stock Photo Arrows Finding Way Through The Wall PowerPoint Slide
Two arrows with red and blue colors are used in this power point image template. These two arrows are crossing the wall which shows the success concept and wall is used as a hurdle in success path. Display success and hard work related concepts with the help of this image.
Stock Photo Blue Arrow Surpassing The Wall PowerPoint Slide
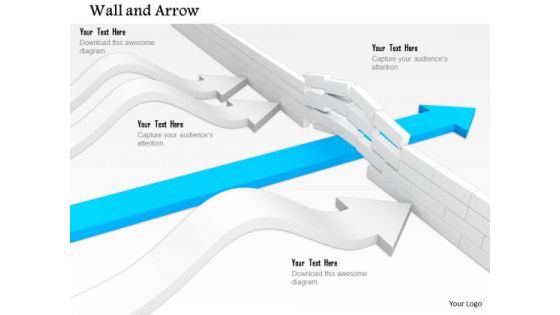
Blue colored arrow is used in this power point image template. This arrows is surpassing the concrete wall which shows the success concept and wall is used as a hurdle in success path. Display success and difficulty level in finding success with the help of this image.

Stock Photo Concept Of Target Achievement Pwerpoint Slide
Display the target achievement process with this power point image. This image contains the graphic of colorful target dart and arrow. Use this image for business target achievement concept and get good remarks from your viewers.
Stock Photo Graphics Of Target Achievement Pwerpoint Slide
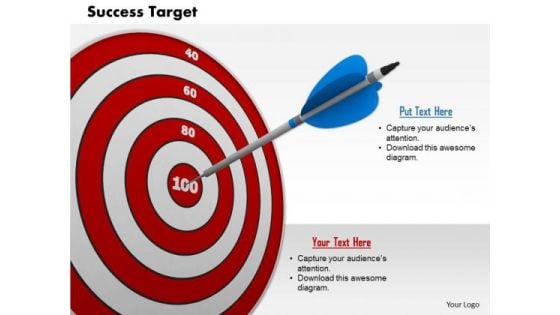
Display the target achievement process with this power point image. This image contains the graphic of black target dart and arrow. Use this image for business target achievement concept and get good remarks from your viewers.

Stock Photo Illustration Of Target Achievement Pwerpoint Slide
Illustrate target achievement process with this power point image. This image contains the 3d graphic of black target dart and arrow. Use this image for business target achievement concept and get good remarks from your viewers.

Business Framework Relating To The Identified Codes To The Six Elements Of Corporate Strategy Ppt Pr
Download this professional diagram to depict six elements of corporate strategy. Use this diagram for giving a clear message in a structured manner. This diagram is suitable for corporate and management related topics.

Stock Photo Usa Baseball Isolated On White Background PowerPoint Slide
Develop competitive advantage with this image which contains Baseball Bat with Flag of America. This image clearly defines the concepts of patriotism, baseballs, USA and sports. Special effects of this image will surely interest the audience.

Stock Photo Usa Flag And Basketball For Sports PowerPoint Slide
Develop competitive advantage with this image which contains USA Flag with basket ball. This image clearly defines the concepts of patriotism, basketball, USA and sports. Special effects of this image will surely interest the audience.

Business Framework The Commitment Trust Theory Of Online Relationship Marketing PowerPoint Presentat
This diagram displays framework for commitment trust theory of online relationship marketing. It contains diagram of partnerships depicting online supplier partnerships, online lateral partnerships, online internal partnerships and online buyer partnerships. Download this awesome diagram to capture your audiences attention.

Stock Photo Smartphone Shopping Cart Credit Card PowerPoint Slide
This image slide is designed with graphics of smart phone with credit card. This image depicts shopping through mobile apps. You may use this layout to display your content in an interesting, eye-catching manner.

Stock Photo Balloons Inside The Gift Box Fo Celebration PowerPoint Slide
Concept of celebration has been displayed in this power point template. This slide contains the graphic of balloons and gift box. Use this image slide to express your views on party and celebrations.

Stock Photo Dollar On Tablet For Financial Growth PowerPoint Slide
Graphic of dollar on tablet has been displayed in this image slide. This image contains the concept of financial growth. Use this editable design to depict financial transactions.
Stock Photo Groups Of People On Target PowerPoint Slide
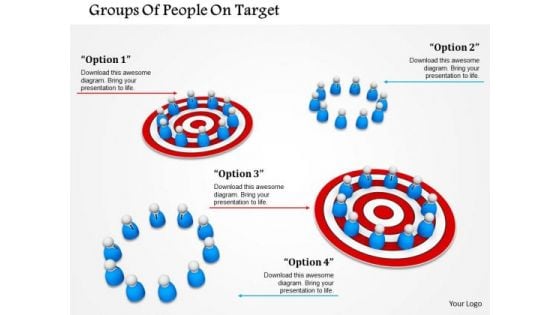
This image slide contains groups of people on target. Download this image to portray concepts like team targets and communication. Use this image to enhance the beauty of your words.
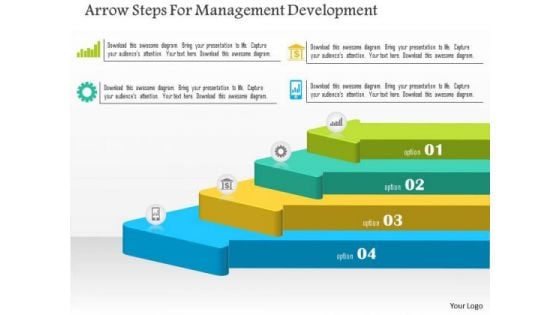
Arrow Steps For Management Development PowerPoint Template
This business diagram has been designed with four arrows with icons. It may use to display steps for management development. Prove the viability of your ideas to help your organization to achieve the quality and success required.
Circles With Icons For Communication PowerPoint Template
The above template displays a diagram of circles with icons. This diagram has been professionally designed to emphasize on concept of competitive strategy. Grab centre stage with this slide. Capture the attention of your audience.
Icons For Cloud Computing PowerPoint Template
Develop competitive advantage with our above template which contains a diagram of cloud network. This diagram may used to depict concepts like cloud computing and technology. This slide provides an effective way of displaying information.
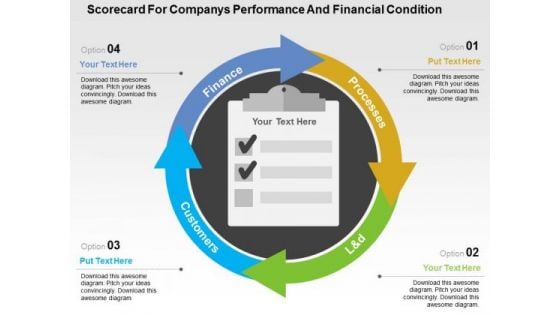
Scorecard For Companys Performance And Financial Condition PowerPoint Templates
Use this PPT slide to display companies performance financial planning. This slide contains graphics of circular scorecard. Trigger the imagination of your audience with this professional diagram.
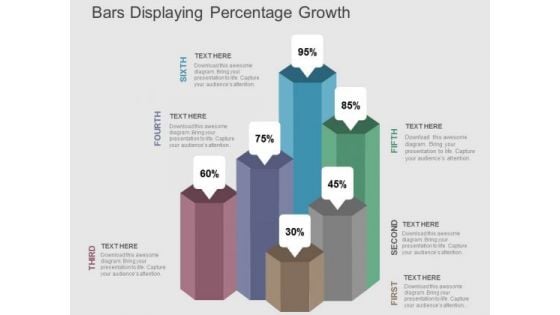
Bars Displaying Percentage Growth PowerPoint Templates
Our above PPT slide contains bar graph displaying percentage growth. This diagram of bar graph helps to depict statistical information. Use this diagram to impart more clarity to data and to create more sound impact on viewers.
Linear Infographic For Business Management PowerPoint Template
Graphic of tags in linear flow has been used to design this business diagram. This diagram slide may be used to depict business steps in linear flow. Download this diagram for business research and analysis.
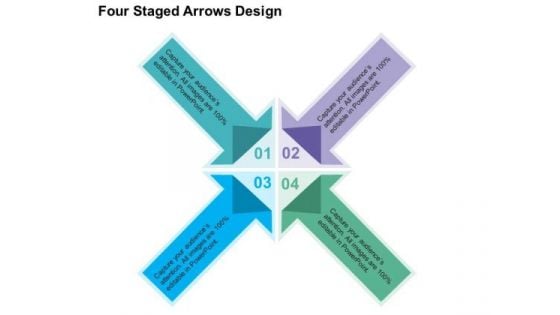
Four Staged Arrows Design PowerPoint Templates
This PowerPoint template has been designed with arrows infographic. You can easily impart your information with help of this PowerPoint template. The slide can be customized as per requirements of business education or any other theme.
Four Pencils Bar Graph And Icons Powerpoint Template
Develop competitive advantage with our above template which contains a diagram of five pencils bar graph. This diagram provides an effective way of displaying business information. You can edit text, color, shade and style as per you need.
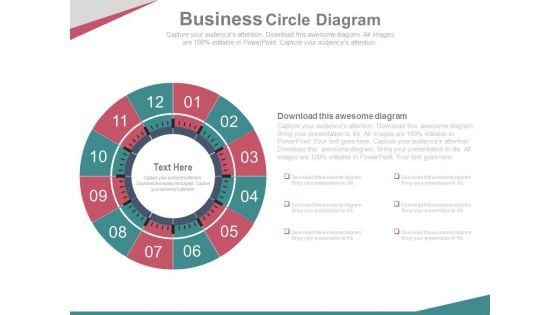
Circular Steps For Market Entry Strategy Powerpoint Slides
This PowerPoint template contains graphics of circular steps. You may download this PPT slide design to display market entry strategy. You can easily customize this template to make it more unique as per your need.
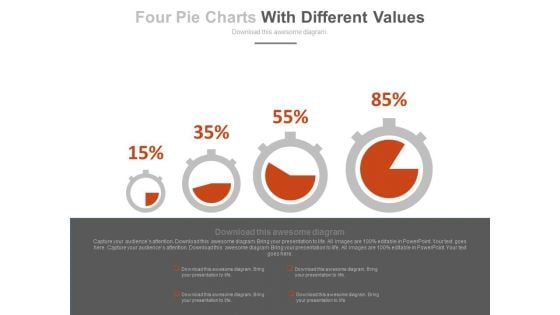
Dashboard With Increasing Values Powerpoint Slides
This innovative, stunningly beautiful dashboard has been designed for data visualization. It contains pie charts with increasing percentage values. This PowerPoint template helps to display your information in a useful, simple and uncluttered way.
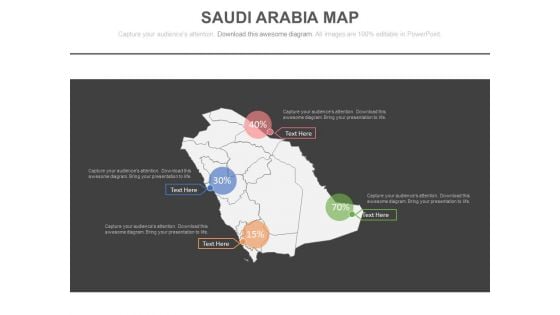
Saudi Arabia Map For Financial Strategy Analysis Powerpoint Slides
This PowerPoint template has been designed with Saudi Arabia Map. You may use this slide to display financial strategy analysis. This diagram provides an effective way of displaying information you can edit text, color, shade and style as per you need.
Saudi Arabia Map With Percentage Values And Icons Powerpoint Slides
This PowerPoint template has been designed with Saudi Arabia Map with percentage values and icons. You may use this slide to display financial strategy analysis. This diagram provides an effective way of displaying information you can edit text, color, shade and style as per you need.
Checklist With Financial Planning Icons Powerpoint Slides
This PowerPoint template contains business checklist with icons. Download this diagram slide to display financial planning and analysis. Etch your views in the brains of your audience with this diagram slide.

Circle Chart With Percentage Value Analysis Powerpoint Slides
This PowerPoint template has been designed with circular process diagram. This business diagram helps to exhibit financial process control and analysis. Use this diagram to visually support your content.
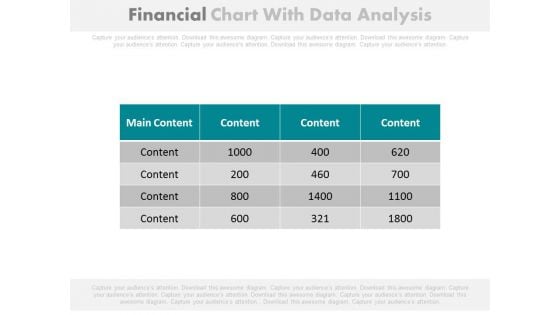
Financial Figures Data Analysis Report Powerpoint Slides
Our above PowerPoint template contains table chart with financial figures. This professional slide may be used to display data analysis report. Enlighten your audience with your breathtaking ideas.
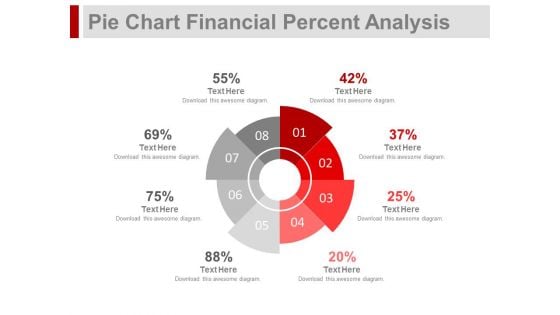
Pie Chart For Financial Ratio Analysis Powerpoint Slides
This PPT slide contains graphics of eight stage pie chart. Download this PowerPoint template slide for financial ratio analysis. This diagram is editable you can edit text, color, shade and style as per you need.
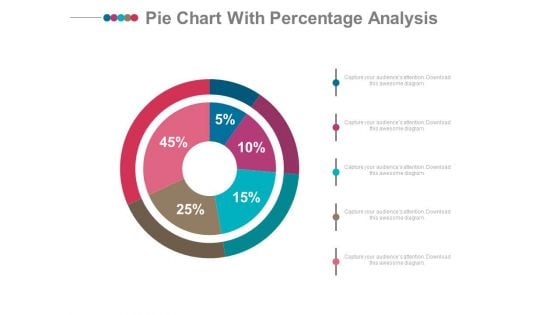
Pie Chart With Financial Data Comparison Powerpoint Slides
Emphatically define your message with our above template which contains graphics of pie chart. This PowerPoint template may be used to display financial data comparison. Grab the attention of your listeners with this slide.
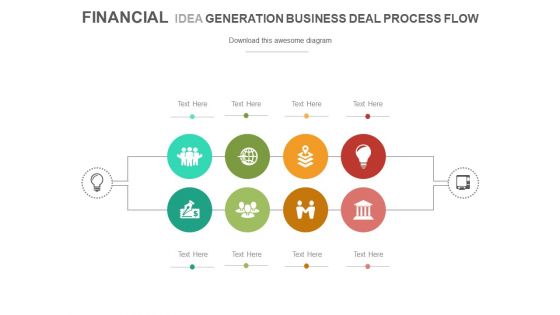
Process Flow Diagram With Business Icons Powerpoint Slides
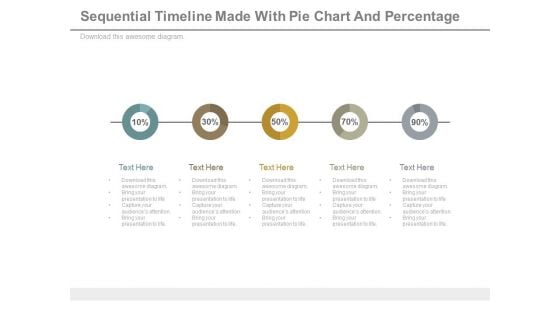
Sequential Timeline Diagram With Percentage Values Powerpoint Slides
This diagram contains graphics of linear circles timeline diagram. Download this diagram slide to display business planning and management. This diagram is editable you can edit text, color, shade and style as per you need.
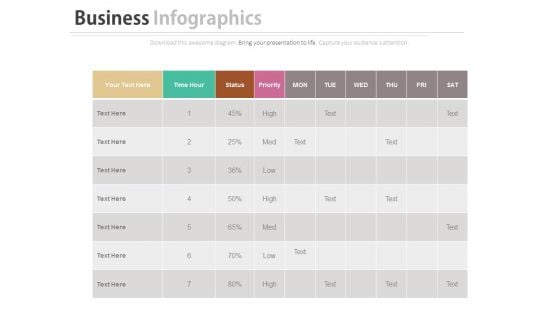
Work Sheet For Daily Activity Plan Schedule Powerpoint Slides
Our above business slide contains graphics of daily worksheet. This PowerPoint slide may be used to exhibit activity plan and schedule. Capture the attention of your audience with this slide.
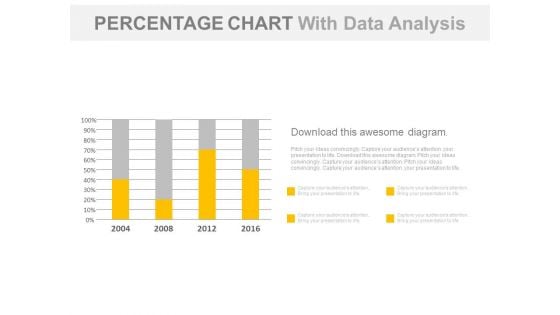
Year Based Chart With Percentage Data Analysis Powerpoint Slides
Our above business slide contains year based statistical chart. This PowerPoint template can be used to display percentage data analysis. Capture the attention of your audience with this slide.
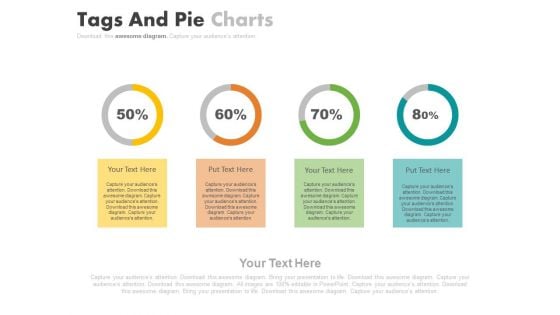
Four Steps For Financial Data Analysis Powerpoint Slides
This PowerPoint contains four circles with percentage values. Download this diagram slide to display financial data analysis. This template is editable, You can edit text, color, shade and style of this diagram as per you need.
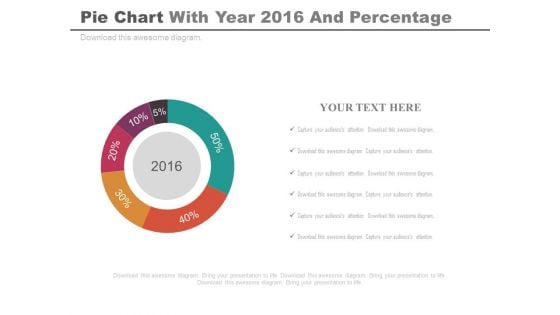
Pie Chart For Projected Profit Of 2016 Powerpoint Slides
Our above PPT slide displays graphics of Pie chart. This PowerPoint template may be used to display projected profit report of 2016. Download this template to leave permanent impression on your audience.
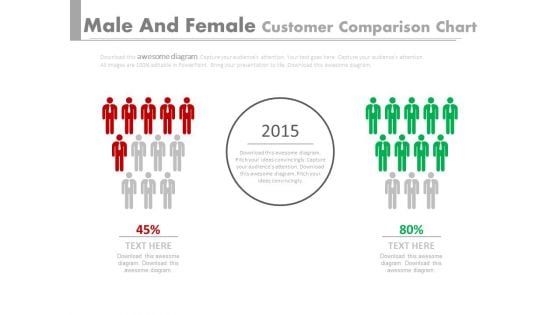
Red Green Teams Comparison Chart Powerpoint Slides
This PPT slide displays graphics of two red and green teams. Use this PPT design to display comparison of teams performances. This PowerPoint template can be customized as per requirements of business education or any other theme.
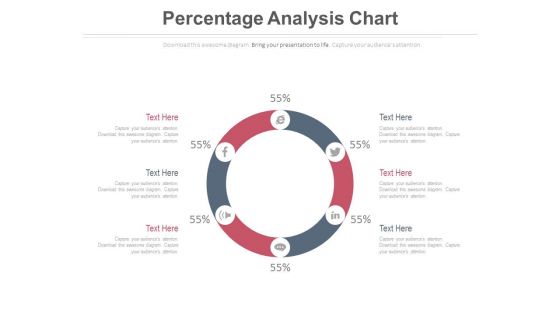
Circular Diagram For Percentage Analysis Powerpoint Slides
This PowerPoint slide has been designed with circular diagram with social media icons. This diagram slide may be used to display users of social media. Prove the viability of your ideas with this professional slide.
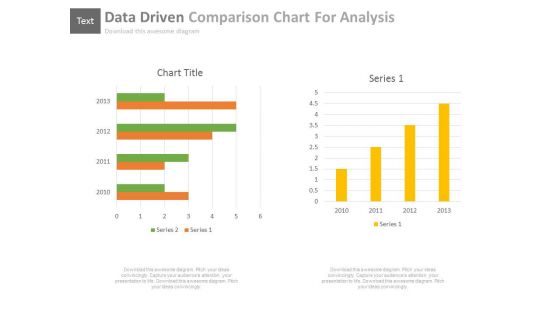
Data Driven Comparison Charts For Analysis Powerpoint Slides
You can download this PowerPoint template to display statistical data and analysis. This PPT slide contains data driven comparison charts. Draw an innovative business idea using this professional diagram.
Four Banners With Icons For Financial Planning Powerpoint Slides
The above PowerPoint template displays graphics of four text banners with icons. This diagram has been professionally designed to display steps of financial planning. Capture the attention of your audience.
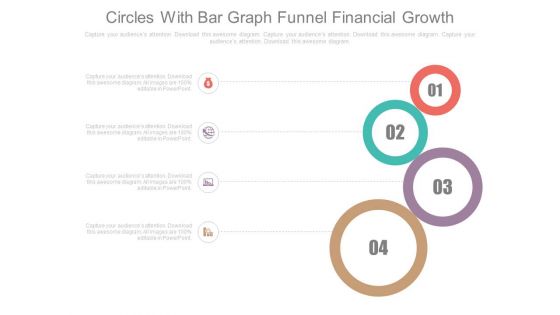
Four Circles Chart Financial Growth Steps Powerpoint Slides
Our professionally designed business diagram is as an effective tool for communicating cyclic processes. It contains circular graphics with icons. Above slide is suitable to display process management steps.
Four Clouds With Arrows And Icons Powerpoint Slides
This business slide displays diagram of four clouds with arrow and icons. Download this PowerPoint diagram to display technology development and management. Enlighten your audience with your breathtaking ideas.
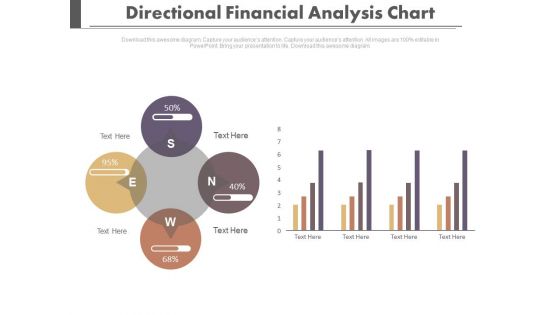
Four Directions Circular Analysis Chart Powerpoint Slides
Our professionally designed business diagram is as an effective tool for communicating business strategy. It contains four directional circular charts. Above slide is also suitable to display financial planning and strategy.
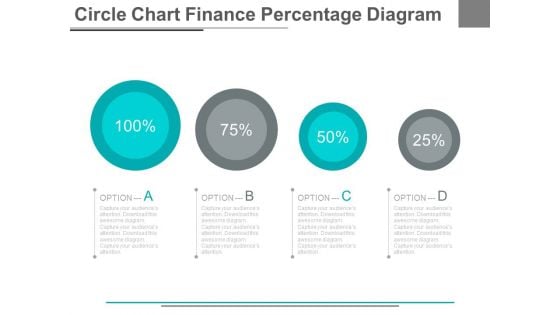
Four Options Circle Chart With Percentage Powerpoint Slides
This PowerPoint template has been designed with graphics of four options circle chart. This PowerPoint template may be used to display four steps of financial analysis. Prove the viability of your ideas using this impressive slide.
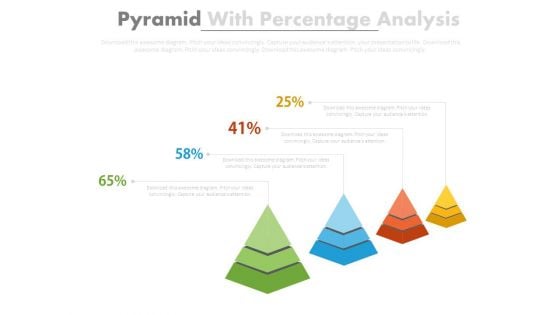
Four Pyramids With Growth Steps Powerpoint Slides
This business slide has been designed with four pyramids. This PowerPoint template may use to display sales growth and analysis. Prove the viability of your ideas using this impressive slide.


 Continue with Email

 Home
Home


