Banking Challenges
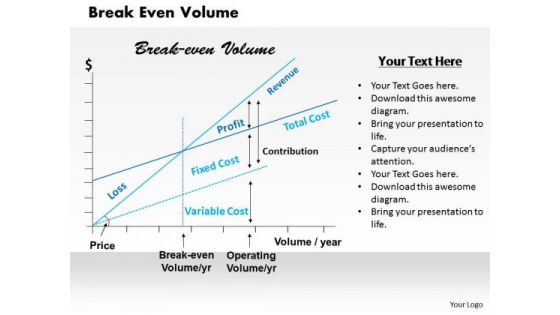
Break Even Volume Business PowerPoint Presentation
Our Break Even Volume Business Powerpoint Presentation Powerpoint Templates Deliver At Your Doorstep. Let Them In For A Wonderful Experience.
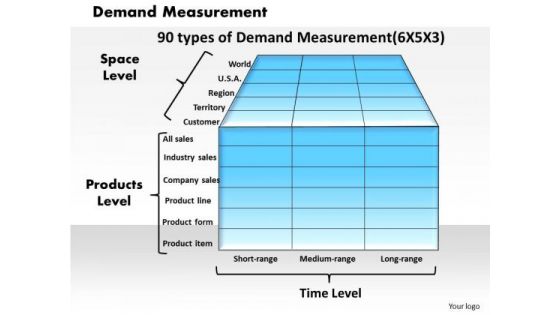
Demand Measurement Business PowerPoint Presentation
Touch Base With Our Demand Measurement Business Powerpoint Presentation Powerpoint Templates. Review Your Growth With Your Audience.
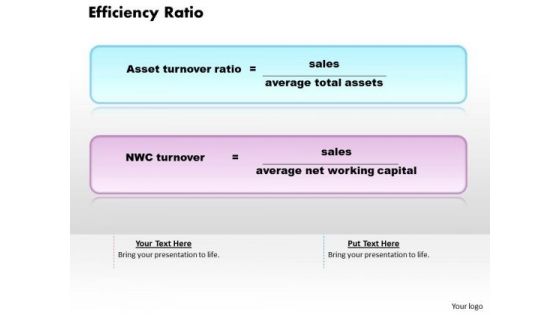
Efficiency Ratio Business PowerPoint Presentation
Reduce The Drag With Our Efficiency Ratio Business Powerpoint Presentation Powerpoint Templates. Give More Lift To Your Thoughts.
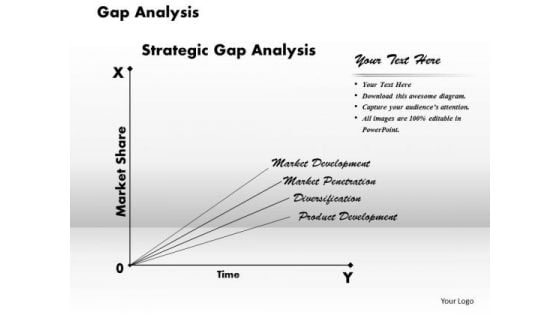
Gap Analysis Business PowerPoint Presentation
Dreams Generate Thoughts, Thoughts Generate Ideas. Give Them Life With Our Gap Analysis Business Powerpoint Presentation Powerpoint Templates.
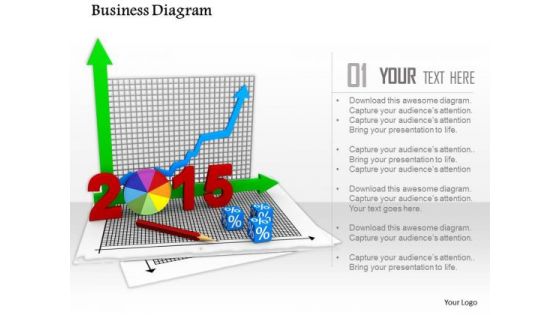
0814 Business Diagram For Planning Image Graphics For PowerPoint
Define the concepts of planning with this unique image. This image of charts and graphs depicts planning for year 2015. In this image pie chart and bar graph is displayed with year 2015. Use this image in business, marketing and sales related presentations.
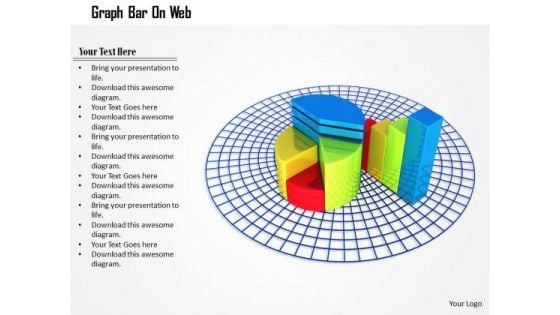
Stock Photo Pie Chart And Bar Graph On Web PowerPoint Slide
This image is designed with pie chart and bar graph on web. Use this diagram to explain your strategy to co-ordinate activities. Deliver amazing presentations to mesmerize your audience.
Stock Photo Black Brown Pie Chart For Business Result PowerPoint Slide
This high quality image is designed with pie chart. Use this image to make business reports. Use this outstanding image in presentations relating to data analysis and reports. Go ahead and add charm to your presentations.
Stock Photo Colorful 3d Pie Chart For Business Result PowerPoint Slide
This high quality image is designed with pie chart. Use this image to make business reports. Use this outstanding image in presentations relating to data analysis and reports. Go ahead and add charm to your presentations.
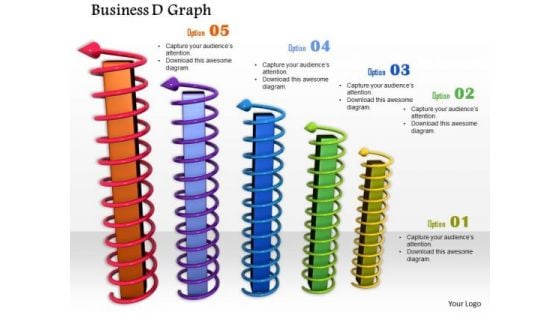
Stock Photo Twisted Arrows Around Bars PowerPoint Slide
This conceptual image displays graphics of bar graph. This image of bar graph can be used to show growth in sales or profit. Pass your ideas through this image slide in relation to profit growth.
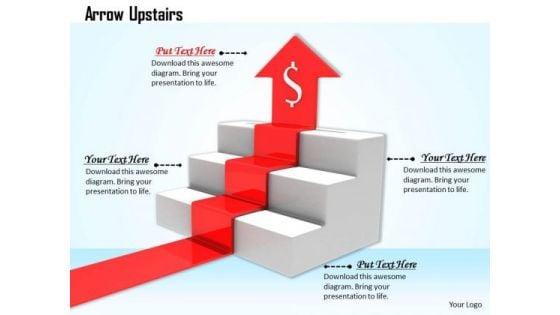
Stock Photo Red Arrow Moving Upwards In Stairs PowerPoint Slide
This image has been designed with red arrow moving upward on stairs with dollar symbol. This Image clearly relates to concept of financial growth. Use our image to drive the point to your audience and constantly attract their attention.
Consulting Slides Business Chart With Icons Business Presentation
This PPT diagram is a simple template that provides a graphical, time-phased overview of a continuing sequence of stages, tasks. This is an effective way of displaying information you can edit text, color, shade and style as per you need.

Stock Photo Video Marketing Text On Blue Key PowerPoint Slide
This image slide displays blue color video marketing key with video camera icon. This image slide has been designed with graphic of computer keyboard with video marketing key. Use this image slide in technology, marketing, sales and business. This image slide make your presentations outshine.

Stock Photo Work Text With Alarm Clock PowerPoint Slide
This image slide displays work text with clock. This innovative image slide has been crafted with graphic of red color work text with clock instead of o word. Use this image slide, in your presentations to express the importance of time at work. This image slide may also be used to depict work timings in presentations. This image slide will enhance the quality of your presentations.
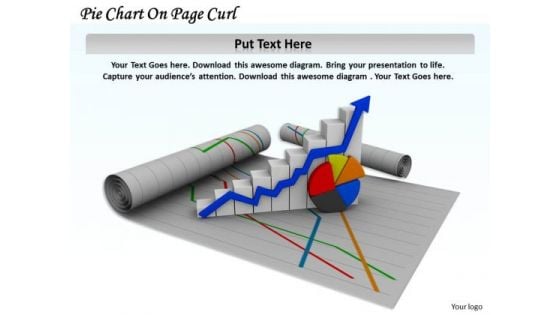
Stock Photo Pie Chart On Page Curl Arrow PowerPoint Slide
This image slide displays pie chart and growth bar graph on page curl. Use this image slide, in your presentations to express views on progress, growth and achievements. This image slide may also be used to depict strategic business planning. Make professional presentations using this image slide.
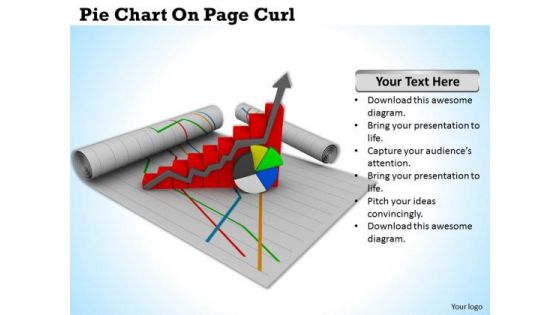
Stock Photo Pie Chart On Page Curl PowerPoint Slide
This image slide displays pie chart and growth bar graph on page curl on blue shaded background. Use this image slide, in your presentations to express views on progress, growth and achievements. This image slide may also be used to depict strategic business planning. Make professional presentations using this image slide.
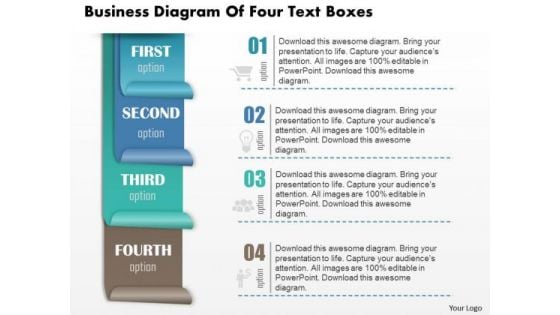
Business Diagram Of Four Text Boxes Presentation Template
We present you the image slide of business consulting diagram of four colorful text boxes. This image slide depicts processes. Use this PowerPoint template, in your presentations to express views on planning, management, achievements, targets etc. This image slide will make your presentations colorful.
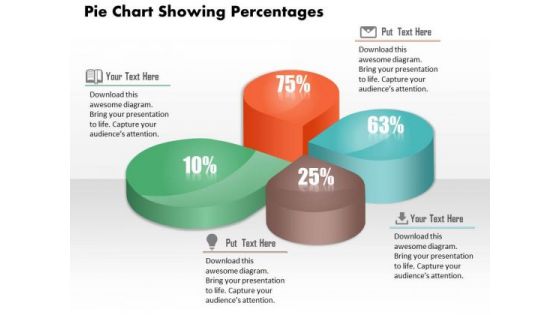
Business Diagram Pie Chart Showing Percentages Presentation Template
This image slide displays business consulting diagram of pie chart showing percentage. Pie Charts can be used to display a wide variety of information. When data is represented in the form of a pie chart the human eye finds it very easy to compare the data and quickly draw conclusions. In short they are a great visual aid and will add a touch of professionalism to any presentation which requires the display of data.
Business Diagram Rectangle Showing Four Steps With Icons Presentation Template
This image slide displays 3d colorful graphic of rectangle showing four steps. This image slide has been made with 3d graphic of rectangle with envelope shape on all sides with symbols in center. Use this PowerPoint template, in your presentations to express views on growth, target, management and planning in any business. All text and graphic are editable in this image slide. This image slide will make your presentations colorful.
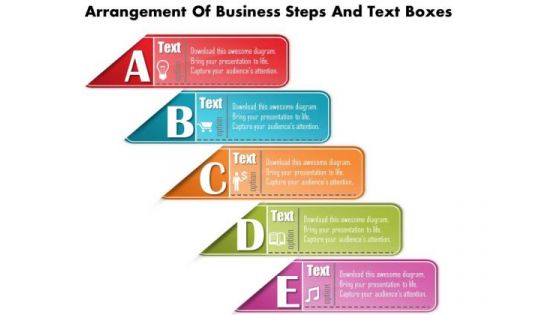
Business Diagram Arrangement Of Business Steps And Text Boxes Presentation Template
This image slide displays business consulting diagram of arrangement of business steps and textboxes. In this slide, there is graphic of alphabetic colorful textboxes with different icons in steps. This image slide depicts planning. Use this PowerPoint template, in your presentations to express growth, teamwork and planning in business. This image slide will make your presentations attractive.
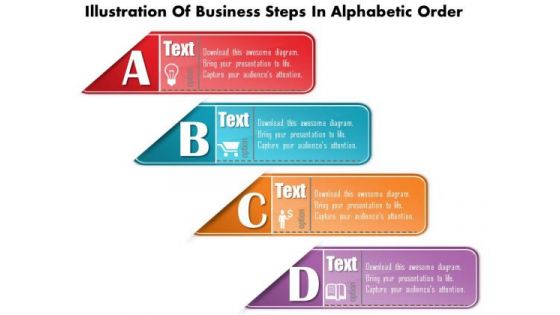
Business Diagram Illustration Of Business Steps In Alphabetic Order Presentation Template
This image slide displays business consulting diagram illustration of business steps in alphabetic order. This image slide depicts stepwise process. Use this PowerPoint template, in your presentations to express views on various business activities. This image slide will make your presentations colorful.
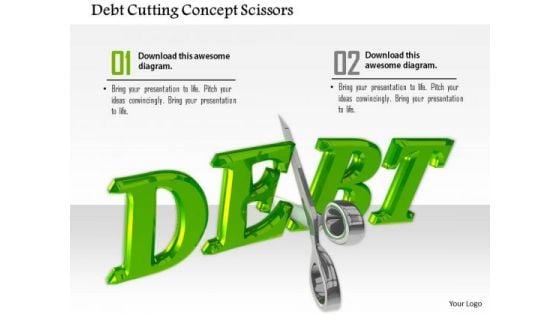
Stock Photo Debt Cutting Concept Scissors PowerPoint Slide
This image slide is designed with scissors cutting the debt word. This image contains the graphic debt cutting scissors depicting how to reduce your debt. This image is suitable for business and marketing related presentations.
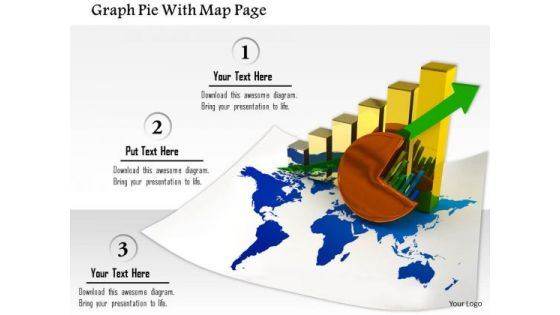
Stock Photo Graph Pie With Map Page PowerPoint Slide
This image slide contains business charts on world map. This image is designed with bar graph and pie chart on world map depicting global economy. Use this image slide to represent financial growth in any business presentation.
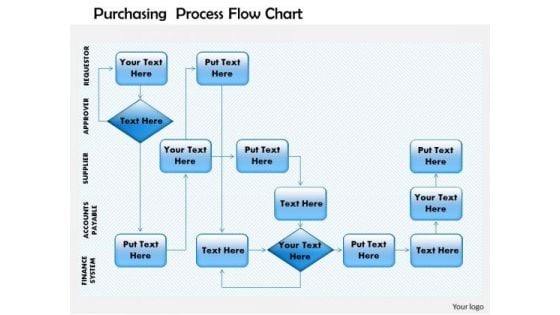
Business Framework Purchasing Process Flow Chart PowerPoint Presentation
This diagram displays project management matrix. Use this diagram in business and marketing presentations. This diagram will enhance the quality of your presentations.
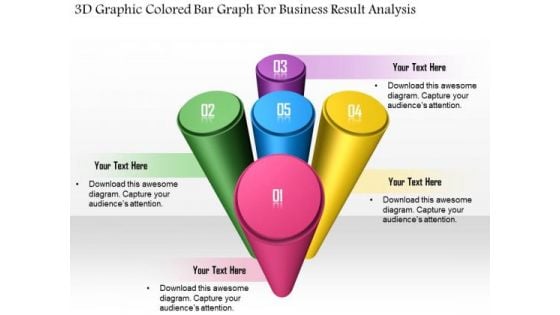
Business Diagram 3d Graphic Colored Bar Graph For Business Result Analysis Presentation Template
This Power Point template has been designed with graphic of 3d graphic and colored bar graph. Use this slide to represent six steps of any business process. Use this diagram for your business presentations and get exclusive comments on your efforts.
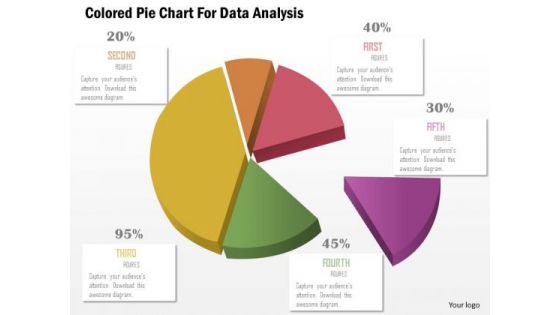
Business Diagram Colored Pie Chart For Data Analysis Presentation Template
This business slide displays pie chart. This diagram is a data visualization tool that gives you a simple way to present statistical information. This slide helps your audience examine and interpret the data you present.
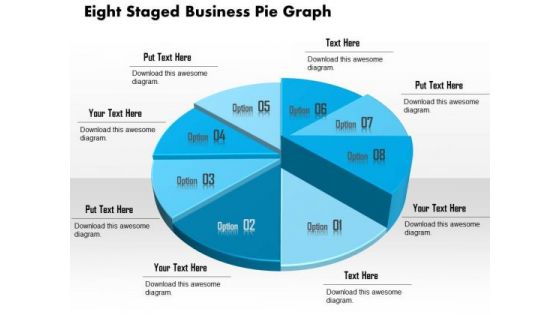
Business Diagram Eight Staged Business Pie Graph Presentation Template
This business slide displays eight staged pie chart. This diagram is a data visualization tool that gives you a simple way to present statistical information. This slide helps your audience examine and interpret the data you present.
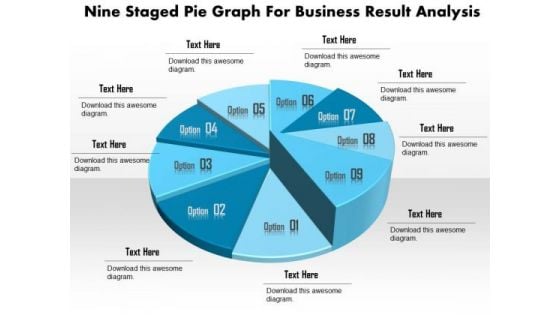
Business Diagram Nine Staged Pie Graph For Business Result Analysis Presentation Template
This business slide displays nine staged pie chart. This diagram is a data visualization tool that gives you a simple way to present statistical information. This slide helps your audience examine and interpret the data you present.
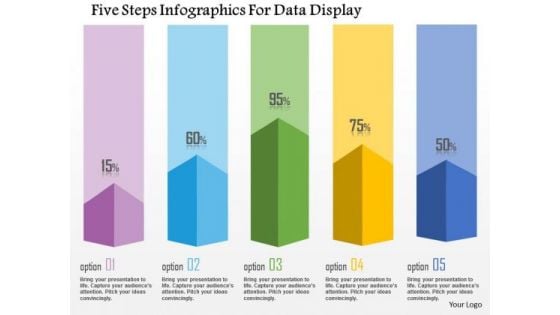
Business Diagram Five Steps Infographics For Data Display Presentation Template
This business diagram has been designed with graphic of five staged info graphics. This diagram can be used to display statistical information. Use this bar graph for your business and sales related presentations.
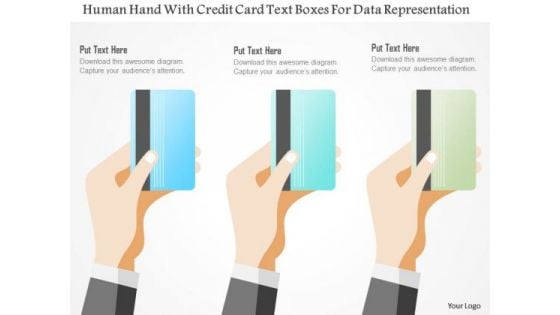
Business Diagram Human Hand With Credit Card Text Boxes For Data Representation Ppt Template
This power point template has been crafted with graphic of human hand and credit card style text boxes. his PPT diagram contains the concept of data representation. This PPT is suitable for your business and marketing presentations.

Business Diagram Thermometer Graphics Indicating Progress Presentation Template
This power point template diagram has been designed with graphic of thermometer and bar graph. This PPT contains the concept of growth analysis. Use this PPT for business and marketing related presentations.
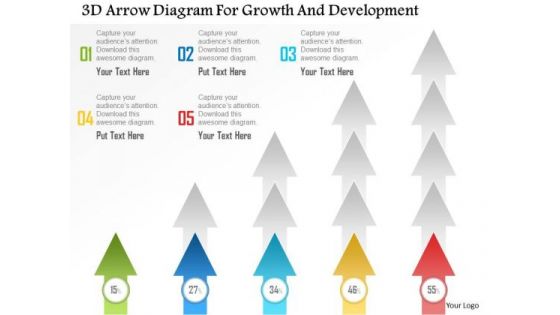
Business Diagram 3d Arrow Diagram For Growth And Development Presentation Template
This power point template diagram has been designed with graphic of 3d arrow. This PPt contains the concept of growth and development. Use this PPT for business and marketing related presentations.
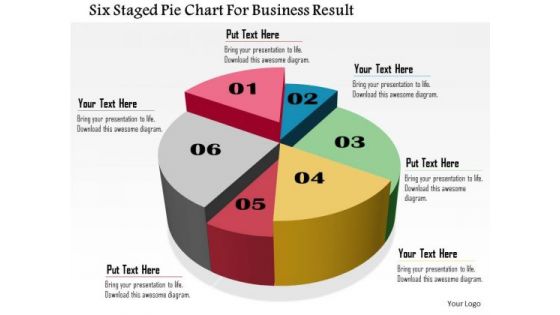
Business Daigram Six Staged Pie Chart For Business Result Presentation Templets
Six staged pie chart is used to design this business slide. Download this diagram to make business and financial reports. Use our above diagram to express information in a visual way.
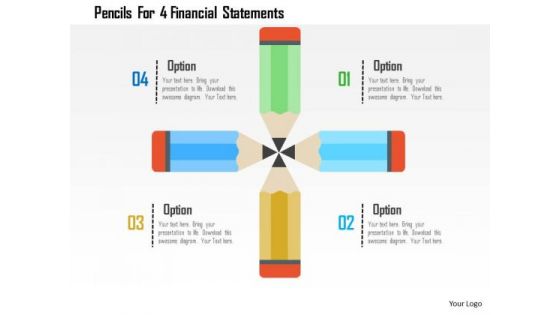
Business Diagram Pencils For 4 Financial Statements Presentation Template
Emphatically define your message with this slide which contains a graphic of pencils. Above image may be used to display four financial statements. Use this slide to build exclusive presentations for your viewers.
Business Diagram Pie Chart With Icons For Financial Analysis Presentation Template
This professional business diagram slide has been designed with pie chart and icons. It contains concept of financial analysis. Use this slide to build exclusive presentations for your viewers.
Business Diagram Tabs With Business Icons For Planning Presentation Template
Our above slide displays tabs with business icons. It helps to depict workflow or a process. Download our above diagram to express information in a visual way.
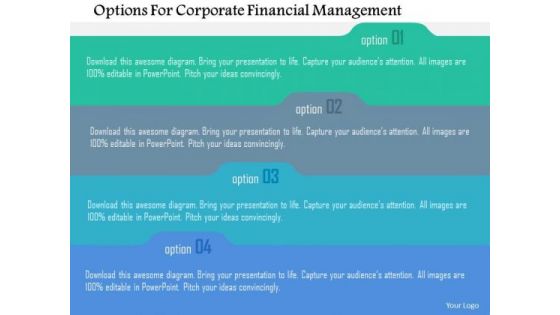
Business Diagram Options For Corporate Financial Management Presentation Template
This diagram contains list of four options. Download this diagram slide to display corporate financial management. This diagram provides an effective way of displaying information you can edit text, color, shade and style as per you need.
Business Diagram Six Icons For Communication Presentation Template
Our above business diagram has been designed with six business icons. You may present market analysis using this diagram. Pressure cooks your views with this diagram. You will hear whistles of appreciation.
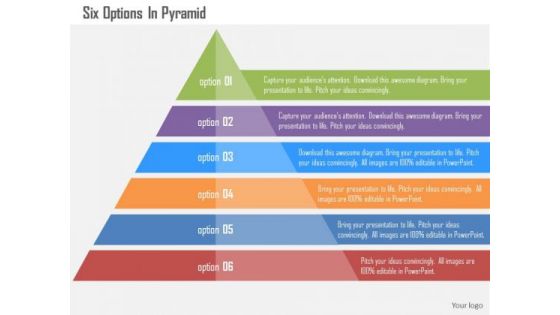
Business Diagram Six Options In Pyramid Presentation Template
Sales process can be explained with this pyramid diagram. This diagram contains the graphic of pyramid chart with six options. This diagram provides an effective way of displaying information.
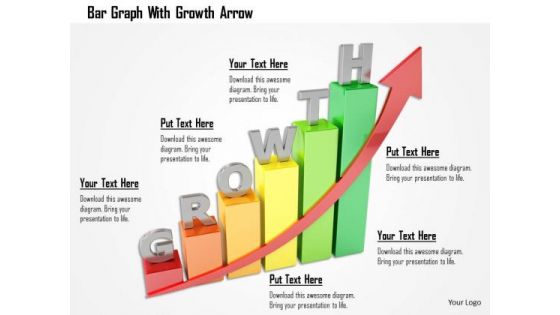
Stock Photo Bar Graph With Growth Arrow PowerPoint Slide
This creative image displays design of Bar Graph with Growth Arrow. This image has been designed to depict business on an Upward Trend. Create an impact with this quality image and make professional presentations.
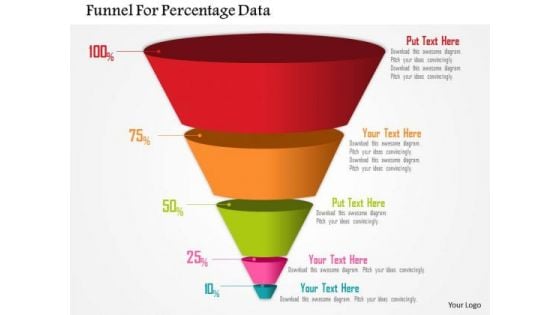
Business Diagram Funnel For Percentage Data Presentation Template
Four staged funnel diagram has been used to design this power point template. This diagram contains the concept of filtration. Present your views and ideas with this impressive image.
Business Diagram Icons For Good Marketing Strategy Presentation Template
This power point template has been designed with graphic of bar graph, suitcase and meeting business icons. These business icons are used to display the concept of business result analysis and meeting. Use this diagram for business related topics in any presentations.
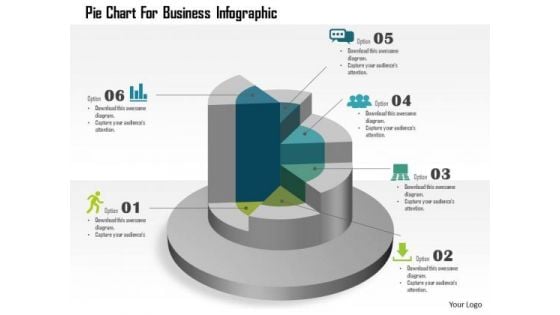
Business Diagram Pie Chart For Business Infographic Presentation Template
This template displays pie chart business infographic. You may download this business slide for result analysis. Amplify your thoughts via this appropriate business template.
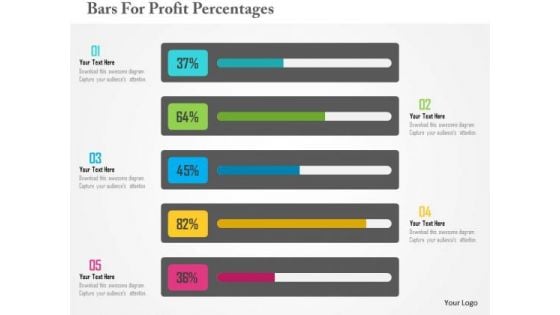
Business Diagram Bars For Profit Percentages Presentation Template
Download this exclusive business diagram to present profit in percentage ratio. This slide contains the graphic of bars. This diagram can be useful for business presentations.
Business Diagram Icons Around Pie Chart Presentation Template
Strategy and planning can be displayed with this business diagram. This slide contains the graphic of icons around pie chart Use this editable slide to build quality presentation for your viewers.
Business Diagram Icons And Charts For Business Growth Presentation Template
Our above slide contains graphics of business charts and icons. It helps to display business reports and analysis. Use this diagram to impart more clarity to data and to create more sound impact on viewers.
Business Diagram Matrix Chart For Financial Review Presentation Template
Our above business diagram has been designed with graphics of matrix chart. This slide is suitable to present financial review. Use this business diagram to present your work in a more smart and precise manner.
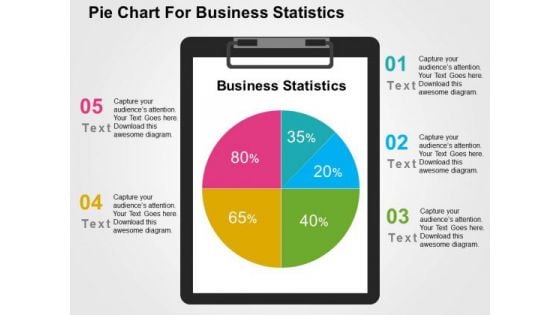
Pie Chart For Business Statistics PowerPoint Template
Visually support your presentation with our above template showing pie chart. This slide has been professionally designed to present business statistics. This template offers an excellent background to build impressive presentation.

Four Steps For Interpretation Of Financial Data PowerPoint Templates
Our PPT above slide displays graphics of four text boxes with icons. This template may be used to depict interpretation of financial data. You can present your opinions using this impressive slide.
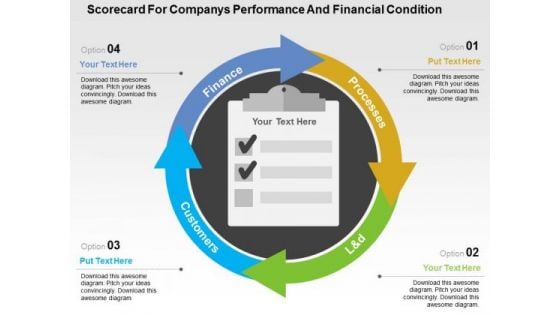
Scorecard For Companys Performance And Financial Condition PowerPoint Templates
Use this PPT slide to display companies performance financial planning. This slide contains graphics of circular scorecard. Trigger the imagination of your audience with this professional diagram.
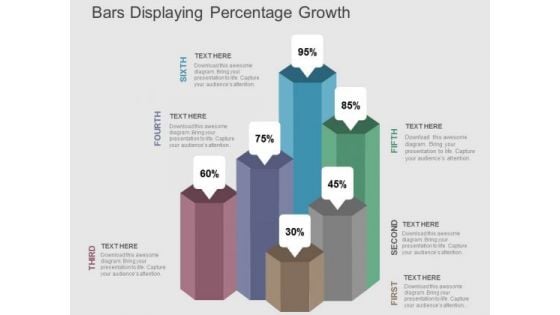
Bars Displaying Percentage Growth PowerPoint Templates
Our above PPT slide contains bar graph displaying percentage growth. This diagram of bar graph helps to depict statistical information. Use this diagram to impart more clarity to data and to create more sound impact on viewers.
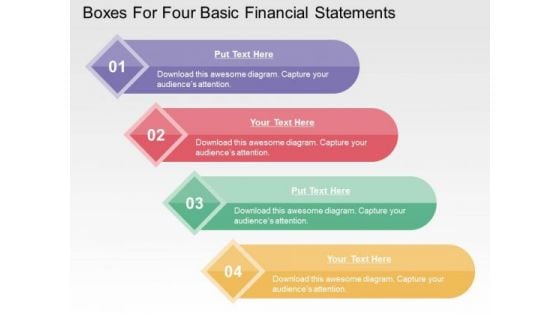
Boxes For Four Basic Financial Statements PowerPoint Templates
This business slide contains graphics of four text boxes. This diagram is suitable to present four basic financial statements. Visual effect of this diagram helps in maintaining the flow of the discussion and provides more clarity to the subject.
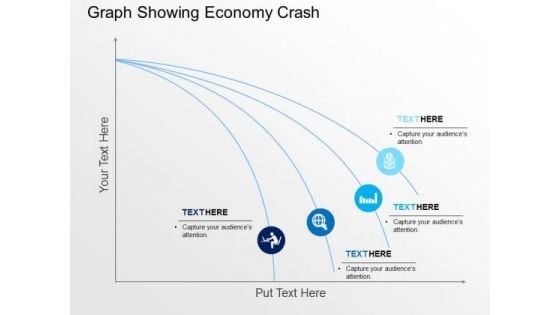
Graph Showing Economy Crash PowerPoint Templates
This business slide contains design of graph. This diagram is suitable to present downfall and economy crash. Visual effect of this diagram helps in maintaining the flow of the discussion and provides more clarity to the subject.
Hexagons With Business Icons PowerPoint Templates
This PowerPoint slide contains hexagons with business icons. This diagram is designed to make impressive presentations on various business processes. This professional slide helps in making an instant impact on viewers.
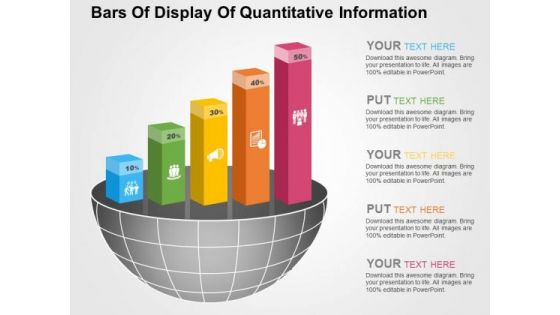
Bars Of Display Of Quantitative Information PowerPoint Templates
Visually support your presentation with our above template illustrating quantitative information. It contains graphics of bars. Etch your views in the brains of your audience with this diagram slide.
Steps For Setting Up Your Business Powerpoint Template
Our compelling template consists with diagram of text boxes. This slide has been professionally designed to display text information. This template offers an excellent background to build impressive presentation.
Bar Graph With Financial Ratio And Icons Powerpoint Template
Visually support your presentation with our above template containing bar graph with icons. This diagram slide helps to exhibit financial ratio analysis. Etch your views in the brains of your audience with this diagram slide.
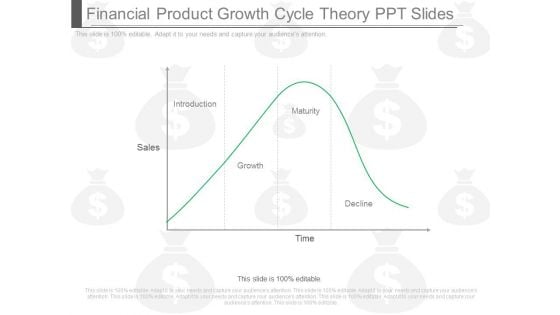
Financial Product Growth Cycle Theory Ppt Slides
This is a financial product growth cycle theory ppt slides. This is a one stage process. The stages in this process are sales, introduction, maturity, growth, decline, time.
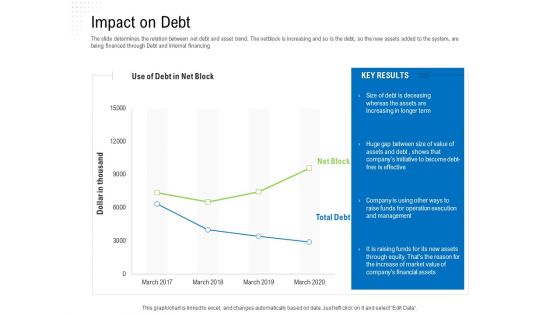
Revaluate Capital Structure Resolution Impact On Debt Clipart PDF
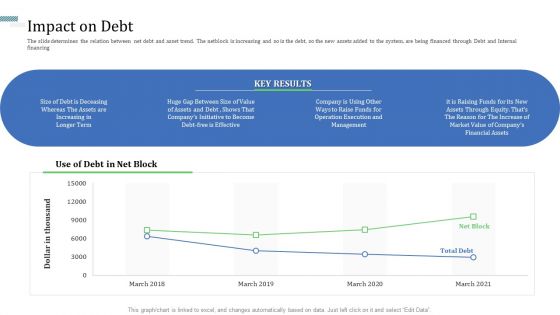
The slide determines the relation between net debt and asset trend. The netblock is increasing and so is the debt, so the new assets added to the system, are being financed through Debt and Internal financing. Deliver an awe inspiring pitch with this creative revaluate capital structure resolution impact on debt clipart pdf. bundle. Topics like dollar thousand, increasing, management, market, 2017 to 2020 can be discussed with this completely editable template. It is available for immediate download depending on the needs and requirements of the user.
Identify Capital Structure Of Firm Impact On Debt Topics PDF
The slide determines the relation between net debt and asset trend. The netblock is increasing and so is the debt, so the new assets added to the system, are being financed through Debt and Internal financing Deliver and pitch your topic in the best possible manner with this identify capital structure of firm impact on debt topics pdf. Use them to share invaluable insights on increasing in longer term, operation execution and management, 2018 to 2021 and impress your audience. This template can be altered and modified as per your expectations. So, grab it now.
Responsibility Project Management Office Team Support Digital Company Major Issues Download PDF
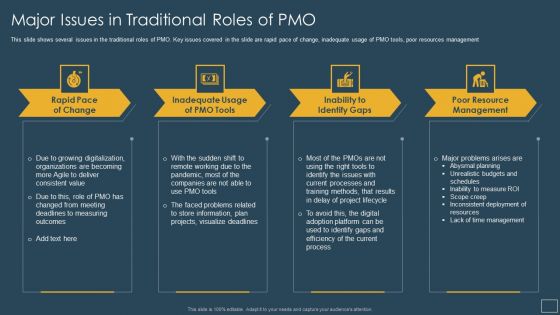
This slide shows several issues in the traditional roles of PMO. Key issues covered in the slide are rapid pace of change, inadequate usage of PMO tools, poor resources management. This is a responsibility project management office team support digital company major issues download pdf template with various stages. Focus and dispense information on four stages using this creative set, that comes with editable features. It contains large content boxes to add your information on topics like pandemic, plan, information, methods, processes. You can also showcase facts, figures, and other relevant content using this PPT layout. Grab it now.


 Continue with Email

 Home
Home


