Bar And Line Graph
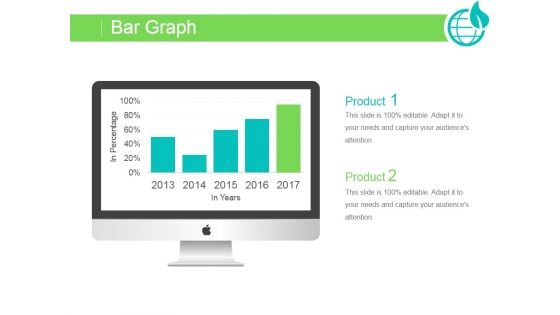
Bar Graph Ppt PowerPoint Presentation Ideas
This is a bar graph ppt powerpoint presentation ideas. This is a two stage process. The stages in this process are computer, graph, growth, success, social.
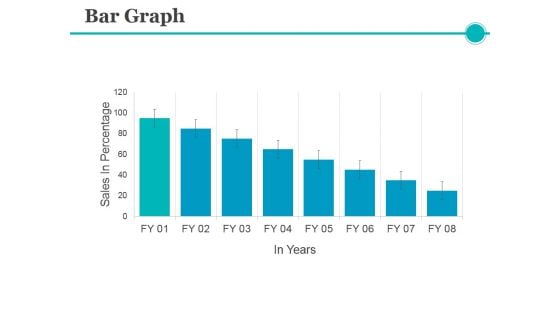
Bar Graph Ppt PowerPoint Presentation Model Templates
This is a bar graph ppt powerpoint presentation model templates. This is a eight stage process. The stages in this process are graph, business, finance, growth, marketing.
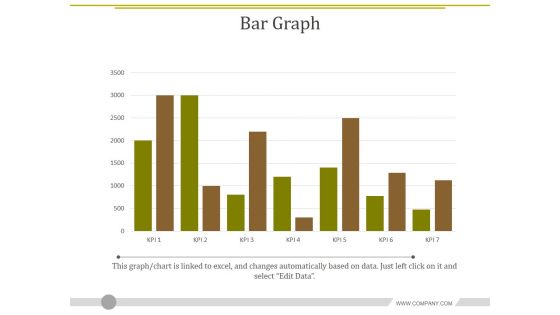
Bar Graph Ppt PowerPoint Presentation Gallery Good
This is a bar graph ppt powerpoint presentation gallery good. This is a seven stage process. The stages in this process are graph, finance, business, marketing.
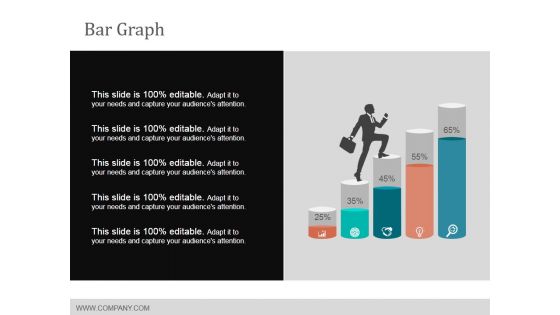
Bar Graph Ppt Powerpoint Presentation Slides Example
This is a bar graph ppt powerpoint presentation slides example. This is a five stage process. The stages in this process are graph, business, marketing, finance.
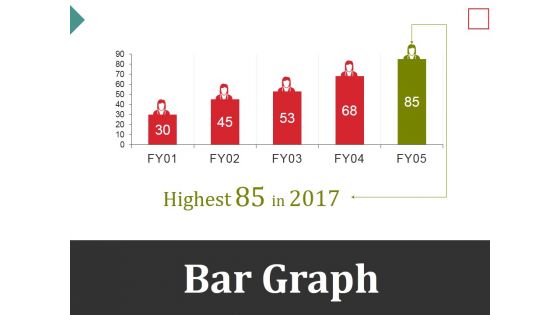
Bar Graph Ppt PowerPoint Presentation Inspiration Microsoft
This is a bar graph ppt powerpoint presentation inspiration microsoft. This is a five stage process. The stages in this process are business, marketing, graph, management, growth.
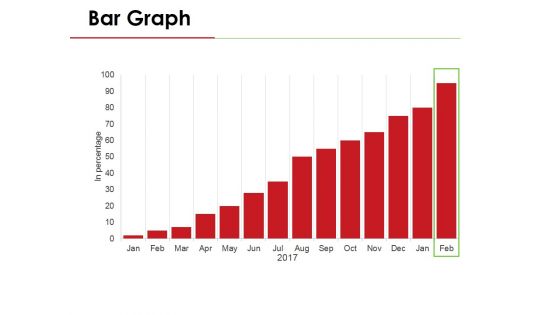
Bar Graph Ppt PowerPoint Presentation Pictures Templates
This is a bar graph ppt powerpoint presentation pictures templates. This is a one stage process. The stages in this process are business, marketing, graph, management, growth.
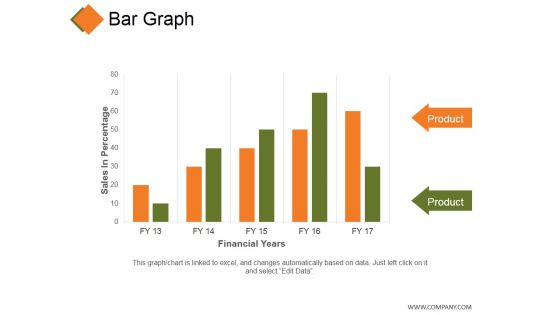
Bar Graph Ppt PowerPoint Presentation Layouts Layouts
This is a bar graph ppt powerpoint presentation layouts layouts. This is a five stage process. The stages in this process are product, financial years, business, graph, marketing.
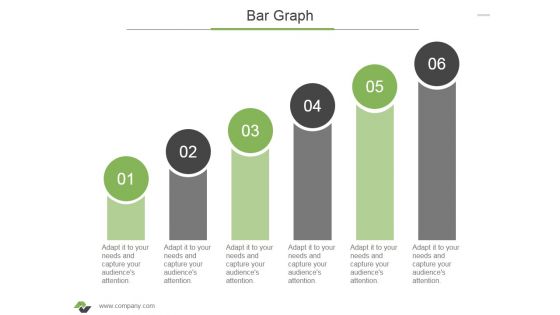
Bar Graph Ppt PowerPoint Presentation Ideas Topics
This is a bar graph ppt powerpoint presentation ideas topics. This is a six stage process. The stages in this process are graph, business, growth, success, marketing.
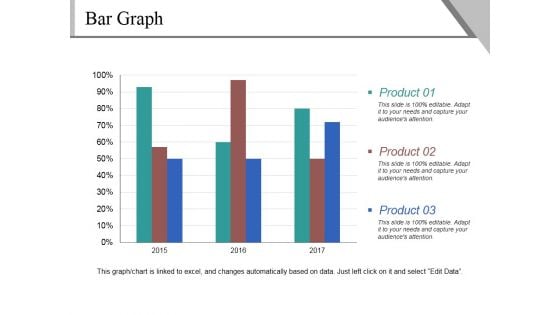
Bar Graph Ppt PowerPoint Presentation Ideas Show
This is a bar graph ppt powerpoint presentation ideas show. This is a three stage process. The stages in this process are product, percentage, business, year, graph.
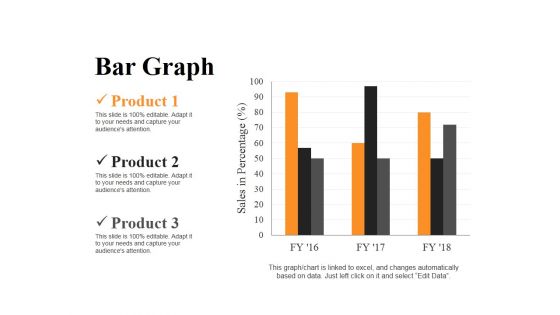
Bar Graph Ppt PowerPoint Presentation Infographics Clipart
This is a bar graph ppt powerpoint presentation infographics clipart. This is a three stage process. The stages in this process are product, graph, finance, business, marketing.
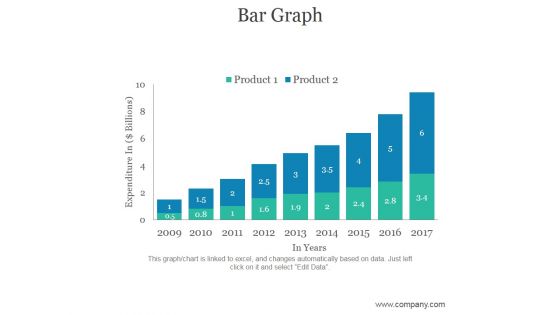
Bar Graph Ppt PowerPoint Presentation Diagrams
This is a bar graph ppt powerpoint presentation diagrams. This is a nine stage process. The stages in this process are business, marketing, success, management, growth.
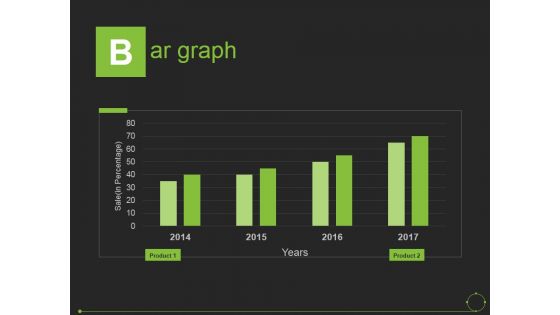
Bar Graph Ppt PowerPoint Presentation Portfolio Background
This is a bar graph ppt powerpoint presentation portfolio background. This is a four stage process. The stages in this process are sale, years, product.
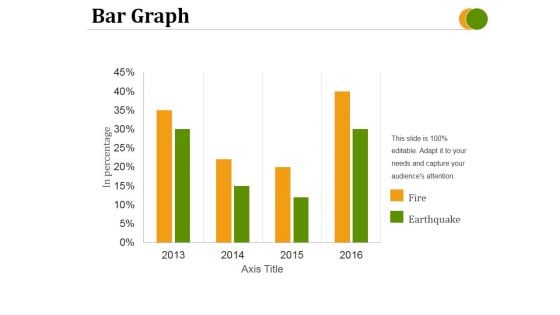
Bar Graph Ppt PowerPoint Presentation Layouts Pictures
This is a bar graph ppt powerpoint presentation layouts pictures. This is a four stage process. The stages in this process are fire, earthquake, axis title, in percentage.
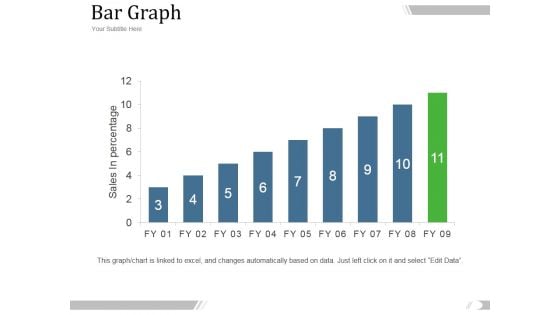
Bar Graph Ppt PowerPoint Presentation Introduction
This is a bar graph ppt powerpoint presentation introduction. This is a eleven stage process. The stages in this process are management, marketing, business, fy, graph, sales in percentage.
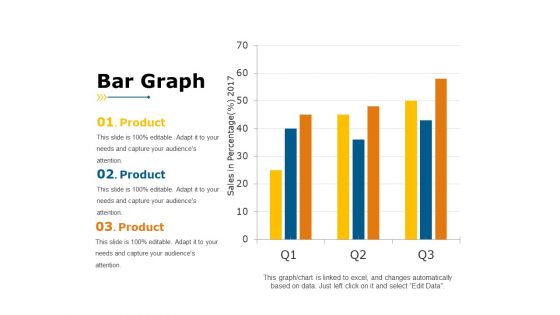
Bar Graph Ppt PowerPoint Presentation Portfolio Example
This is a bar graph ppt powerpoint presentation portfolio example. This is a three stage process. The stages in this process are sales in percentage, year, business, product, business, graph.
Bar Graph Ppt PowerPoint Presentation Infographics Icon
This is a bar graph ppt powerpoint presentation infographics icon. This is a two stage process. The stages in this process are business, marketing, financial year, in percentage, graph.
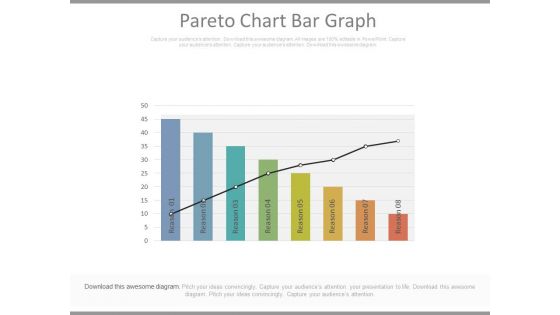
Pareto Chart Bar Graph Ppt Slides
This is a pareto chart bar graph ppt slides. This is a eight stage process. The stages in this process are business, marketing, success.\n
Bar Graph Slashed PowerPoint Icon C
budget cuts layoffs and dropped sales business model Attract customers with our Bar Graph Slashed PowerPoint Icon C. Just download, type and present.
Bar Graph Slashed PowerPoint Icon Cc
budget cuts layoffs and dropped sales business model Establish benchmarks with our Bar Graph Slashed PowerPoint Icon Cc. Your thoughts will be an example to live upto.
Bar Graph Slashed PowerPoint Icon S
budget cuts layoffs and dropped sales business model Impress the rank and file with our Bar Graph Slashed PowerPoint Icon S. Everyone will be awed by their ability.
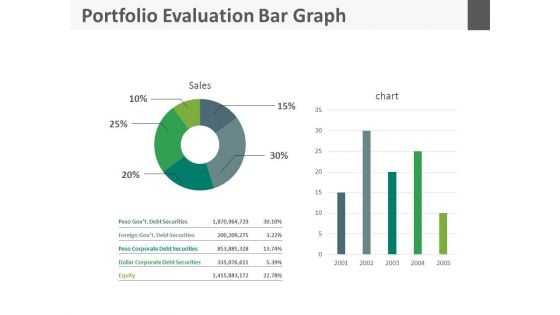
Portfolio Evaluation Bar Graph Ppt Slides
This is a portfolio evaluation bar graph ppt slides. This is a five stage process. The stages in this process are business, finance, marketing.
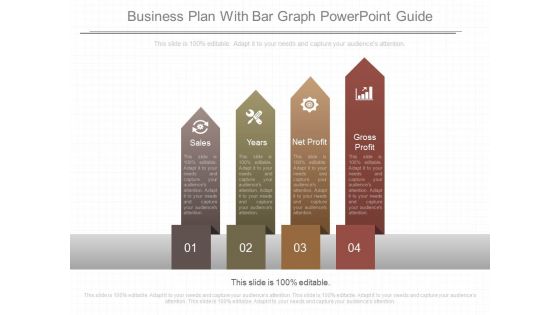
Business Plan With Bar Graph Powerpoint Guide
This is a business plan with bar graph powerpoint guide. This is a four stage process. The stages in this process are sales, years, net profit, gross profit.
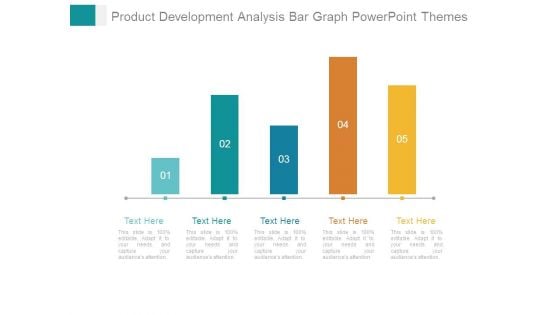
Product Development Analysis Bar Graph Powerpoint Themes
This is a product development analysis bar graph powerpoint themes. This is a five stage process. The stages in this process are business, growth, strategy, management, pretention.
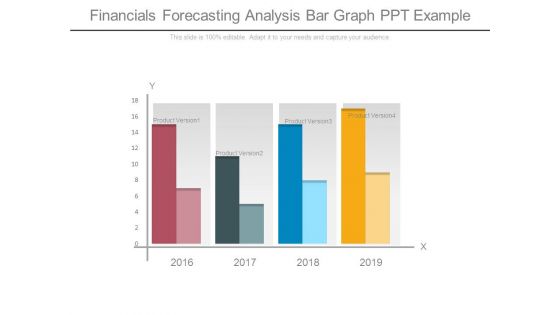
Financials Forecasting Analysis Bar Graph Ppt Example
This is a financials forecasting analysis bar graph ppt example. This is a four stage process. The stages in this process are product version.
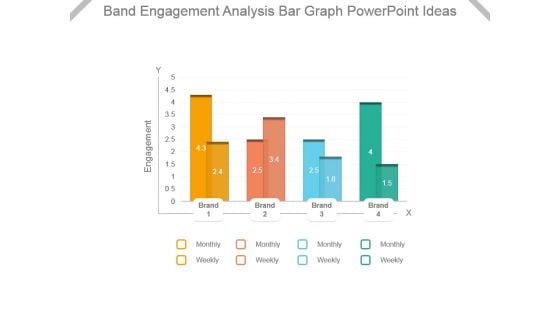
Band Engagement Analysis Bar Graph Powerpoint Ideas
This is a band engagement analysis bar graph powerpoint ideas. This is a four stage process. The stages in this process are engagement, brand, monthly, weekly.
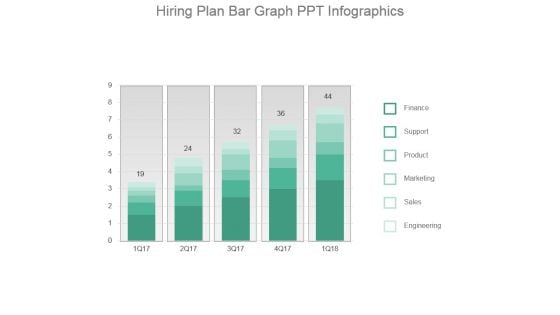
Hiring Plan Bar Graph Ppt Infographics
This is a hiring plan bar graph ppt infographics. This is a five stage process. The stages in this process are finance, support, product, marketing, sales, engineering.
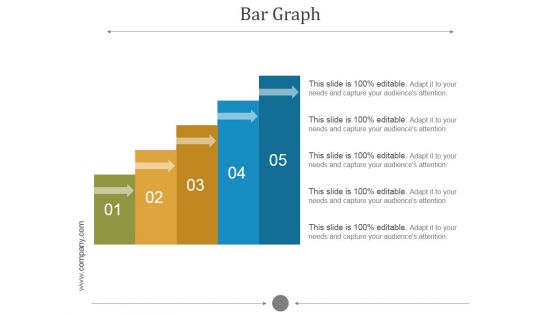
Bar Graph Ppt PowerPoint Presentation Slide Download
This is a bar graph ppt powerpoint presentation slide download. This is a five stage process. The stages in this process are arrow, business, bargraph, growth, success.
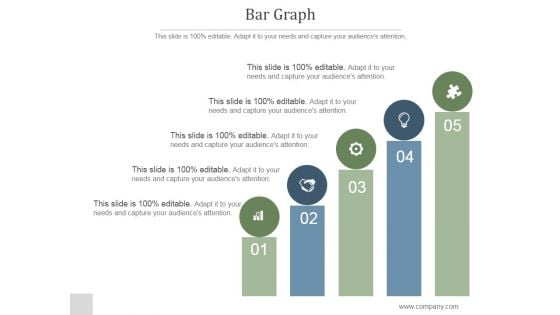
Bar Graph Ppt PowerPoint Presentation Topics
This is a bar graph ppt powerpoint presentation topics. This is a five stage process. The stages in this process are business, strategy, icons, management.
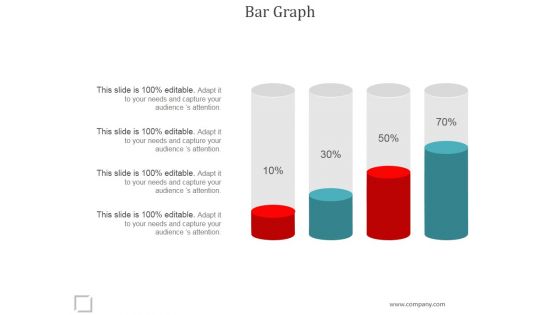
Bar Graph Ppt PowerPoint Presentation Backgrounds
This is a bar graph ppt powerpoint presentation backgrounds. This is a four stage process. The stages in this process are business, marketing, finance, growth, management.
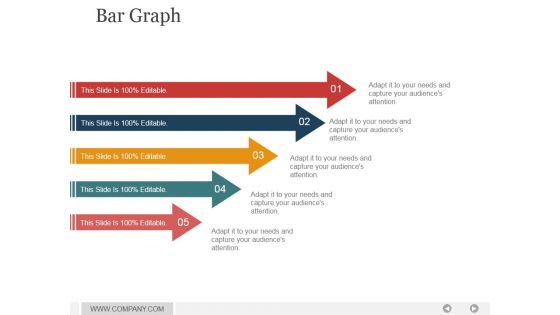
Bar Graph Ppt PowerPoint Presentation Shapes
This is a bar graph ppt powerpoint presentation shapes. This is a five stage process. The stages in this process are arrows, marketing, strategy, business, success.
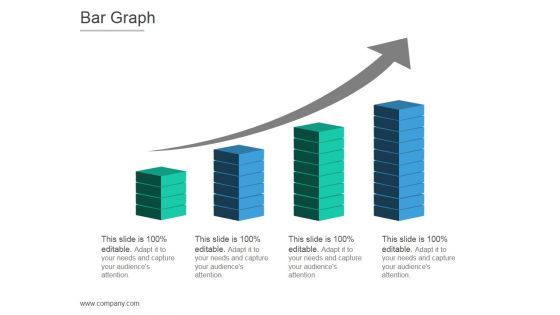
Bar Graph Ppt PowerPoint Presentation Templates
This is a bar graph ppt powerpoint presentation templates. This is a four stage process. The stages in this process are arrows, business, marketing, strategy, growth, graphic.
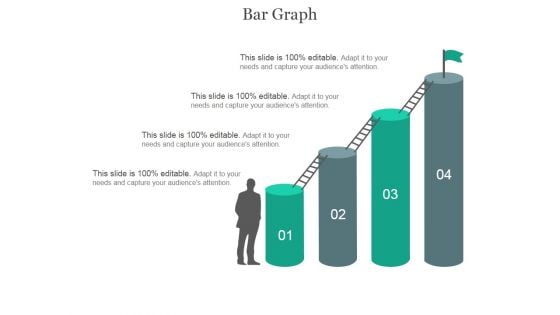
Bar Graph Ppt PowerPoint Presentation Clipart
This is a bar graph ppt powerpoint presentation clipart. This is a four stage process. The stages in this process are silhouettes, business, success, growth, stair.
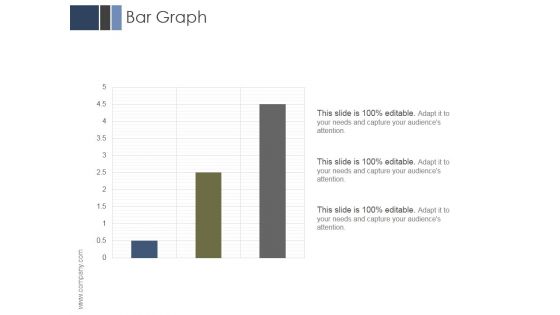
Bar Graph Ppt PowerPoint Presentation Layout
This is a bar graph ppt powerpoint presentation layout. This is a three stage process. The stages in this process are business, marketing, management, analysis, growth.
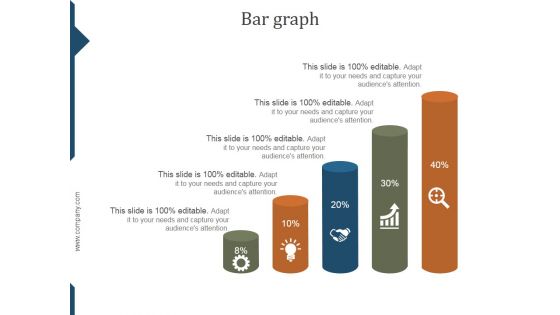
Bar Graph Ppt PowerPoint Presentation Deck
This is a bar graph ppt powerpoint presentation deck. This is a five stage process. The stages in this process are percentage, process, strategy, success, marketing.

Bar Graph Ppt PowerPoint Presentation Images
This is a bar graph ppt powerpoint presentation images. This is a four stage process. The stages in this process are business, strategy, marketing, analysis, success, growth.
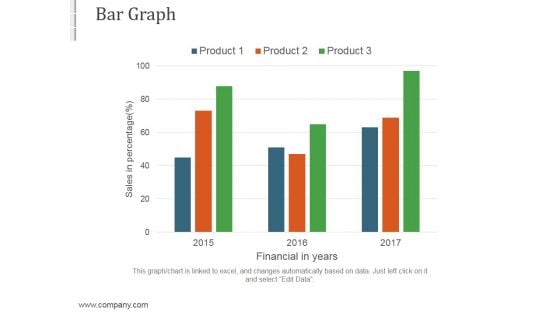
Bar Graph Ppt PowerPoint Presentation Themes
This is a bar graph ppt powerpoint presentation themes. This is a three stage process. The stages in this process are business, marketing, strategy, success, management.
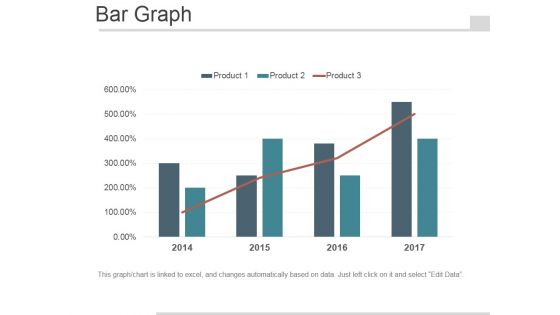
Bar Graph Ppt PowerPoint Presentation Design Ideas
This is a bar graph ppt powerpoint presentation design ideas. This is a four stage process. The stages in this process are business, management, marketing, finance, year.
Bar Graph Ppt PowerPoint Presentation Design Templates
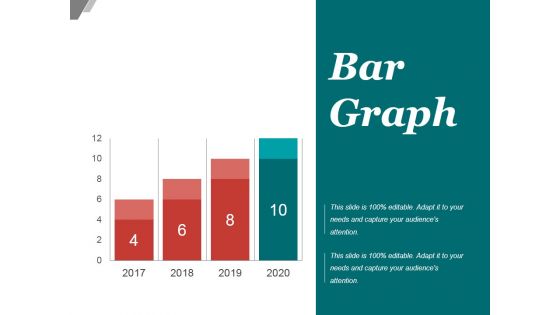
This is a bar graph ppt powerpoint presentation design templates. This is a four stage process. The stages in this process are business, marketing, success, growth, years.
Bar Graph Ppt PowerPoint Presentation Tips
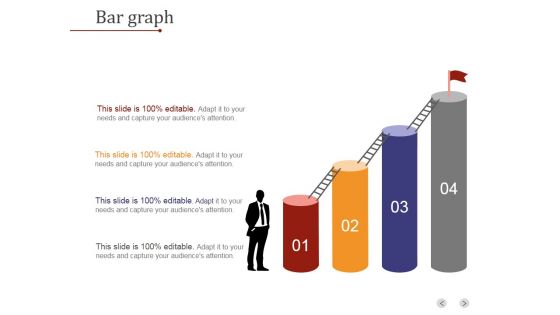
This is a bar graph ppt powerpoint presentation tips. This is a four stage process. The stages in this process are business, strategy, analysis, success, growth strategy, stair.
Bar Graph Ppt PowerPoint Presentation Pictures Display
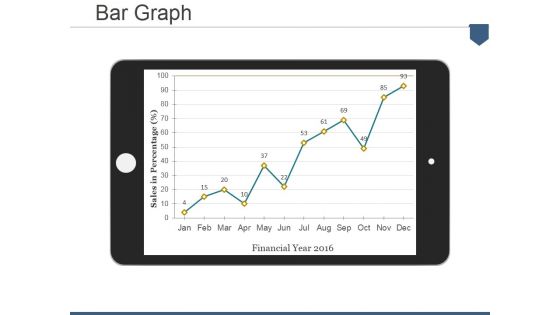
This is a bar graph ppt powerpoint presentation pictures display. This is a one stage process. The stages in this process are sales in percentage, financial year.
Bar Graph Ppt PowerPoint Presentation Slides Format
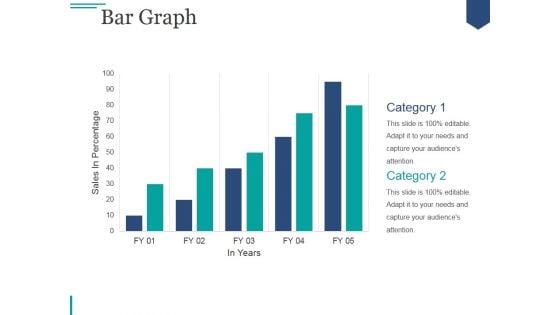
This is a bar graph ppt powerpoint presentation slides format. This is a two stage process. The stages in this process are business, marketing, growth, planning, sales plan.
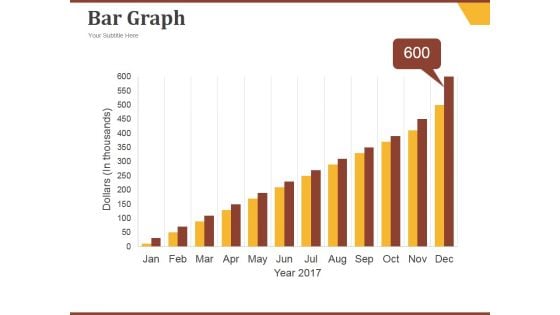
Bar Graph Ppt PowerPoint Presentation Ideas Diagrams
This is a bar graph ppt powerpoint presentation ideas diagrams. This is a twelve stage process. The stages in this process are jan, feb, mar, apr, may, growth.
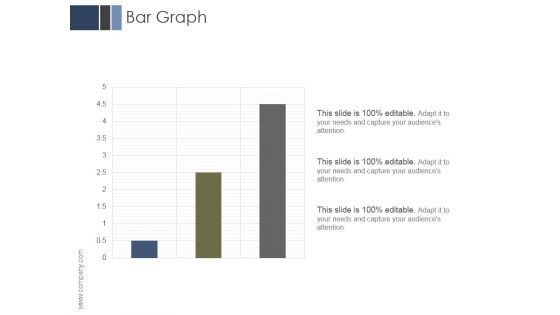
Bar Graph Ppt PowerPoint Presentation Outline Slides
This is a bar graph ppt powerpoint presentation outline slides. This is a three stage process. The stages in this process are business, marketing, management, analysis, growth.
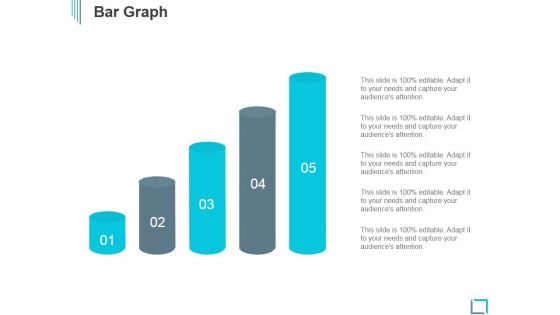
Bar Graph Ppt PowerPoint Presentation Ideas Professional
This is a bar graph ppt powerpoint presentation ideas professional. This is a five stage process. The stages in this process are business, marketing, growth, planning, process.
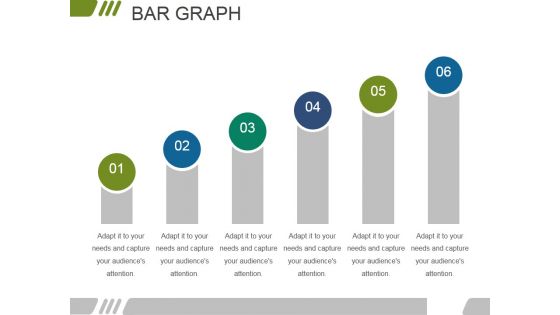
Bar Graph Ppt PowerPoint Presentation Gallery Maker
This is a bar graph ppt powerpoint presentation gallery maker. This is a six stage process. The stages in this process are business, marketing, growth, planning, management.
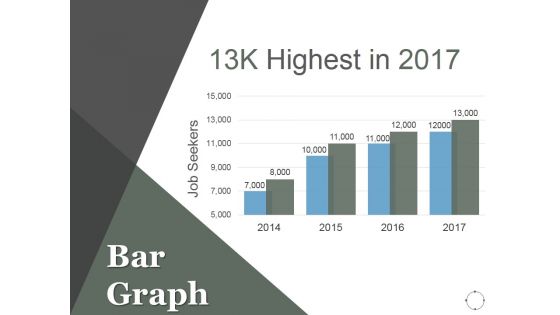
Bar Graph Ppt PowerPoint Presentation Model Images
This is a bar graph ppt powerpoint presentation model images. This is a four stage process. The stages in this process are business, marketing, finance, growth, management.
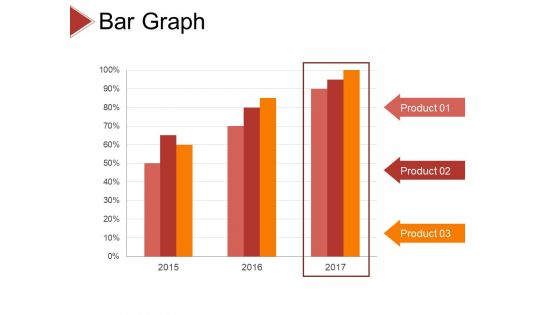
Bar Graph Ppt PowerPoint Presentation Layouts Gridlines
This is a bar graph ppt powerpoint presentation layouts gridlines. this is a three stage process. The stages in this process are product, percentage, business, marketing, management.
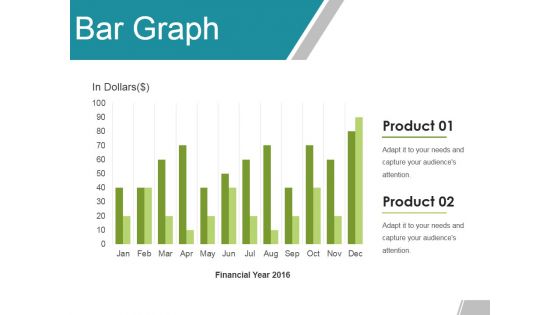
Bar Graph Ppt Powerpoint Presentation Model Topics
This is a bar graph ppt powerpoint presentation model topics. This is a twelve stage process. The stages in this process are jan, feb, mar, mar, apr.

Bar Graph Ppt PowerPoint Presentation Gallery Inspiration
This is a bar graph ppt powerpoint presentation gallery inspiration. This is a three stage process. The stages in this process are product, sales in percentage, finance, success.
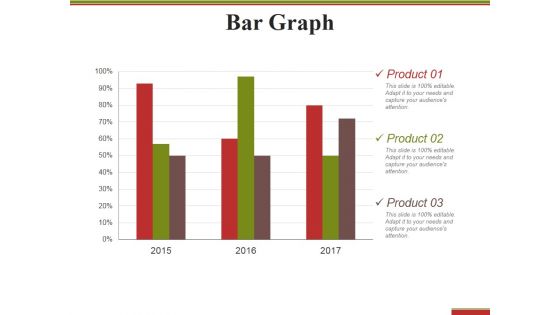
Bar Graph Ppt PowerPoint Presentation Outline Structure
This is a bar graph ppt powerpoint presentation outline structure. This is a three stage process. The stages in this process are product, percentage, finance, business.
Bar Graph Ppt PowerPoint Presentation Icon
This is a bar graph ppt powerpoint presentation icon. This is a three stage process. The stages in this process are business, finance, marketing, strategy, analysis.
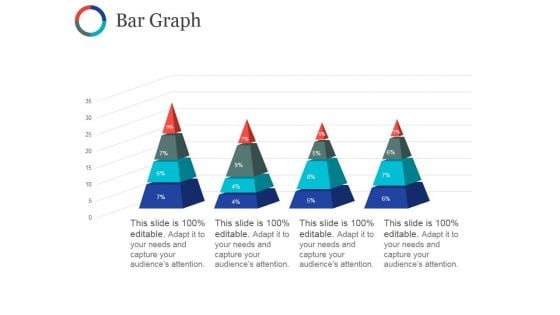
Bar Graph Ppt PowerPoint Presentation Inspiration Sample
This is a bar graph ppt powerpoint presentation inspiration sample. This is a four stage process. The stages in this process are business, pyramid, marketing, strategy, planning.
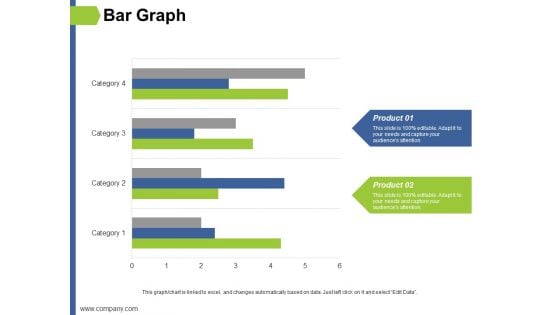
Bar Graph Ppt PowerPoint Presentation Show Slides
This is a bar graph ppt powerpoint presentation show slides. This is a two stage process. The stages in this process are finance, marketing, management, investment, analysis.
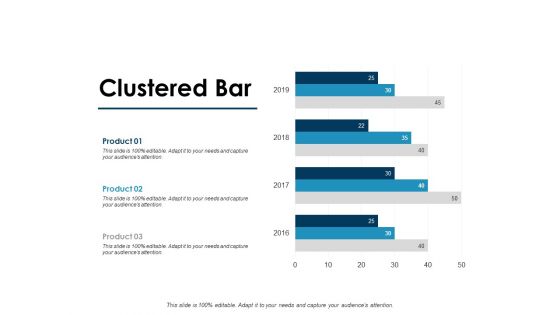
Clustered Bar Graph Ppt PowerPoint Presentation Templates
This is a clustered bar graph ppt powerpoint presentation templates. This is a three stage process. The stages in this process are finance, marketing, management, investment, analysis.
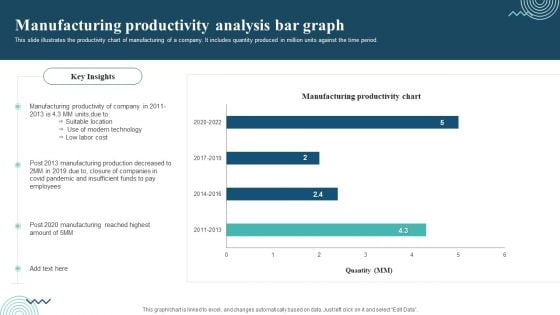
Manufacturing Productivity Analysis Bar Graph Introduction PDF
This slide illustrates the productivity chart of manufacturing of a company. It includes quantity produced in million units against the time period. Pitch your topic with ease and precision using this Manufacturing Productivity Analysis Bar Graph Introduction PDF. This layout presents information on Manufacturing Productivity, Production Decreased, Closure Of Companies. It is also available for immediate download and adjustment. So, changes can be made in the color, design, graphics or any other component to create a unique layout.
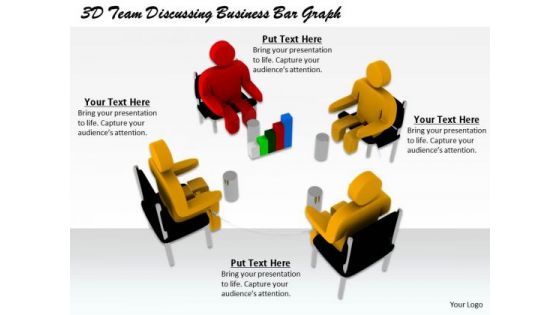
Business Concepts 3d Team Discussing Bar Graph
Put In A Dollop Of Our Business Concepts 3d Team Discussing Bar Graph Powerpoint Templates. Give Your Thoughts A Distinctive Flavor. Create Your Domain With Our marketing Powerpoint Templates. Rule Minds With Your Thoughts.
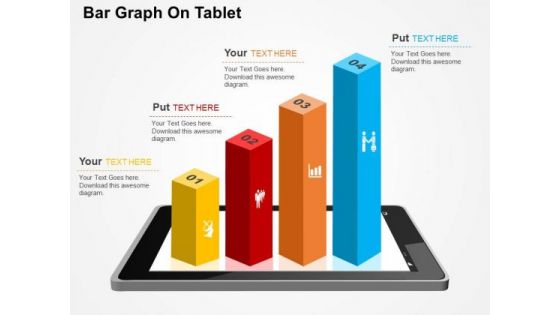
Bar Graph On Tablet PowerPoint Templates
Create dynamic presentations with our professional template containing diagram of bar graph on computer tablet. You may use this slide to portray concepts like business, growth, success etc. Present your views using our innovative slide.
Bar Graph With Five Icons Powerpoint Slides
This PowerPoint slide contains diagram bar graph with icons. This PPT slide helps to exhibit concepts of financial deal and planning. Use this business slide to make impressive presentations.

Pareto Analysis Bar Graph Powerpoint Slide Deck
This is a pareto analysis bar graph powerpoint slide deck. This is a ten stage process. The stages in this process are restaurant complaints, total complaints, complaints pricing and service, pricing and service, analysis bring down complaints, category.
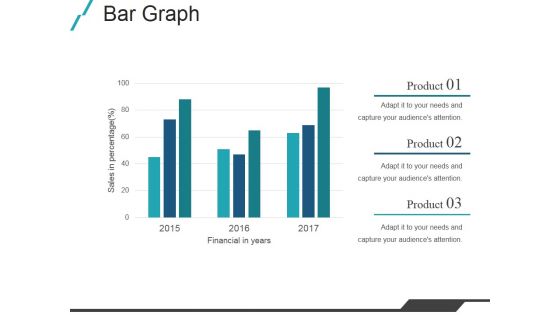
Bar Graph Ppt PowerPoint Presentation Slides Deck
This is a bar graph ppt powerpoint presentation slides deck. This is a three stage process. The stages in this process are financial in years, product, sales in percentage.

 Home
Home