Bar Chart Infographic
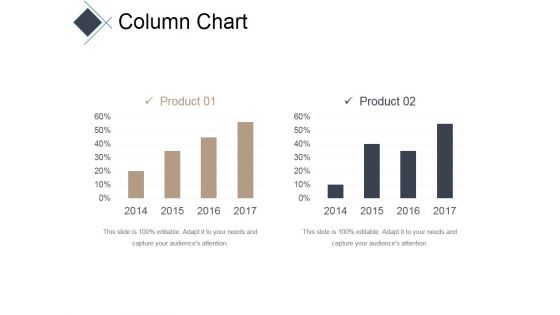
Column Chart Ppt PowerPoint Presentation Infographic Template Inspiration
This is a column chart ppt powerpoint presentation infographic template inspiration. This is a two stage process. The stages in this process are bar, years, business, marketing, success.
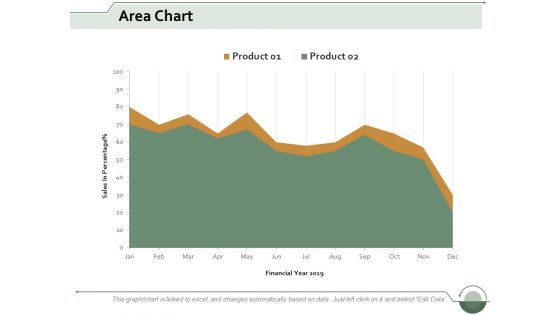
Area Chart Finance Ppt Powerpoint Presentation Infographic Template Clipart Images
This is a area chart finance ppt powerpoint presentation infographic template clipart images. This is a two stage process. The stages in this process are area bar, finance, marketing, management, analysis.
Line Chart Ppt PowerPoint Presentation Infographic Template Icons
This is a line chart ppt powerpoint presentation infographic template icons. This is a two stage process. The stages in this process are sales in percentage, financial years, product, line chart.
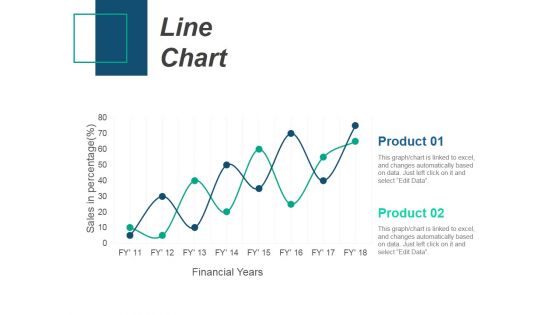
Line Chart Ppt PowerPoint Presentation Infographic Template Introduction
This is a line chart ppt powerpoint presentation infographic template introduction. This is a two stage process. The stages in this process are product, sales in percentage, financial years, line chart.
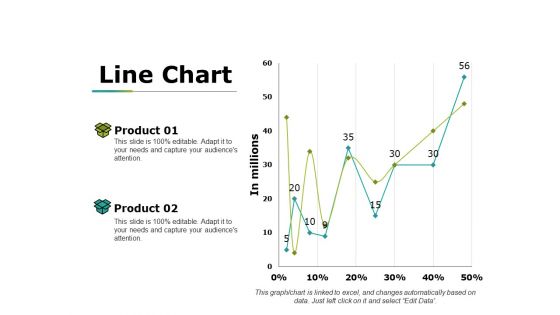
Line Chart Ppt PowerPoint Presentation Infographic Template Design Ideas
This is a line chart ppt powerpoint presentation infographic template design ideas. This is a two stage process. The stages in this process are product, in millions, percentage, line chart, success.
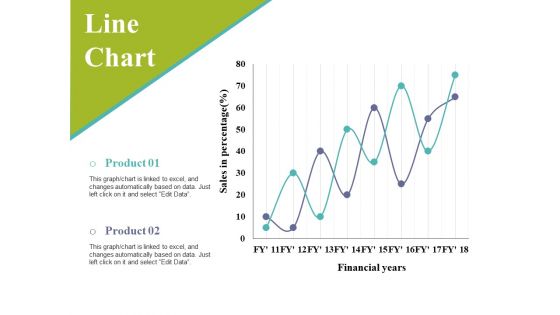
Line Chart Ppt PowerPoint Presentation Infographic Template Slides
This is a line chart ppt powerpoint presentation infographic template slides. This is a two stage process. The stages in this process are sales in percentage, financial years, business, marketing, graph.
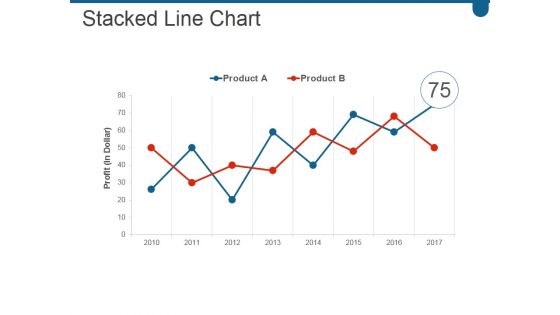
Stacked Line Chart Ppt PowerPoint Presentation Infographic Template Show
This is a stacked line chart ppt powerpoint presentation infographic template show. This is a two stage process. The stages in this process are business, marketing, growth, success, line.
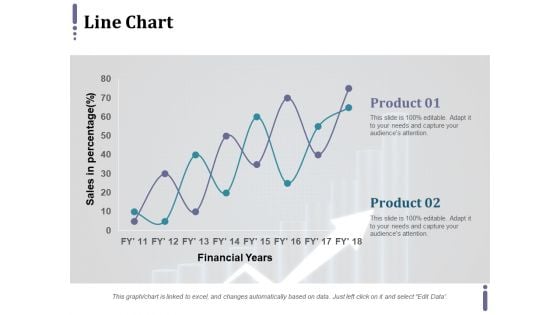
Line Chart Ppt PowerPoint Presentation Infographic Template Master Slide
This is a line chart ppt powerpoint presentation infographic template master slide. This is a two stage process. The stages in this process are product, financial years, sales in percentage.
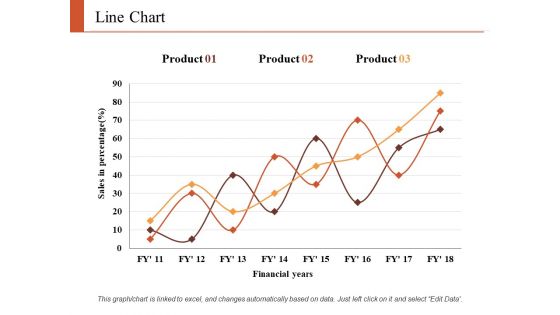
Line Chart Finance Ppt PowerPoint Presentation Infographic Template Graphics Tutorials
This is a line chart finance ppt powerpoint presentation infographic template graphics tutorials. This is a three stage process. The stages in this process are finance, marketing, analysis, business, investment.
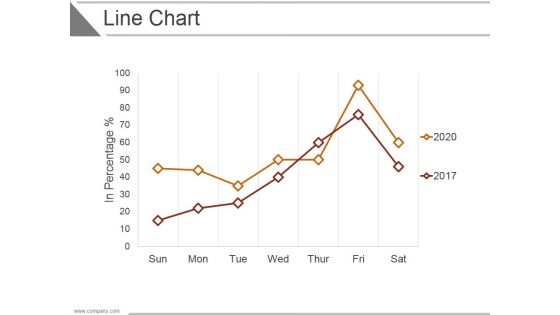
Line Chart Ppt PowerPoint Presentation Infographic Template Shapes
This is a line chart ppt powerpoint presentation infographic template shapes. This is a seven stage process. The stages in this process are business, strategy, analysis, marketing, growth.
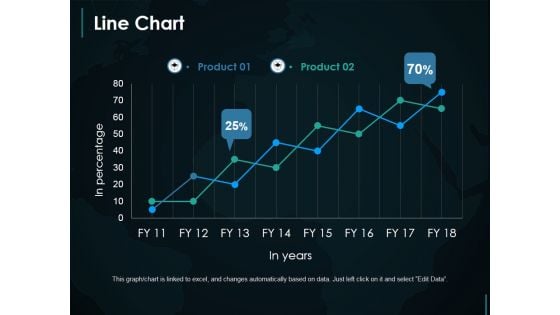
Line Chart Ppt PowerPoint Presentation Infographic Template Demonstration
This is a line chart ppt powerpoint presentation infographic template demonstration. This is a two stage process. The stages in this process are line chart, growth, finance, marketing, strategy.
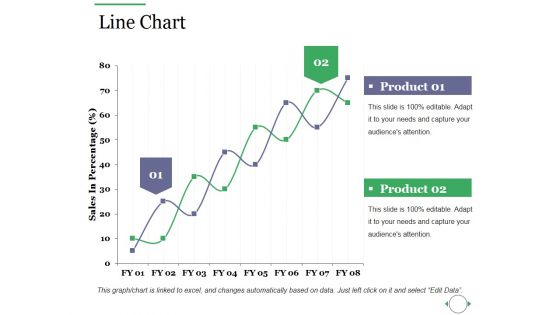
Line Chart Ppt PowerPoint Presentation Infographic Template Slideshow
This is a line chart ppt powerpoint presentation infographic template slideshow. This is a two stage process. The stages in this process are line chart, growth, strategy, business, marketing.
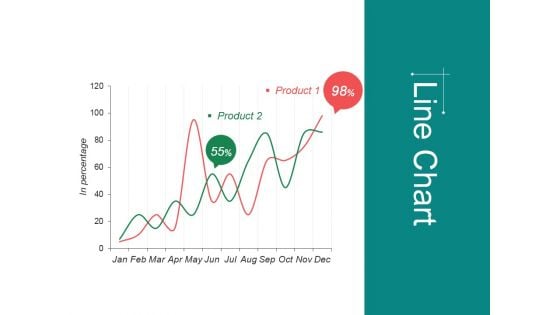
Line Chart Ppt Powerpoint Presentation Infographic Template Format
This is a line chart ppt powerpoint presentation infographic template format. This is a two stage process. The stages in this process are jan, feb, mar, apr, may, financial.
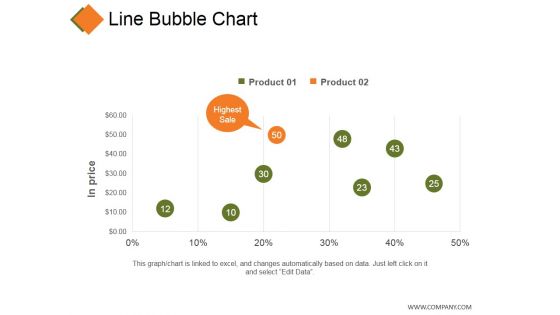
Line Bubble Chart Ppt PowerPoint Presentation Professional Infographic Template
This is a line bubble chart ppt powerpoint presentation professional infographic template. This is a five stage process. The stages in this process are product, in price, highest sale, business, finance.
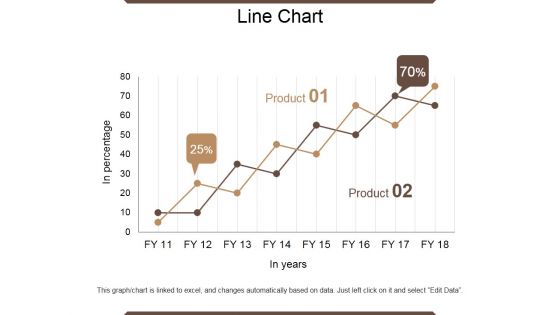
Line Chart Ppt PowerPoint Presentation Outline Infographic Template
This is a line chart ppt powerpoint presentation outline infographic template. This is a two stage process. The stages in this process are in percentage, product, in year, growth, success.
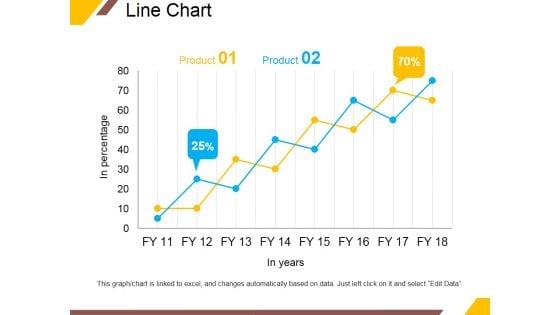
Line Chart Ppt PowerPoint Presentation Portfolio Infographic Template
This is a line chart ppt powerpoint presentation portfolio infographic template. This is a two stage process. The stages in this process are product, in years, business, percentage, growth.
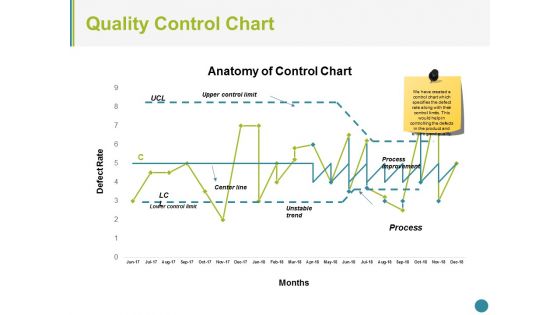
Quality Control Chart Ppt PowerPoint Presentation Infographic Template Slide Portrait
This is a quality control chart ppt powerpoint presentation infographic template slide portrait. This is a three stage process. The stages in this process are upper control limit, center line, unstable trend, process change, process improvement, lower control limit.
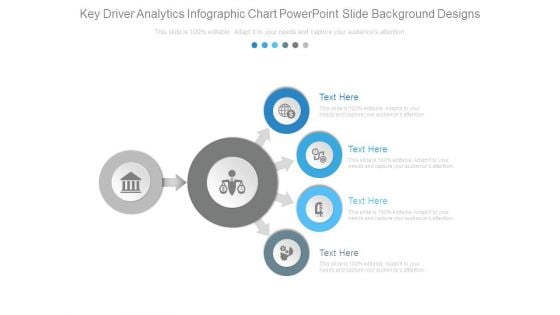
Key Driver Analytics Infographic Chart Powerpoint Slide Background Designs
This is a key driver analytics infographic chart powerpoint slide background designs. This is a four stage process. The stages in this process are business, marketing, arrows, icons, strategy.

Organization Chart Template Ppt PowerPoint Presentation Infographic Template Styles
This is a organization chart template ppt powerpoint presentation infographic template styles. This is a four stage process. The stages in this process are john smith, anita carol, merry doe, jess parker.
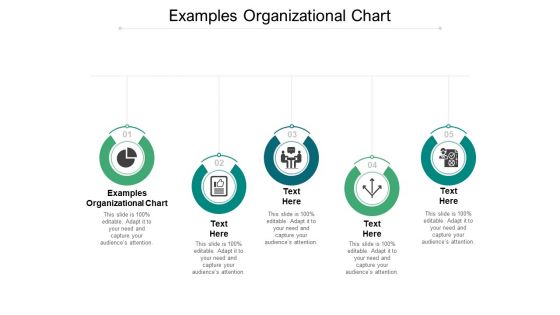
Examples Organizational Chart Ppt PowerPoint Presentation Infographic Template Themes Cpb
Presenting this set of slides with name examples organizational chart ppt powerpoint presentation infographic template themes cpb. This is an editable Powerpoint five stages graphic that deals with topics like examples organizational chart to help convey your message better graphically. This product is a premium product available for immediate download and is 100 percent editable in Powerpoint. Download this now and use it in your presentations to impress your audience.
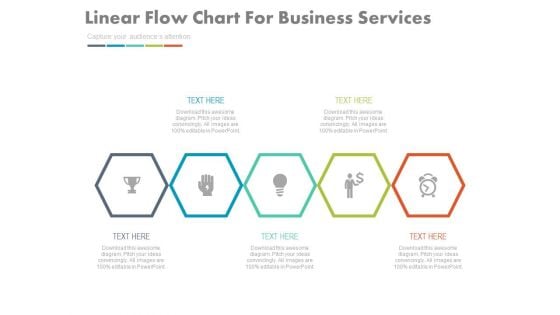
Linear Infographic Chart For Quick Business Plan Powerpoint Template
This PowerPoint template has been designed with linear infographic chart. Use this PPT slide to display quick business plan. Download this template to leave permanent impression on your audience.
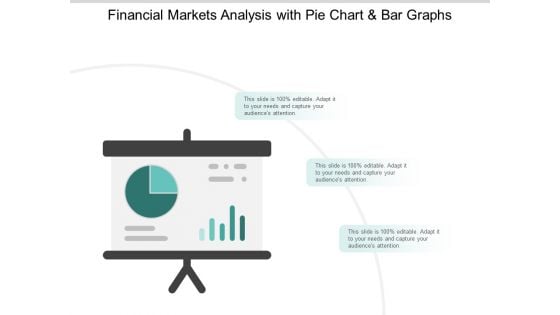
Stock Market Survey Reporting With Pie Chat And Bar Graph Ppt PowerPoint Presentation Infographic Template Example 2015
This is a stock market survey reporting with pie chat and bar graph ppt powerpoint presentation infographic template example 2015. This is a three stage process. The stages in this process are stock market, financial markets, bull market.
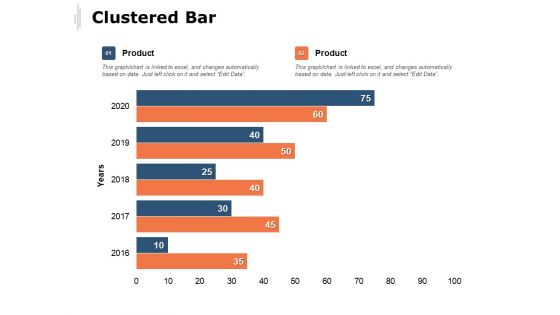
Clustered Bar Investment Ppt PowerPoint Presentation Infographics Model
Presenting this set of slides with name clustered bar investment ppt powerpoint presentation infographics model. The topics discussed in these slide is clustered bar. This is a completely editable PowerPoint presentation and is available for immediate download. Download now and impress your audience.
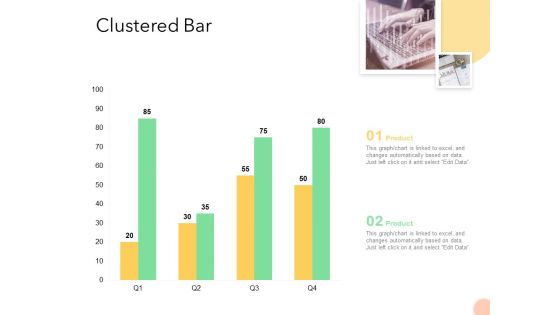
Know Your Customer Clustered Bar Ppt Infographics Visuals PDF
Presenting this set of slides with name know your customer clustered bar ppt infographics visuals pdf. The topics discussed in these slide is clustered bar. This is a completely editable PowerPoint presentation and is available for immediate download. Download now and impress your audience.
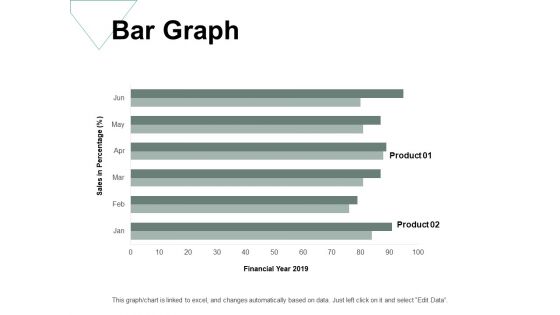
Bar Graph Investment Ppt PowerPoint Presentation Infographics Graphics Template
Presenting this set of slides with name bar graph investment ppt powerpoint presentation infographics graphics template. The topics discussed in these slides are finance, marketing, management, investment, analysis. This is a completely editable PowerPoint presentation and is available for immediate download. Download now and impress your audience.
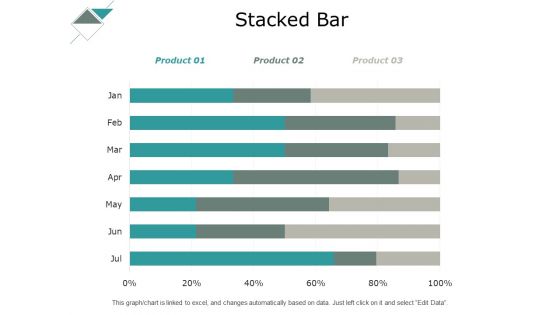
Stacked Bar Analysis Ppt PowerPoint Presentation Infographics Summary
Presenting this set of slides with name stacked bar analysis ppt powerpoint presentation infographics summary. The topics discussed in these slides are finance, marketing, management, investment, analysis. This is a completely editable PowerPoint presentation and is available for immediate download. Download now and impress your audience.
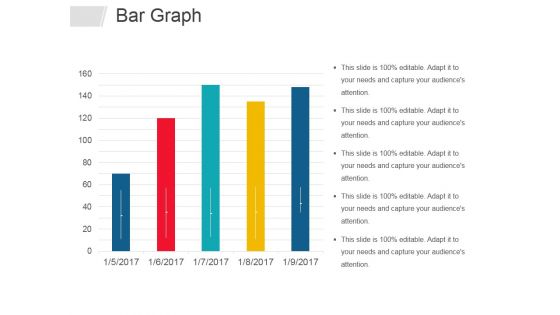
Bar Graph Ppt PowerPoint Presentation Infographics Graphics Design
This is a bar graph ppt powerpoint presentation infographics graphics design. This is a five stage process. The stages in this process are bar graph, business, years, marketing, management.
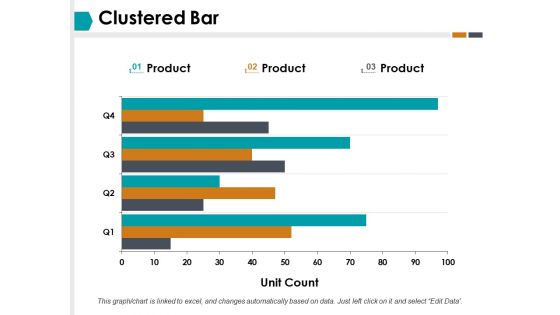
Clustered Bar Finance Ppt PowerPoint Presentation Infographics Graphics Template
This is a clustered bar finance ppt powerpoint presentation infographics graphics template. This is a three stage process. The stages in this process are clustered bar, finance, business, investment, marketing.
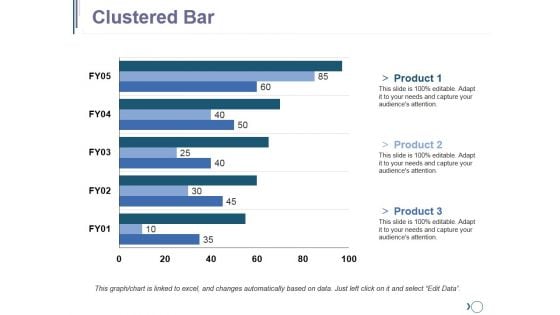
Clustered Bar Ppt PowerPoint Presentation Infographics Example File
This is a clustered bar ppt powerpoint presentation infographics example file. This is a five stage process. The stages in this process are business, marketing, strategy, planning, finance.
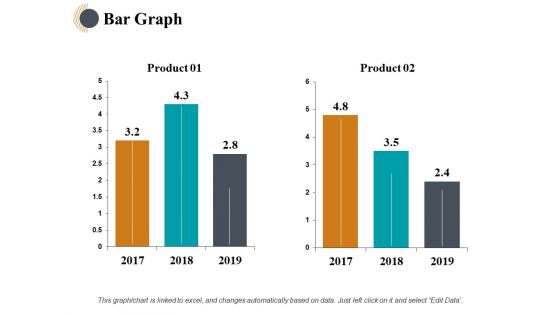
Bar Graph Finance Ppt PowerPoint Presentation Infographics Background Designs
This is a bar graph finance ppt powerpoint presentation infographics background designs. This is a two stage process. The stages in this process are finance, analysis, business, investment, marketing.

Stacked Bar Investment Ppt PowerPoint Presentation Gallery Infographics
This is a stacked bar investment ppt powerpoint presentation gallery infographics. This is a three stage process. The stages in this process are finance, analysis, business, investment, marketing.
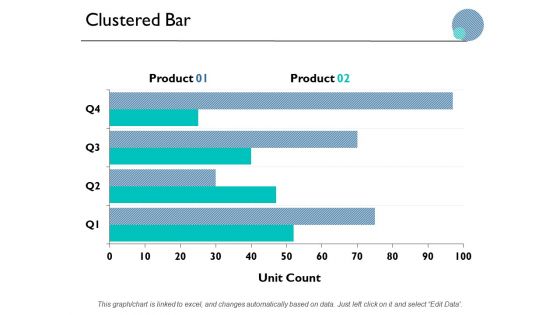
Clustered Bar Finance Marketing Ppt PowerPoint Presentation Inspiration Infographics
This is a clustered bar finance marketing ppt powerpoint presentation inspiration infographics. This is a two stage process. The stages in this process are finance, marketing, management, investment, analysis.
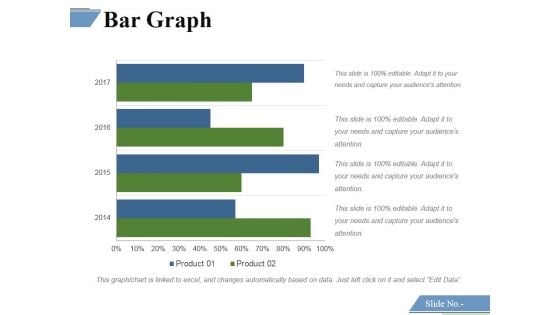
Bar Graph Ppt PowerPoint Presentation Infographics Slide Download
This is a bar graph ppt powerpoint presentation infographics slide download. This is a four stage process. The stages in this process are bar graph, finance, marketing, strategy, analysis.
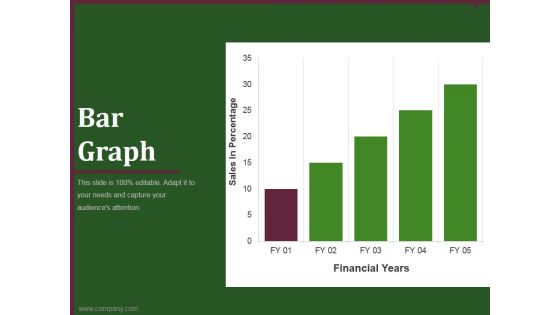
bar graph template 1 ppt powerpoint presentation infographics
This is a bar graph template 1 ppt powerpoint presentation infographics. This is a five stage process. The stages in this process are business, marketing, graph, analysis, growth.
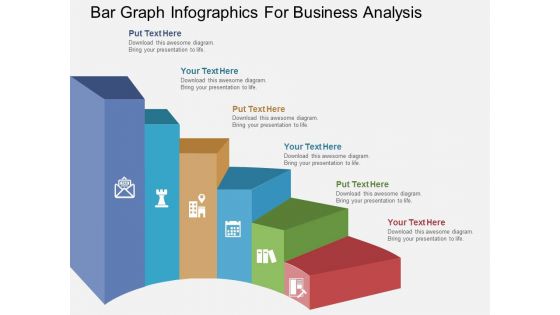
Bar Graph Infographics For Business Analysis Powerpoint Template
This PowerPoint template contains bar graph with icons. This PPT slide helps to exhibit concepts like strategy, direction and success. Use this business slide to make impressive presentations.
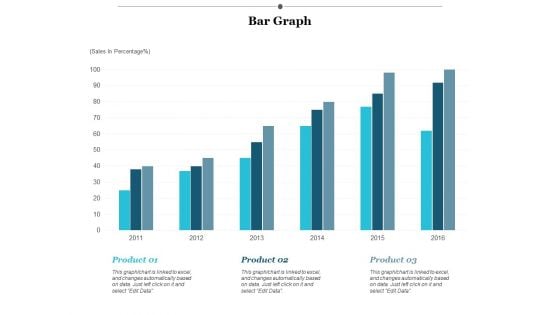
Bar Graph Finance Ppt PowerPoint Presentation Infographics Designs Download
This is a bar graph finance ppt powerpoint presentation infographics designs download. This is a three stage process. The stages in this process are finance, marketing, management, investment, analysis.
Infographics With News Mail Microscope Bar Graph Icons Powerpoint Templates
This PowerPoint template has been designed with infographic square. Download this PPT slide to display information in visual manner. Use this diagram to build an exclusive presentation.
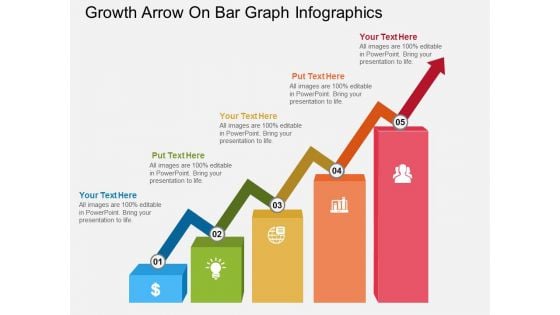
Growth Arrow On Bar Graph Infographics Powerpoint Template
This PowerPoint template has been designed with growth arrow on bar graph. You may download this diagram slide to display growth and progress concepts. Illustrate your plans to your listeners with this impressive template.
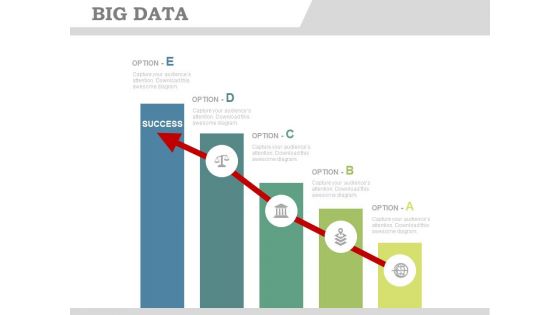
Bar Graph Infographics With Success Arrow Powerpoint Slides
This PowerPoint template has been designed with bar graph with success arrow. You may use this PPT slide to display goal achievement and planning. Impress your audiences by using this PPT slide.
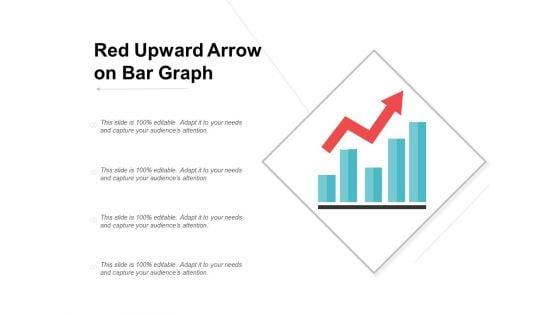
Red Upward Arrow On Bar Graph Ppt Powerpoint Presentation Infographics
This is a red upward arrow on bar graph ppt powerpoint presentation infographics. This is a four stage process. The stages in this process are increasing arrows, improving arrows, growing arrows.
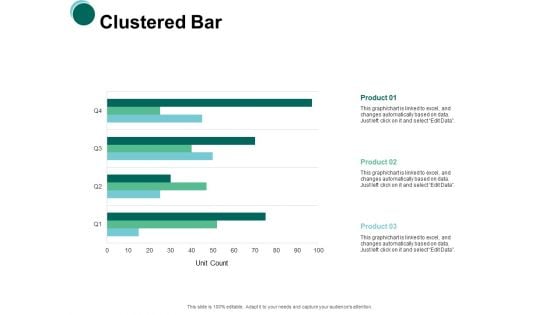
Clustered Bar Graphs Ppt PowerPoint Presentation Infographics Slides
Presenting this set of slides with name clustered bar graphs ppt powerpoint presentation infographics slides. The topics discussed in these slides are marketing, business, management, planning, strategy. This is a completely editable PowerPoint presentation and is available for immediate download. Download now and impress your audience.
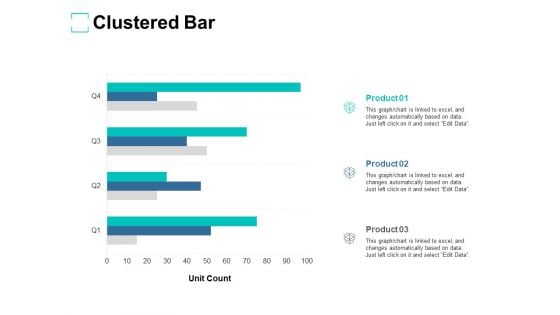
Clustered Bar Graph Ppt PowerPoint Presentation Infographics Model
Presenting this set of slides with name clustered bar graph ppt powerpoint presentation infographics model. The topics discussed in these slides are business, planning, strategy, marketing, management. This is a completely editable PowerPoint presentation and is available for immediate download. Download now and impress your audience.
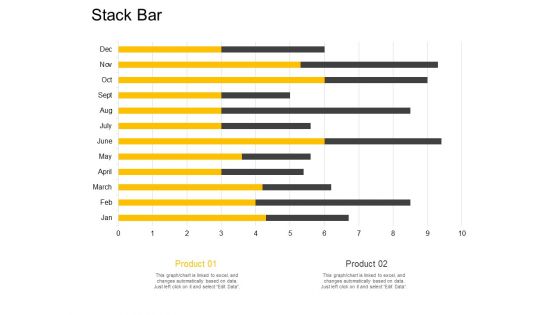
Stack Bar Graph Ppt PowerPoint Presentation Infographics Vector
Presenting this set of slides with name stack bar graph ppt powerpoint presentation infographics vector. The topics discussed in these slides are marketing, business, management, planning, strategy. This is a completely editable PowerPoint presentation and is available for immediate download. Download now and impress your audience.
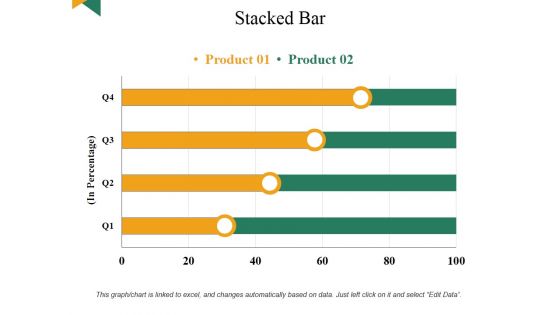
Stacked Bar Ppt PowerPoint Presentation Infographics Design Templates
This is a stacked bar ppt powerpoint presentation infographics design templates. This is a four stage process. The stages in this process are business, marketing, finance, analysis, planning.
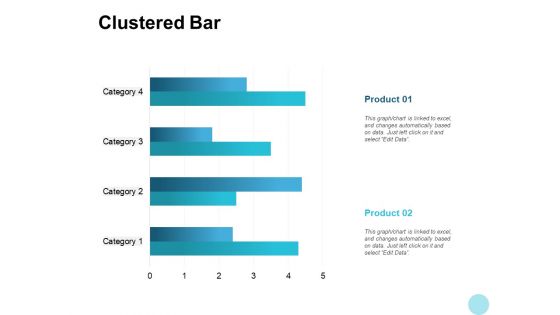
Clustered Bar Finance Ppt PowerPoint Presentation Infographics Good
Presenting this set of slides with name clustered bar finance ppt powerpoint presentation infographics good. The topics discussed in these slides are marketing, business, management, planning, strategy. This is a completely editable PowerPoint presentation and is available for immediate download. Download now and impress your audience.

Business Solution Ppt PowerPoint Presentation Infographic Template Infographic Template
This is a business solution ppt powerpoint presentation infographic template infographic template. This is a three stage process. The stages in this process are business solution.
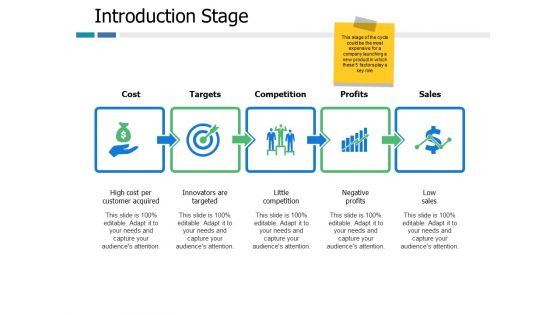
Introduction Stage Ppt PowerPoint Presentation Infographic Template Infographic Template
This is a introduction stage ppt powerpoint presentation infographic template infographic template. This is a five stage process. The stages in this process are business, marketing, management, strategy.
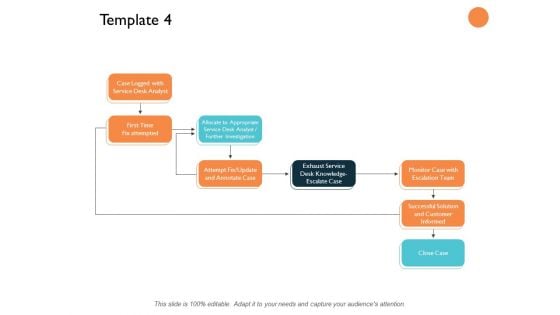
Template Close Case Ppt PowerPoint Presentation Infographic Template Infographic Template
This is a template close case ppt powerpoint presentation infographic template infographic template. This is a three stage process. The stages in this process are business, management, planning, strategy, marketing.
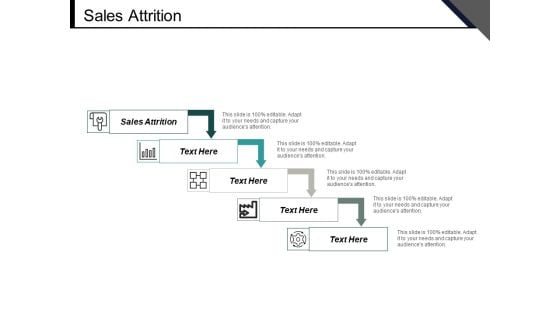
Sales Attrition Ppt PowerPoint Presentation Infographic Template Infographic Template Cpb
This is a sales attrition ppt powerpoint presentation infographic template infographic template cpb. This is a four stage process. The stages in this process are sales attrition, business, management, marketing.

Merchandise Buying Decision Process Ppt Infographic Template Infographic Template PDF
Presenting merchandise buying decision process ppt infographic template infographic template pdf. to provide visual cues and insights. Share and navigate important information on four stages that need your due attention. This template can be used to pitch topics like financial objective, suppliers, merchandise policies. In addtion, this PPT design contains high resolution images, graphics, etc, that are easily editable and available for immediate download.
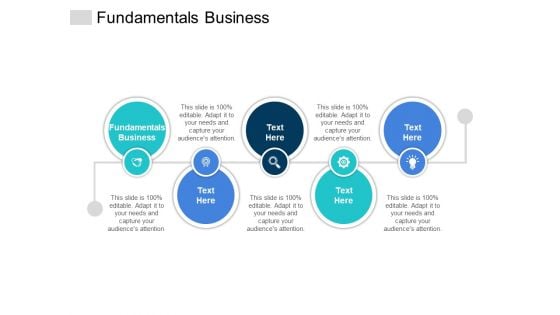
Fundamentals Business Ppt PowerPoint Presentation Infographic Template Infographic Template Cpb
Presenting this set of slides with name fundamentals business ppt powerpoint presentation infographic template infographic template cpb. This is an editable Powerpoint five stages graphic that deals with topics like fundamentals business to help convey your message better graphically. This product is a premium product available for immediate download and is 100 percent editable in Powerpoint. Download this now and use it in your presentations to impress your audience.
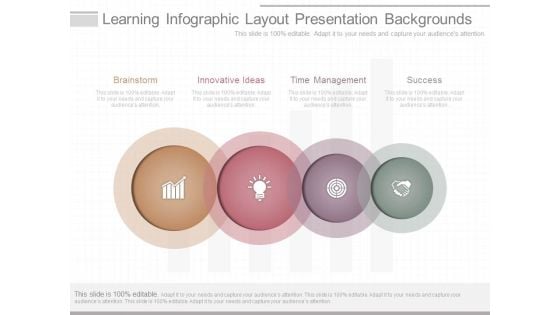
Learning Infographic Layout Presentation Backgrounds
This is a learning infographic layout presentation backgrounds. This is a four stage process. The stages in this process are brainstorm, innovative ideas, time management, success.
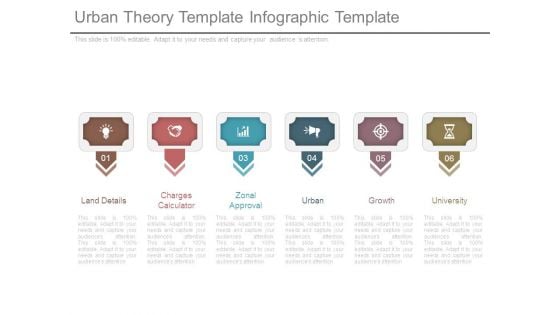
Urban Theory Template Infographic Template
This is a urban theory template infographic template. This is a six stage process. The stages in this process are land details, charges calculator, zonal approval, urban, growth, university.
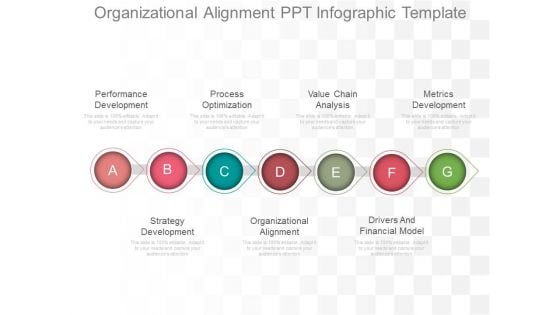
Organizational Alignment Ppt Infographic Template
This is a organizational alignment ppt infographic template. This is a seven stage process. The stages in this process are performance development, process optimization, value chain analysis, metrics development, strategy development, organizational alignment, drivers and financial model.
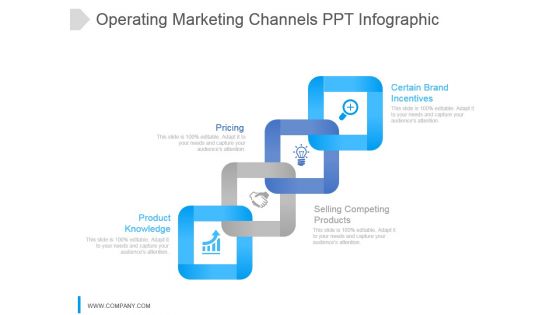
Operating Marketing Channels Ppt Infographic
This is a operating marketing channels ppt infographic. This is a four stage process. The stages in this process are product knowledge, selling competing products, pricing, certain brand incentives.
Green Arrows On Bars Vector Icon Ppt PowerPoint Presentation Infographic Template Templates Cpb
This is a green arrows on bars vector icon ppt powerpoint presentation infographic template templates cpb. This is a three stage process. The stages in this process are bar chart icon, bar graph icon, data chart icon.
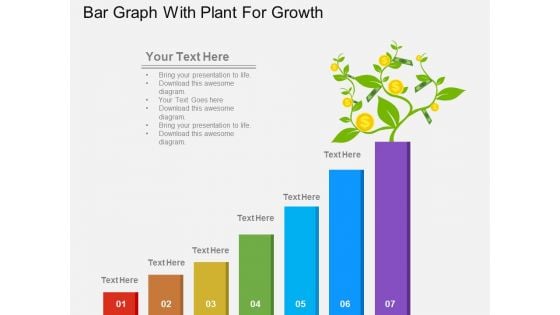
Bar Graph With Plant For Growth Powerpoint Template
This PowerPoint template has been designed with diagram of bar graph with plant. This infographic template may be used to display growth and progress. Accelerate the impact of your ideas using this template.
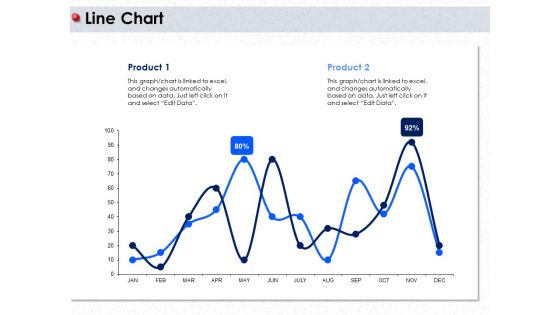
Ways To Design Impactful Trading Solution Line Chart Ppt PowerPoint Presentation Infographic Template Background Designs PDF
Presenting this set of slides with name ways to design impactful trading solution line chart ppt powerpoint presentation infographic template background designs pdf. The topics discussed in these slide is line chart. This is a completely editable PowerPoint presentation and is available for immediate download. Download now and impress your audience.
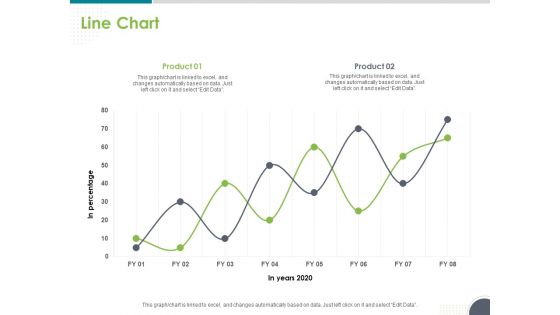
Software Testing Framework For Learners Line Chart Ppt PowerPoint Presentation Infographic Template Graphics Example PDF
Presenting this set of slides with name software testing framework for learners line chart ppt powerpoint presentation infographic template graphics example pdf. The topics discussed in these slide is line chart. This is a completely editable PowerPoint presentation and is available for immediate download. Download now and impress your audience.
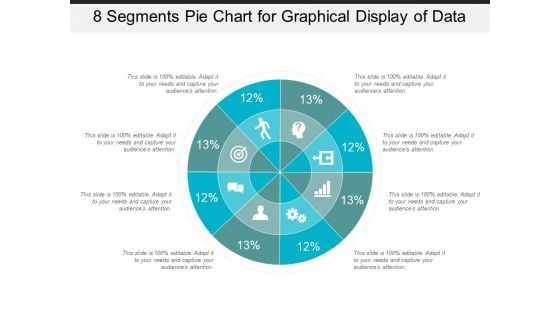
8 Segments Pie Chart For Graphical Display Of Data Ppt PowerPoint Presentation Infographic Template Templates
This is a 8 segments pie chart for graphical display of data ppt powerpoint presentation infographic template templates. This is a eight stage process. The stages in this process are 6 piece pie chart, 6 segment pie chart, 6 parts pie chart.


 Continue with Email

 Home
Home


