Bar Chart
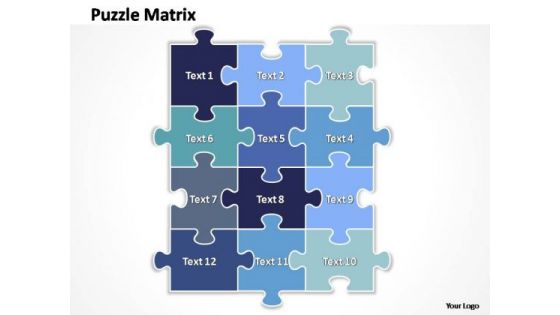
PowerPoint Slide Layout Chart Rectangular Jigsaw Puzzle Ppt Template
PowerPoint Slide layout Chart Rectangular Jigsaw Puzzle PPT Template- It is all there in bits and pieces. Individual components well researched and understood in their place. Now you need to get it all together to form the complete picture and reach the goal. You have the ideas and plans on how to go about it. Use this template to illustrate your method, piece by piece, and interlock the whole process in the minds of your audience.-PowerPoint Slide layout Chart Rectangular Jigsaw Puzzle PPT Template Address eco-clubs with our PowerPoint Slide Layout Chart Rectangular Jigsaw Puzzle Ppt Template. Advocate curbing of carbon emissions.
Food Macros Chart In Powerpoint And Google Slides Cpb
Presenting our innovatively designed set of slides titled Food Macros Chart In Powerpoint And Google Slides Cpb. This completely editable PowerPoint graphic exhibits Food Macros Chart that will help you convey the message impactfully. It can be accessed with Google Slides and is available in both standard screen and widescreen aspect ratios. Apart from this, you can download this well structured PowerPoint template design in different formats like PDF, JPG, and PNG. So, click the download button now to gain full access to this PPT design. Our Food Macros Chart In Powerpoint And Google Slides Cpb are topically designed to provide an attractive backdrop to any subject. Use them to look like a presentation pro.
Ursodeoxycholic Acid Dosage Chart In Powerpoint And Google Slides Cpb
Introducing our well designed Ursodeoxycholic Acid Dosage Chart In Powerpoint And Google Slides Cpb This PowerPoint design presents information on topics like Ursodeoxycholic Acid Dosage Chart As it is predesigned it helps boost your confidence level. It also makes you a better presenter because of its high quality content and graphics. This PPT layout can be downloaded and used in different formats like PDF, PNG, and JPG. Not only this, it is available in both Standard Screen and Widescreen aspect ratios for your convenience. Therefore, click on the download button now to persuade and impress your audience. Our Ursodeoxycholic Acid Dosage Chart In Powerpoint And Google Slides Cpb are topically designed to provide an attractive backdrop to any subject. Use them to look like a presentation pro.
Vaccines Effectiveness Chart In Powerpoint And Google Slides Cpb
Presenting our innovatively designed set of slides titled Vaccines Effectiveness Chart In Powerpoint And Google Slides Cpb. This completely editable PowerPoint graphic exhibits Vaccines Effectiveness Chart that will help you convey the message impactfully. It can be accessed with Google Slides and is available in both standard screen and widescreen aspect ratios. Apart from this, you can download this well structured PowerPoint template design in different formats like PDF, JPG, and PNG. So, click the download button now to gain full access to this PPT design. Our Vaccines Effectiveness Chart In Powerpoint And Google Slides Cpb are topically designed to provide an attractive backdrop to any subject. Use them to look like a presentation pro.
Kindle Tablet Comparison Chart In Powerpoint And Google Slides Cpb
Introducing our well designed Kindle Tablet Comparison Chart In Powerpoint And Google Slides Cpb This PowerPoint design presents information on topics like Kindle Tablet Comparison Chart As it is predesigned it helps boost your confidence level. It also makes you a better presenter because of its high quality content and graphics. This PPT layout can be downloaded and used in different formats like PDF, PNG, and JPG. Not only this, it is available in both Standard Screen and Widescreen aspect ratios for your convenience. Therefore, click on the download button now to persuade and impress your audience. Our Kindle Tablet Comparison Chart In Powerpoint And Google Slides Cpb are topically designed to provide an attractive backdrop to any subject. Use them to look like a presentation pro.
Blood Pressure Chart In Powerpoint And Google Slides Cpb
Introducing our well designed Blood Pressure Chart In Powerpoint And Google Slides Cpb. This PowerPoint design presents information on topics like Blood Pressure Chart. As it is predesigned it helps boost your confidence level. It also makes you a better presenter because of its high quality content and graphics. This PPT layout can be downloaded and used in different formats like PDF, PNG, and JPG. Not only this, it is available in both Standard Screen and Widescreen aspect ratios for your convenience. Therefore, click on the download button now to persuade and impress your audience. Our Blood Pressure Chart In Powerpoint And Google Slides Cpb are topically designed to provide an attractive backdrop to any subject. Use them to look like a presentation pro.
Hockey Cage Size Chart In Powerpoint And Google Slides Cpb
Presenting our innovatively designed set of slides titled Hockey Cage Size Chart In Powerpoint And Google Slides Cpb. This completely editable PowerPoint graphic exhibits Hockey Cage Size Chart that will help you convey the message impactfully. It can be accessed with Google Slides and is available in both standard screen and widescreen aspect ratios. Apart from this, you can download this well structured PowerPoint template design in different formats like PDF, JPG, and PNG. So, click the download button now to gain full access to this PPT design. Our Hockey Cage Size Chart In Powerpoint And Google Slides Cpb are topically designed to provide an attractive backdrop to any subject. Use them to look like a presentation pro.
Dehydration Headache Location Chart In Powerpoint And Google Slides Cpb
Introducing our well designed Dehydration Headache Location Chart In Powerpoint And Google Slides Cpb. This PowerPoint design presents information on topics like Dehydration Headache Location Chart. As it is predesigned it helps boost your confidence level. It also makes you a better presenter because of its high quality content and graphics. This PPT layout can be downloaded and used in different formats like PDF, PNG, and JPG. Not only this, it is available in both Standard Screen and Widescreen aspect ratios for your convenience. Therefore, click on the download button now to persuade and impress your audience. Our Dehydration Headache Location Chart In Powerpoint And Google Slides Cpb are topically designed to provide an attractive backdrop to any subject. Use them to look like a presentation pro.
Should Oxygen Levels Chart In Powerpoint And Google Slides Cpb
Presenting our innovatively designed set of slides titled Should Oxygen Levels Chart In Powerpoint And Google Slides Cpb This completely editable PowerPoint graphic exhibits Should Oxygen Levels Chart that will help you convey the message impactfully. It can be accessed with Google Slides and is available in both standard screen and widescreen aspect ratios. Apart from this, you can download this well structured PowerPoint template design in different formats like PDF, JPG, and PNG. So, click the download button now to gain full access to this PPT design. Our Should Oxygen Levels Chart In Powerpoint And Google Slides Cpb are topically designed to provide an attractive backdrop to any subject. Use them to look like a presentation pro.
Comparison Chart Template Powerpoint In Powerpoint And Google Slides Cpb
Introducing our well-designed Comparison Chart Template Powerpoint In Powerpoint And Google Slides Cpb. This PowerPoint design presents information on topics like Comparison Chart Template Powerpoint. As it is predesigned it helps boost your confidence level. It also makes you a better presenter because of its high-quality content and graphics. This PPT layout can be downloaded and used in different formats like PDF, PNG, and JPG. Not only this, it is available in both Standard Screen and Widescreen aspect ratios for your convenience. Therefore, click on the download button now to persuade and impress your audience. Our Comparison Chart Template Powerpoint In Powerpoint And Google Slides Cpb are topically designed to provide an attractive backdrop to any subject. Use them to look like a presentation pro.
Language Milestone Timeline Chart In Powerpoint And Google Slides Cpb
Presenting our innovatively-designed set of slides titled Language Milestone Timeline Chart In Powerpoint And Google Slides Cpb. This completely editable PowerPoint graphic exhibits Language Milestone Timeline Chart that will help you convey the message impactfully. It can be accessed with Google Slides and is available in both standard screen and widescreen aspect ratios. Apart from this, you can download this well-structured PowerPoint template design in different formats like PDF, JPG, and PNG. So, click the download button now to gain full access to this PPT design. Our Language Milestone Timeline Chart In Powerpoint And Google Slides Cpb are topically designed to provide an attractive backdrop to any subject. Use them to look like a presentation pro.
Processor Comparison Chart In Powerpoint And Google Slides Cpb
Introducing our well-designed Processor Comparison Chart In Powerpoint And Google Slides Cpb. This PowerPoint design presents information on topics like Processor Comparison Chart. As it is predesigned it helps boost your confidence level. It also makes you a better presenter because of its high-quality content and graphics. This PPT layout can be downloaded and used in different formats like PDF, PNG, and JPG. Not only this, it is available in both Standard Screen and Widescreen aspect ratios for your convenience. Therefore, click on the download button now to persuade and impress your audience. Our Processor Comparison Chart In Powerpoint And Google Slides Cpb are topically designed to provide an attractive backdrop to any subject. Use them to look like a presentation pro.
Design Chart Paper In Powerpoint And Google Slides Cpb
Introducing our well designed Design Chart Paper In Powerpoint And Google Slides Cpb. This PowerPoint design presents information on topics like Design Chart Paper. As it is predesigned it helps boost your confidence level. It also makes you a better presenter because of its high quality content and graphics. This PPT layout can be downloaded and used in different formats like PDF, PNG, and JPG. Not only this, it is available in both Standard Screen and Widescreen aspect ratios for your convenience. Therefore, click on the download button now to persuade and impress your audience. Our Design Chart Paper In Powerpoint And Google Slides Cpb are topically designed to provide an attractive backdrop to any subject. Use them to look like a presentation pro.
Conversion Chart Calculator In Powerpoint And Google Slides Cpb
Introducing our well designed Conversion Chart Calculator In Powerpoint And Google Slides Cpb. This PowerPoint design presents information on topics like Conversion Chart Calculator. As it is predesigned it helps boost your confidence level. It also makes you a better presenter because of its high quality content and graphics. This PPT layout can be downloaded and used in different formats like PDF, PNG, and JPG. Not only this, it is available in both Standard Screen and Widescreen aspect ratios for your convenience. Therefore, click on the download button now to persuade and impress your audience. Our Conversion Chart Calculator In Powerpoint And Google Slides Cpb are topically designed to provide an attractive backdrop to any subject. Use them to look like a presentation pro.

Organizational Hierarchy Chart Food And Grocery Retail Ppt Example
This slide covers hierarchy chart for supermarket or grocery store. It involves regional managers, merchandising, public relations and vice president distribution. Are you in need of a template that can accommodate all of your creative concepts This one is crafted professionally and can be altered to fit any style. Use it with Google Slides or PowerPoint. Include striking photographs, symbols, depictions, and other visuals. Fill, move around, or remove text boxes as desired. Test out color palettes and font mixtures. Edit and save your work, or work with colleagues. Download Organizational Hierarchy Chart Food And Grocery Retail Ppt Example and observe how to make your presentation outstanding. Give an impeccable presentation to your group and make your presentation unforgettable. This slide covers hierarchy chart for supermarket or grocery store. It involves regional managers, merchandising, public relations and vice president distribution.
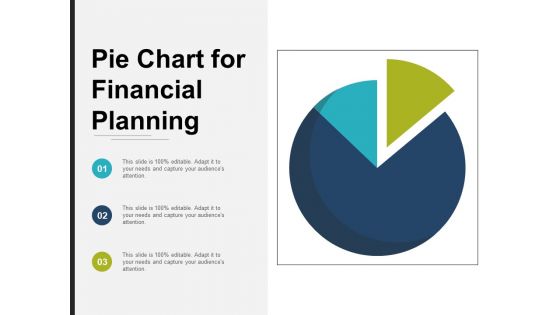
Pie Chart For Financial Planning Ppt PowerPoint Presentation Professional Aids
This is a pie chart for financial planning ppt powerpoint presentation professional aids. This is a three stage process. The stages in this process are sectioned circle, segmented circle, partitioned circle.
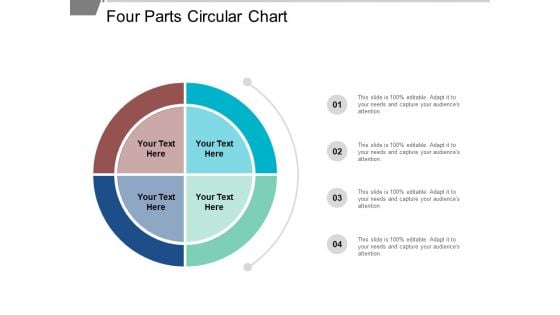
Four Parts Circular Chart Ppt PowerPoint Presentation Styles Skills
This is a four parts circular chart ppt powerpoint presentation styles skills. This is a four stage process. The stages in this process are sectioned circle, segmented circle, partitioned circle.
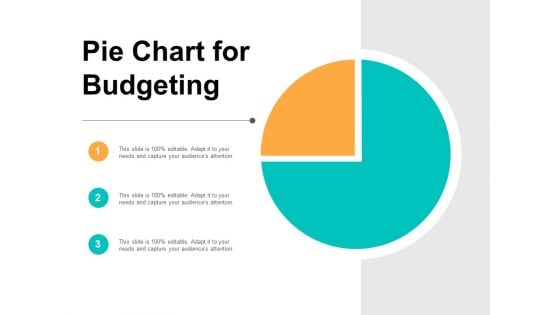
Pie Chart For Budgeting Ppt PowerPoint Presentation Pictures Vector
This is a pie chart for budgeting ppt powerpoint presentation pictures vector. This is a three stage process. The stages in this process are sectioned circle, segmented circle, partitioned circle.
Pie Chart For Data Comparison Ppt PowerPoint Presentation Portfolio Layouts
This is a pie chart for data comparison ppt powerpoint presentation portfolio layouts. This is a four stage process. The stages in this process are sectioned circle, segmented circle, partitioned circle.
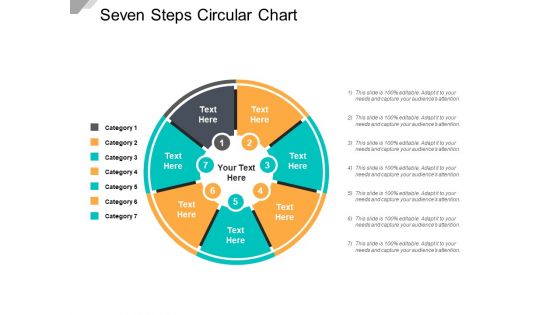
Seven Steps Circular Chart Ppt PowerPoint Presentation Infographics Designs
This is a seven steps circular chart ppt powerpoint presentation infographics designs. This is a seven stage process. The stages in this process are sectioned circle, segmented circle, partitioned circle.
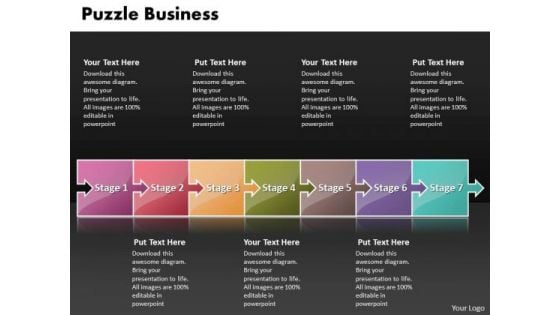
Ppt Puzzle New Business PowerPoint Presentation Process Flow Chart Templates
PPT puzzle new business powerpoint presentation process flow chart Templates-This Diagram shows how items are related to one another. Present your views using our innovative slide and be assured of leaving a lasting impression.-PPT puzzle new business powerpoint presentation process flow chart Templates-Abstract, Arrow, Backgrounds, Business, Computer, Concepts, Connection, Cooperation, Creativity, Crowd, Design, Digital, Digitally, Electric, Equalizer, Generated, Graph, Graphic, Group, Icon, Ideas, Illustration, Image, Individuality, Isolated, Leader, Leadership, Link, Motivation, Music, Objects, Order, Part, Pattern, Piece, Playing, Puzzle Dazzle the audience with your thoughts. Our Ppt Puzzle New Business PowerPoint Presentation Process Flow Chart Templates will leave them wide-eyed.
Risk Tracker Chart Of The Production One Pager Documents
This one pager covers the risk tracker chart of the company that can be used to track the risk factors and how the company is planning to overcome the same. Presenting you an exemplary Risk Tracker Chart Of The Production One Pager Documents. Our one-pager comprises all the must-have essentials of an inclusive document. You can edit it with ease, as its layout is completely editable. With such freedom, you can tweak its design and other elements to your requirements. Download this Risk Tracker Chart Of The Production One Pager Documents brilliant piece now.
Risk Tracker Chart Of The Enterprise One Pager Documents
This one pager covers the risk tracker chart of the company that can be used to track the risk factors and how the company is planning to overcome the same. Presenting you an exemplary Risk Tracker Chart Of The Enterprise One Pager Documents. Our one-pager comprises all the must-have essentials of an inclusive document. You can edit it with ease, as its layout is completely editable. With such freedom, you can tweak its design and other elements to your requirements. Download this Risk Tracker Chart Of The Enterprise One Pager Documents brilliant piece now.
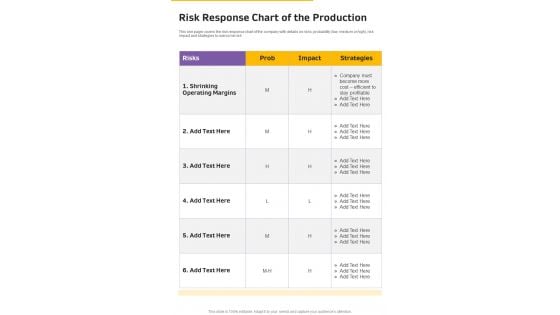
Risk Response Chart Of The Production One Pager Documents
This one pager covers the risk response chart of the company with details on risks, probability low, medium or high, risk impact and strategies to overcome risk. Presenting you a fantastic Risk Response Chart Of The Production One Pager Documents. This piece is crafted on hours of research and professional design efforts to ensure you have the best resource. It is completely editable and its design allow you to rehash its elements to suit your needs. Get this Risk Response Chart Of The Production One Pager Documents A4 One-pager now.
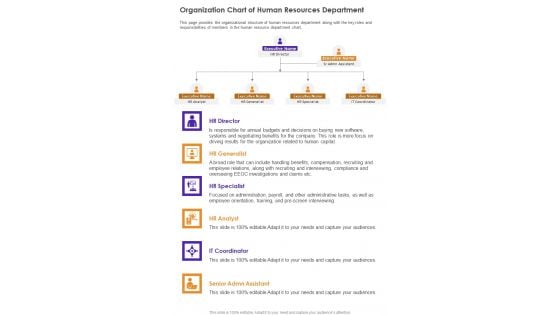
Organization Chart Of Human Resources Department One Pager Documents
This page provides the organizational structure of human resources department along with the key roles and responsibilities of members in the human resource department chart. Presenting you an exemplary Organization Chart Of Human Resources Department One Pager Documents. Our one-pager comprises all the must-have essentials of an inclusive document. You can edit it with ease, as its layout is completely editable. With such freedom, you can tweak its design and other elements to your requirements. Download this Organization Chart Of Human Resources Department One Pager Documents brilliant piece now.

Risk Response Chart Of The Enterprise One Pager Documents
This one pager covers the risk response chart of the company with details on risks, probability low, medium or high, risk impact and strategies to overcome risk. Presenting you a fantastic Risk Response Chart Of The Enterprise One Pager Documents. This piece is crafted on hours of research and professional design efforts to ensure you have the best resource. It is completely editable and its design allow you to rehash its elements to suit your needs. Get this Risk Response Chart Of The Enterprise One Pager Documents A4 One-pager now.
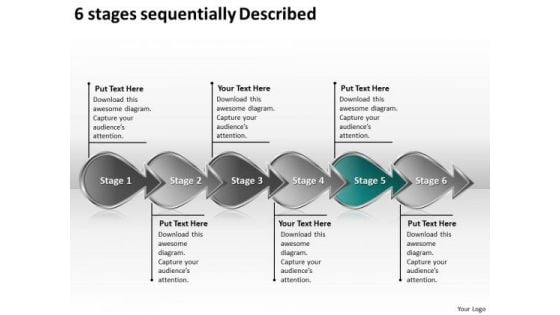
6 Stages Sequentially Described Strategic Planning Flow Chart PowerPoint Slides
We present our 6 stages sequentially described strategic planning flow chart PowerPoint Slides.Download and present our Arrows PowerPoint Templates because you can Refine them all as you take them through the numerous filtering stages of the funnel of your quality control process. Use our Business PowerPoint Templates because project your ideas to you colleagues and complete the full picture. Use our Competition PowerPoint Templates because it shows various choices to be made. Present our Design PowerPoint Templates because Our PowerPoint Templates and Slides will Embellish your thoughts. They will help you illustrate the brilliance of your ideas. Use our Shapes PowerPoint Templates because Our PowerPoint Templates and Slides offer you the needful to organise your thoughts. Use them to list out your views in a logical sequence.Use these PowerPoint slides for presentations relating to arrow, arrows, block, business, chart, design, development, diagram, direction, element, flow, flowchart, graph, linear, management, organization, process, program, section, sign, solution, symbol. The prominent colors used in the PowerPoint template are Green, Gray, Black. Professionals tell us our 6 stages sequentially described strategic planning flow chart PowerPoint Slides are Romantic. The feedback we get is that our business PowerPoint templates and PPT Slides are Festive. We assure you our 6 stages sequentially described strategic planning flow chart PowerPoint Slides are Attractive. Customers tell us our chart PowerPoint templates and PPT Slides will make you look like a winner. Presenters tell us our 6 stages sequentially described strategic planning flow chart PowerPoint Slides are Fun. People tell us our business PowerPoint templates and PPT Slides are topically designed to provide an attractive backdrop to any subject. Go aerial with our 6 Stages Sequentially Described Strategic Planning Flow Chart PowerPoint Slides. Give them a bird's eye view of the conditions.
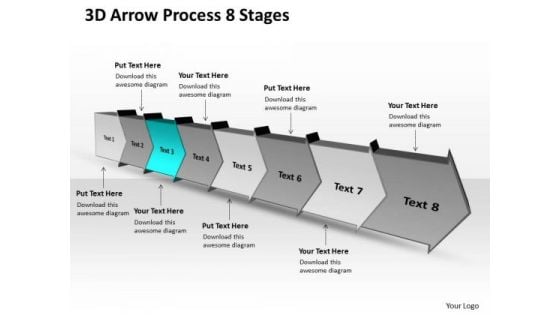
3d Arrow Process 8 Stages Production Flow Chart PowerPoint Slides
We present our 3d arrow process 8 stages production flow chart PowerPoint Slides. Use our Arrows PowerPoint Templates because, coincidentally it always points to the top. Use our Business PowerPoint Templates because, Leadership Template: - Show them the way, be Captain of the ship and lead them to new shores. Use our Design PowerPoint Templates because, Health of the determines the quality of our lives. Use our Signs PowerPoint Templates because, you have some great folks working with you, thinking with you. Use our Metaphor PowerPoint Templates because, It has inspired a whole new world of medical endeavor. Use these PowerPoint slides for presentations relating to Arrow, Arrows Block, Business, Chart, Design, Development, Diagram, Direction, Element, Flow, Flowchart, Graph, Linear, Management, Organization, Process, Program, Section, Sign, Solution, Symbol. The prominent colors used in the PowerPoint template are Blue, Gray, and Black Our 3d Arrow Process 8 Stages Production Flow Chart PowerPoint Slides deliver the bounty you deserve. Earn ample dividends from your efforts.
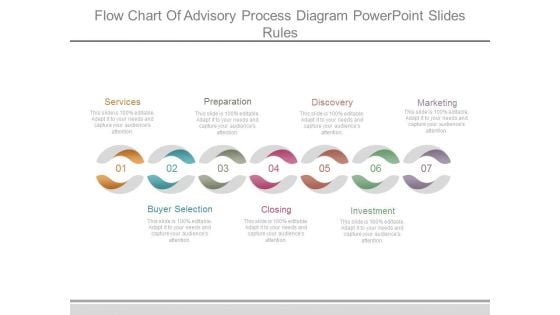
Flow Chart Of Advisory Process Diagram Powerpoint Slides Rules
This is a flow chart of advisory process diagram powerpoint slides rules. This is a seven stage process. The stages in this process are services, buyer selection, preparation, closing, discovery, investment, marketing.
Management Organizational Chart Ppt PowerPoint Presentation Portfolio Icon
This is a management organizational chart ppt powerpoint presentation portfolio icon. This is a three stage process. The stages in this process are tony williams, bill durbin, david johnson, robert fowler, kate jeter.
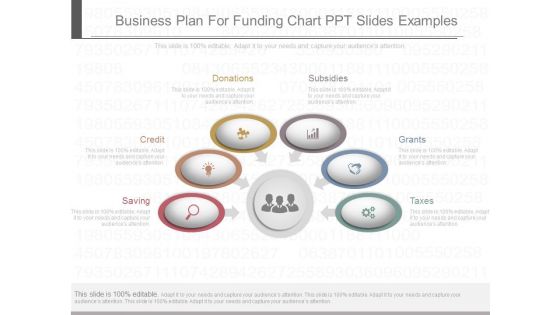
Business Plan For Funding Chart Ppt Slides Examples
This is a business plan for funding chart ppt slides examples. This is a five stage process. The stages in this process are saving, credit, donations, subsidies, grants, taxes.
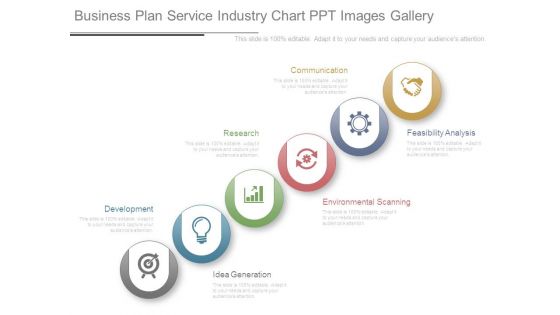
Business Plan Service Industry Chart Ppt Images Gallery
This is a business plan service industry chart ppt images gallery. This is a six stage process. The stages in this process are development, research, communication, idea generation, environmental scanning, feasibility analysis.
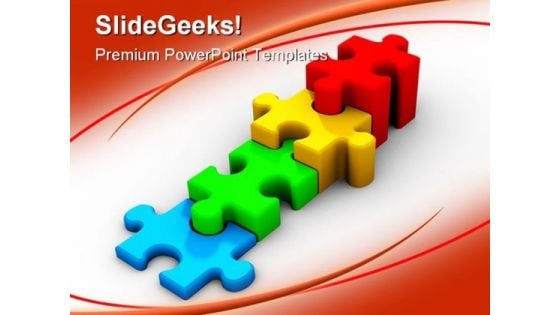
Puzzles Chart Business PowerPoint Background And Template 1210
Microsoft PowerPoint Template and Background with Stair formed from pieces of the puzzle - 3d render Arm yourself with our Puzzles Chart Business PowerPoint Background And Template 1210. Carry your thoughts safely across.
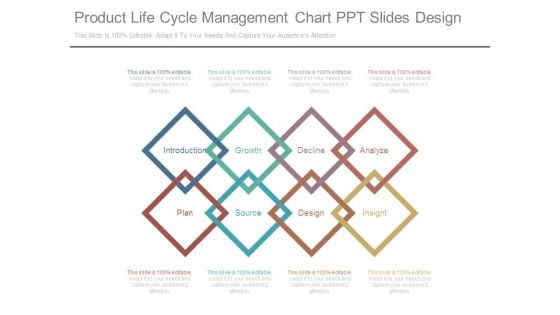
Product Life Cycle Management Chart Ppt Slides Design
This is a product life cycle management chart ppt slides design. This is a eight stage process. The stages in this process are introduction, growth, decline, analyze, plan, source, design, insight.
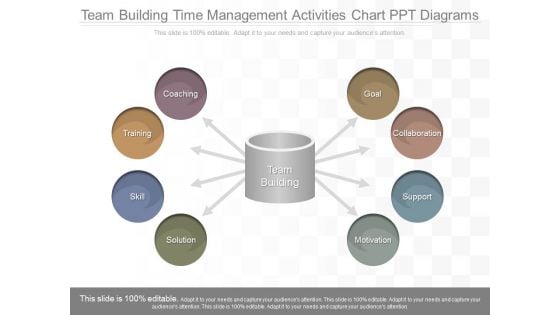
Team Building Time Management Activities Chart Ppt Diagrams
This is a team building time management activities chart ppt diagrams. This is a eight stage process. The stages in this process are goal, collaboration, support, motivation, solution, skill, training, coaching.
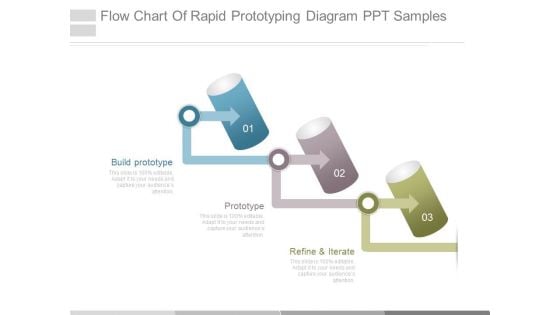
Flow Chart Of Rapid Prototyping Diagram Ppt Samples
This is a flow chart of rapid prototyping diagram ppt samples. This is a three stage process. The stages in this process are build prototype, prototype, refine and iterate.
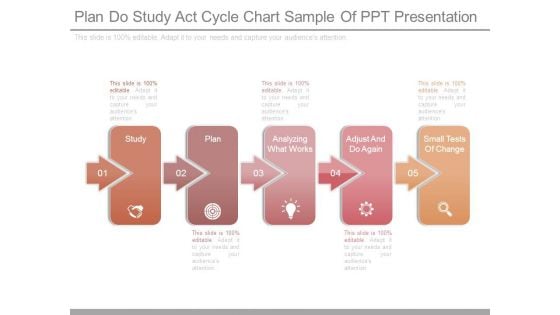
Plan Do Study Act Cycle Chart Sample Of Ppt Presentation
This is a plan do study act cycle chart sample of ppt presentation. This is a five stage process. The stages in this process are study, plan, analyzing what works, adjust and do again, small tests of change.
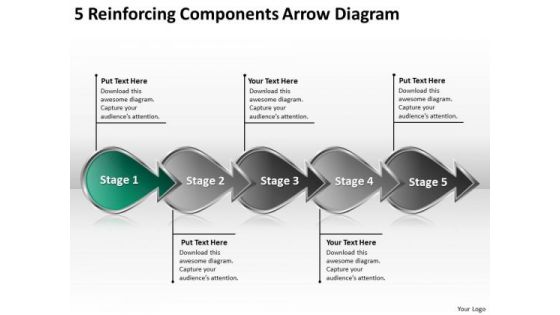
5 Reinforcing Components Arrow Diagram Typical Flow Chart PowerPoint Templates
We present our 5 reinforcing components arrow diagram typical flow chart PowerPoint templates.Download our Arrows PowerPoint Templates because they highlight the depth of your thought process. Download our Business PowerPoint Templates because you have had your share of being a goldfish in a small bowl.you are ready to launch out and spread your wings. Use our Competition PowerPoint Templates because this is an appropriate layout to convince your team that they have the ability to score a tEN every time. Download and present our Design PowerPoint Templates because it is all there in bits and pieces. Download our Shapes PowerPoint Templates because it Shines the light on your thoughts and motivates your team to improve the quality of celebration for all around you.Use these PowerPoint slides for presentations relating to arrow, arrows, block, business, chart, design, development, diagram, direction, element, flow, flowchart, graph, linear, management, organization, process, program, section, sign, solution, symbol. The prominent colors used in the PowerPoint template are Green, Gray, Black. Professionals tell us our 5 reinforcing components arrow diagram typical flow chart PowerPoint templates are Bright. The feedback we get is that our direction PowerPoint templates and PPT Slides are the best it can get when it comes to presenting. We assure you our 5 reinforcing components arrow diagram typical flow chart PowerPoint templates are Spectacular. Customers tell us our business PowerPoint templates and PPT Slides are Glamorous. Presenters tell us our 5 reinforcing components arrow diagram typical flow chart PowerPoint templates are Nostalgic. People tell us our block PowerPoint templates and PPT Slides are Second to none. Conduct meetings with our 5 Reinforcing Components Arrow Diagram Typical Flow Chart PowerPoint Templates. Download without worries with our money back guaranteee.
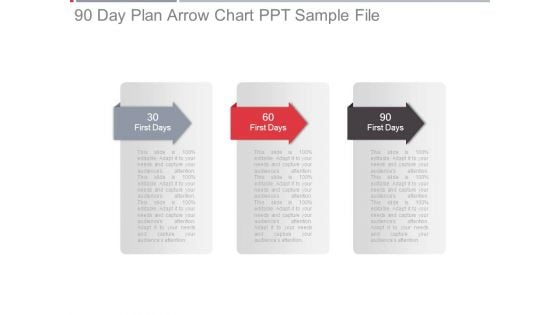
90 Day Plan Arrow Chart Ppt Sample File
This is a 90 day plan arrow chart ppt sample file. This is a three stage process. The stages in this process are 30 first days, 60 first days, 90 first days.
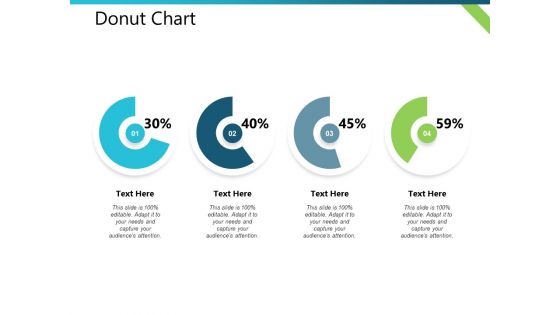
Donut Chart Distribution Plan Ppt PowerPoint Presentation Visual Aids Outline
This is a donut chart distribution plan ppt powerpoint presentation visual aids outline. This is a four stage process. The stages in this process are business, management, financial, marketing, strategy.
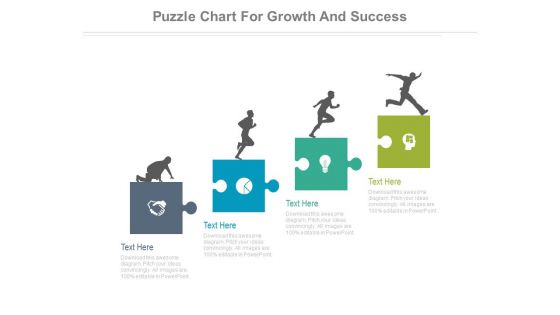
Puzzle Chart For Growth And Success Powerpoint Slides
This business slide has been designed with puzzle chart and icons. This diagram has been designed to display concepts of growth and success. Develop your strategy and communicate with your team with this professional slide design.
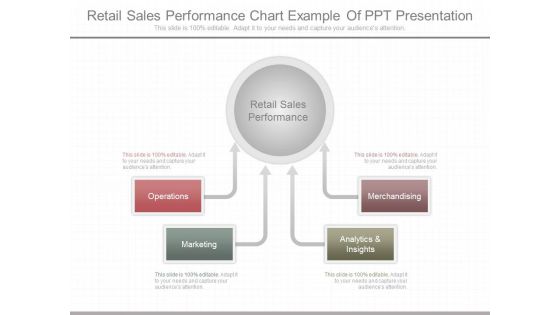
Retail Sales Performance Chart Example Of Ppt Presentation
This is a retail sales performance chart example of ppt presentation. This is a four stage process. The stages in this process are operations, marketing, analytics and insights, merchandising, retail sales performance.
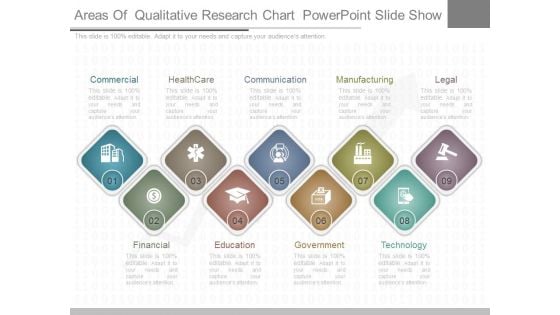
Areas Of Qualitative Research Chart Powerpoint Slide Show
This is a areas of qualitative research chart powerpoint slide show. This is a nine stage process. The stages in this process are commercial, healthcare, communication, manufacturing, legal, financial,, education, government, technology.
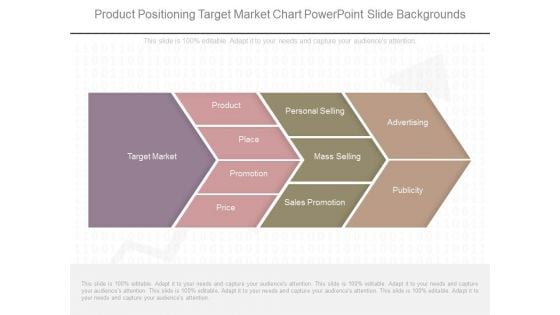
Product Positioning Target Market Chart Powerpoint Slide Backgrounds
This is a product positioning target market chart powerpoint slide backgrounds. This is a four stage process. The stages in this process are target market, product, place, promotion, price, personal selling, mass selling, sales promotion, advertising, publicity.
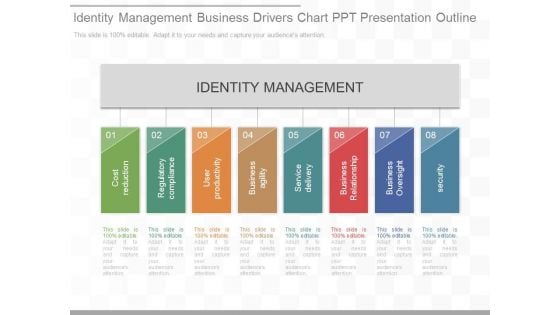
Identity Management Business Drivers Chart Ppt Presentation Outline
This is a identity management business drivers chart ppt presentation outline. This is a eight stage process. The stages in this process are identity management, cost reduction, regulatory compliance, user productivity, business agility, service delivery, business relationship, business oversight, security.
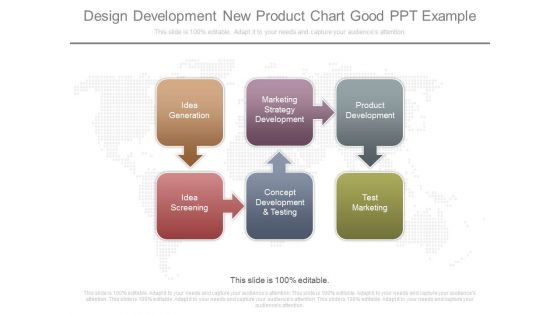
Design Development New Product Chart Good Ppt Example
This is a design development new product chart good ppt example. This is a six stage process. The stages in this process are idea generation, marketing strategy development, product development, idea screening, concept development and testing, test marketing.
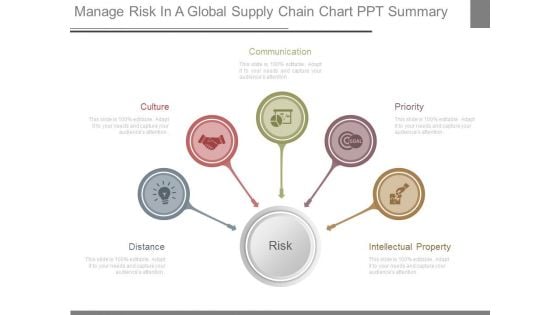
Manage Risk In A Global Supply Chain Chart Ppt Summary
This is a Manage Risk In A Global Supply Chain Chart Ppt Summary. This is a five stage process. The stages in this process are distance, culture, communication, priority, intellectual property, risk.
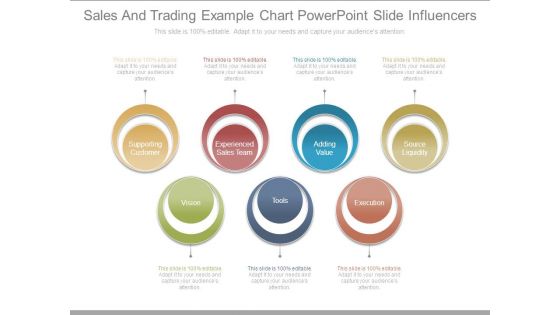
Sales And Trading Example Chart Powerpoint Slide Influencers
This is a sales and trading example chart powerpoint slide influencers. This is a seven stage process. The stages in this process are supporting customer, experienced sales team, adding value, source liquidity, vision, tools, execution.
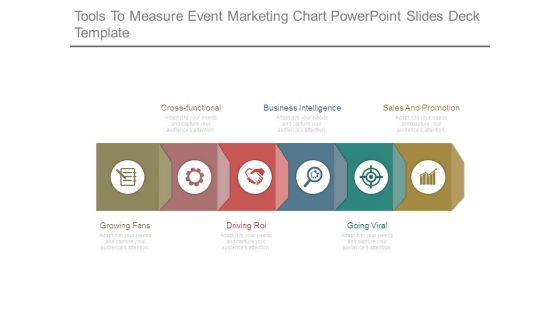
Tools To Measure Event Marketing Chart Powerpoint Slides Deck Template
This is a tools to measure event marketing chart powerpoint slides deck template. This is a six stage process. The stages in this process are cross functional, business intelligence, sales and promotion, going viral, driving roi, growing fans.
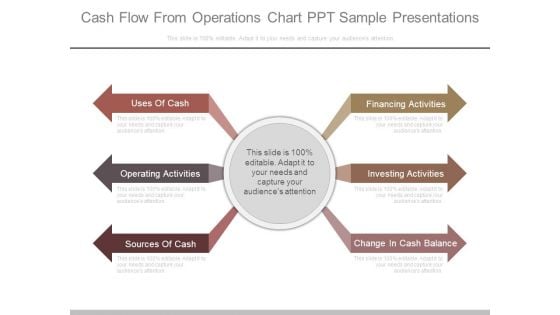
Cash Flow From Operations Chart Ppt Sample Presentations
This is a cash flow from operations chart ppt sample presentations. This is a six stage process. The stages in this process are uses of cash, operating activities, sources of cash, financing activities, investing activities, change in cash balance.
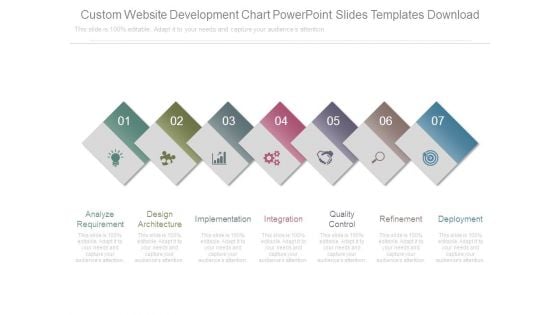
Custom Website Development Chart Powerpoint Slides Templates Download
This is a custom website development chart powerpoint slides templates download. This is a six stage process. The stages in this process are analyze requirement, design architecture, implementation, integration, quality control, refinement, deployment.
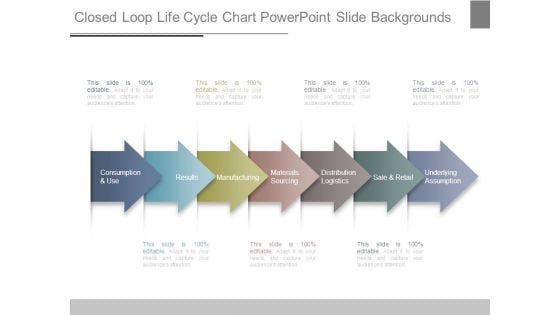
Closed Loop Life Cycle Chart Powerpoint Slide Backgrounds
This is a closed loop life cycle chart powerpoint slide backgrounds. This is a seven stage process. The stages in this process are consumption and use, results, manufacturing, materials sourcing, distribution logistics, sale and retail, underlying assumption.
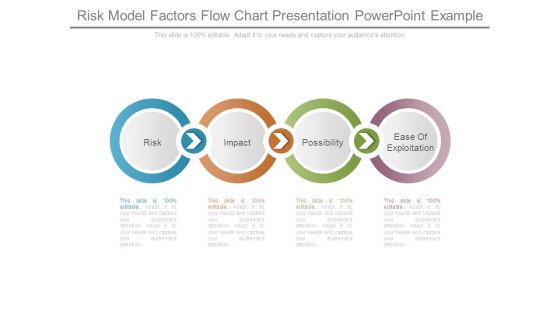
Risk Model Factors Flow Chart Presentation Powerpoint Example
This is a risk model factors flow chart presentation powerpoint example. This is a four stage process. The stages in this process are risk, impact, possibility, ease of exploitation.
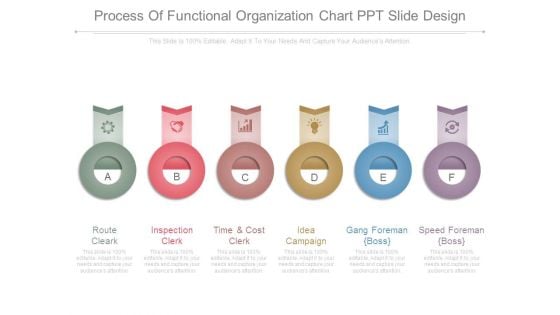
Process Of Functional Organization Chart Ppt Slide Design
This is a process of functional organization chart ppt slide design. This is a six stage process. The stages in this process are route cleark, inspection clerk, time and cost clerk, idea campaign, gang foreman boss, speed foreman boss.
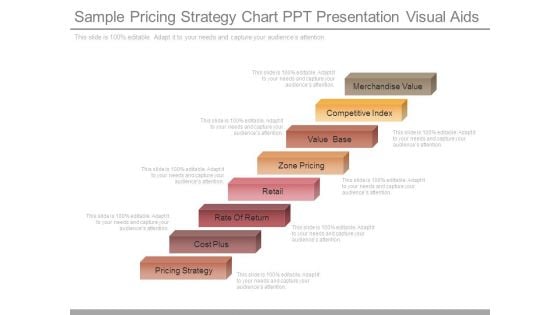
Sample Pricing Strategy Chart Ppt Presentation Visual Aids
This is a sample pricing strategy chart ppt presentation visual aids. This is a eight stage process. The stages in this process are merchandise value, competitive index, value base, zone pricing, retail, rate of return, cost plus, pricing strategy.
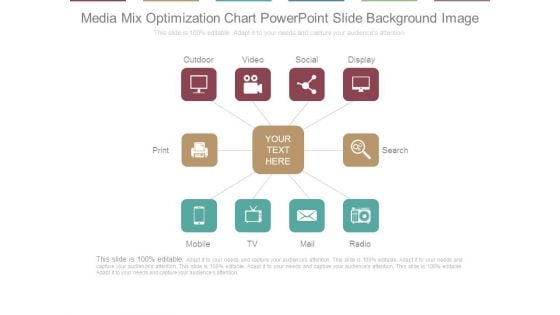
Media Mix Optimization Chart Powerpoint Slide Background Image
This is a media mix optimization chart powerpoint slide background image. This is a ten stage process. The stages in this process are outdoor, video, social, display, search, radio, mail, tv, mobile, print.
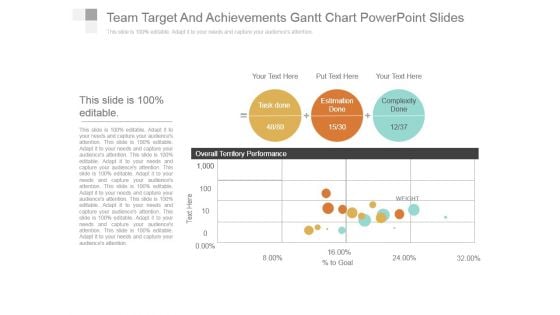
Team Target And Achievements Gantt Chart Powerpoint Slides
This is a team target and achievements gantt chart powerpoint slides. This is a three stage process. The stages in this process are task done, estimation done, complexity done, overall territory performance.
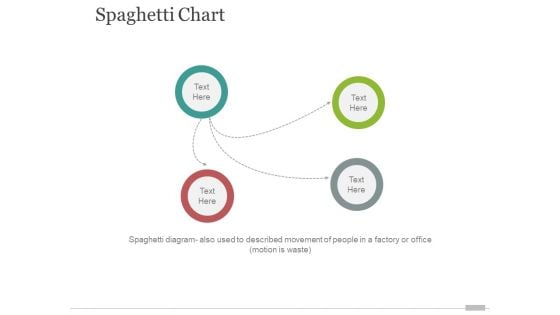
spaghetti chart template 1 ppt powerpoint presentation styles design inspiration
This is a spaghetti chart template 1 ppt powerpoint presentation styles design inspiration. This is a three stage process. The stages in this process are business, marketing, circle, management.
Product Marketing Department Team Organizational Chart Icon Professional PDF
Persuade your audience using this Product Marketing Department Team Organizational Chart Icon Professional PDF. This PPT design covers three stages, thus making it a great tool to use. It also caters to a variety of topics including Team Organizational Chart Icon, Product Marketing Department. Download this PPT design now to present a convincing pitch that not only emphasizes the topic but also showcases your presentation skills.
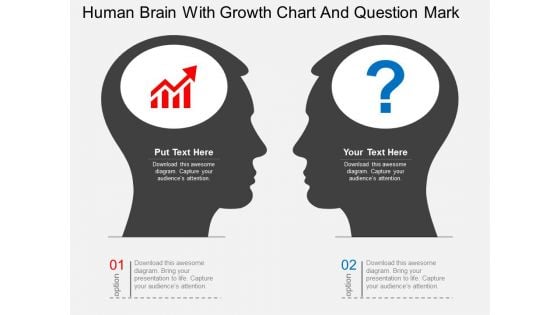
Human Brain With Growth Chart And Question Mark Powerpoint Template
This PowerPoint template has been designed with graphics of human brain with growth chart and question mark. This diagram can be used to display creative thinking in business. Capture the attention of your audience with this slide.


 Continue with Email

 Home
Home


