Bar Chart
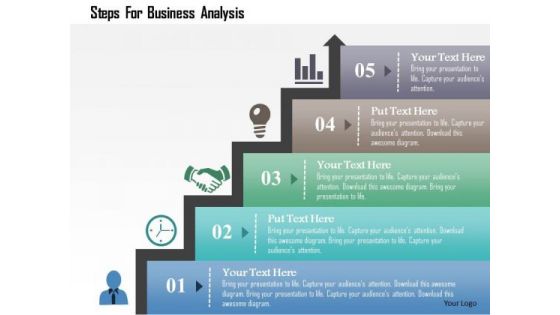
Business Diagram Steps For Business Analysis Presentation Template
Concept of time management has been defined in this power point template diagram. This diagram contains the graphic of bar graph. Amplify your thoughts via this appropriate business template.
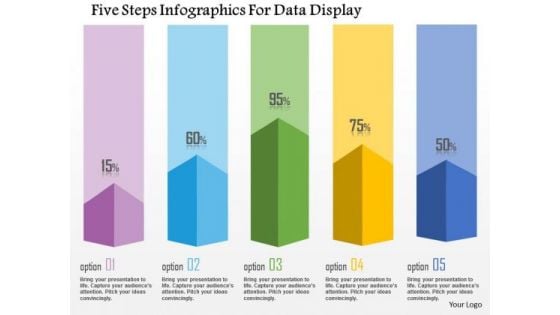
Business Diagram Five Steps Infographics For Data Display Presentation Template
This business diagram has been designed with graphic of five staged info graphics. This diagram can be used to display statistical information. Use this bar graph for your business and sales related presentations.

Business Diagram Thermometer Graphics Indicating Progress Presentation Template
This power point template diagram has been designed with graphic of thermometer and bar graph. This PPT contains the concept of growth analysis. Use this PPT for business and marketing related presentations.
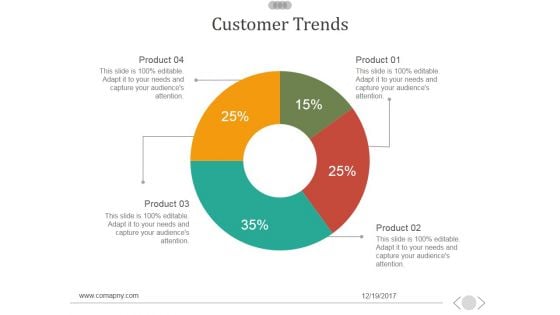
Customer Trends Template 1 Ppt PowerPoint Presentation Diagrams
This is a customer trends template 1 ppt powerpoint presentation diagrams. This is a five stage process. The stages in this process are business, marketing, bar graph, finance, management.
Revenue Split By Product Segment Template 1 Ppt PowerPoint Presentation Ideas Icons
This is a revenue split by product segment template 1 ppt powerpoint presentation ideas icons. This is a four stage process. The stages in this process are business, marketing, success, bar graph, product.
Down Sales Business PowerPoint Templates And PowerPoint Backgrounds 0711
Microsoft PowerPoint Template and Background with a bar graph in red showing possible sale Get classy with our Down Sales Business PowerPoint Templates And PowerPoint Backgrounds 0711. They ensure A-list clients.
Adjusted Roce Template 2 Ppt PowerPoint Presentation Icon Pictures
This is a adjusted roce template 2 ppt powerpoint presentation icon pictures. This is a five stage process. The stages in this process are bar graph, finance, percentage, business, marketing.
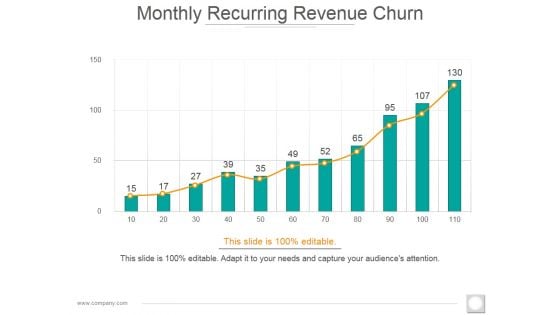
Monthly Recurring Revenue Churn Template 2 Ppt PowerPoint Presentation Diagram Images
This is a monthly recurring revenue churn template 2 ppt powerpoint presentation diagram images. This is a eleven stage process. The stages in this process are bar graph, growth, success, business, marketing.
Monthly Recurring Revenue Churn Template 1 Ppt PowerPoint Presentation Icon Microsoft
This is a monthly recurring revenue churn template 1 ppt powerpoint presentation icon microsoft. This is a four stage process. The stages in this process are bar graph, growth, success, business, marketing.
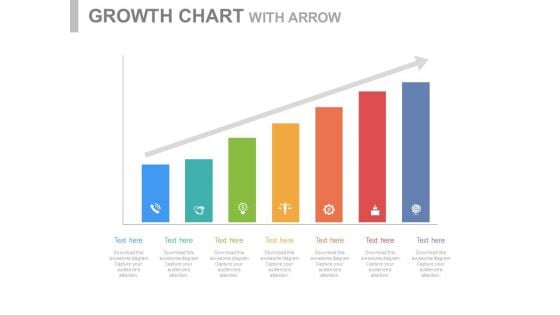
Steps For Developing Strategic Plan Powerpoint Slides
This PowerPoint template is useful for setting goals and developing strategies. This PPT background has a design of seven steps bar graph. This PPT slide is suitable for topics like corporate strategic planning.

Helping People Business PowerPoint Templates And PowerPoint Backgrounds 0811
Microsoft PowerPoint Template and Background with teamwork help up bar graph Watch your plans evolve before your eyes. Our Helping People Business PowerPoint Templates And PowerPoint Backgrounds 0811 are helpful in connecting the dots.
Product Launch Budget Plan Ppt PowerPoint Presentation Icon Slide
This is a product launch budget plan ppt powerpoint presentation icon slide. This is a seven stage process. The stages in this process are bar graph, icons, percentage, finance, business.

Leadership01 Success PowerPoint Themes And PowerPoint Slides 0811
Microsoft PowerPoint Theme and Slide with one figure stands atop the highest bar in a graph Summarize plans with our Leadership01 Success PowerPoint Themes And PowerPoint Slides 0811. Download without worries with our money back guaranteee.
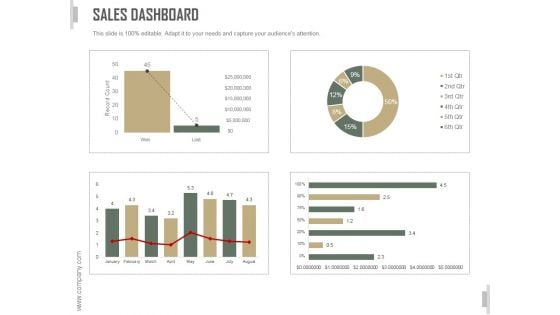
Sales Dashboard Slide Ppt PowerPoint Presentation Template
This is a sales dashboard slide ppt powerpoint presentation template. This is a three stage process. The stages in this process are business, strategy, marketing, analysis, bar graph, growth strategy.
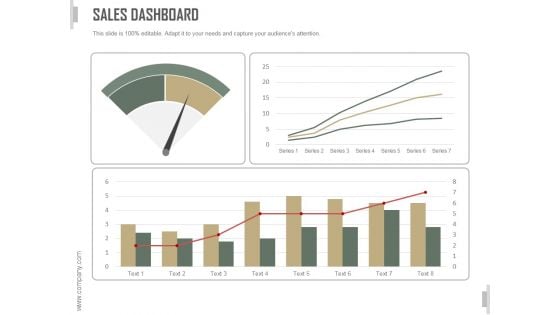
Sales Dashboard Ppt PowerPoint Presentation Design Templates
This is a sales dashboard ppt powerpoint presentation design templates. This is a four stage process. The stages in this process are business, strategy, marketing, analysis, bar graph, growth strategy.
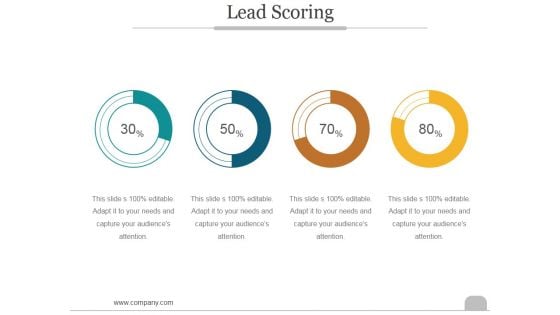
Lead Scoring Template Ppt PowerPoint Presentation Model
This is a lead scoring template ppt powerpoint presentation model. This is a four stage process. The stages in this process are business, marketing, success, bar graph, lead scoring.
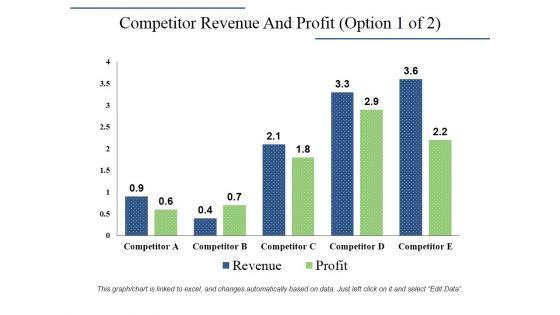
Competitor Revenue And Profit Template 1 Ppt PowerPoint Presentation Infographic Template Designs Download
This is a competitor revenue and profit template 1 ppt powerpoint presentation infographic template designs download. This is a five stage process. The stages in this process are revenue, profit, competitor, bar graph, growth.

Marketing Business Sales PowerPoint Backgrounds And Templates 1210
Microsoft PowerPoint Template and Background with Business bar graph on monitor with arrow indicator Cast our Marketing Business Sales PowerPoint Backgrounds And Templates 1210 in your act. The audience will call for an encore.

Increasing Costs Of Education PowerPoint Backgrounds And Templates 1210
Microsoft PowerPoint Template and Background with Cost of Education Increasing in 3d With Bar Graph Bond with the boys with our Increasing Costs Of Education PowerPoint Backgrounds And Templates 1210. They enhance espirit-de-corps.

Global Business Finance PowerPoint Templates And PowerPoint Backgrounds 0211
Microsoft PowerPoint Template and Background with gold globe with many gold coins representing bar graph Start driving innovation with our Global Business Finance PowerPoint Templates And PowerPoint Backgrounds 0211. They will make you look good.

Marketing Business Finance PowerPoint Templates And PowerPoint Backgrounds 0211
Microsoft PowerPoint Template and Background with business bar graph and arrow shows growth Conclude the debate with our Marketing Business Finance PowerPoint Templates And PowerPoint Backgrounds 0211. Arrive at the right answers with your thoughts.

Sales Shopping Holidays PowerPoint Templates And PowerPoint Backgrounds 0611
Microsoft PowerPoint Template and Background with gold bar graph showing the growth of sales Our Sales Shopping Holidays PowerPoint Templates And PowerPoint Backgrounds 0611 are created with professional insight. Use them and give your group a a winning vision.

Business Growth Finance PowerPoint Templates And PowerPoint Backgrounds 0811
Microsoft PowerPoint Template and Background with business growth thumbs up on a golden bar graph Appear like a genius with our Business Growth Finance PowerPoint Templates And PowerPoint Backgrounds 0811. You will come out on top.

Leadership01 Success PowerPoint Templates And PowerPoint Backgrounds 0811
Microsoft PowerPoint Template and Background with one figure stands a top the highest bar in a graph Lay the bait with our Leadership01 Success PowerPoint Templates And PowerPoint Backgrounds 0811. Get them hooked onto your ideas.
Business Concept Background PowerPoint Templates And PowerPoint Backgrounds 1211
Microsoft PowerPoint Template and Background with abstract bar graphs with world map Win applauses with our Business Concept Background PowerPoint Templates And PowerPoint Backgrounds 1211. You will come out on top.
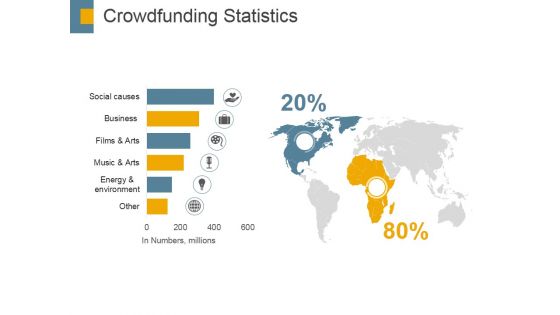
Crowdfunding Statistics Template 1 Ppt PowerPoint Presentation Good
This is a crowdfunding statistics template 1 ppt powerpoint presentation good. This is a two stage process. The stages in this process are business, location, geographical, finance, bar graph, marketing.
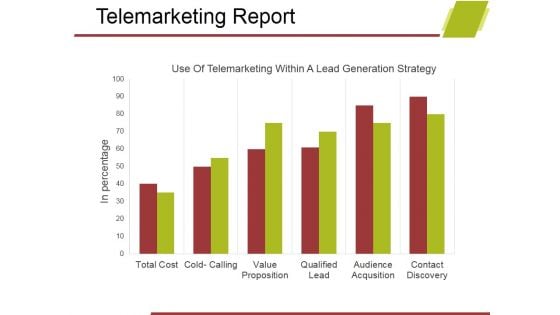
Telemarketing Report Template 1 Ppt PowerPoint Presentation Show Design Ideas
This is a telemarketing report template 1 ppt powerpoint presentation show design ideas. This is a six stage process. The stages in this process are business, bar graph, marketing, analysis, growth, strategy.
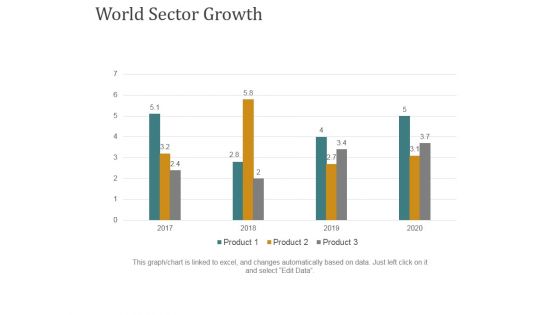
World Sector Growth Ppt PowerPoint Presentation Gallery Template
This is a world sector growth ppt powerpoint presentation gallery template. This is a four stage process. The stages in this process are business, bar graph, finance, marketing, strategy.
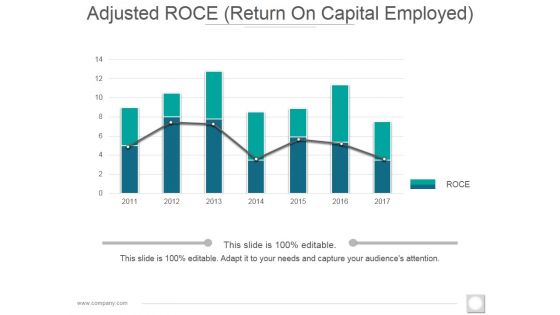
Adjusted Roce Template 1 Ppt PowerPoint Presentation Styles Background Designs
This is a adjusted roce template 1 ppt powerpoint presentation styles background designs. This is a seven stage process. The stages in this process are bar graph, finance, year, business, marketing.
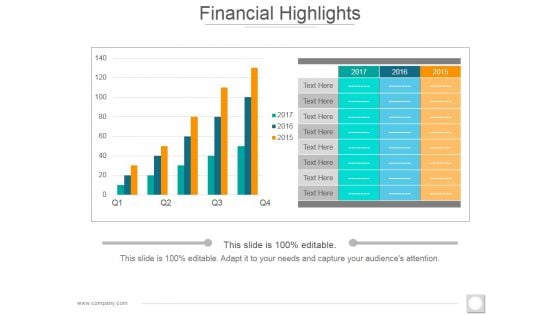
Financial Highlights Template 2 Ppt PowerPoint Presentation Slides Ideas
This is a financial highlights template 2 ppt powerpoint presentation slides ideas. This is a two stage process. The stages in this process are bar graph, growth, success, business, marketing.
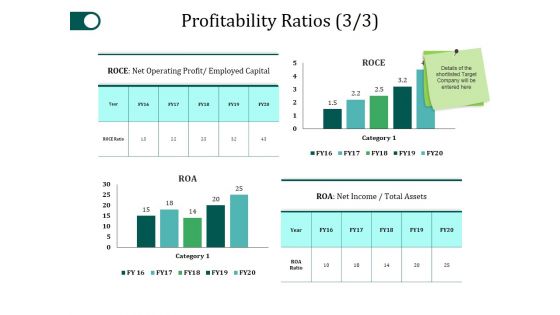
Profitability Ratios Template 3 Ppt PowerPoint Presentation Gallery Slide Portrait
This is a profitability ratios template 3 ppt powerpoint presentation gallery slide portrait. This is a four stage process. The stages in this process are category, roce, net income, business, bar graph.

Global Business Finance PowerPoint Themes And PowerPoint Slides 0211

Marketing Business Finance PowerPoint Themes And PowerPoint Slides 0211
Microsoft PowerPoint Theme and Slide with business bar graph and arrow shows growth Analyse the effect of different factors. Our Marketing Business Finance PowerPoint Themes And PowerPoint Slides 0211 will give them equal attention.

Business Growth Finance PowerPoint Themes And PowerPoint Slides 0811
Microsoft PowerPoint Theme and Slide with business growth thumbs up on a golden bar graph Our Business Growth Finance PowerPoint Themes And PowerPoint Slides 0811 encourage an ethical approach. Exhort your team to stay above board.
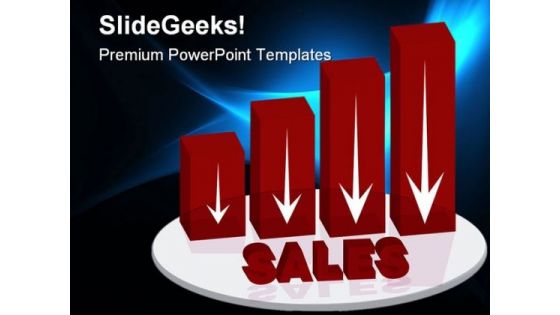
Down Sales Business PowerPoint Themes And PowerPoint Slides 0711
Microsoft PowerPoint Theme and Slide with a bar graph in red showing possible sale Show your dreams with our Down Sales Business PowerPoint Themes And PowerPoint Slides 0711. You will come out on top.
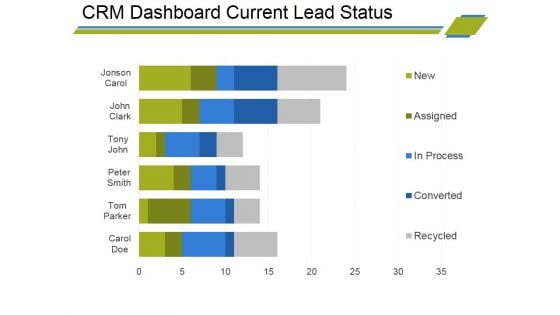
Crm Dashboard Current Lead Status Ppt PowerPoint Presentation Infographic Template Visual Aids
This is a crm dashboard current lead status ppt powerpoint presentation infographic template visual aids. This is a six stage process. The stages in this process are bar graph, finance, marketing, strategy, business, analysis.
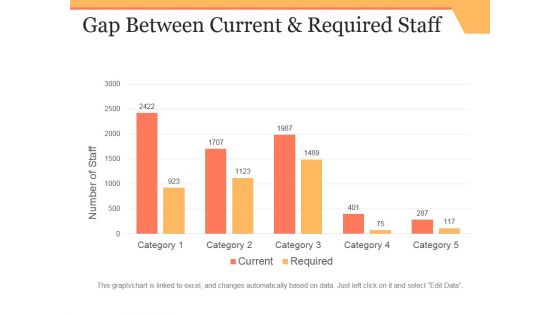
Gap Between Current And Required Staff Ppt PowerPoint Presentation Infographic Template Microsoft
This is a gap between current and required staff ppt powerpoint presentation infographic template microsoft. This is a five stage process. The stages in this process are business, bar graph, finance, marketing, strategy, analysis.
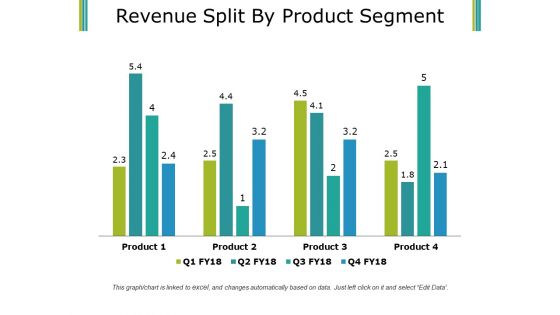
Revenue Split By Product Segment Template 1 Ppt PowerPoint Presentation Infographics Smartart
This is a revenue split by product segment template 1 ppt powerpoint presentation infographics smartart. This is a four stage process. The stages in this process are business, finance, marketing, bar graph, product.
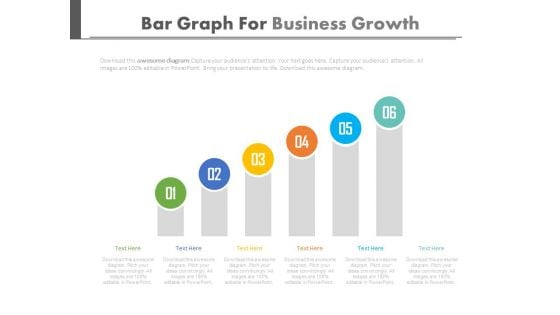
Setting Goals And Developing Strategies Powerpoint Slides
This PowerPoint template is useful for setting goals and developing strategies. This PPT background has a design of six steps bar graph. This PPT slide is suitable for topics like corporate strategic planning.
Increasing Costs Of Education PowerPoint Icon S
Cost of Education Increasing in 3d With Bar Graph Your thoughts will be engraved in the minds of your audience. Our Increasing Costs Of Education PowerPoint Icon S will etch them in.
Clustered Column Ppt PowerPoint Presentation Icon Objects
This is a clustered column ppt powerpoint presentation icon objects. This is a two stage process. The stages in this process are clustered column, product, growth, finance, bar graph.
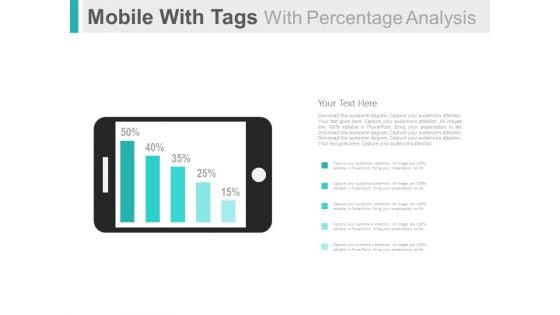
Mobile For Online Survey And Analysis Powerpoint Slides
This PowerPoint template has been designed with graphics of mobile and percentage bar graph. This PPT slide can be used to display online survey and analysis. You can download finance PowerPoint template to prepare awesome presentations.
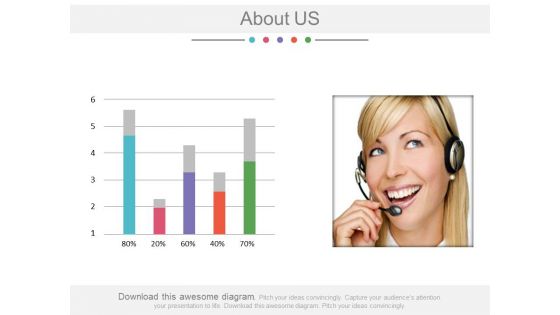
About Us Companys Data Information Powerpoint Slides
Download this PowerPoint template to create an attention grabbing introductory slide. It contains slide bar graph with employee image. Use this professional slide design to build a good reputation of your company.
Data Analytics Ppt PowerPoint Presentation Icon Master Slide
This is a data analytics ppt powerpoint presentation icon master slide. This is a five stage process. The stages in this process are bar graph, growth, success, business, marketing.
Competitors Average Price Product Ppt PowerPoint Presentation Icon Layout
This is a competitors average price product ppt powerpoint presentation icon layout. This is a five stage process. The stages in this process are company, bar graph, finance, business, marketing.
Crm Dashboard Deals By Expected Close Date Ppt PowerPoint Presentation Portfolio Icons
This is a crm dashboard deals by expected close date ppt powerpoint presentation portfolio icons. This is a three stage process. The stages in this process are bar graph, finance, marketing, strategy, business, analysis, growth.
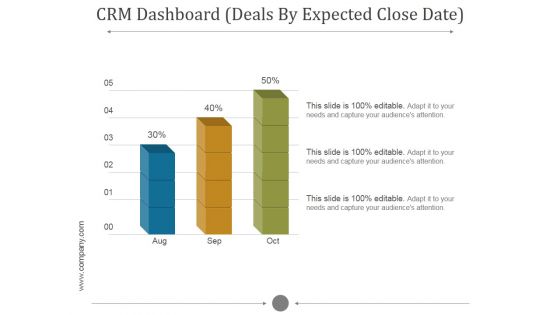
Crm Dashboard Deals By Expected Close Date Ppt PowerPoint Presentation Background Images
This is a crm dashboard deals by expected close date ppt powerpoint presentation background images. This is a five stage process. The stages in this process are bar graph, aug, sep, oct, growth.
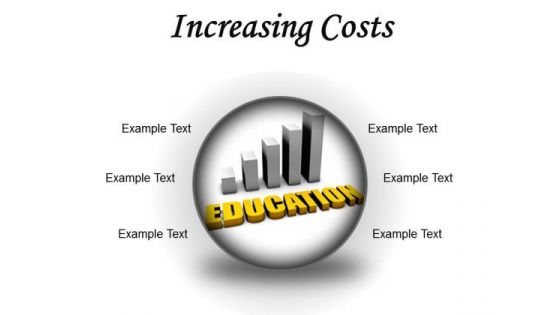
Increasing Costs Of Education PowerPoint Presentation Slides C
Microsoft PowerPoint Slides and Backgrounds with cost of education increasing in with bar graph Bless your plans with our Increasing Costs Of Education PowerPoint Presentation Slides C. You will come out on top.
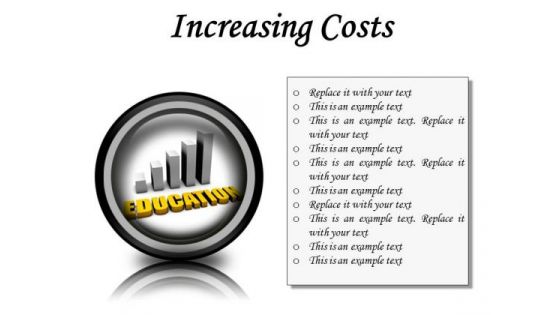
Increasing Costs Of Education PowerPoint Presentation Slides Cc
Microsoft PowerPoint Slides and Backgrounds with cost of education increasing in with bar graph Fan desires with our Increasing Costs Of Education PowerPoint Presentation Slides Cc. Evoke the demand for better achievements.
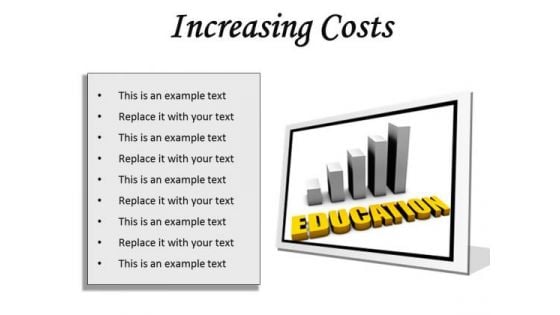
Increasing Costs Of Education PowerPoint Presentation Slides F
Microsoft PowerPoint Slides and Backgrounds with cost of education increasing in with bar graph Add to the fare you have to offer. Put our Increasing Costs Of Education PowerPoint Presentation Slides F on the menu.
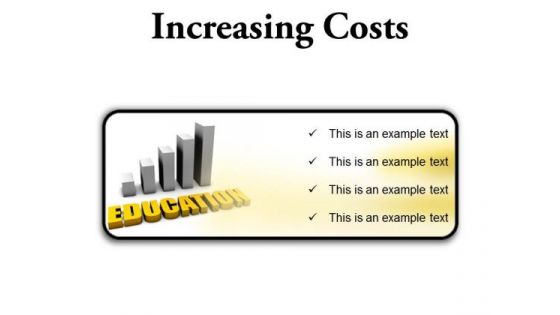
Increasing Costs Of Education PowerPoint Presentation Slides R
Microsoft PowerPoint Slides and Backgrounds with cost of education increasing in with bar graph You will rarely find fault with our Increasing Costs Of Education PowerPoint Presentation Slides R. They are designed by a fastidious team.
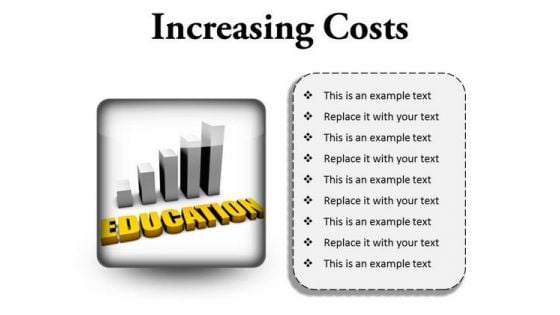
Increasing Costs Of Education PowerPoint Presentation Slides S
Microsoft PowerPoint Slides and Backgrounds with cost of education increasing in with bar graph Exhibit your faith on our Increasing Costs Of Education PowerPoint Presentation Slides S. Your audience will believe in you.

0814 Bargraph Of Dollars Bundles With Arrow Graphic Image Graphics For PowerPoint
This unique image has backdrop of bar graph of dollars bundles with growth arrow. This image displays the concept of financial growth. Define the business growth with this suitable image. Use this image to make outstanding presentations
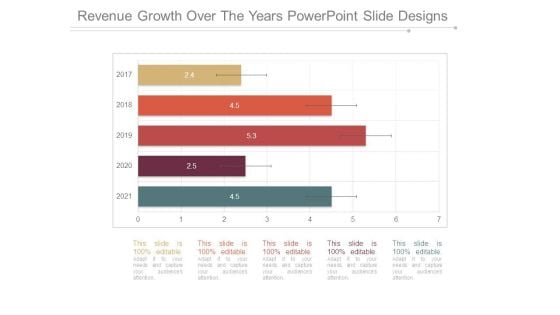
Revenue Growth Over The Years Powerpoint Slide Designs
This is a revenue growth over the years powerpoint slide designs. This is a five stage process. The stages in this process are bar graph, years, business, growth, marketing.
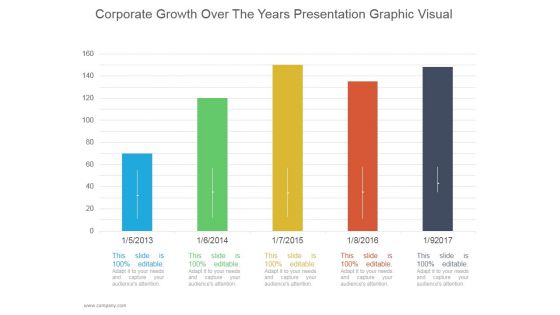
Corporate Growth Over The Years Ppt PowerPoint Presentation Good
This is a corporate growth over the years ppt powerpoint presentation good. This is a five stage process. The stages in this process are business, strategy, marketing, growth, bar graph.
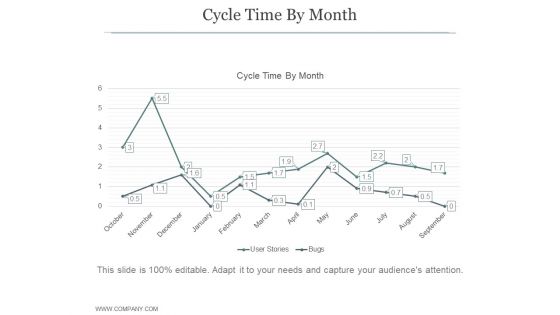
Cycle Time By Month Ppt PowerPoint Presentation Guidelines
This is a cycle time by month ppt powerpoint presentation guidelines. This is a twelve stage process. The stages in this process are business, strategy, marketing, process, arrow, finance, bar graph.
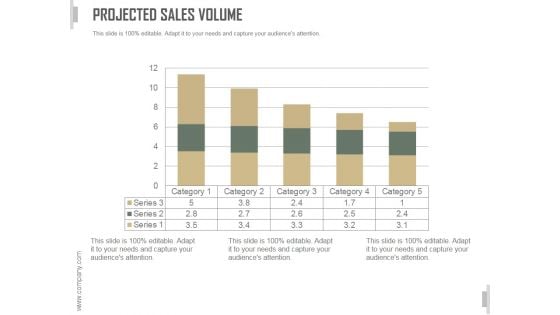
Projected Sales Volume Ppt PowerPoint Presentation Pictures
This is a projected sales volume ppt powerpoint presentation pictures. This is a five stage process. The stages in this process are business, strategy, marketing, analysis, liner process, bar graph.
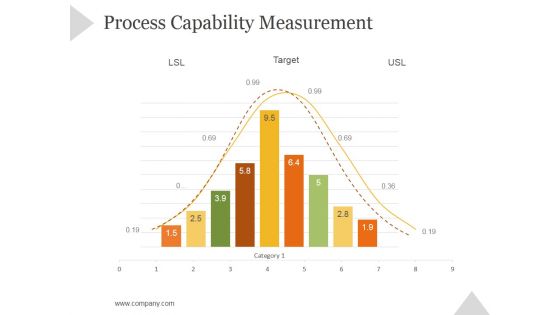
Process Capability Measurement Ppt PowerPoint Presentation Rules
This is a process capability measurement ppt powerpoint presentation rules. This is a nine stage process. The stages in this process are business, strategy, marketing, success, bar graph, growth strategy.
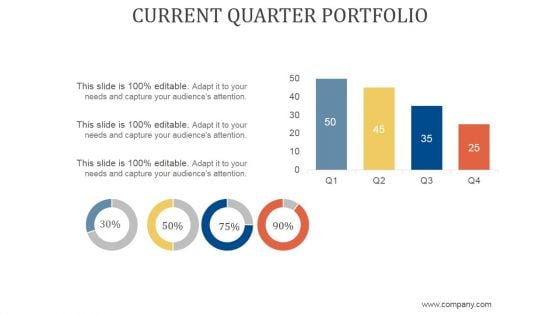
Current Quarter Portfolio Ppt PowerPoint Presentation Visual Aids
This is a current quarter portfolio ppt powerpoint presentation visual aids. This is a two stage process. The stages in this process are business, strategy, marketing, finance, growth strategy, bar graph.
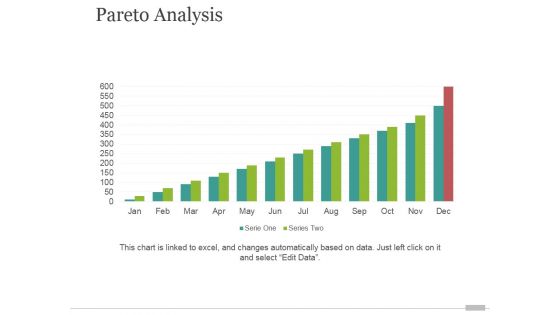
Pareto Analysis Tamplate 2 Ppt PowerPoint Presentation Graphics
This is a pareto analysis tamplate 2 ppt powerpoint presentation graphics. This is a twelve stage process. The stages in this process are bar graph, finance, marketing, strategy, analysis, business.


 Continue with Email

 Home
Home


