Bar Graph
Brand Equity Management To Raise Tracking Kpis To Measure Brand Health And Reputation
This slide represents a dashboard highlighting multiple performance metrics to measure brand health and reputation over time. It includes metrics such as net promoter score, brand awareness, familiarity, consideration, perception, etc. Are you in need of a template that can accommodate all of your creative concepts This one is crafted professionally and can be altered to fit any style. Use it with Google Slides or PowerPoint. Include striking photographs, symbols, depictions, and other visuals. Fill, move around, or remove text boxes as desired. Test out color palettes and font mixtures. Edit and save your work, or work with colleagues. Download Brand Equity Management To Raise Tracking Kpis To Measure Brand Health And Reputation and observe how to make your presentation outstanding. Give an impeccable presentation to your group and make your presentation unforgettable. This slide represents a dashboard highlighting multiple performance metrics to measure brand health and reputation over time. It includes metrics such as net promoter score, brand awareness, familiarity, consideration, perception, etc.
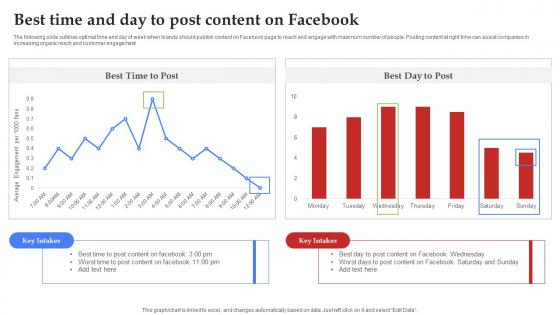
Facebook Marketing Plan Best Time And Day To Post Content On Facebook Strategy SS V
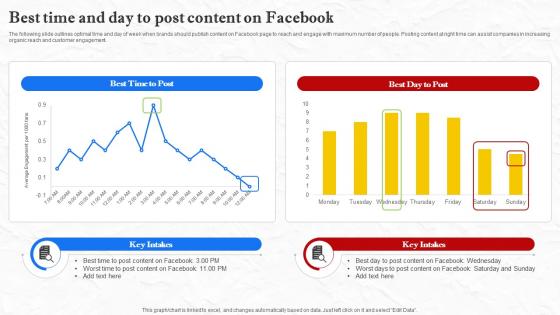
Facebook Marketing Techniques Best Time And Day To Post Content On Facebook Strategy SS V
The following slide outlines optimal time and day of week when brands should publish content on Facebook page to reach and engage with maximum number of people. Posting content at right time can assist companies in increasing organic reach and customer engagement. Present like a pro with Facebook Marketing Techniques Best Time And Day To Post Content On Facebook Strategy SS V. Create beautiful presentations together with your team, using our easy-to-use presentation slides. Share your ideas in real-time and make changes on the fly by downloading our templates. So whether you are in the office, on the go, or in a remote location, you can stay in sync with your team and present your ideas with confidence. With Slidegeeks presentation got a whole lot easier. Grab these presentations today. The following slide outlines optimal time and day of week when brands should publish content on Facebook page to reach and engage with maximum number of people. Posting content at right time can assist companies in increasing organic reach and customer engagement.
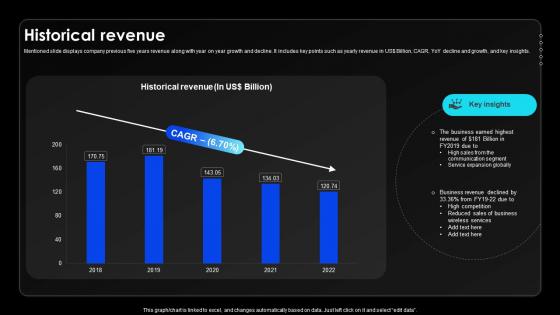
Historical Revenue Wireless Communication Services Provider Company Profile CP SS V
Mentioned slide displays company previous five years revenue along with year on year growth and decline. It includes key points such as yearly revenue in US dollar Billion, CAGR, YoY decline and growth, and key insights.Formulating a presentation can take up a lot of effort and time, so the content and message should always be the primary focus. The visuals of the PowerPoint can enhance the presenters message, so our Historical Revenue Wireless Communication Services Provider Company Profile CP SS V was created to help save time. Instead of worrying about the design, the presenter can concentrate on the message while our designers work on creating the ideal templates for whatever situation is needed. Slidegeeks has experts for everything from amazing designs to valuable content, we have put everything into Historical Revenue Wireless Communication Services Provider Company Profile CP SS V. Mentioned slide displays company previous five years revenue along with year on year growth and decline. It includes key points such as yearly revenue in US dollar Billion, CAGR, YoY decline and growth, and key insights.
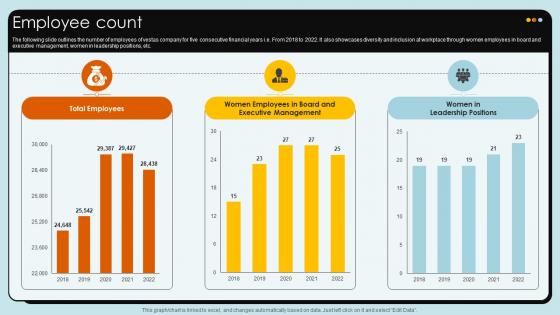
Employee Count Wind Turbines Manufacturer Company Profile CP SS V
The following slide outlines the number of employees of vestas company for five consecutive financial years i.e. From 2018 to 2022. It also showcases diversity and inclusion at workplace through women employees in board and executive management, women in leadership positions, etc.Present like a pro with Employee Count Wind Turbines Manufacturer Company Profile CP SS V. Create beautiful presentations together with your team, using our easy-to-use presentation slides. Share your ideas in real-time and make changes on the fly by downloading our templates. So whether you are in the office, on the go, or in a remote location, you can stay in sync with your team and present your ideas with confidence. With Slidegeeks presentation got a whole lot easier. Grab these presentations today. The following slide outlines the number of employees of vestas company for five consecutive financial years i.e. From 2018 to 2022. It also showcases diversity and inclusion at workplace through women employees in board and executive management, women in leadership positions, etc.
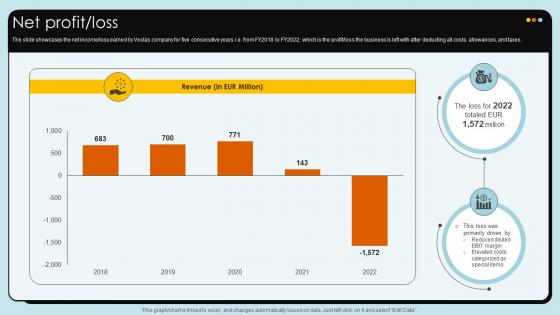
Net Profit Loss Wind Turbines Manufacturer Company Profile CP SS V
The slide showcases the net income or loss earned by Vestas company for five consecutive years i.e. from FY2018 to FY2022, which is the profit or loss the business is left with after deducting all costs, allowances, and taxes.This modern and well-arranged Net Profit Loss Wind Turbines Manufacturer Company Profile CP SS V provides lots of creative possibilities. It is very simple to customize and edit with the Powerpoint Software. Just drag and drop your pictures into the shapes. All facets of this template can be edited with Powerpoint, no extra software is necessary. Add your own material, put your images in the places assigned for them, adjust the colors, and then you can show your slides to the world, with an animated slide included. The slide showcases the net income or loss earned by Vestas company for five consecutive years i.e. from FY2018 to FY2022, which is the profit or loss the business is left with after deducting all costs, allowances, and taxes.
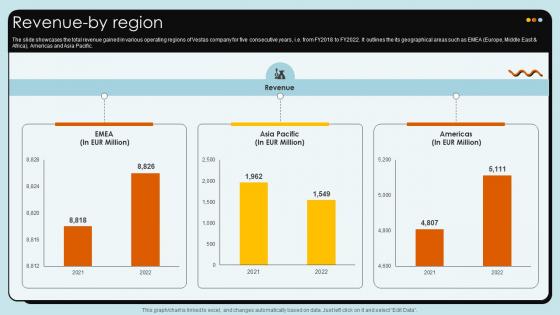
Revenue By Region Wind Turbines Manufacturer Company Profile CP SS V
The slide showcases the total revenue gained in various operating regions of Vestas company for five consecutive years, i.e. from FY2018 to FY2022. It outlines the its geographical areas such as EMEA Europe, Middle East and Africa, Americas and Asia Pacific.Retrieve professionally designed Revenue By Region Wind Turbines Manufacturer Company Profile CP SS V to effectively convey your message and captivate your listeners. Save time by selecting pre-made slideshows that are appropriate for various topics, from business to educational purposes. These themes come in many different styles, from creative to corporate, and all of them are easily adjustable and can be edited quickly. Access them as PowerPoint templates or as Google Slides themes. You do not have to go on a hunt for the perfect presentation because Slidegeeks got you covered from everywhere. The slide showcases the total revenue gained in various operating regions of Vestas company for five consecutive years, i.e. from FY2018 to FY2022. It outlines the its geographical areas such as EMEA Europe, Middle East and Africa, Americas and Asia Pacific.
Cyber Phishing Attacks Tracking Dashboard Man In The Middle Phishing IT
This slide represents the dashboard to track cyber phishing attacks. The purpose of this slide is to provide a graphical representation of cyber attacks occurred in a specific time span. It also depicts the organizations health risk. Formulating a presentation can take up a lot of effort and time, so the content and message should always be the primary focus. The visuals of the PowerPoint can enhance the presenters message, so our Cyber Phishing Attacks Tracking Dashboard Man In The Middle Phishing IT was created to help save time. Instead of worrying about the design, the presenter can concentrate on the message while our designers work on creating the ideal templates for whatever situation is needed. Slidegeeks has experts for everything from amazing designs to valuable content, we have put everything into Cyber Phishing Attacks Tracking Dashboard Man In The Middle Phishing IT This slide represents the dashboard to track cyber phishing attacks. The purpose of this slide is to provide a graphical representation of cyber attacks occurred in a specific time span. It also depicts the organizations health risk.
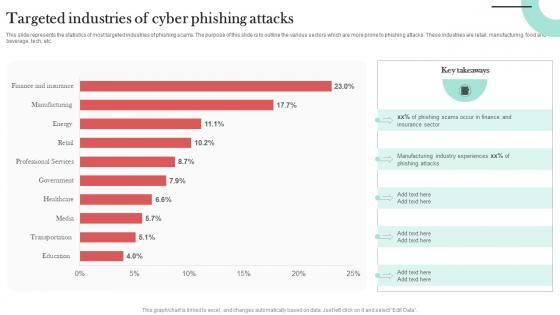
Targeted Industries Of Cyber Phishing Man In The Middle Phishing IT
This slide represents the statistics of most targeted industries of phishing scams. The purpose of this slide is to outline the various sectors which are more prone to phishing attacks. These industries are retail, manufacturing, food and beverage, tech, etc. Coming up with a presentation necessitates that the majority of the effort goes into the content and the message you intend to convey. The visuals of a PowerPoint presentation can only be effective if it supplements and supports the story that is being told. Keeping this in mind our experts created Targeted Industries Of Cyber Phishing Man In The Middle Phishing IT to reduce the time that goes into designing the presentation. This way, you can concentrate on the message while our designers take care of providing you with the right template for the situation. This slide represents the statistics of most targeted industries of phishing scams. The purpose of this slide is to outline the various sectors which are more prone to phishing attacks. These industries are retail, manufacturing, food and beverage, tech, etc.
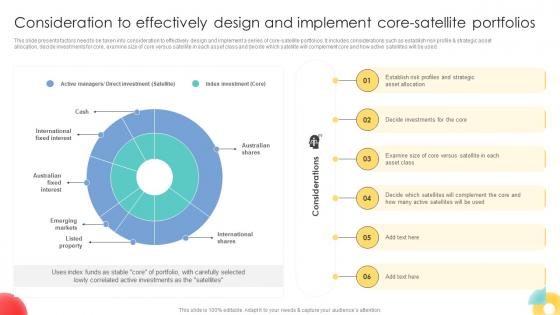
Consideration To Effectively Design And Implement Core Strategic Investment Plan For Optimizing Risk SS V
This slide presents factors need to be taken into consideration to effectively design and implement a series of core-satellite portfolios. It includes considerations such as establish risk profile and strategic asset allocation, decide investments for core, examine size of core versus satellite in each asset class and decide which satellite will complement core and how active satellites will be used.Slidegeeks is here to make your presentations a breeze with Consideration To Effectively Design And Implement Core Strategic Investment Plan For Optimizing Risk SS V With our easy-to-use and customizable templates, you can focus on delivering your ideas rather than worrying about formatting. With a variety of designs to choose from, you are sure to find one that suits your needs. And with animations and unique photos, illustrations, and fonts, you can make your presentation pop. So whether you are giving a sales pitch or presenting to the board, make sure to check out Slidegeeks first This slide presents factors need to be taken into consideration to effectively design and implement a series of core-satellite portfolios. It includes considerations such as establish risk profile and strategic asset allocation, decide investments for core, examine size of core versus satellite in each asset class and decide which satellite will complement core and how active satellites will be used.
Loreal SA Company Profile Makeup And Skincare Market IR SS V
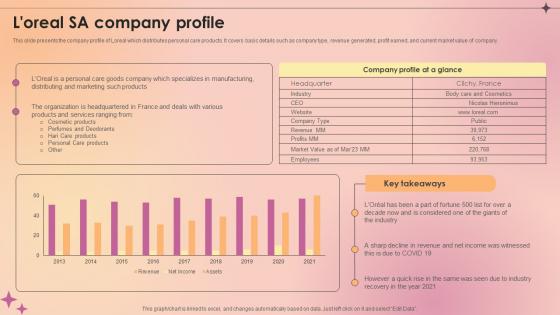
This slide presents the company profile of Loreal which distributes personal care products. It covers basic details such as company type, revenue generated, profit earned, and current market value of company. Formulating a presentation can take up a lot of effort and time, so the content and message should always be the primary focus. The visuals of the PowerPoint can enhance the presenters message, so our Loreal SA Company Profile Makeup And Skincare Market IR SS V was created to help save time. Instead of worrying about the design, the presenter can concentrate on the message while our designers work on creating the ideal templates for whatever situation is needed. Slidegeeks has experts for everything from amazing designs to valuable content, we have put everything into Loreal SA Company Profile Makeup And Skincare Market IR SS V. This slide presents the company profile of Loreal which distributes personal care products. It covers basic details such as company type, revenue generated, profit earned, and current market value of company.

North America Beauty And Personal Care Industry Makeup And Skincare Market IR SS V
This slide presents the North American market size of beauty and personal care products. It highlights key market players, major product segment, import value of beauty and personal care products, millennials and gen Z beauty and personal care products preferences. Coming up with a presentation necessitates that the majority of the effort goes into the content and the message you intend to convey. The visuals of a PowerPoint presentation can only be effective if it supplements and supports the story that is being told. Keeping this in mind our experts created North America Beauty And Personal Care Industry Makeup And Skincare Market IR SS V to reduce the time that goes into designing the presentation. This way, you can concentrate on the message while our designers take care of providing you with the right template for the situation. This slide presents the North American market size of beauty and personal care products. It highlights key market players, major product segment, import value of beauty and personal care products, millennials and gen Z beauty and personal care products preferences.
Unilever Plc Company Profile Makeup And Skincare Market IR SS V
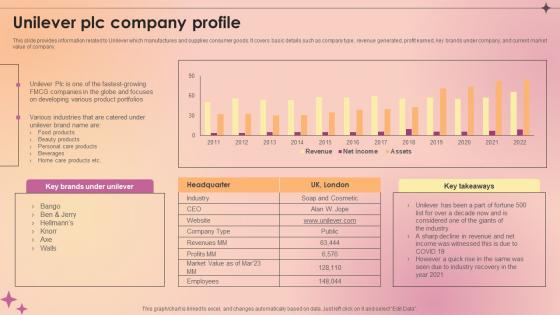
This slide provides information related to Unilever which manufactures and supplies consumer goods. It covers basic details such as company type, revenue generated, profit earned, key brands under company, and current market value of company. Are you searching for a Unilever Plc Company Profile Makeup And Skincare Market IR SS V that is uncluttered, straightforward, and original Its easy to edit, and you can change the colors to suit your personal or business branding. For a presentation that expresses how much effort you have put in, this template is ideal With all of its features, including tables, diagrams, statistics, and lists, its perfect for a business plan presentation. Make your ideas more appealing with these professional slides. Download Unilever Plc Company Profile Makeup And Skincare Market IR SS V from Slidegeeks today. This slide provides information related to Unilever which manufactures and supplies consumer goods. It covers basic details such as company type, revenue generated, profit earned, key brands under company, and current market value of company.
Global Market Analysis Of Crypto Wallets Cryptocurrency Management With Blockchain
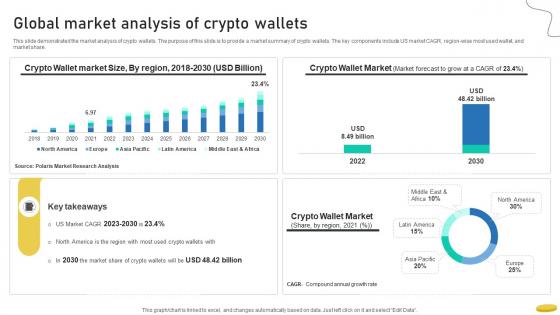
This slide demonstrated the market analysis of crypto wallets. The purpose of this slide is to provide a market summary of crypto wallets. The key components include US market CAGR, region-wise most used wallet, and market share.Retrieve professionally designed Global Market Analysis Of Crypto Wallets Cryptocurrency Management With Blockchain to effectively convey your message and captivate your listeners. Save time by selecting pre-made slideshows that are appropriate for various topics, from business to educational purposes. These themes come in many different styles, from creative to corporate, and all of them are easily adjustable and can be edited quickly. Access them as PowerPoint templates or as Google Slides themes. You do not have to go on a hunt for the perfect presentation because Slidegeeks got you covered from everywhere. This slide demonstrated the market analysis of crypto wallets. The purpose of this slide is to provide a market summary of crypto wallets. The key components include US market CAGR, region-wise most used wallet, and market share.

Data Integration Market Evolution Strategy Data Integration Strategies For Business
This slide highlights the introduction of the data integration market. The purpose of this slide is to provide an overview of the market elements including key market players, market opportunities, market drivers, and market segmentation. Are you in need of a template that can accommodate all of your creative concepts This one is crafted professionally and can be altered to fit any style. Use it with Google Slides or PowerPoint. Include striking photographs, symbols, depictions, and other visuals. Fill, move around, or remove text boxes as desired. Test out color palettes and font mixtures. Edit and save your work, or work with colleagues. Download Data Integration Market Evolution Strategy Data Integration Strategies For Business and observe how to make your presentation outstanding. Give an impeccable presentation to your group and make your presentation unforgettable. This slide highlights the introduction of the data integration market. The purpose of this slide is to provide an overview of the market elements including key market players, market opportunities, market drivers, and market segmentation.

ETL Data Integration Monitoring Dashboard Data Integration Strategies For Business
This slide represents the dashboard to track the data integration implementation plan. The purpose of this slide is to showcase the ETL data integration tools, and the components include data sources, checks, last incident, and last check. Are you searching for a ETL Data Integration Monitoring Dashboard Data Integration Strategies For Business that is uncluttered, straightforward, and original Its easy to edit, and you can change the colors to suit your personal or business branding. For a presentation that expresses how much effort you have put in, this template is ideal With all of its features, including tables, diagrams, statistics, and lists, its perfect for a business plan presentation. Make your ideas more appealing with these professional slides. Download ETL Data Integration Monitoring Dashboard Data Integration Strategies For Business from Slidegeeks today. This slide represents the dashboard to track the data integration implementation plan. The purpose of this slide is to showcase the ETL data integration tools, and the components include data sources, checks, last incident, and last check.
Manual Testing Performance Monitoring Dashboard Gray Box Testing Best Practices
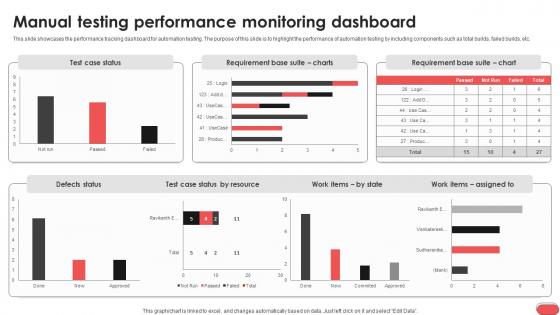
This slide showcases the performance tracking dashboard for automation testing. The purpose of this slide is to highlight the performance of automation testing by including components such as total builds, failed builds, etc. Formulating a presentation can take up a lot of effort and time, so the content and message should always be the primary focus. The visuals of the PowerPoint can enhance the presenters message, so our Manual Testing Performance Monitoring Dashboard Gray Box Testing Best Practices was created to help save time. Instead of worrying about the design, the presenter can concentrate on the message while our designers work on creating the ideal templates for whatever situation is needed. Slidegeeks has experts for everything from amazing designs to valuable content, we have put everything into Manual Testing Performance Monitoring Dashboard Gray Box Testing Best Practices This slide showcases the performance tracking dashboard for automation testing. The purpose of this slide is to highlight the performance of automation testing by including components such as total builds, failed builds, etc.
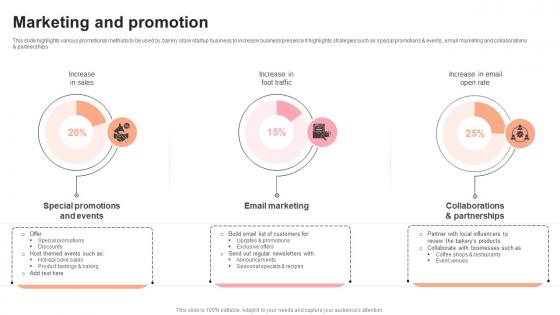
Marketing And Promotion Pastry Shop Market Entry Plan GTM SS V
This slide highlights various promotional methods to be used by bakery store startup business to increase business presence It highlights strategies such as special promotions and events, email marketing and collaborations and partnerships. Are you in need of a template that can accommodate all of your creative concepts This one is crafted professionally and can be altered to fit any style. Use it with Google Slides or PowerPoint. Include striking photographs, symbols, depictions, and other visuals. Fill, move around, or remove text boxes as desired. Test out color palettes and font mixtures. Edit and save your work, or work with colleagues. Download Marketing And Promotion Pastry Shop Market Entry Plan GTM SS V and observe how to make your presentation outstanding. Give an impeccable presentation to your group and make your presentation unforgettable. This slide highlights various promotional methods to be used by bakery store startup business to increase business presence It highlights strategies such as special promotions and events, email marketing and collaborations and partnerships.
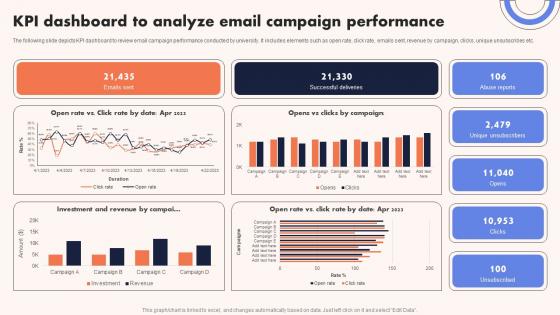
University Marketing Guide KPI Dashboard To Analyze Email Campaign Performance Strategy SS V
The following slide depicts KPI dashboard to review email campaign performance conducted by university. It includes elements such as open rate, click rate, emails sent, revenue by campaign, clicks, unique unsubscribes etc. Are you searching for a University Marketing Guide KPI Dashboard To Analyze Email Campaign Performance Strategy SS V that is uncluttered, straightforward, and original Its easy to edit, and you can change the colors to suit your personal or business branding. For a presentation that expresses how much effort you have put in, this template is ideal With all of its features, including tables, diagrams, statistics, and lists, its perfect for a business plan presentation. Make your ideas more appealing with these professional slides. Download University Marketing Guide KPI Dashboard To Analyze Email Campaign Performance Strategy SS V from Slidegeeks today. The following slide depicts KPI dashboard to review email campaign performance conducted by university. It includes elements such as open rate, click rate, emails sent, revenue by campaign, clicks, unique unsubscribes etc.
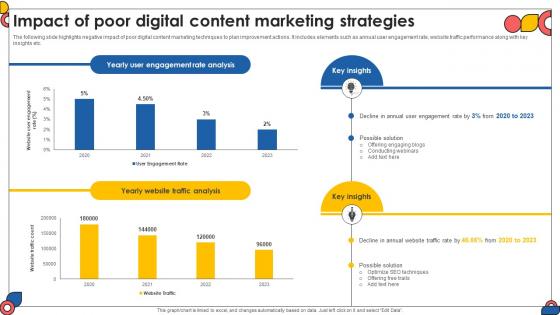
Impact Of Poor Digital Content Marketing Strategies Comprehensive Guide To Implement Strategy SS V
The following slide highlights negative impact of poor digital content marketing techniques to plan improvement actions. It includes elements such as annual user engagement rate, website traffic performance along with key insights etc. Coming up with a presentation necessitates that the majority of the effort goes into the content and the message you intend to convey. The visuals of a PowerPoint presentation can only be effective if it supplements and supports the story that is being told. Keeping this in mind our experts created Impact Of Poor Digital Content Marketing Strategies Comprehensive Guide To Implement Strategy SS V to reduce the time that goes into designing the presentation. This way, you can concentrate on the message while our designers take care of providing you with the right template for the situation. The following slide highlights negative impact of poor digital content marketing techniques to plan improvement actions. It includes elements such as annual user engagement rate, website traffic performance along with key insights etc.
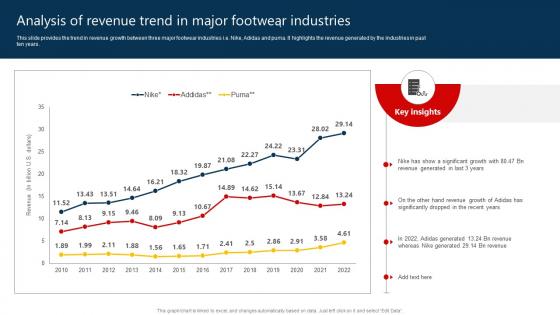
The Marketing Mix Of Analysis Of Revenue Trend In Major Footwear Industries Strategy SS V
This slide provides the trend in revenue growth between three major footwear industries i.e. Nike, Adidas and puma. It highlights the revenue generated by the industries in past ten years. Are you searching for a The Marketing Mix Of Analysis Of Revenue Trend In Major Footwear Industries Strategy SS V that is uncluttered, straightforward, and original Its easy to edit, and you can change the colors to suit your personal or business branding. For a presentation that expresses how much effort you have put in, this template is ideal With all of its features, including tables, diagrams, statistics, and lists, its perfect for a business plan presentation. Make your ideas more appealing with these professional slides. Download The Marketing Mix Of Analysis Of Revenue Trend In Major Footwear Industries Strategy SS V from Slidegeeks today. This slide provides the trend in revenue growth between three major footwear industries i.e. Nike, Adidas and puma. It highlights the revenue generated by the industries in past ten years.
Manufacturing KPI Dashboard For Process Implementing Manufacturing Strategy SS V
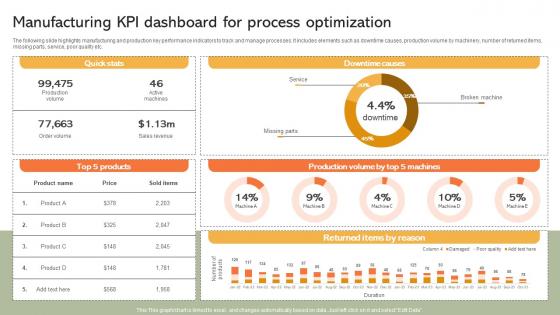
The following slide highlights manufacturing and production key performance indicators to track and manage processes. It includes elements such as downtime causes, production volume by machinery, number of returned items, missing parts, service, poor quality etc. Formulating a presentation can take up a lot of effort and time, so the content and message should always be the primary focus. The visuals of the PowerPoint can enhance the presenters message, so our Manufacturing KPI Dashboard For Process Implementing Manufacturing Strategy SS V was created to help save time. Instead of worrying about the design, the presenter can concentrate on the message while our designers work on creating the ideal templates for whatever situation is needed. Slidegeeks has experts for everything from amazing designs to valuable content, we have put everything into Manufacturing KPI Dashboard For Process Implementing Manufacturing Strategy SS V The following slide highlights manufacturing and production key performance indicators to track and manage processes. It includes elements such as downtime causes, production volume by machinery, number of returned items, missing parts, service, poor quality etc.
Manufacturing KPI Dashboard For Process Optimization Automating Production Process Strategy SS V
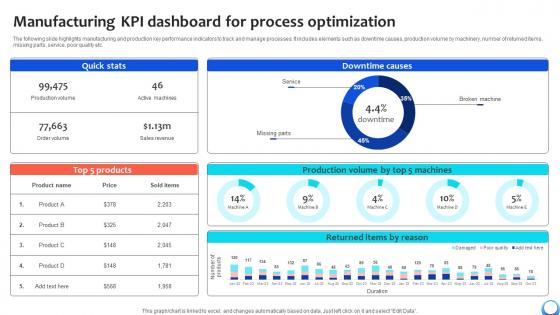
The following slide highlights manufacturing and production key performance indicators to track and manage processes. It includes elements such as downtime causes, production volume by machinery, number of returned items, missing parts, service, poor quality etc. Formulating a presentation can take up a lot of effort and time, so the content and message should always be the primary focus. The visuals of the PowerPoint can enhance the presenters message, so our Manufacturing KPI Dashboard For Process Optimization Automating Production Process Strategy SS V was created to help save time. Instead of worrying about the design, the presenter can concentrate on the message while our designers work on creating the ideal templates for whatever situation is needed. Slidegeeks has experts for everything from amazing designs to valuable content, we have put everything into Manufacturing KPI Dashboard For Process Optimization Automating Production Process Strategy SS V The following slide highlights manufacturing and production key performance indicators to track and manage processes. It includes elements such as downtime causes, production volume by machinery, number of returned items, missing parts, service, poor quality etc.
Major Reasons Of Ineffective Customer Support Boosting Customer Retention Rate With Live Chat
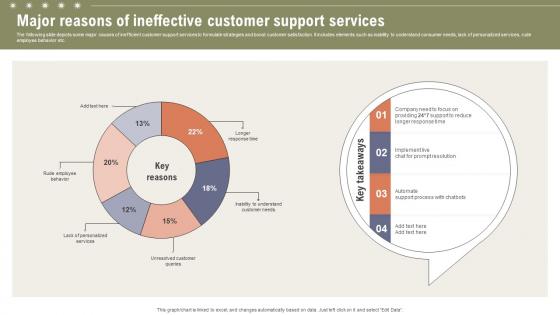
The following slide depicts some major causes of inefficient customer support services to formulate strategies and boost customer satisfaction. It includes elements such as inability to understand consumer needs, lack of personalized services, rude employee behavior etc. Coming up with a presentation necessitates that the majority of the effort goes into the content and the message you intend to convey. The visuals of a PowerPoint presentation can only be effective if it supplements and supports the story that is being told. Keeping this in mind our experts created Major Reasons Of Ineffective Customer Support Boosting Customer Retention Rate With Live Chat to reduce the time that goes into designing the presentation. This way, you can concentrate on the message while our designers take care of providing you with the right template for the situation. The following slide depicts some major causes of inefficient customer support services to formulate strategies and boost customer satisfaction. It includes elements such as inability to understand consumer needs, lack of personalized services, rude employee behavior etc.
IoT Device Management Fundamentals Dashboard Showcasing Unique Errors Per Software IoT Ss V
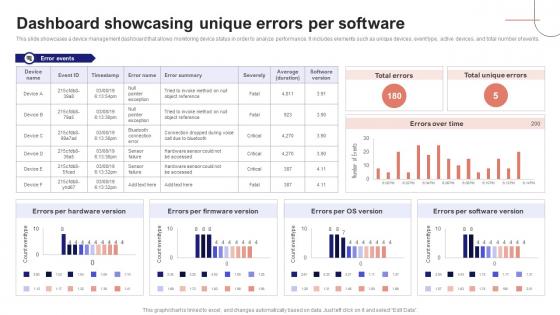
This slide showcases a device management dashboard that allows monitoring device status in order to analyze performance. It includes elements such as unique devices, event type, active devices, and total number of events. Are you in need of a template that can accommodate all of your creative concepts This one is crafted professionally and can be altered to fit any style. Use it with Google Slides or PowerPoint. Include striking photographs, symbols, depictions, and other visuals. Fill, move around, or remove text boxes as desired. Test out color palettes and font mixtures. Edit and save your work, or work with colleagues. Download IoT Device Management Fundamentals Dashboard Showcasing Unique Errors Per Software IoT SS V and observe how to make your presentation outstanding. Give an impeccable presentation to your group and make your presentation unforgettable. This slide showcases a device management dashboard that allows monitoring device status in order to analyze performance. It includes elements such as unique devices, event type, active devices, and total number of events.
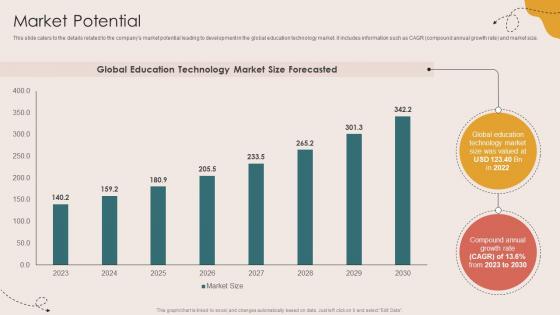
Market Potential Children Events Listing Investor Funding Elevator Pitch Deck
This slide caters to the details related to the companys market potential leading to development in the global education technology market. it includes information such as CAGR compound annual growth rate and market size. Are you in need of a template that can accommodate all of your creative concepts This one is crafted professionally and can be altered to fit any style. Use it with Google Slides or PowerPoint. Include striking photographs, symbols, depictions, and other visuals. Fill, move around, or remove text boxes as desired. Test out color palettes and font mixtures. Edit and save your work, or work with colleagues. Download Market Potential Children Events Listing Investor Funding Elevator Pitch Deck and observe how to make your presentation outstanding. Give an impeccable presentation to your group and make your presentation unforgettable. This slide caters to the details related to the companys market potential leading to development in the global education technology market. it includes information such as CAGR compound annual growth rate and market size.
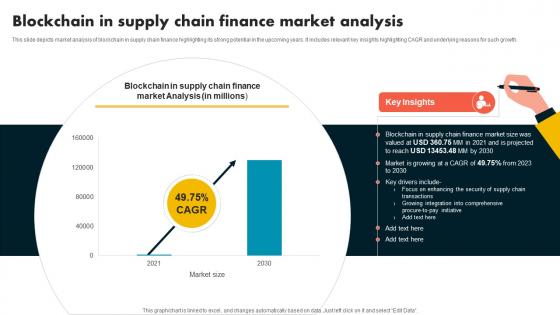
Blockchain In Supply Chain Finance Market Analysis Supply Chain Evolution Harnessing The Power BCT SS V
This slide depicts market analysis of blockchain in supply chain finance highlighting its strong potential in the upcoming years. It includes relevant key insights highlighting CAGR and underlying reasons for such growth.Are you in need of a template that can accommodate all of your creative concepts This one is crafted professionally and can be altered to fit any style. Use it with Google Slides or PowerPoint. Include striking photographs, symbols, depictions, and other visuals. Fill, move around, or remove text boxes as desired. Test out color palettes and font mixtures. Edit and save your work, or work with colleagues. Download Blockchain In Supply Chain Finance Market Analysis Supply Chain Evolution Harnessing The Power BCT SS V and observe how to make your presentation outstanding. Give an impeccable presentation to your group and make your presentation unforgettable. This slide depicts market analysis of blockchain in supply chain finance highlighting its strong potential in the upcoming years. It includes relevant key insights highlighting CAGR and underlying reasons for such growth.
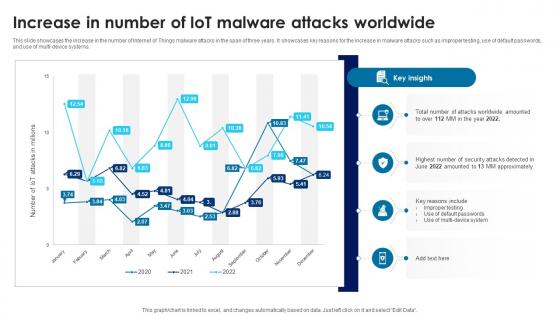
Building Trust With IoT Security Increase In Number Of IoT Malware Attacks Worldwide IoT SS V
This slide showcases the increase in the number of Internet of Things malware attacks in the span of three years. It showcases key reasons for the increase in malware attacks such as improper testing, use of default passwords, and use of multi-device systems. Coming up with a presentation necessitates that the majority of the effort goes into the content and the message you intend to convey. The visuals of a PowerPoint presentation can only be effective if it supplements and supports the story that is being told. Keeping this in mind our experts created Building Trust With IoT Security Increase In Number Of IoT Malware Attacks Worldwide IoT SS V to reduce the time that goes into designing the presentation. This way, you can concentrate on the message while our designers take care of providing you with the right template for the situation. This slide showcases the increase in the number of Internet of Things malware attacks in the span of three years. It showcases key reasons for the increase in malware attacks such as improper testing, use of default passwords, and use of multi-device systems.
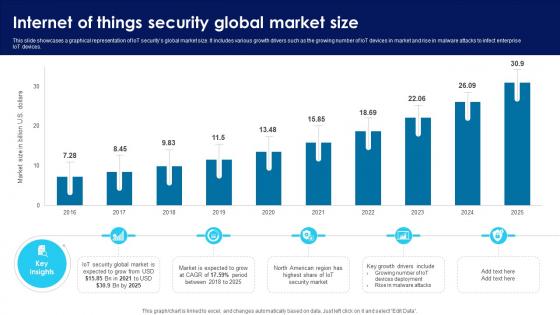
Building Trust With IoT Security Internet Of Things Security Global Market Size IoT SS V
This slide showcases a graphical representation of IoT securitys global market size. It includes various growth drivers such as the growing number of IoT devices in market and rise in malware attacks to infect enterprise IoT devices. This modern and well-arranged Building Trust With IoT Security Internet Of Things Security Global Market Size IoT SS V provides lots of creative possibilities. It is very simple to customize and edit with the Powerpoint Software. Just drag and drop your pictures into the shapes. All facets of this template can be edited with Powerpoint, no extra software is necessary. Add your own material, put your images in the places assigned for them, adjust the colors, and then you can show your slides to the world, with an animated slide included. This slide showcases a graphical representation of IoT securitys global market size. It includes various growth drivers such as the growing number of IoT devices in market and rise in malware attacks to infect enterprise IoT devices.
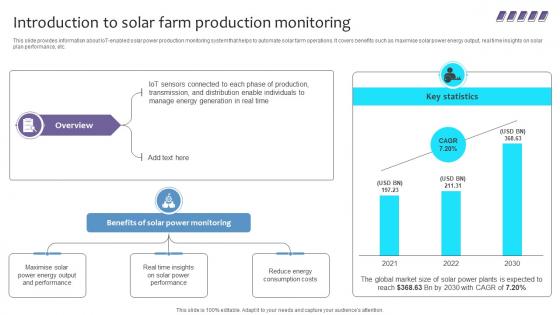
Empowering The Future Introduction To Solar Farm Production Monitoring IoT SS V
This slide provides information about IoT-enabled solar power production monitoring system that helps to automate solar farm operations. It covers benefits such as maximise solar power energy output, real time insights on solar plan performance, etc. Retrieve professionally designed Empowering The Future Introduction To Solar Farm Production Monitoring IoT SS V to effectively convey your message and captivate your listeners. Save time by selecting pre-made slideshows that are appropriate for various topics, from business to educational purposes. These themes come in many different styles, from creative to corporate, and all of them are easily adjustable and can be edited quickly. Access them as PowerPoint templates or as Google Slides themes. You do not have to go on a hunt for the perfect presentation because Slidegeeks got you covered from everywhere. This slide provides information about IoT-enabled solar power production monitoring system that helps to automate solar farm operations. It covers benefits such as maximise solar power energy output, real time insights on solar plan performance, etc.
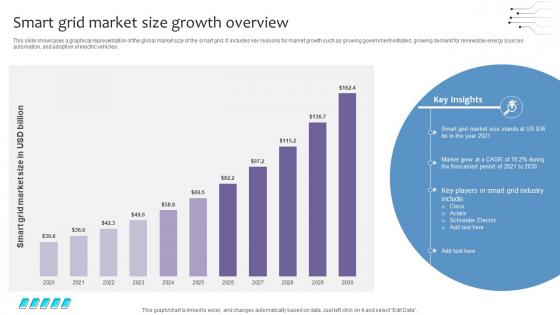
Empowering The Future Smart Grid Market Size Growth Overview IoT SS V
This slide showcases a graphical representation of the global market size of the smart grid. It Includes key reasons for market growth such as growing government-initiated, growing demand for renewable energy sources automation, and adoption of electric vehicles. Coming up with a presentation necessitates that the majority of the effort goes into the content and the message you intend to convey. The visuals of a PowerPoint presentation can only be effective if it supplements and supports the story that is being told. Keeping this in mind our experts created Empowering The Future Smart Grid Market Size Growth Overview IoT SS V to reduce the time that goes into designing the presentation. This way, you can concentrate on the message while our designers take care of providing you with the right template for the situation. This slide showcases a graphical representation of the global market size of the smart grid. It Includes key reasons for market growth such as growing government-initiated, growing demand for renewable energy sources automation, and adoption of electric vehicles.
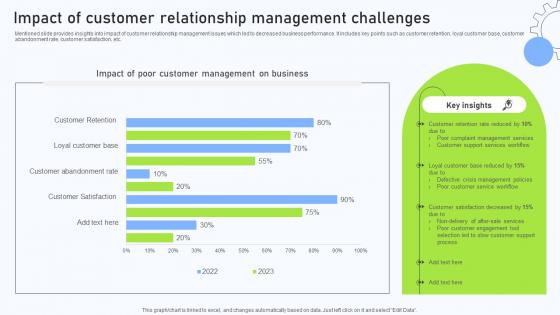
Relationship Management Automation Impact Of Customer Relationship Management
Mentioned slide provides insights into impact of customer relationship management issues which led to decreased business performance. It includes key points such as customer retention, loyal customer base, customer abandonment rate, customer satisfaction, etc. Are you in need of a template that can accommodate all of your creative concepts This one is crafted professionally and can be altered to fit any style. Use it with Google Slides or PowerPoint. Include striking photographs, symbols, depictions, and other visuals. Fill, move around, or remove text boxes as desired. Test out color palettes and font mixtures. Edit and save your work, or work with colleagues. Download Relationship Management Automation Impact Of Customer Relationship Management and observe how to make your presentation outstanding. Give an impeccable presentation to your group and make your presentation unforgettable. Mentioned slide provides insights into impact of customer relationship management issues which led to decreased business performance. It includes key points such as customer retention, loyal customer base, customer abandonment rate, customer satisfaction, etc.
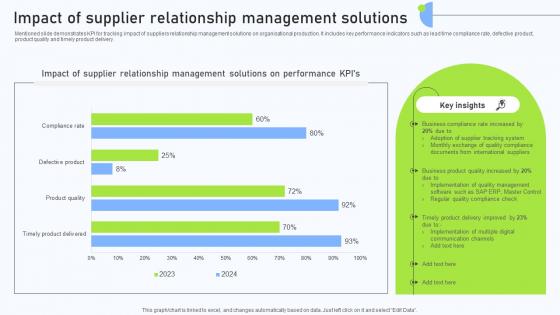
Relationship Management Automation Impact Of Supplier Relationship Management
Mentioned slide demonstrates KPI for tracking impact of suppliers relationship management solutions on organisational production. It includes key performance indicators such as lead time compliance rate, defective product, product quality and timely product delivery. Formulating a presentation can take up a lot of effort and time, so the content and message should always be the primary focus. The visuals of the PowerPoint can enhance the presenters message, so our Relationship Management Automation Impact Of Supplier Relationship Management was created to help save time. Instead of worrying about the design, the presenter can concentrate on the message while our designers work on creating the ideal templates for whatever situation is needed. Slidegeeks has experts for everything from amazing designs to valuable content, we have put everything into Relationship Management Automation Impact Of Supplier Relationship Management Mentioned slide demonstrates KPI for tracking impact of suppliers relationship management solutions on organisational production. It includes key performance indicators such as lead time compliance rate, defective product, product quality and timely product delivery.
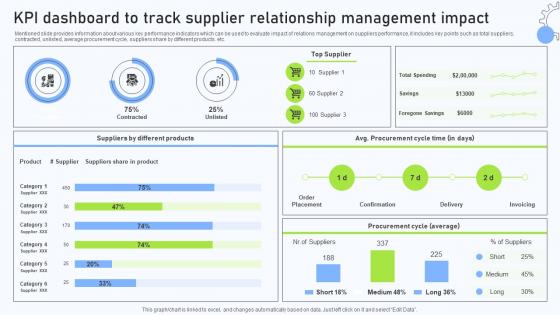
Relationship Management Automation KPI Dashboard To Track Supplier Relationship
Mentioned slide provides information about various key performance indicators which can be used to evaluate impact of relations management on suppliers performance, it includes key points such as total suppliers, contracted, unlisted, average procurement cycle, suppliers share by different products. etc. This Relationship Management Automation KPI Dashboard To Track Supplier Relationship is perfect for any presentation, be it in front of clients or colleagues. It is a versatile and stylish solution for organizing your meetings. The Relationship Management Automation KPI Dashboard To Track Supplier Relationship features a modern design for your presentation meetings. The adjustable and customizable slides provide unlimited possibilities for acing up your presentation. Slidegeeks has done all the homework before launching the product for you. So, do not wait, grab the presentation templates today Mentioned slide provides information about various key performance indicators which can be used to evaluate impact of relations management on suppliers performance, it includes key points such as total suppliers, contracted, unlisted, average procurement cycle, suppliers share by different products. etc.
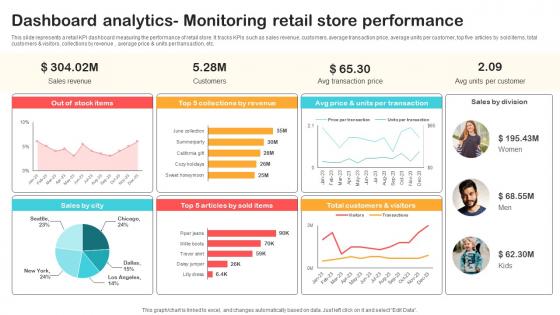
Dashboard Analytics Monitoring Retail Store Performance Optimizing Retail Operations With Digital DT SS V
This slide represents a retail KPI dashboard measuring the performance of retail store. It tracks KPIs such as sales revenue, customers, average transaction price, average units per customer, top five articles by sold items, total customers and visitors, collections by revenue , average price and units per transaction, etc.Are you in need of a template that can accommodate all of your creative concepts This one is crafted professionally and can be altered to fit any style. Use it with Google Slides or PowerPoint. Include striking photographs, symbols, depictions, and other visuals. Fill, move around, or remove text boxes as desired. Test out color palettes and font mixtures. Edit and save your work, or work with colleagues. Download Dashboard Analytics Monitoring Retail Store Performance Optimizing Retail Operations With Digital DT SS V and observe how to make your presentation outstanding. Give an impeccable presentation to your group and make your presentation unforgettable. This slide represents a retail KPI dashboard measuring the performance of retail store. It tracks KPIs such as sales revenue, customers, average transaction price, average units per customer, top five articles by sold items, total customers and visitors, collections by revenue , average price and units per transaction, etc.

Overview Need For Implementing Data Security Across Optimizing Retail Operations With Digital DT SS V
This slide analyses the need of implementing data security initiatives to address key customer data challenges in retail industry. It also mentions types of customer data collected such as account, location, browsing, and profile.Formulating a presentation can take up a lot of effort and time, so the content and message should always be the primary focus. The visuals of the PowerPoint can enhance the presenters message, so our Overview Need For Implementing Data Security Across Optimizing Retail Operations With Digital DT SS V was created to help save time. Instead of worrying about the design, the presenter can concentrate on the message while our designers work on creating the ideal templates for whatever situation is needed. Slidegeeks has experts for everything from amazing designs to valuable content, we have put everything into Overview Need For Implementing Data Security Across Optimizing Retail Operations With Digital DT SS V. This slide analyses the need of implementing data security initiatives to address key customer data challenges in retail industry. It also mentions types of customer data collected such as account, location, browsing, and profile.

Post Digitalization Analysing The Impact On Retail Optimizing Retail Operations With Digital DT SS V
This slide help analyses the improving performance of key performance indicators of retail companies after successful digitalization. It includes online sales growth, cart abandonment rate, customer complaints, inventory inaccuracy, time-to-market, supply chain efficiency, foot traffic, and marketing ROI.This Post Digitalization Analysing The Impact On Retail Optimizing Retail Operations With Digital DT SS V is perfect for any presentation, be it in front of clients or colleagues. It is a versatile and stylish solution for organizing your meetings. The Post Digitalization Analysing The Impact On Retail Optimizing Retail Operations With Digital DT SS V features a modern design for your presentation meetings. The adjustable and customizable slides provide unlimited possibilities for acing up your presentation. Slidegeeks has done all the homework before launching the product for you. So, do not wait, grab the presentation templates today This slide help analyses the improving performance of key performance indicators of retail companies after successful digitalization. It includes online sales growth, cart abandonment rate, customer complaints, inventory inaccuracy, time-to-market, supply chain efficiency, foot traffic, and marketing ROI.
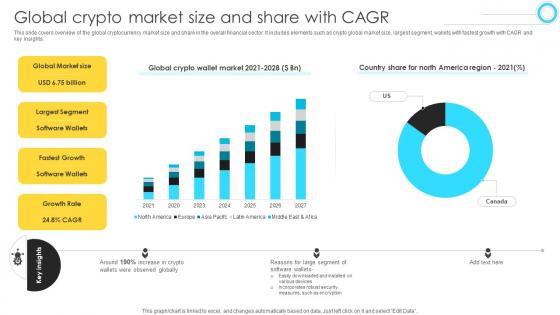
Mastering Blockchain Wallets Global Crypto Market Size And Share With CAGR BCT SS V
This slide covers overview of the global cryptocurrency market size and share in the overall financial sector. It includes elements such as crypto global market size, largest segment, wallets with fastest growth with CAGR and key insights. Retrieve professionally designed Mastering Blockchain Wallets Global Crypto Market Size And Share With CAGR BCT SS V to effectively convey your message and captivate your listeners. Save time by selecting pre-made slideshows that are appropriate for various topics, from business to educational purposes. These themes come in many different styles, from creative to corporate, and all of them are easily adjustable and can be edited quickly. Access them as PowerPoint templates or as Google Slides themes. You do not have to go on a hunt for the perfect presentation because Slidegeeks got you covered from everywhere. This slide covers overview of the global cryptocurrency market size and share in the overall financial sector. It includes elements such as crypto global market size, largest segment, wallets with fastest growth with CAGR and key insights.
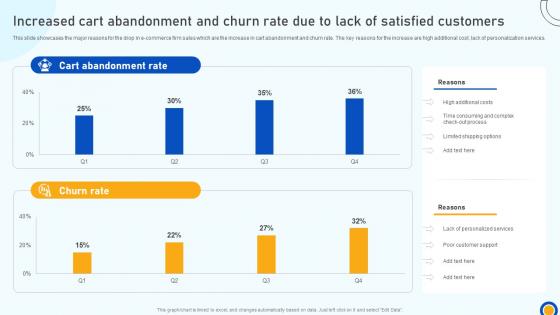
Digital Marketing Strategies Increased Cart Abandonment And Churn Rate Due To Lack SA SS V
This slide showcases the major reasons for the drop in e-commerce firm sales which are the increase in cart abandonment and churn rate. The key reasons for the increase are high additional cost, lack of personalization services. Coming up with a presentation necessitates that the majority of the effort goes into the content and the message you intend to convey. The visuals of a PowerPoint presentation can only be effective if it supplements and supports the story that is being told. Keeping this in mind our experts created Digital Marketing Strategies Increased Cart Abandonment And Churn Rate Due To Lack SA SS V to reduce the time that goes into designing the presentation. This way, you can concentrate on the message while our designers take care of providing you with the right template for the situation. This slide showcases the major reasons for the drop in e-commerce firm sales which are the increase in cart abandonment and churn rate. The key reasons for the increase are high additional cost, lack of personalization services.
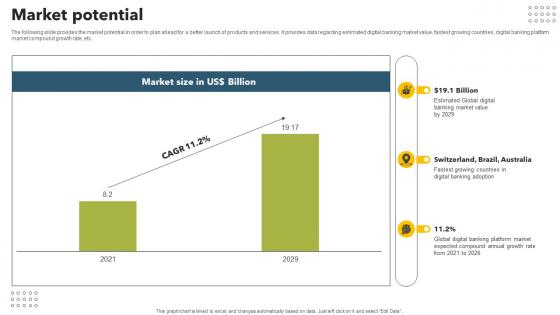
Market Potential Mobile Banking App Investor Funding Elevator Pitch Deck
The following slide provides the market potential in order to plan ahead for a better launch of products and services. It provides data regarding estimated digital banking market value, fastest growing countries, digital banking platform market compound growth rate, etc. Are you in need of a template that can accommodate all of your creative concepts This one is crafted professionally and can be altered to fit any style. Use it with Google Slides or PowerPoint. Include striking photographs, symbols, depictions, and other visuals. Fill, move around, or remove text boxes as desired. Test out color palettes and font mixtures. Edit and save your work, or work with colleagues. Download Market Potential Mobile Banking App Investor Funding Elevator Pitch Deck and observe how to make your presentation outstanding. Give an impeccable presentation to your group and make your presentation unforgettable. The following slide provides the market potential in order to plan ahead for a better launch of products and services. It provides data regarding estimated digital banking market value, fastest growing countries, digital banking platform market compound growth rate, etc.
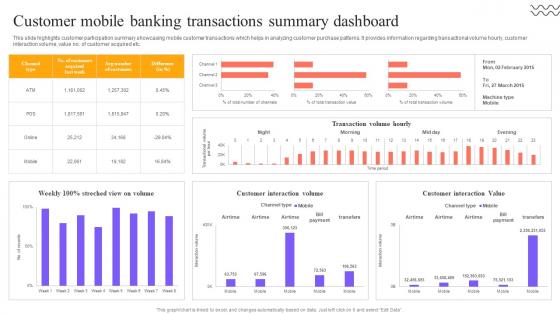
Digital Approach To Client Customer Mobile Banking Transactions Summary Dashboard
This slide highlights customer participation summary showcasing mobile customer transactions which helps in analyzing customer purchase patterns. It provides information regarding transactional volume hourly, customer interaction volume, value no. of customer acquired etc. Formulating a presentation can take up a lot of effort and time, so the content and message should always be the primary focus. The visuals of the PowerPoint can enhance the presenters message, so our Digital Approach To Client Customer Mobile Banking Transactions Summary Dashboard was created to help save time. Instead of worrying about the design, the presenter can concentrate on the message while our designers work on creating the ideal templates for whatever situation is needed. Slidegeeks has experts for everything from amazing designs to valuable content, we have put everything into Digital Approach To Client Customer Mobile Banking Transactions Summary Dashboard. This slide highlights customer participation summary showcasing mobile customer transactions which helps in analyzing customer purchase patterns. It provides information regarding transactional volume hourly, customer interaction volume, value no. of customer acquired etc.

Unlocking Potential IoTs Application Analysis Of Internet Of Things IoT Industry Market Report IoT SS V
This slide highlights the synopsis of the IoT market report to get an idea of the industry growth. It covers the IoT market driver, CAGR, market size, key players of the IoT industry, and market potential of the IoT industry. Present like a pro with Unlocking Potential IoTs Application Analysis Of Internet Of Things IoT Industry Market Report IoT SS V. Create beautiful presentations together with your team, using our easy-to-use presentation slides. Share your ideas in real-time and make changes on the fly by downloading our templates. So whether you are in the office, on the go, or in a remote location, you can stay in sync with your team and present your ideas with confidence. With Slidegeeks presentation got a whole lot easier. Grab these presentations today. This slide highlights the synopsis of the IoT market report to get an idea of the industry growth. It covers the IoT market driver, CAGR, market size, key players of the IoT industry, and market potential of the IoT industry.

Unlocking Potential IoTs Application Dashboard For Managing IoT Device In Smart City Operations IoT SS V
This slide highlights the dashboard for controlling IoT devices in smart city management operations. It provides combined information related to street lighting, waste management, smart parking, smart bin trackers, energy management, environment data, etc. Are you in need of a template that can accommodate all of your creative concepts This one is crafted professionally and can be altered to fit any style. Use it with Google Slides or PowerPoint. Include striking photographs, symbols, depictions, and other visuals. Fill, move around, or remove text boxes as desired. Test out color palettes and font mixtures. Edit and save your work, or work with colleagues. Download Unlocking Potential IoTs Application Dashboard For Managing IoT Device In Smart City Operations IoT SS V and observe how to make your presentation outstanding. Give an impeccable presentation to your group and make your presentation unforgettable. This slide highlights the dashboard for controlling IoT devices in smart city management operations. It provides combined information related to street lighting, waste management, smart parking, smart bin trackers, energy management, environment data, etc.
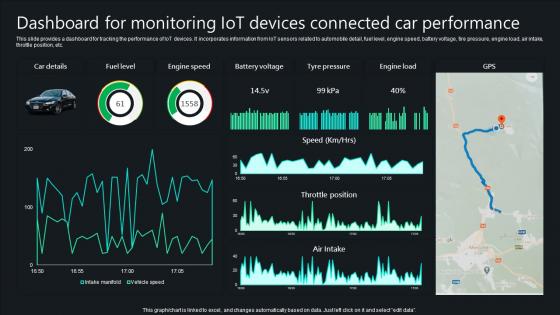
Unlocking Potential IoTs Application Dashboard For Monitoring IoT Devices Connected Car IoT SS V
This slide provides a dashboard for tracking the performance of IoT devices. It incorporates information from IoT sensors related to automobile detail, fuel level, engine speed, battery voltage, tire pressure, engine load, air intake, throttle position, etc. Crafting an eye-catching presentation has never been more straightforward. Let your presentation shine with this tasteful yet straightforward Unlocking Potential IoTs Application Dashboard For Monitoring IoT Devices Connected Car IoT SS V template. It offers a minimalistic and classy look that is great for making a statement. The colors have been employed intelligently to add a bit of playfulness while still remaining professional. Construct the ideal Unlocking Potential IoTs Application Dashboard For Monitoring IoT Devices Connected Car IoT SS V that effortlessly grabs the attention of your audience Begin now and be certain to wow your customers This slide provides a dashboard for tracking the performance of IoT devices. It incorporates information from IoT sensors related to automobile detail, fuel level, engine speed, battery voltage, tire pressure, engine load, air intake, throttle position, etc.
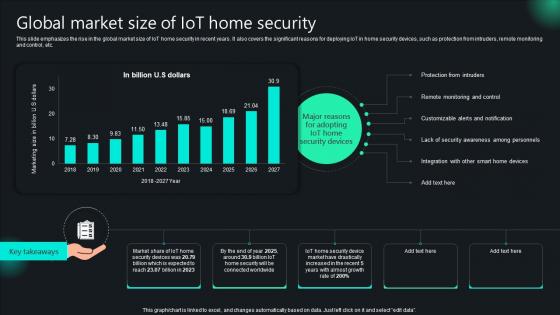
Unlocking Potential IoTs Application Global Market Size Of IoT Home Security IoT SS V
This slide emphasizes the rise in the global market size of IoT home security in recent years. It also covers the significant reasons for deploying IoT in home security devices, such as protection from intruders, remote monitoring and control, etc. The Unlocking Potential IoTs Application Global Market Size Of IoT Home Security IoT SS V is a compilation of the most recent design trends as a series of slides. It is suitable for any subject or industry presentation, containing attractive visuals and photo spots for businesses to clearly express their messages. This template contains a variety of slides for the user to input data, such as structures to contrast two elements, bullet points, and slides for written information. Slidegeeks is prepared to create an impression. This slide emphasizes the rise in the global market size of IoT home security in recent years. It also covers the significant reasons for deploying IoT in home security devices, such as protection from intruders, remote monitoring and control, etc.
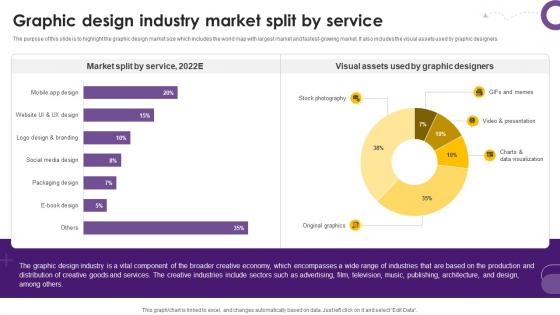
Creative Agency Business Plan Graphic Design Industry Market Split By Service BP SS V
The purpose of this slide is to highlight the graphic design market size which includes the world map with largest market and fastest-growing market. It also includes the visual assets used by graphic designers. Crafting an eye-catching presentation has never been more straightforward. Let your presentation shine with this tasteful yet straightforward Creative Agency Business Plan Graphic Design Industry Market Split By Service BP SS V template. It offers a minimalistic and classy look that is great for making a statement. The colors have been employed intelligently to add a bit of playfulness while still remaining professional. Construct the ideal Creative Agency Business Plan Graphic Design Industry Market Split By Service BP SS V that effortlessly grabs the attention of your audience Begin now and be certain to wow your customers The purpose of this slide is to highlight the graphic design market size which includes the world map with largest market and fastest-growing market. It also includes the visual assets used by graphic designers.
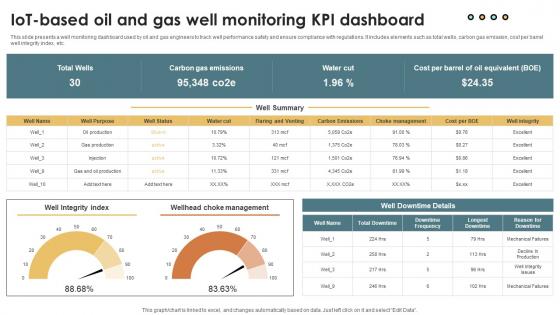
IoT Solutions For Oil IoT Based Oil And Gas Well Monitoring KPI Dashboard IoT SS V
This slide presents a well monitoring dashboard used by oil and gas engineers to track well performance safety and ensure compliance with regulations. It includes elements such as total wells, carbon gas emission, cost per barrel well integrity index, etc. This modern and well-arranged IoT Solutions For Oil IoT Based Oil And Gas Well Monitoring KPI Dashboard IoT SS V provides lots of creative possibilities. It is very simple to customize and edit with the Powerpoint Software. Just drag and drop your pictures into the shapes. All facets of this template can be edited with Powerpoint, no extra software is necessary. Add your own material, put your images in the places assigned for them, adjust the colors, and then you can show your slides to the world, with an animated slide included. This slide presents a well monitoring dashboard used by oil and gas engineers to track well performance safety and ensure compliance with regulations. It includes elements such as total wells, carbon gas emission, cost per barrel well integrity index, etc.
Solar Computing IT Green Cloud Computing Performance Tracking Dashboard
This slide depicts the performance tracking dashboard for green cloud computing. This slide aims to showcase the performance tracking report of green cloud computing by covering parameters such as Power Use Effectiveness PUE, high-density zone, history, consumption, and Average Propensity to Consume APC consumption. Are you in need of a template that can accommodate all of your creative concepts This one is crafted professionally and can be altered to fit any style. Use it with Google Slides or PowerPoint. Include striking photographs, symbols, depictions, and other visuals. Fill, move around, or remove text boxes as desired. Test out color palettes and font mixtures. Edit and save your work, or work with colleagues. Download Solar Computing IT Green Cloud Computing Performance Tracking Dashboard and observe how to make your presentation outstanding. Give an impeccable presentation to your group and make your presentation unforgettable. This slide depicts the performance tracking dashboard for green cloud computing. This slide aims to showcase the performance tracking report of green cloud computing by covering parameters such as Power Use Effectiveness PUE, high-density zone, history, consumption, and Average Propensity to Consume APC consumption.
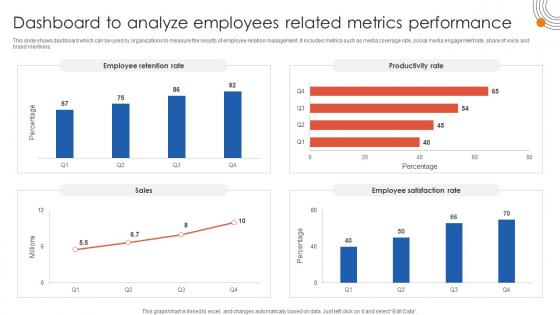
Human Resource Industrial Relationship Dashboard To Analyze Employees Related Metrics Performance
This slide shows dashboard which can be used by organizations to measure the results of employee relation management. It includes metrics such as media coverage rate, social media engagement rate, share of voice and brand mentions. Slidegeeks is here to make your presentations a breeze with Human Resource Industrial Relationship Dashboard To Analyze Employees Related Metrics Performance With our easy-to-use and customizable templates, you can focus on delivering your ideas rather than worrying about formatting. With a variety of designs to choose from, you are sure to find one that suits your needs. And with animations and unique photos, illustrations, and fonts, you can make your presentation pop. So whether you are giving a sales pitch or presenting to the board, make sure to check out Slidegeeks first This slide shows dashboard which can be used by organizations to measure the results of employee relation management. It includes metrics such as media coverage rate, social media engagement rate, share of voice and brand mentions.
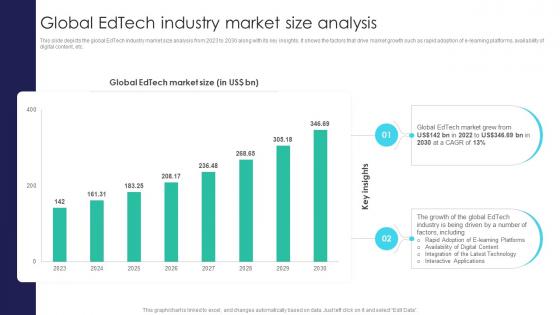
Global Digital Education Global Edtech Industry Market Size Analysis IR SS V
This slide depicts the global EdTech industry market size analysis from 2023 to 2030 along with its key insights. It shows the factors that drive market growth such as rapid adoption of e-learning platforms, availability of digital content, etc. Are you in need of a template that can accommodate all of your creative concepts This one is crafted professionally and can be altered to fit any style. Use it with Google Slides or PowerPoint. Include striking photographs, symbols, depictions, and other visuals. Fill, move around, or remove text boxes as desired. Test out color palettes and font mixtures. Edit and save your work, or work with colleagues. Download Global Digital Education Global Edtech Industry Market Size Analysis IR SS V and observe how to make your presentation outstanding. Give an impeccable presentation to your group and make your presentation unforgettable. This slide depicts the global EdTech industry market size analysis from 2023 to 2030 along with its key insights. It shows the factors that drive market growth such as rapid adoption of e-learning platforms, availability of digital content, etc.
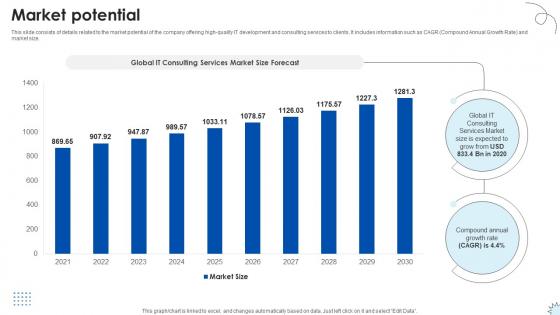
Market Potential Technology Solutions Provider Investor Funding Elevator Pitch Deck
This slide consists of details related to the market potential of the company offering high-quality IT development and consulting services to clients. It includes information such as CAGR Compound Annual Growth Rate and market size. Are you in need of a template that can accommodate all of your creative concepts This one is crafted professionally and can be altered to fit any style. Use it with Google Slides or PowerPoint. Include striking photographs, symbols, depictions, and other visuals. Fill, move around, or remove text boxes as desired. Test out color palettes and font mixtures. Edit and save your work, or work with colleagues. Download Market Potential Technology Solutions Provider Investor Funding Elevator Pitch Deck and observe how to make your presentation outstanding. Give an impeccable presentation to your group and make your presentation unforgettable. This slide consists of details related to the market potential of the company offering high-quality IT development and consulting services to clients. It includes information such as CAGR Compound Annual Growth Rate and market size.
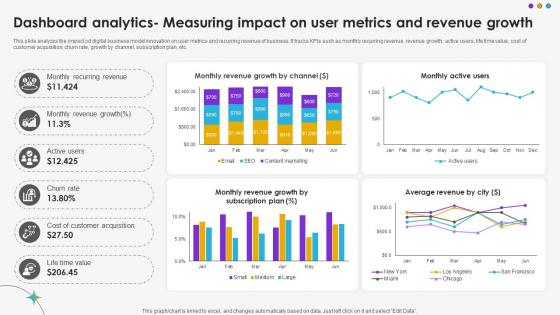
Dashboard Analytics Measuring Impact On User Metrics And Revenue Growth DT SS V
This slide analyzes the impact od digital business model innovation on user metrics and recurring revenue of business. It tracks KPIs such as monthly recurring revenue, revenue growth, active users, life time value, cost of customer acquisition, churn rate, growth by channel, subscription plan, etc.Are you searching for a Dashboard Analytics Measuring Impact On User Metrics And Revenue Growth DT SS V that is uncluttered, straightforward, and original Its easy to edit, and you can change the colors to suit your personal or business branding. For a presentation that expresses how much effort you have put in, this template is ideal With all of its features, including tables, diagrams, statistics, and lists, its perfect for a business plan presentation. Make your ideas more appealing with these professional slides. Download Dashboard Analytics Measuring Impact On User Metrics And Revenue Growth DT SS V from Slidegeeks today. This slide analyzes the impact od digital business model innovation on user metrics and recurring revenue of business. It tracks KPIs such as monthly recurring revenue, revenue growth, active users, life time value, cost of customer acquisition, churn rate, growth by channel, subscription plan, etc.
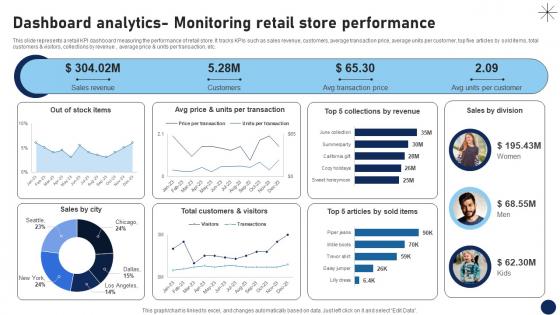
Dashboard Analytics Monitoring Retail Store Performance DT SS V
This slide represents a retail KPI dashboard measuring the performance of retail store. It tracks KPIs such as sales revenue, customers, average transaction price, average units per customer, top five articles by sold items, total customers and visitors, collections by revenue , average price and units per transaction, etc.Are you in need of a template that can accommodate all of your creative concepts This one is crafted professionally and can be altered to fit any style. Use it with Google Slides or PowerPoint. Include striking photographs, symbols, depictions, and other visuals. Fill, move around, or remove text boxes as desired. Test out color palettes and font mixtures. Edit and save your work, or work with colleagues. Download Dashboard Analytics Monitoring Retail Store Performance DT SS V and observe how to make your presentation outstanding. Give an impeccable presentation to your group and make your presentation unforgettable. This slide represents a retail KPI dashboard measuring the performance of retail store. It tracks KPIs such as sales revenue, customers, average transaction price, average units per customer, top five articles by sold items, total customers and visitors, collections by revenue , average price and units per transaction, etc.
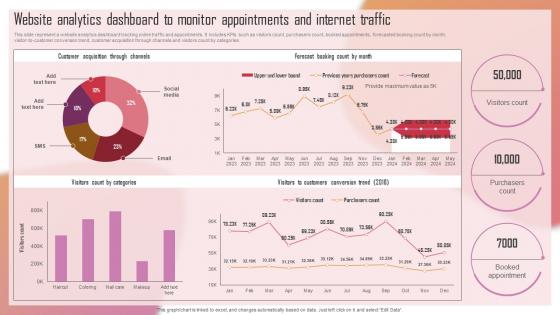
Customizing The Salon Experience Website Analytics Dashboard To Monitor Appointments Strategy SS V
This slide represent a website analytics dashboard tracking online traffic and appointments. It includes KPIs such as visitors count, purchasers count, booked appointments, forecasted booking count by month, visitor-to-customer conversion trend, customer acquisition through channels and visitors count by categories. Retrieve professionally designed Customizing The Salon Experience Website Analytics Dashboard To Monitor Appointments Strategy SS V to effectively convey your message and captivate your listeners. Save time by selecting pre-made slideshows that are appropriate for various topics, from business to educational purposes. These themes come in many different styles, from creative to corporate, and all of them are easily adjustable and can be edited quickly. Access them as PowerPoint templates or as Google Slides themes. You do not have to go on a hunt for the perfect presentation because Slidegeeks got you covered from everywhere. This slide represent a website analytics dashboard tracking online traffic and appointments. It includes KPIs such as visitors count, purchasers count, booked appointments, forecasted booking count by month, visitor-to-customer conversion trend, customer acquisition through channels and visitors count by categories.
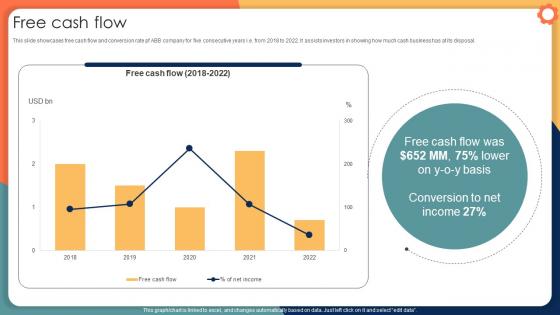
Free Cash Flow Engineering Solution Provider Company Profile CP SS V
This slide showcases free cash flow and conversion rate pf ABB company for five consecutive years i.e. from 2018 to 2022. It assists investors in showing how much cash business has at its disposal. Are you in need of a template that can accommodate all of your creative concepts This one is crafted professionally and can be altered to fit any style. Use it with Google Slides or PowerPoint. Include striking photographs, symbols, depictions, and other visuals. Fill, move around, or remove text boxes as desired. Test out color palettes and font mixtures. Edit and save your work, or work with colleagues. Download Free Cash Flow Engineering Solution Provider Company Profile CP SS V and observe how to make your presentation outstanding. Give an impeccable presentation to your group and make your presentation unforgettable. This slide showcases free cash flow and conversion rate pf ABB company for five consecutive years i.e. from 2018 to 2022. It assists investors in showing how much cash business has at its disposal.
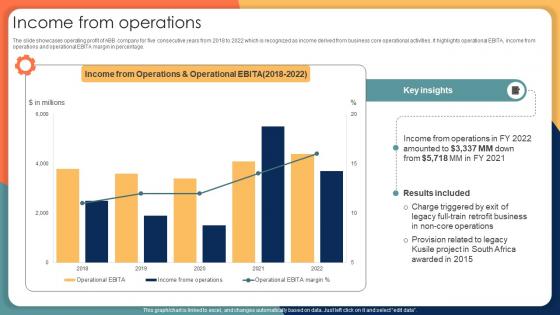
Income From Operations Engineering Solution Provider Company Profile CP SS V
The slide showcases operating profit of ABB company for five consecutive years from 2018 to 2022 which is recognized as income derived from business core operational activities. It highlights operational EBITA, income from operations and operational EBITA margin in percentage. Coming up with a presentation necessitates that the majority of the effort goes into the content and the message you intend to convey. The visuals of a PowerPoint presentation can only be effective if it supplements and supports the story that is being told. Keeping this in mind our experts created Income From Operations Engineering Solution Provider Company Profile CP SS V to reduce the time that goes into designing the presentation. This way, you can concentrate on the message while our designers take care of providing you with the right template for the situation. The slide showcases operating profit of ABB company for five consecutive years from 2018 to 2022 which is recognized as income derived from business core operational activities. It highlights operational EBITA, income from operations and operational EBITA margin in percentage.
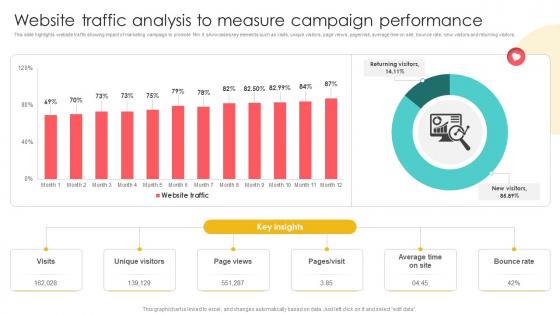
Marketing Channels For Movie Website Traffic Analysis To Measure Campaign Performance Strategy SS V
This slide highlights website traffic showing impact of marketing campaign to promote film. It showcases key elements such as visits, unique visitors, page views, page or visit, average time on site, bounce rate, new visitors and returning visitors. Are you searching for a Marketing Channels For Movie Website Traffic Analysis To Measure Campaign Performance Strategy SS V that is uncluttered, straightforward, and original Its easy to edit, and you can change the colors to suit your personal or business branding. For a presentation that expresses how much effort you have put in, this template is ideal With all of its features, including tables, diagrams, statistics, and lists, its perfect for a business plan presentation. Make your ideas more appealing with these professional slides. Download Marketing Channels For Movie Website Traffic Analysis To Measure Campaign Performance Strategy SS V from Slidegeeks today. This slide highlights website traffic showing impact of marketing campaign to promote film. It showcases key elements such as visits, unique visitors, page views, page or visit, average time on site, bounce rate, new visitors and returning visitors.
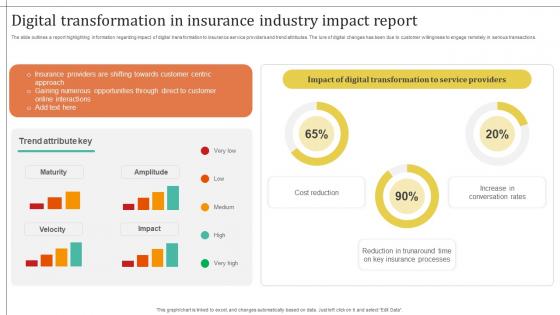
Improving Customer Satisfaction Digital Transformation In Insurance Industry Impact
The slide outlines a report highlighting information regarding impact of digital transformation to insurance service providers and trend attributes. The lure of digital changes has been due to customer willingness to engage remotely in serious transactions. Formulating a presentation can take up a lot of effort and time, so the content and message should always be the primary focus. The visuals of the PowerPoint can enhance the presenters message, so our Improving Customer Satisfaction Digital Transformation In Insurance Industry Impact was created to help save time. Instead of worrying about the design, the presenter can concentrate on the message while our designers work on creating the ideal templates for whatever situation is needed. Slidegeeks has experts for everything from amazing designs to valuable content, we have put everything into Improving Customer Satisfaction Digital Transformation In Insurance Industry Impact. The slide outlines a report highlighting information regarding impact of digital transformation to insurance service providers and trend attributes. The lure of digital changes has been due to customer willingness to engage remotely in serious transactions.
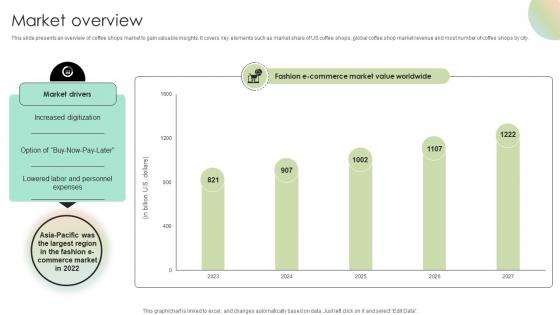
Market Overview Digital Fashion Brand Portal Market Entry Plan GTM SS V
This slide presents an overview of coffee shops market to gain valuable insights. It covers key elements such as market share of US coffee shops, global coffee shop market revenue and most number of coffee shops by city.Slidegeeks is here to make your presentations a breeze with Market Overview Digital Fashion Brand Portal Market Entry Plan GTM SS V With our easy-to-use and customizable templates, you can focus on delivering your ideas rather than worrying about formatting. With a variety of designs to choose from, you are sure to find one that suits your needs. And with animations and unique photos, illustrations, and fonts, you can make your presentation pop. So whether you are giving a sales pitch or presenting to the board, make sure to check out Slidegeeks first This slide presents an overview of coffee shops market to gain valuable insights. It covers key elements such as market share of US coffee shops, global coffee shop market revenue and most number of coffee shops by city.
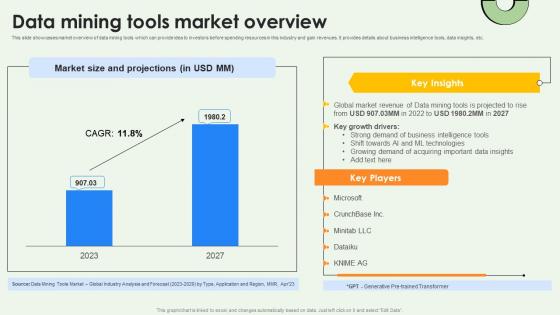
Data Mining Tools Market Overview Data Warehousing And Data Mining Guide AI SS V
This slide showcases market overview of data mining tools which can provide idea to investors before spending resources in this industry and gain revenues. It provides details about business intelligence tools, data insights, etc. This Data Mining Tools Market Overview Data Warehousing And Data Mining Guide AI SS V is perfect for any presentation, be it in front of clients or colleagues. It is a versatile and stylish solution for organizing your meetings. The Data Mining Tools Market Overview Data Warehousing And Data Mining Guide AI SS V features a modern design for your presentation meetings. The adjustable and customizable slides provide unlimited possibilities for acing up your presentation. Slidegeeks has done all the homework before launching the product for you. So, do not wait, grab the presentation templates today This slide showcases market overview of data mining tools which can provide idea to investors before spending resources in this industry and gain revenues. It provides details about business intelligence tools, data insights, etc.


 Continue with Email

 Home
Home


