Bar Graph
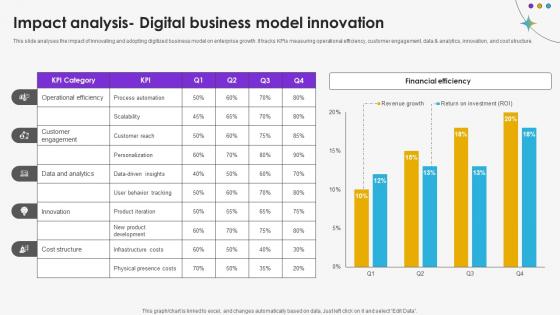
Impact Analysis Digital Business Model Innovation DT SS V
This slide analyses the impact of innovating and adopting digitized business model on enterprise growth. It tracks KPIs measuring operational efficiency, customer engagement, data and analytics, innovation, and cost structure.Do you have an important presentation coming up Are you looking for something that will make your presentation stand out from the rest Look no further than Impact Analysis Digital Business Model Innovation DT SS V. With our professional designs, you can trust that your presentation will pop and make delivering it a smooth process. And with Slidegeeks, you can trust that your presentation will be unique and memorable. So why wait Grab Impact Analysis Digital Business Model Innovation DT SS V today and make your presentation stand out from the rest. This slide analyses the impact of innovating and adopting digitized business model on enterprise growth. It tracks KPIs measuring operational efficiency, customer engagement, data and analytics, innovation, and cost structure.
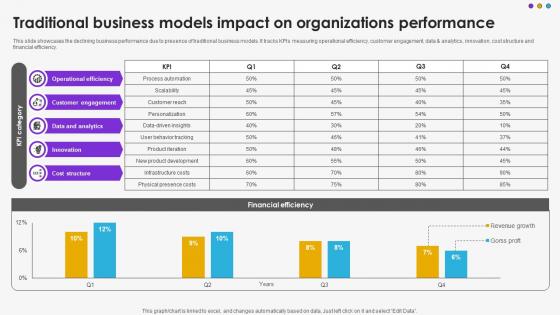
Traditional Business Models Impact On Organizations Performance DT SS V
This slide showcases the declining business performance due to presence of traditional business models. It tracks KPIs measuring operational efficiency, customer engagement, data and analytics, innovation, cost structure and financial efficiency.Do you have an important presentation coming up Are you looking for something that will make your presentation stand out from the rest Look no further than Traditional Business Models Impact On Organizations Performance DT SS V. With our professional designs, you can trust that your presentation will pop and make delivering it a smooth process. And with Slidegeeks, you can trust that your presentation will be unique and memorable. So why wait Grab Traditional Business Models Impact On Organizations Performance DT SS V today and make your presentation stand out from the rest This slide showcases the declining business performance due to presence of traditional business models. It tracks KPIs measuring operational efficiency, customer engagement, data and analytics, innovation, cost structure and financial efficiency.
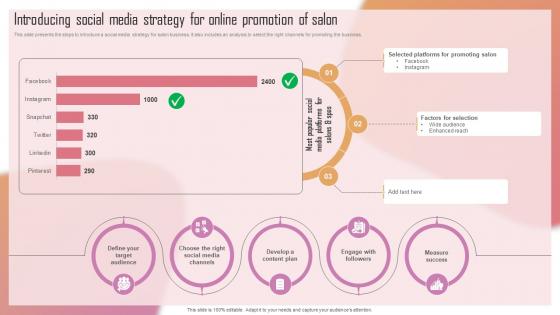
Customizing The Salon Experience Introducing Social Media Strategy For Online Promotion Strategy SS V
This slide presents the steps to introduce a social media strategy for salon business. It also includes an analysis to select the right channels for promoting the business. Take your projects to the next level with our ultimate collection of Customizing The Salon Experience Introducing Social Media Strategy For Online Promotion Strategy SS V. Slidegeeks has designed a range of layouts that are perfect for representing task or activity duration, keeping track of all your deadlines at a glance. Tailor these designs to your exact needs and give them a truly corporate look with your own brand colors they will make your projects stand out from the rest This slide presents the steps to introduce a social media strategy for salon business. It also includes an analysis to select the right channels for promoting the business.
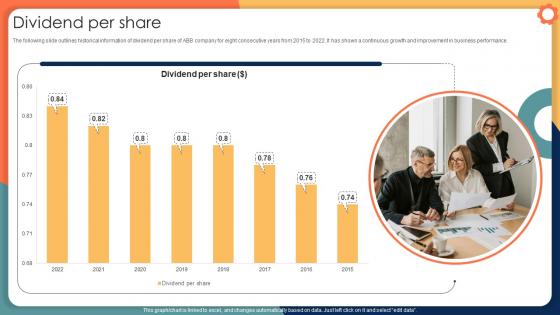
Dividend Per Share Engineering Solution Provider Company Profile CP SS V
The following slide outlines historical information of dividend per share of ABB company for eight consecutive years from 2015 to 2022. It has shown a continuous growth and improvement in business performance. Do you have an important presentation coming up Are you looking for something that will make your presentation stand out from the rest Look no further than Dividend Per Share Engineering Solution Provider Company Profile CP SS V. With our professional designs, you can trust that your presentation will pop and make delivering it a smooth process. And with Slidegeeks, you can trust that your presentation will be unique and memorable. So why wait Grab Dividend Per Share Engineering Solution Provider Company Profile CP SS V today and make your presentation stand out from the rest The following slide outlines historical information of dividend per share of ABB company for eight consecutive years from 2015 to 2022. It has shown a continuous growth and improvement in business performance.
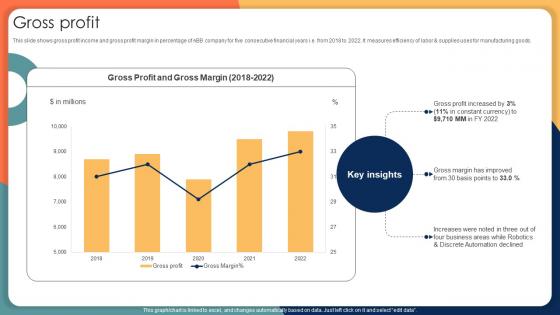
Gross Profit Engineering Solution Provider Company Profile CP SS V
This slide shows gross profit income and gross profit margin in percentage of ABB company for five consecutive financial years i.e. from 2018 to 2022. It measures efficiency of labor and supplies uses for manufacturing goods. Make sure to capture your audiences attention in your business displays with our gratis customizable Gross Profit Engineering Solution Provider Company Profile CP SS V. These are great for business strategies, office conferences, capital raising or task suggestions. If you desire to acquire more customers for your tech business and ensure they stay satisfied, create your own sales presentation with these plain slides. This slide shows gross profit income and gross profit margin in percentage of ABB company for five consecutive financial years i.e. from 2018 to 2022. It measures efficiency of labor and supplies uses for manufacturing goods.
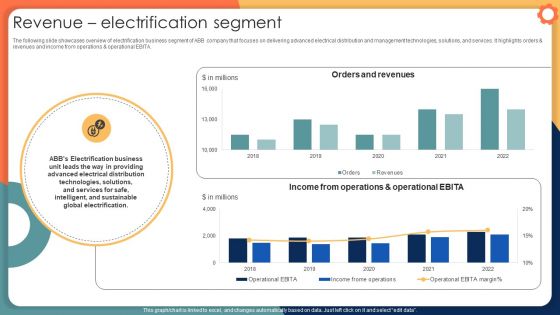
Revenue Electrification Segment Engineering Solution Provider Company Profile CP SS V
The following slide showcases overview of electrification business segment of ABB company that focuses on delivering advanced electrical distribution and management technologies, solutions, and services. It highlights orders and revenues and income from operations and operational EBITA. Presenting this PowerPoint presentation, titled Revenue Electrification Segment Engineering Solution Provider Company Profile CP SS V, with topics curated by our researchers after extensive research. This editable presentation is available for immediate download and provides attractive features when used. Download now and captivate your audience. Presenting this Revenue Electrification Segment Engineering Solution Provider Company Profile CP SS V. Our researchers have carefully researched and created these slides with all aspects taken into consideration. This is a completely customizable Revenue Electrification Segment Engineering Solution Provider Company Profile CP SS V that is available for immediate downloading. Download now and make an impact on your audience. Highlight the attractive features available with our PPTs. The following slide showcases overview of electrification business segment of ABB company that focuses on delivering advanced electrical distribution and management technologies, solutions, and services. It highlights orders and revenues and income from operations and operational EBITA.
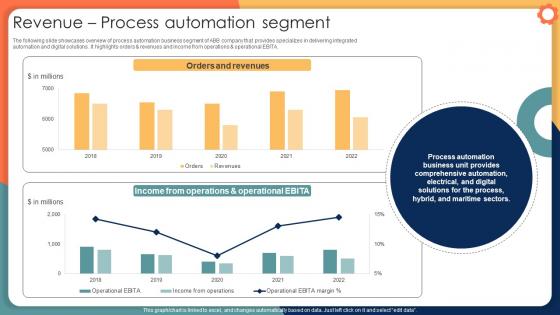
Revenue Process Automation Segment Engineering Solution Provider Company Profile CP SS V
The following slide showcases overview of process automation business segment of ABB company that provides specializes in delivering integrated automation and digital solutions . It highlights orders and revenues and income from operations and operational EBITA. This Revenue Process Automation Segment Engineering Solution Provider Company Profile CP SS V from Slidegeeks makes it easy to present information on your topic with precision. It provides customization options, so you can make changes to the colors, design, graphics, or any other component to create a unique layout. It is also available for immediate download, so you can begin using it right away. Slidegeeks has done good research to ensure that you have everything you need to make your presentation stand out. Make a name out there for a brilliant performance. The following slide showcases overview of process automation business segment of ABB company that provides specializes in delivering integrated automation and digital solutions . It highlights orders and revenues and income from operations and operational EBITA.
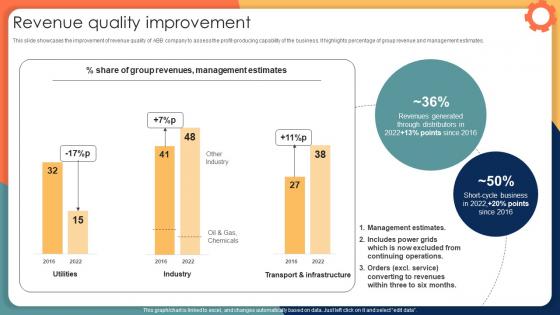
Revenue Quality Improvement Engineering Solution Provider Company Profile CP SS V
This slide showcases the improvement of revenue quality of ABB company to assess the profit-producing capability of the business. It highlights percentage of group revenue and management estimates. Take your projects to the next level with our ultimate collection of Revenue Quality Improvement Engineering Solution Provider Company Profile CP SS V. Slidegeeks has designed a range of layouts that are perfect for representing task or activity duration, keeping track of all your deadlines at a glance. Tailor these designs to your exact needs and give them a truly corporate look with your own brand colors they will make your projects stand out from the rest This slide showcases the improvement of revenue quality of ABB company to assess the profit-producing capability of the business. It highlights percentage of group revenue and management estimates.
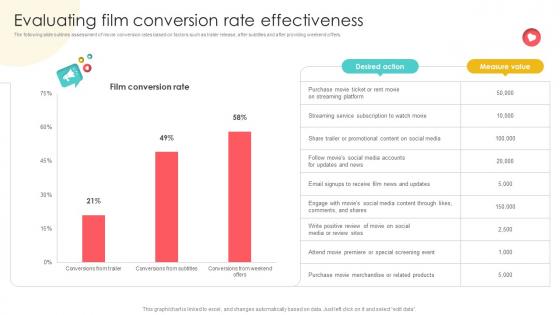
Marketing Channels For Movie Evaluating Film Conversion Rate Effectiveness Strategy SS V
The following slide outlines assessment of movie conversion rates based on factors such as trailer release, after subtitles and after providing weekend offers. Do you have an important presentation coming up Are you looking for something that will make your presentation stand out from the rest Look no further than Marketing Channels For Movie Evaluating Film Conversion Rate Effectiveness Strategy SS V. With our professional designs, you can trust that your presentation will pop and make delivering it a smooth process. And with Slidegeeks, you can trust that your presentation will be unique and memorable. So why wait Grab Marketing Channels For Movie Evaluating Film Conversion Rate Effectiveness Strategy SS V today and make your presentation stand out from the rest. The following slide outlines assessment of movie conversion rates based on factors such as trailer release, after subtitles and after providing weekend offers.
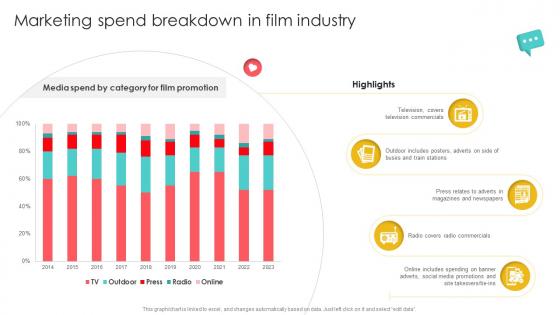
Marketing Channels For Movie Marketing Spend Breakdown In Film Industry Strategy SS V
This Marketing Channels For Movie Marketing Spend Breakdown In Film Industry Strategy SS V from Slidegeeks makes it easy to present information on your topic with precision. It provides customization options, so you can make changes to the colors, design, graphics, or any other component to create a unique layout. It is also available for immediate download, so you can begin using it right away. Slidegeeks has done good research to ensure that you have everything you need to make your presentation stand out. Make a name out there for a brilliant performance. Our Marketing Channels For Movie Marketing Spend Breakdown In Film Industry Strategy SS V are topically designed to provide an attractive backdrop to any subject. Use them to look like a presentation pro.
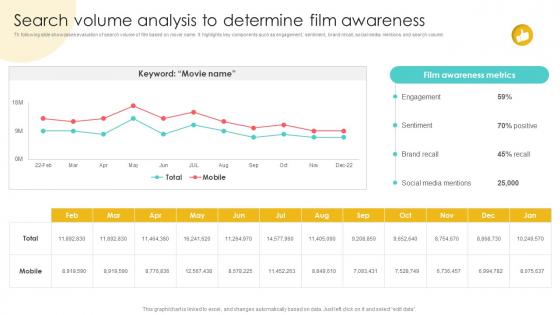
Marketing Channels For Movie Search Volume Analysis To Determine Film Awareness Strategy SS V
Th following slide showcases evaluation of search volume of film based on movie name. It highlights key components such as engagement, sentiment, brand recall, social media mentions and search volume. Do you have an important presentation coming up Are you looking for something that will make your presentation stand out from the rest Look no further than Marketing Channels For Movie Search Volume Analysis To Determine Film Awareness Strategy SS V. With our professional designs, you can trust that your presentation will pop and make delivering it a smooth process. And with Slidegeeks, you can trust that your presentation will be unique and memorable. So why wait Grab Marketing Channels For Movie Search Volume Analysis To Determine Film Awareness Strategy SS V today and make your presentation stand out from the rest Th following slide showcases evaluation of search volume of film based on movie name. It highlights key components such as engagement, sentiment, brand recall, social media mentions and search volume.
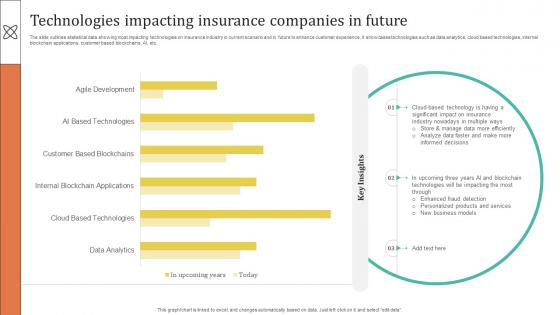
Improving Customer Satisfaction Technologies Impacting Insurance Companies In Future
The slide outlines statistical data showing most impacting technologies on insurance industry in current scenario and in future to enhance customer experience, It showcases technologies such as data analytics, cloud based technologies, internal blockchain applications, customer based blockchains, AI, etc. Make sure to capture your audiences attention in your business displays with our gratis customizable Improving Customer Satisfaction Technologies Impacting Insurance Companies In Future. These are great for business strategies, office conferences, capital raising or task suggestions. If you desire to acquire more customers for your tech business and ensure they stay satisfied, create your own sales presentation with these plain slides. The slide outlines statistical data showing most impacting technologies on insurance industry in current scenario and in future to enhance customer experience, It showcases technologies such as data analytics, cloud based technologies, internal blockchain applications, customer based blockchains, AI, etc.
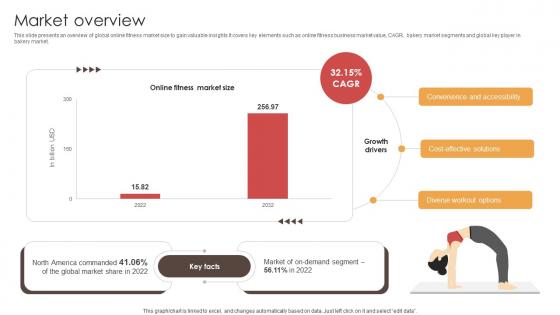
Market Overview Digital Physical Training Business Market Entry Plan GTM SS V
This slide presents an overview of global online fitness market size to gain valuable insights It covers key elements such as online fitness business market value, CAGR, bakery market segments and global key player in bakery market.Do you have an important presentation coming up Are you looking for something that will make your presentation stand out from the rest Look no further than Market Overview Digital Physical Training Business Market Entry Plan GTM SS V. With our professional designs, you can trust that your presentation will pop and make delivering it a smooth process. And with Slidegeeks, you can trust that your presentation will be unique and memorable. So why wait Grab Market Overview Digital Physical Training Business Market Entry Plan GTM SS V today and make your presentation stand out from the rest This slide presents an overview of global online fitness market size to gain valuable insights It covers key elements such as online fitness business market value, CAGR, bakery market segments and global key player in bakery market.
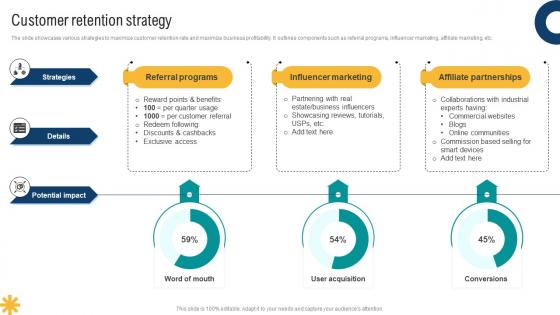
Customer Retention Strategy Smart Home Startup GTM Strategy GTM SS V
The slide showcases various strategies to maximize customer retention rate and maximize business profitability. It outlines components such as referral programs, influencer marketing, affiliate marketing, etc.Do you have an important presentation coming up Are you looking for something that will make your presentation stand out from the rest Look no further than Customer Retention Strategy Smart Home Startup GTM Strategy GTM SS V. With our professional designs, you can trust that your presentation will pop and make delivering it a smooth process. And with Slidegeeks, you can trust that your presentation will be unique and memorable. So why wait Grab Customer Retention Strategy Smart Home Startup GTM Strategy GTM SS V today and make your presentation stand out from the rest The slide showcases various strategies to maximize customer retention rate and maximize business profitability. It outlines components such as referral programs, influencer marketing, affiliate marketing, etc.
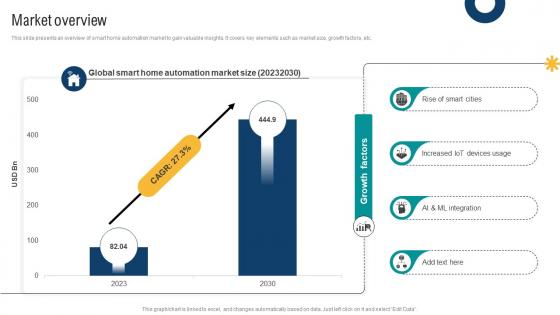
Market Overview Smart Home Startup GTM Strategy GTM SS V
This slide presents an overview of smart home automation market to gain valuable insights. It covers key elements such as market size, growth factors, etc.Do you have an important presentation coming up Are you looking for something that will make your presentation stand out from the rest Look no further than Market Overview Smart Home Startup GTM Strategy GTM SS V. With our professional designs, you can trust that your presentation will pop and make delivering it a smooth process. And with Slidegeeks, you can trust that your presentation will be unique and memorable. So why wait Grab Market Overview Smart Home Startup GTM Strategy GTM SS V today and make your presentation stand out from the rest This slide presents an overview of smart home automation market to gain valuable insights. It covers key elements such as market size, growth factors, etc.
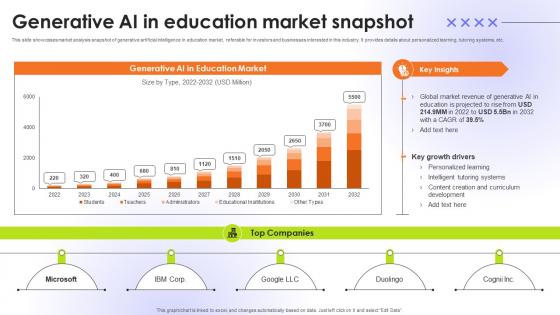
Generative AI In Education Market Snapshot Educational Transformation Through AI SS V
This slide showcases market analysis snapshot of generative artificial intelligence in education market, referable for investors and businesses interested in this industry. It provides details about personalized learning, tutoring systems, etc. Take your projects to the next level with our ultimate collection of Generative AI In Education Market Snapshot Educational Transformation Through AI SS V. Slidegeeks has designed a range of layouts that are perfect for representing task or activity duration, keeping track of all your deadlines at a glance. Tailor these designs to your exact needs and give them a truly corporate look with your own brand colors they will make your projects stand out from the rest This slide showcases market analysis snapshot of generative artificial intelligence in education market, referable for investors and businesses interested in this industry. It provides details about personalized learning, tutoring systems, etc.
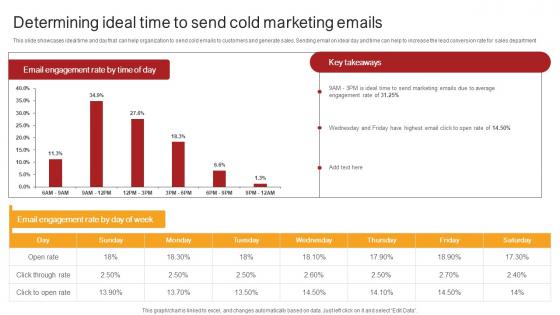
Remote Sales Plan For Determining Ideal Time To Send Cold Marketing Emails Strategy SS V
This slide showcases ideal time and day that can help organization to send cold emails to customers and generate sales. Sending email on ideal day and time can help to increase the lead conversion rate for sales department. Do you have an important presentation coming up Are you looking for something that will make your presentation stand out from the rest Look no further than Remote Sales Plan For Determining Ideal Time To Send Cold Marketing Emails Strategy SS V. With our professional designs, you can trust that your presentation will pop and make delivering it a smooth process. And with Slidegeeks, you can trust that your presentation will be unique and memorable. So why wait Grab Remote Sales Plan For Determining Ideal Time To Send Cold Marketing Emails Strategy SS V today and make your presentation stand out from the rest This slide showcases ideal time and day that can help organization to send cold emails to customers and generate sales. Sending email on ideal day and time can help to increase the lead conversion rate for sales department.

Marketing Growth Strategy Performance Dashboard To Measure Marketing Strategy SS V
The following slide outlines key performance indicator KPI dashboard that can assist digital marketers to evaluate marketing campaign performance. The success metrics outlined in slide are total spend on advertisement, cost per thousand CPM, cost per click CPC, click-through rate CTR, etc. Take your projects to the next level with our ultimate collection of Marketing Growth Strategy Performance Dashboard To Measure Marketing Strategy SS V. Slidegeeks has designed a range of layouts that are perfect for representing task or activity duration, keeping track of all your deadlines at a glance. Tailor these designs to your exact needs and give them a truly corporate look with your own brand colors they will make your projects stand out from the rest The following slide outlines key performance indicator KPI dashboard that can assist digital marketers to evaluate marketing campaign performance. The success metrics outlined in slide are total spend on advertisement, cost per thousand CPM, cost per click CPC, click-through rate CTR, etc.
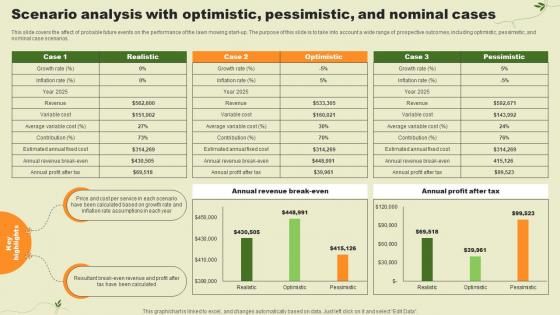
Lawn Care Services Business Plan Scenario Analysis With Optimistic Pessimistic And Nominal Cases BP SS V
This slide covers the affect of probable future events on the performance of the lawn mowing start-up. The purpose of this slide is to take into account a wide range of prospective outcomes, including optimistic, pessimistic, and nominal case scenarios. This Lawn Care Services Business Plan Scenario Analysis With Optimistic Pessimistic And Nominal Cases BP SS V from Slidegeeks makes it easy to present information on your topic with precision. It provides customization options, so you can make changes to the colors, design, graphics, or any other component to create a unique layout. It is also available for immediate download, so you can begin using it right away. Slidegeeks has done good research to ensure that you have everything you need to make your presentation stand out. Make a name out there for a brilliant performance. This slide covers the affect of probable future events on the performance of the lawn mowing start-up. The purpose of this slide is to take into account a wide range of prospective outcomes, including optimistic, pessimistic, and nominal case scenarios.
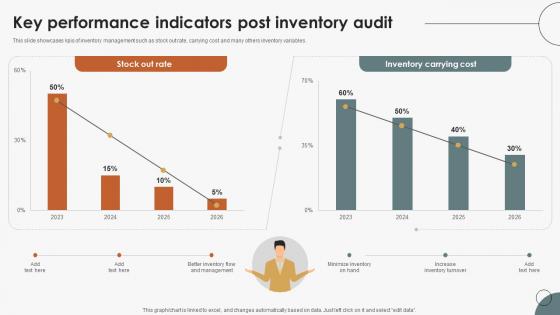
Boosting Efficiency In Inventory Key Performance Indicators Post Inventory Audit
This slide showcases kpis of inventory management such as stock out rate, carrying cost and many others inventory variables. Make sure to capture your audiences attention in your business displays with our gratis customizable Boosting Efficiency In Inventory Key Performance Indicators Post Inventory Audit. These are great for business strategies, office conferences, capital raising or task suggestions. If you desire to acquire more customers for your tech business and ensure they stay satisfied, create your own sales presentation with these plain slides. This slide showcases kpis of inventory management such as stock out rate, carrying cost and many others inventory variables.
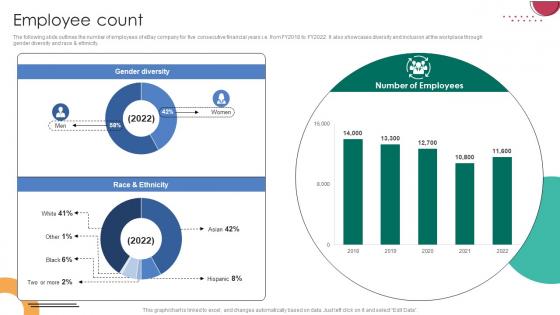
Employee Count C2C Ecommerce Platform Company Profile CP SS V
The following slide outlines the number of employees of eBay company for five consecutive financial years i.e. from FY2018 to FY2022. It also showcases diversity and inclusion at the workplace through gender diversity and race and ethnicity.Do you have an important presentation coming up Are you looking for something that will make your presentation stand out from the rest Look no further than Employee Count C2C Ecommerce Platform Company Profile CP SS V. With our professional designs, you can trust that your presentation will pop and make delivering it a smooth process. And with Slidegeeks, you can trust that your presentation will be unique and memorable. So why wait Grab Employee Count C2C Ecommerce Platform Company Profile CP SS V today and make your presentation stand out from the rest The following slide outlines the number of employees of eBay company for five consecutive financial years i.e. from FY2018 to FY2022. It also showcases diversity and inclusion at the workplace through gender diversity and race and ethnicity.
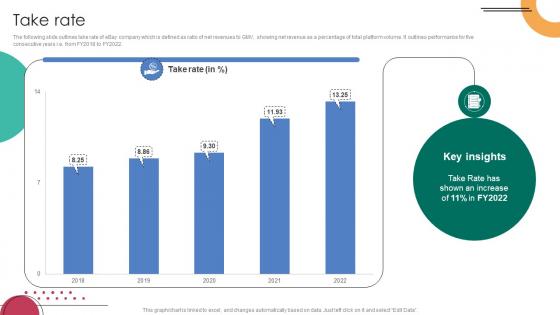
Take Rate C2C Ecommerce Platform Company Profile CP SS V
The following slide outlines take rate of eBay company which is defined as ratio of net revenues to GMV, showing net revenue as a percentage of total platform volume. It outlines performance for five consecutive years i.e. from FY2018 to FY2022.Presenting this PowerPoint presentation, titled Take Rate C2C Ecommerce Platform Company Profile CP SS V, with topics curated by our researchers after extensive research. This editable presentation is available for immediate download and provides attractive features when used. Download now and captivate your audience. Presenting this Take Rate C2C Ecommerce Platform Company Profile CP SS V. Our researchers have carefully researched and created these slides with all aspects taken into consideration. This is a completely customizable Take Rate C2C Ecommerce Platform Company Profile CP SS V that is available for immediate downloading. Download now and make an impact on your audience. Highlight the attractive features available with our PPTs. The following slide outlines take rate of eBay company which is defined as ratio of net revenues to GMV, showing net revenue as a percentage of total platform volume. It outlines performance for five consecutive years i.e. from FY2018 to FY2022.

Cost Of Revenue Enterprise Software Solution Providing Company Profile CP SS V
Following slide provides information about company incurrent cost for generating revenue. It includes cost of revenue in percentage , yearly cost of revenue split.Do you have an important presentation coming up Are you looking for something that will make your presentation stand out from the rest Look no further than Cost Of Revenue Enterprise Software Solution Providing Company Profile CP SS V. With our professional designs, you can trust that your presentation will pop and make delivering it a smooth process. And with Slidegeeks, you can trust that your presentation will be unique and memorable. So why wait Grab Cost Of Revenue Enterprise Software Solution Providing Company Profile CP SS V today and make your presentation stand out from the rest Following slide provides information about company incurrent cost for generating revenue. It includes cost of revenue in percentage , yearly cost of revenue split.
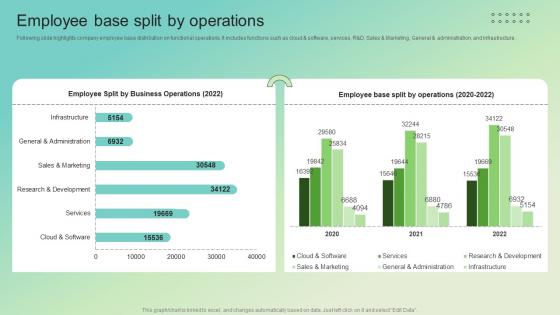
Employee Base Split By Operations Enterprise Software Solution Providing Company Profile CP SS V
Following slide highlights company employee base distribution on functional operations. It includes functions such as cloud and software, services, RandD, Sales and Marketing, General and administration, and infrastructure. Make sure to capture your audiences attention in your business displays with our gratis customizable Employee Base Split By Operations Enterprise Software Solution Providing Company Profile CP SS V. These are great for business strategies, office conferences, capital raising or task suggestions. If you desire to acquire more customers for your tech business and ensure they stay satisfied, create your own sales presentation with these plain slides. Following slide highlights company employee base distribution on functional operations. It includes functions such as cloud and software, services, RandD, Sales and Marketing, General and administration, and infrastructure.
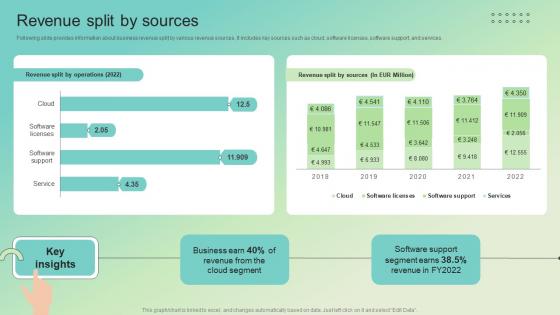
Revenue Split By Sources Enterprise Software Solution Providing Company Profile CP SS V
Following slide provides information about business revenue split by various revenue sources, It includes key sources such as cloud, software licenses, software support, and services.Do you have an important presentation coming up Are you looking for something that will make your presentation stand out from the rest Look no further than Revenue Split By Sources Enterprise Software Solution Providing Company Profile CP SS V. With our professional designs, you can trust that your presentation will pop and make delivering it a smooth process. And with Slidegeeks, you can trust that your presentation will be unique and memorable. So why wait Grab Revenue Split By Sources Enterprise Software Solution Providing Company Profile CP SS V today and make your presentation stand out from the rest Following slide provides information about business revenue split by various revenue sources, It includes key sources such as cloud, software licenses, software support, and services.
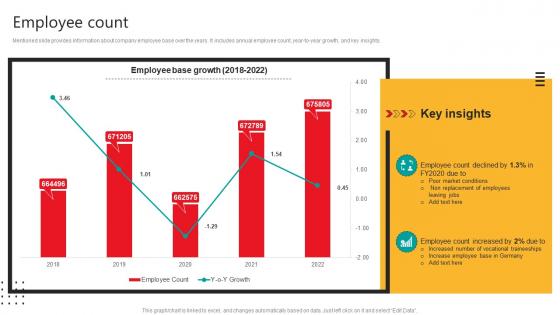
Employee Count Automobile Development Company Profile CP SS V
Mentioned slide provides information about company employee base over the years. It includes annual employee count, year-to-year growth, and key insights.Do you have an important presentation coming up Are you looking for something that will make your presentation stand out from the rest Look no further than Employee Count Automobile Development Company Profile CP SS V. With our professional designs, you can trust that your presentation will pop and make delivering it a smooth process. And with Slidegeeks, you can trust that your presentation will be unique and memorable. So why wait Grab Employee Count Automobile Development Company Profile CP SS V today and make your presentation stand out from the rest Mentioned slide provides information about company employee base over the years. It includes annual employee count, year-to-year growth, and key insights.
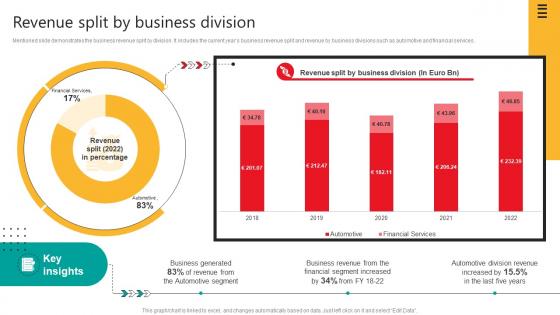
Revenue Split By Business Division Automobile Development Company Profile CP SS V
Mentioned slide demonstrates the business revenue split by division. It includes the current years business revenue split and revenue by business divisions such as automotive and financial services.Take your projects to the next level with our ultimate collection of Revenue Split By Business Division Automobile Development Company Profile CP SS V. Slidegeeks has designed a range of layouts that are perfect for representing task or activity duration, keeping track of all your deadlines at a glance. Tailor these designs to your exact needs and give them a truly corporate look with your own brand colors they will make your projects stand out from the rest Mentioned slide demonstrates the business revenue split by division. It includes the current years business revenue split and revenue by business divisions such as automotive and financial services.
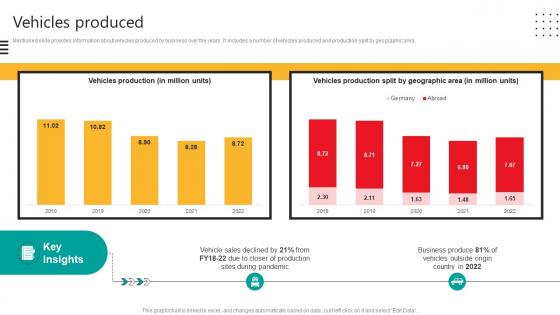
Vehicles Produced Automobile Development Company Profile CP SS V
Mentioned slide provides information about vehicles produced by business over the years. It includes a number of vehicles produced and production split by geographic area.Do you have an important presentation coming up Are you looking for something that will make your presentation stand out from the rest Look no further than Vehicles Produced Automobile Development Company Profile CP SS V. With our professional designs, you can trust that your presentation will pop and make delivering it a smooth process. And with Slidegeeks, you can trust that your presentation will be unique and memorable. So why wait Grab Vehicles Produced Automobile Development Company Profile CP SS V today and make your presentation stand out from the rest Mentioned slide provides information about vehicles produced by business over the years. It includes a number of vehicles produced and production split by geographic area.
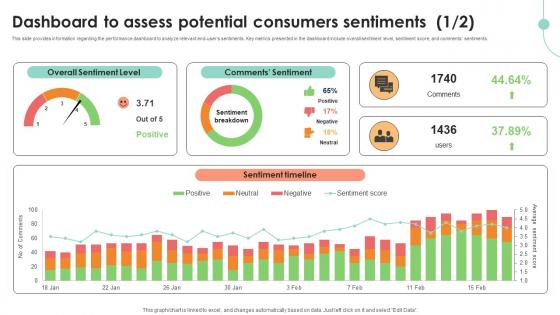
Dashboard To Assess Potential Consumers Decoding User Emotions In Depth Exploration AI SS V
This slide provides information regarding the performance dashboard to analyze relevant end-users sentiments. Key metrics presented in the dashboard include overall sentiment level, sentiment score, and comments sentiments. Do you have an important presentation coming up Are you looking for something that will make your presentation stand out from the rest Look no further than Dashboard To Assess Potential Consumers Decoding User Emotions In Depth Exploration AI SS V. With our professional designs, you can trust that your presentation will pop and make delivering it a smooth process. And with Slidegeeks, you can trust that your presentation will be unique and memorable. So why wait Grab Dashboard To Assess Potential Consumers Decoding User Emotions In Depth Exploration AI SS V today and make your presentation stand out from the rest This slide provides information regarding the performance dashboard to analyze relevant end-users sentiments. Key metrics presented in the dashboard include overall sentiment level, sentiment score, and comments sentiments.
Driving Results Designing A Team Training And Development Program Tracking Dashboard
This slide depicts team development program tracking dashboard to analyze the impact of implementing training plan for the members. It includes training satisfaction rate, engagement score, drop-out rate and top 5 trainees. Take your projects to the next level with our ultimate collection of Driving Results Designing A Team Training And Development Program Tracking Dashboard. Slidegeeks has designed a range of layouts that are perfect for representing task or activity duration, keeping track of all your deadlines at a glance. Tailor these designs to your exact needs and give them a truly corporate look with your own brand colors they will make your projects stand out from the rest This slide depicts team development program tracking dashboard to analyze the impact of implementing training plan for the members. It includes training satisfaction rate, engagement score, drop-out rate and top 5 trainees.
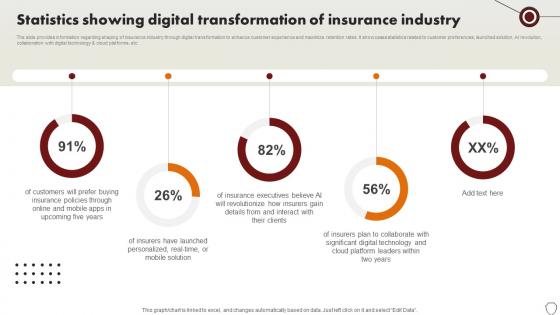
Technology Trends In Online Insurance Statistics Showing Digital Transformation Of Insurance Industry
The slide provides information regarding shaping of insurance industry through digital transformation to enhance customer experience and maximize retention rates. It showcases statistics related to customer preferences, launched solution, AI revolution, collaboration with digital technology and cloud platforms, etc. Make sure to capture your audiences attention in your business displays with our gratis customizable Technology Trends In Online Insurance Statistics Showing Digital Transformation Of Insurance Industry. These are great for business strategies, office conferences, capital raising or task suggestions. If you desire to acquire more customers for your tech business and ensure they stay satisfied, create your own sales presentation with these plain slides. The slide provides information regarding shaping of insurance industry through digital transformation to enhance customer experience and maximize retention rates. It showcases statistics related to customer preferences, launched solution, AI revolution, collaboration with digital technology and cloud platforms, etc.
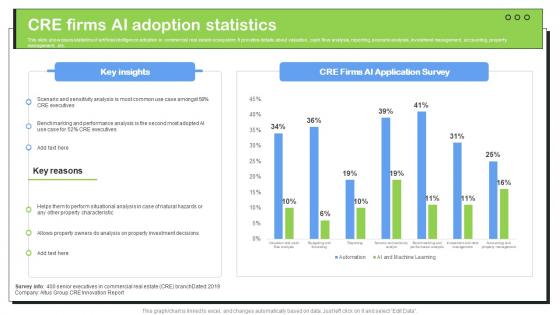
Transforming Real Estate Cre Firms Ai Adoption Statistics ChatGPT SS V
This slide showcases statistics of artificial intelligence adoption in commercial real estate ecosystem. It provides details about valuation, cash flow analysis, reporting, scenario analysis, investment management, accounting, property management, etc. Make sure to capture your audiences attention in your business displays with our gratis customizable Transforming Real Estate Cre Firms Ai Adoption Statistics ChatGPT SS V. These are great for business strategies, office conferences, capital raising or task suggestions. If you desire to acquire more customers for your tech business and ensure they stay satisfied, create your own sales presentation with these plain slides. This slide showcases statistics of artificial intelligence adoption in commercial real estate ecosystem. It provides details about valuation, cash flow analysis, reporting, scenario analysis, investment management, accounting, property management, etc.
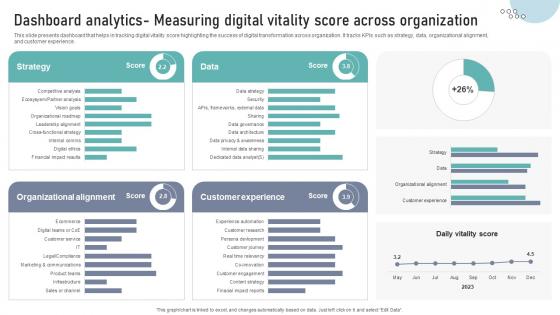
Dashboard Analytics Measuring Digital Vitality Score Across Organization DT SS V
This slide presents dashboard that helps in tracking digital vitality score highlighting the success of digital transformation across organization. It tracks KPIs such as strategy, data, organizational alignment,and customer experience.Make sure to capture your audiences attention in your business displays with our gratis customizable Dashboard Analytics Measuring Digital Vitality Score Across Organization DT SS V. These are great for business strategies, office conferences, capital raising or task suggestions. If you desire to acquire more customers for your tech business and ensure they stay satisfied, create your own sales presentation with these plain slides. This slide presents dashboard that helps in tracking digital vitality score highlighting the success of digital transformation across organization. It tracks KPIs such as strategy, data, organizational alignment,and customer experience.
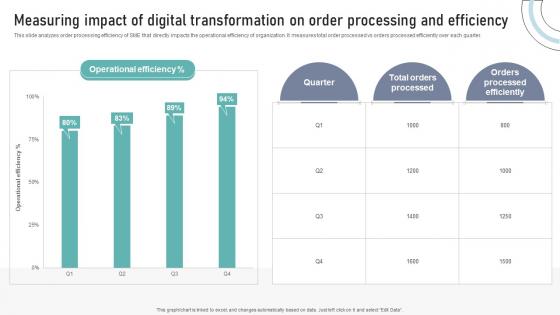
Measuring Impact Of Digital Transformation On Order Processing And Efficiency DT SS V
This slide analyzes order processing efficiency of SME that directly impacts the operational efficiency of organization. It measures total order processed vs orders processed efficiently over each quarter.Do you have an important presentation coming up Are you looking for something that will make your presentation stand out from the rest Look no further than Measuring Impact Of Digital Transformation On Order Processing And Efficiency DT SS V. With our professional designs, you can trust that your presentation will pop and make delivering it a smooth process. And with Slidegeeks, you can trust that your presentation will be unique and memorable. So why wait Grab Measuring Impact Of Digital Transformation On Order Processing And Efficiency DT SS V today and make your presentation stand out from the rest This slide analyzes order processing efficiency of SME that directly impacts the operational efficiency of organization. It measures total order processed vs orders processed efficiently over each quarter.
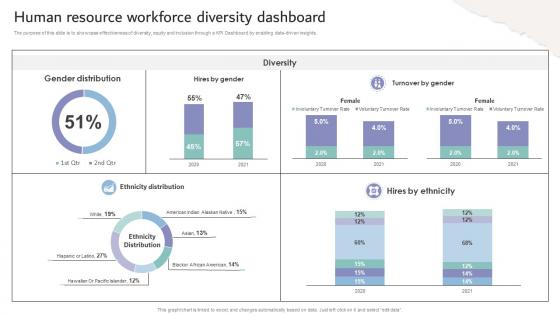
Inclusive Workplace Training Program Human Resource Workforce Diversity Dashboard DTE SS V
The purpose of this slide is to showcase effectiveness of diversity, equity and inclusion through a KPI Dashboard by enabling data-driven insights. Make sure to capture your audiences attention in your business displays with our gratis customizable Inclusive Workplace Training Program Human Resource Workforce Diversity Dashboard DTE SS V. These are great for business strategies, office conferences, capital raising or task suggestions. If you desire to acquire more customers for your tech business and ensure they stay satisfied, create your own sales presentation with these plain slides. The purpose of this slide is to showcase effectiveness of diversity, equity and inclusion through a KPI Dashboard by enabling data-driven insights.
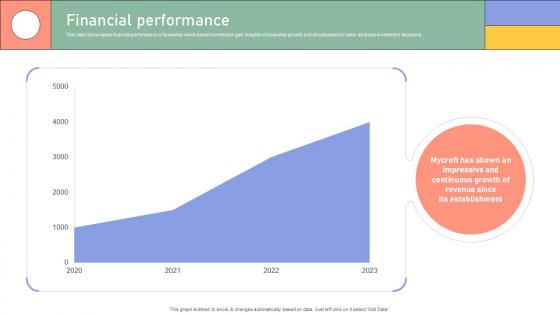
Financial Performance Enterprise Software Application Investor Funding Elevator Pitch Deck
This slide showcases financial performance of business which assist investors to gain insights of business growth and development to make strategic investment decisions. Do you have an important presentation coming up Are you looking for something that will make your presentation stand out from the rest Look no further than Financial Performance Enterprise Software Application Investor Funding Elevator Pitch Deck. With our professional designs, you can trust that your presentation will pop and make delivering it a smooth process. And with Slidegeeks, you can trust that your presentation will be unique and memorable. So why wait Grab Financial Performance Enterprise Software Application Investor Funding Elevator Pitch Deck today and make your presentation stand out from the rest This slide showcases financial performance of business which assist investors to gain insights of business growth and development to make strategic investment decisions.
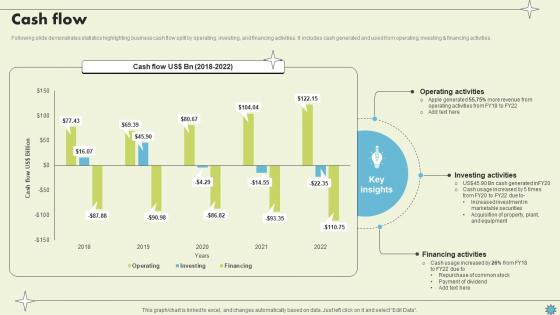
Cash Flow Consumer Electronics Company Profile CP SS V
Following slide demonstrates statistics highlighting business cash flow split by operating, investing, and financing activities. It includes cash generated and used from operating, investing and financing activities. Do you have an important presentation coming up Are you looking for something that will make your presentation stand out from the rest Look no further than Cash Flow Consumer Electronics Company Profile CP SS V. With our professional designs, you can trust that your presentation will pop and make delivering it a smooth process. And with Slidegeeks, you can trust that your presentation will be unique and memorable. So why wait Grab Cash Flow Consumer Electronics Company Profile CP SS V today and make your presentation stand out from the rest Following slide demonstrates statistics highlighting business cash flow split by operating, investing, and financing activities. It includes cash generated and used from operating, investing and financing activities.
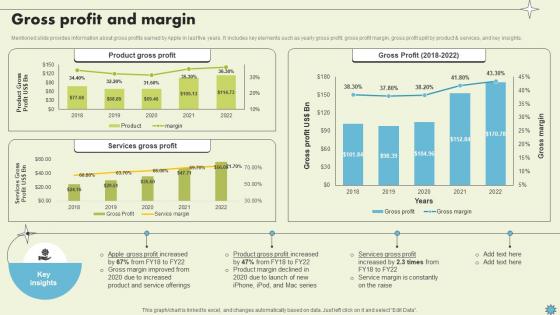
Gross Profit And Margin Consumer Electronics Company Profile CP SS V
Mentioned slide provides information about gross profits earned by Apple in last five years. It includes key elements such as yearly gross profit, gross profit margin, gross profit split by product and services, and key insights.Take your projects to the next level with our ultimate collection of Gross Profit And Margin Consumer Electronics Company Profile CP SS V. Slidegeeks has designed a range of layouts that are perfect for representing task or activity duration, keeping track of all your deadlines at a glance. Tailor these designs to your exact needs and give them a truly corporate look with your own brand colors they will make your projects stand out from the rest Mentioned slide provides information about gross profits earned by Apple in last five years. It includes key elements such as yearly gross profit, gross profit margin, gross profit split by product and services, and key insights.
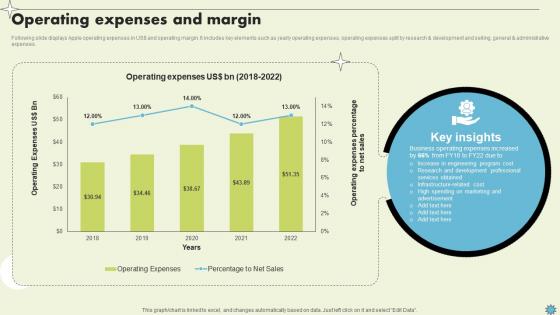
Operating Expenses And Margin Consumer Electronics Company Profile CP SS V
Following slide displays Apple operating expenses in USdollar and operating margin. It includes key elements such as yearly operating expenses, operating expenses split by research and development and selling, general and administrative expenses.Do you have an important presentation coming up Are you looking for something that will make your presentation stand out from the rest Look no further than Operating Expenses And Margin Consumer Electronics Company Profile CP SS V. With our professional designs, you can trust that your presentation will pop and make delivering it a smooth process. And with Slidegeeks, you can trust that your presentation will be unique and memorable. So why wait Grab Operating Expenses And Margin Consumer Electronics Company Profile CP SS V today and make your presentation stand out from the rest Following slide displays Apple operating expenses in USdollar and operating margin. It includes key elements such as yearly operating expenses, operating expenses split by research and development and selling, general and administrative expenses.
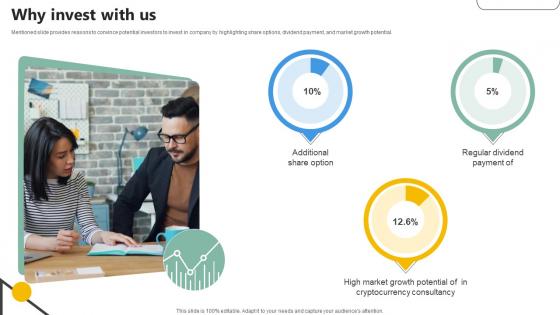
Why Invest With Us Analytics Company Investor Funding Elevator
Mentioned slide provides reasons to convince potential investors to invest in company by highlighting share options, dividend payment, and market growth potential.Presenting this PowerPoint presentation, titled Why Invest With Us Analytics Company Investor Funding Elevator, with topics curated by our researchers after extensive research. This editable presentation is available for immediate download and provides attractive features when used. Download now and captivate your audience. Presenting this Why Invest With Us Analytics Company Investor Funding Elevator. Our researchers have carefully researched and created these slides with all aspects taken into consideration. This is a completely customizable Why Invest With Us Analytics Company Investor Funding Elevator that is available for immediate downloading. Download now and make an impact on your audience. Highlight the attractive features available with our PPTs. Mentioned slide provides reasons to convince potential investors to invest in company by highlighting share options, dividend payment, and market growth potential.
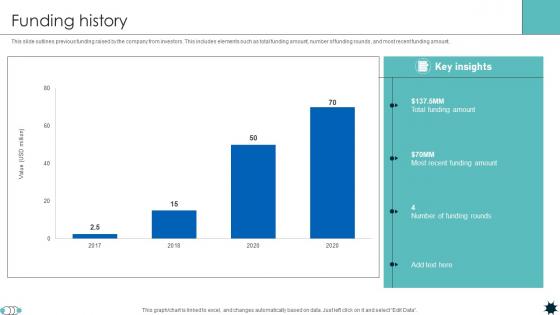
Funding History Life Coverage Platform Pitch Deck
This slide outlines previous funding raised by the company from investors. This includes elements such as total funding amount, number of funding rounds, and most recent funding amount. Do you have an important presentation coming up Are you looking for something that will make your presentation stand out from the rest Look no further than Service Platform,Work Certification With our professional designs, you can trust that your presentation will pop and make delivering it a smooth process. And with Slidegeeks, you can trust that your presentation will be unique and memorable. So why wait Grab Funding History Life Coverage Platform Pitch Deck today and make your presentation stand out from the rest This slide outlines previous funding raised by the company from investors. This includes elements such as total funding amount, number of funding rounds, and most recent funding amount.

Comprehensive Guide For Website Customer Engagement And Conversion Rate Evaluation
Mentioned slide provides information business annual customer conversion and engagement rate. It includes key components such as conversion rate, engagement rate, and key insights. Make sure to capture your audiences attention in your business displays with our gratis customizable Comprehensive Guide For Website Customer Engagement And Conversion Rate Evaluation. These are great for business strategies, office conferences, capital raising or task suggestions. If you desire to acquire more customers for your tech business and ensure they stay satisfied, create your own sales presentation with these plain slides. Mentioned slide provides information business annual customer conversion and engagement rate. It includes key components such as conversion rate, engagement rate, and key insights.
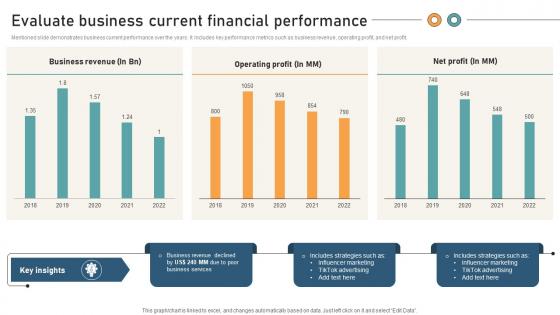
Comprehensive Guide For Website Evaluate Business Current Financial Performance
Mentioned slide demonstrates business current performance over the years. It includes key performance metrics such as business revenue, operating profit, and net profit. This Comprehensive Guide For Website Evaluate Business Current Financial Performance from Slidegeeks makes it easy to present information on your topic with precision. It provides customization options, so you can make changes to the colors, design, graphics, or any other component to create a unique layout. It is also available for immediate download, so you can begin using it right away. Slidegeeks has done good research to ensure that you have everything you need to make your presentation stand out. Make a name out there for a brilliant performance. Mentioned slide demonstrates business current performance over the years. It includes key performance metrics such as business revenue, operating profit, and net profit.
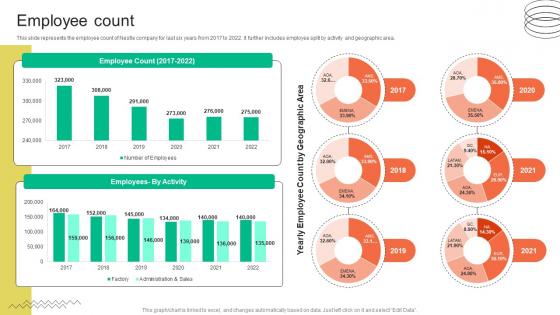
Employee Count FMCG Provider Company Profile CP SS V
This slide represents the employee count of Nestle company for last six years from 2017 to 2022. It further includes employee split by activity and geographic area. Do you have an important presentation coming up Are you looking for something that will make your presentation stand out from the rest Look no further than Employee Count FMCG Provider Company Profile CP SS V. With our professional designs, you can trust that your presentation will pop and make delivering it a smooth process. And with Slidegeeks, you can trust that your presentation will be unique and memorable. So why wait Grab Employee Count FMCG Provider Company Profile CP SS V today and make your presentation stand out from the rest This slide represents the employee count of Nestle company for last six years from 2017 to 2022. It further includes employee split by activity and geographic area.
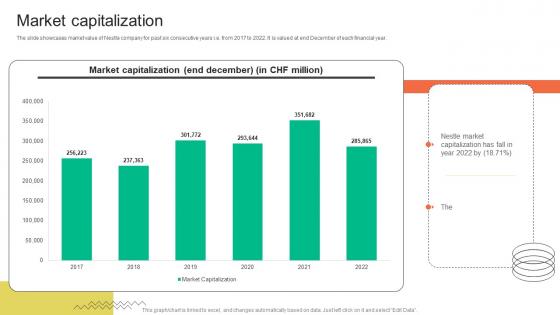
Market Capitalization FMCG Provider Company Profile CP SS V
The slide showcases market value of Nestle company for past six consecutive years i.e. from 2017 to 2022. It is valued at end December of each financial year. Make sure to capture your audiences attention in your business displays with our gratis customizable Market Capitalization FMCG Provider Company Profile CP SS V. These are great for business strategies, office conferences, capital raising or task suggestions. If you desire to acquire more customers for your tech business and ensure they stay satisfied, create your own sales presentation with these plain slides. The slide showcases market value of Nestle company for past six consecutive years i.e. from 2017 to 2022. It is valued at end December of each financial year.
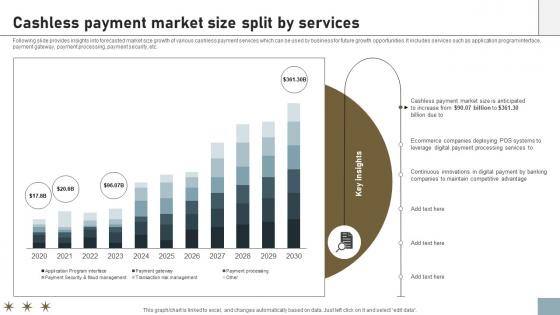
Online Payment Techniques For Providing Cashless Payment Market Size Split
Following slide provides insights into forecasted market size growth of various cashless payment services which can be used by business for future growth opportunities. It includes services such as application program interface, payment gateway, payment processing, payment security, etc. Take your projects to the next level with our ultimate collection of Online Payment Techniques For Providing Cashless Payment Market Size Split. Slidegeeks has designed a range of layouts that are perfect for representing task or activity duration, keeping track of all your deadlines at a glance. Tailor these designs to your exact needs and give them a truly corporate look with your own brand colors they will make your projects stand out from the rest Following slide provides insights into forecasted market size growth of various cashless payment services which can be used by business for future growth opportunities. It includes services such as application program interface, payment gateway, payment processing, payment security, etc.
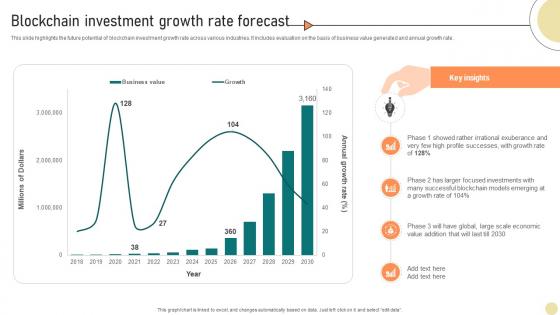
Visionary Guide To Blockchain Investment Growth Rate Forecast BCT SS V
This slide highlights the future potential of blockchain investment growth rate across various industries. It includes evaluation on the basis of business value generated and annual growth rate. Presenting this PowerPoint presentation, titled Visionary Guide To Blockchain Investment Growth Rate Forecast BCT SS V, with topics curated by our researchers after extensive research. This editable presentation is available for immediate download and provides attractive features when used. Download now and captivate your audience. Presenting this Visionary Guide To Blockchain Investment Growth Rate Forecast BCT SS V. Our researchers have carefully researched and created these slides with all aspects taken into consideration. This is a completely customizable Visionary Guide To Blockchain Investment Growth Rate Forecast BCT SS V that is available for immediate downloading. Download now and make an impact on your audience. Highlight the attractive features available with our PPTs. This slide highlights the future potential of blockchain investment growth rate across various industries. It includes evaluation on the basis of business value generated and annual growth rate.
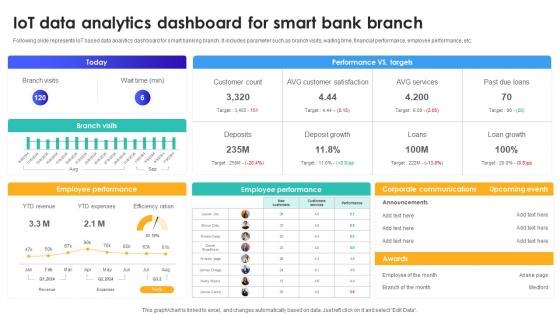
IoT Data Analytics Dashboard For Smart Bank Branch IoT In Banking For Digital Future IoT SS V
Following slide represents IoT based data analytics dashboard for smart banking branch. It includes parameter such as branch visits, waiting time, financial performance, employee performance, etc. Do you have an important presentation coming up Are you looking for something that will make your presentation stand out from the rest Look no further than IoT Data Analytics Dashboard For Smart Bank Branch IoT In Banking For Digital Future IoT SS V. With our professional designs, you can trust that your presentation will pop and make delivering it a smooth process. And with Slidegeeks, you can trust that your presentation will be unique and memorable. So why wait Grab IoT Data Analytics Dashboard For Smart Bank Branch IoT In Banking For Digital Future IoT SS V today and make your presentation stand out from the rest Following slide represents IoT based data analytics dashboard for smart banking branch. It includes parameter such as branch visits, waiting time, financial performance, employee performance, etc.
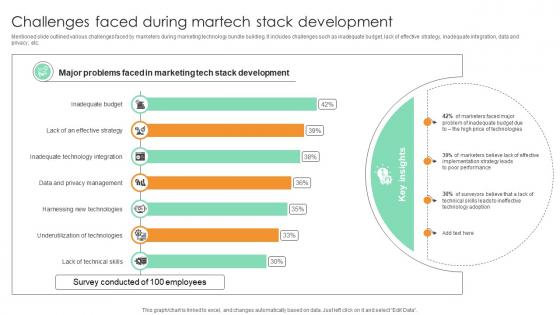
Challenges Faced During Martech Stack Development Comprehensive Guide For Marketing Technology
Mentioned slide outlined various challenges faced by marketers during marketing technology bundle building. It includes challenges such as inadequate budget, lack of effective strategy, inadequate integration, data and privacy, etc.Do you have an important presentation coming up Are you looking for something that will make your presentation stand out from the rest Look no further than Challenges Faced During Martech Stack Development Comprehensive Guide For Marketing Technology. With our professional designs, you can trust that your presentation will pop and make delivering it a smooth process. And with Slidegeeks, you can trust that your presentation will be unique and memorable. So why wait Grab Challenges Faced During Martech Stack Development Comprehensive Guide For Marketing Technology today and make your presentation stand out from the rest Mentioned slide outlined various challenges faced by marketers during marketing technology bundle building. It includes challenges such as inadequate budget, lack of effective strategy, inadequate integration, data and privacy, etc.
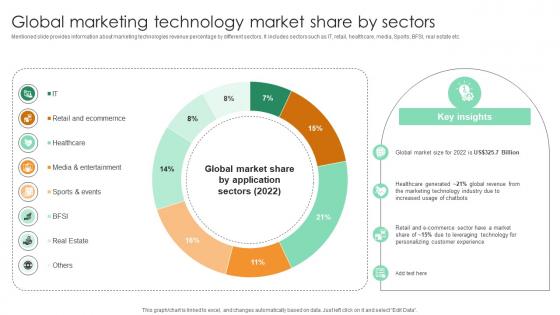
Global Marketing Technology Market Share By Sectors Comprehensive Guide For Marketing Technology
Mentioned slide provides information about marketing technologies revenue percentage by different sectors. It includes sectors such as IT, retail, healthcare, media, Sports, BFSI, real estate etc. This Global Marketing Technology Market Share By Sectors Comprehensive Guide For Marketing Technology from Slidegeeks makes it easy to present information on your topic with precision. It provides customization options, so you can make changes to the colors, design, graphics, or any other component to create a unique layout. It is also available for immediate download, so you can begin using it right away. Slidegeeks has done good research to ensure that you have everything you need to make your presentation stand out. Make a name out there for a brilliant performance. Mentioned slide provides information about marketing technologies revenue percentage by different sectors. It includes sectors such as IT, retail, healthcare, media, Sports, BFSI, real estate etc.
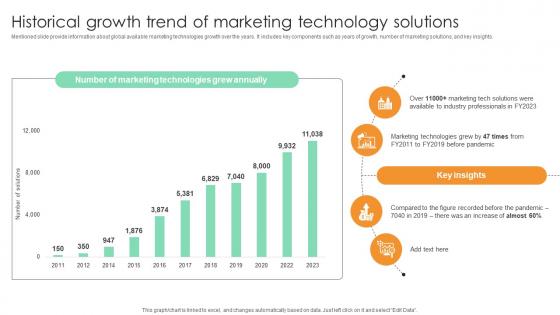
Historical Growth Trend Of Marketing Technology Comprehensive Guide For Marketing Technology
Mentioned slide provide information about global available marketing technologies growth over the years. It includes key components such as years of growth, number of marketing solutions, and key insights. Take your projects to the next level with our ultimate collection of Historical Growth Trend Of Marketing Technology Comprehensive Guide For Marketing Technology. Slidegeeks has designed a range of layouts that are perfect for representing task or activity duration, keeping track of all your deadlines at a glance. Tailor these designs to your exact needs and give them a truly corporate look with your own brand colors they will make your projects stand out from the rest Mentioned slide provide information about global available marketing technologies growth over the years. It includes key components such as years of growth, number of marketing solutions, and key insights.
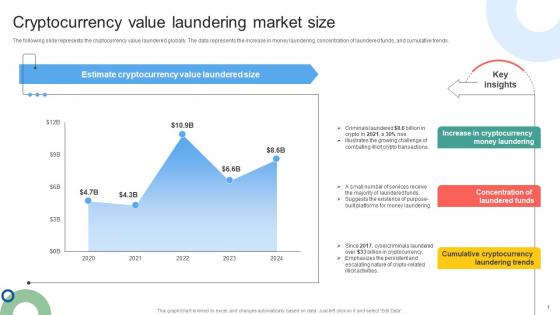
Cryptocurrency Value Laundering Market Size Mapping Out The Anti Money Fin SS V
The following slide represents the cryptocurrency value laundered globally. The data represents the increase in money laundering, concentration of laundered funds, and cumulative trends. Make sure to capture your audiences attention in your business displays with our gratis customizable Cryptocurrency Value Laundering Market Size Mapping Out The Anti Money Fin SS V. These are great for business strategies, office conferences, capital raising or task suggestions. If you desire to acquire more customers for your tech business and ensure they stay satisfied, create your own sales presentation with these plain slides. The following slide represents the cryptocurrency value laundered globally. The data represents the increase in money laundering, concentration of laundered funds, and cumulative trends.
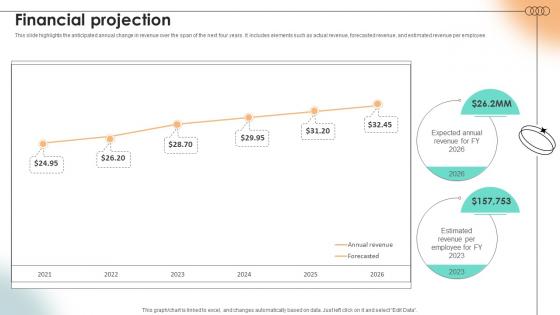
Financial Projection Content Marketing Platform Investor Funding Elevator Pitch Deck
This slide highlights the anticipated annual change in revenue over the span of the next four years. It includes elements such as actual revenue, forecasted revenue, and estimated revenue per employee. Do you have an important presentation coming up Are you looking for something that will make your presentation stand out from the rest Look no further than Financial Projection Content Marketing Platform Investor Funding Elevator Pitch Deck. With our professional designs, you can trust that your presentation will pop and make delivering it a smooth process. And with Slidegeeks, you can trust that your presentation will be unique and memorable. So why wait Grab Financial Projection Content Marketing Platform Investor Funding Elevator Pitch Deck today and make your presentation stand out from the rest This slide highlights the anticipated annual change in revenue over the span of the next four years. It includes elements such as actual revenue, forecasted revenue, and estimated revenue per employee.
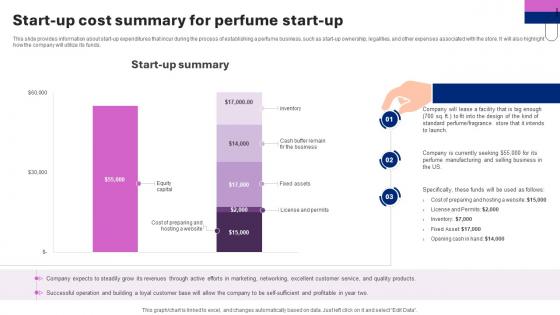
Perfume Manufacturing Business Plan Start Up Cost Summary For Perfume Start Up BP SS V
This slide provides information about start-up expenditures that incur during the process of establishing a perfume business, such as start-up ownership, legalities, and other expenses associated with the store. It will also highlight how the company will utilize its funds. This Perfume Manufacturing Business Plan Start Up Cost Summary For Perfume Start Up BP SS V from Slidegeeks makes it easy to present information on your topic with precision. It provides customization options, so you can make changes to the colors, design, graphics, or any other component to create a unique layout. It is also available for immediate download, so you can begin using it right away. Slidegeeks has done good research to ensure that you have everything you need to make your presentation stand out. Make a name out there for a brilliant performance. This slide provides information about start-up expenditures that incur during the process of establishing a perfume business, such as start-up ownership, legalities, and other expenses associated with the store. It will also highlight how the company will utilize its funds.

Key Components Of Credit Score For Card Approval Swipe Smartly A Practical Guide Fin SS V
This slide shows details about various components included in credit score which can be used by individuals to get more understanding about it. These components are payment history, credit utilization, length of credit history, etc. Presenting this PowerPoint presentation, titled Key Components Of Credit Score For Card Approval Swipe Smartly A Practical Guide Fin SS V, with topics curated by our researchers after extensive research. This editable presentation is available for immediate download and provides attractive features when used. Download now and captivate your audience. Presenting this Key Components Of Credit Score For Card Approval Swipe Smartly A Practical Guide Fin SS V. Our researchers have carefully researched and created these slides with all aspects taken into consideration. This is a completely customizable Key Components Of Credit Score For Card Approval Swipe Smartly A Practical Guide Fin SS V that is available for immediate downloading. Download now and make an impact on your audience. Highlight the attractive features available with our PPTs. This slide shows details about various components included in credit score which can be used by individuals to get more understanding about it. These components are payment history, credit utilization, length of credit history, etc.
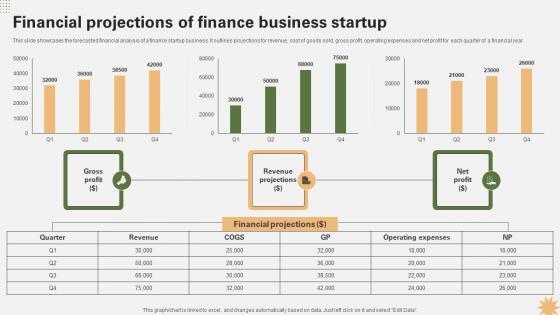
Financial Projections Of Finance Business Strategy For Launching A Financial Strategy SS V
This slide showcases the forecasted financial analysis of a finance startup business. It outlines projections for revenue, cost of goods sold, gross profit, operating expenses and net profit for each quarter of a financial year. Do you have an important presentation coming up Are you looking for something that will make your presentation stand out from the rest Look no further than Financial Projections Of Finance Business Strategy For Launching A Financial Strategy SS V. With our professional designs, you can trust that your presentation will pop and make delivering it a smooth process. And with Slidegeeks, you can trust that your presentation will be unique and memorable. So why wait Grab Financial Projections Of Finance Business Strategy For Launching A Financial Strategy SS V today and make your presentation stand out from the rest This slide showcases the forecasted financial analysis of a finance startup business. It outlines projections for revenue, cost of goods sold, gross profit, operating expenses and net profit for each quarter of a financial year.
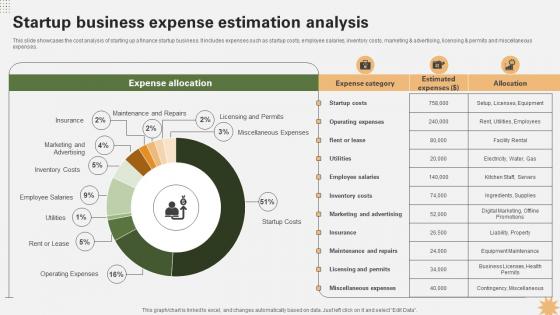
Startup Business Expense Estimation Analysis Strategy For Launching A Financial Strategy SS V
This slide showcases the cost analysis of starting up a finance startup business. It includes expenses such as startup costs, employee salaries, inventory costs, marketing and advertising, licensing and permits and miscellaneous expenses. Take your projects to the next level with our ultimate collection of Startup Business Expense Estimation Analysis Strategy For Launching A Financial Strategy SS V. Slidegeeks has designed a range of layouts that are perfect for representing task or activity duration, keeping track of all your deadlines at a glance. Tailor these designs to your exact needs and give them a truly corporate look with your own brand colors they will make your projects stand out from the rest This slide showcases the cost analysis of starting up a finance startup business. It includes expenses such as startup costs, employee salaries, inventory costs, marketing and advertising, licensing and permits and miscellaneous expenses.
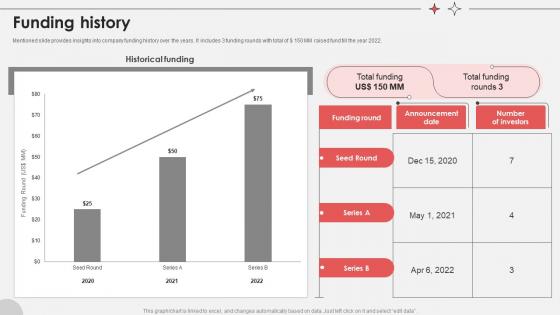
Funding History Virtual Medical Consultancy Investor Funding Elevator Pitch Deck
Mentioned slide provides insights into company funding history over the years. It includes 3 funding rounds with total of dollar 150 MM raised fund till the year 2022. Do you have an important presentation coming up Are you looking for something that will make your presentation stand out from the rest Look no further than Funding History Virtual Medical Consultancy Investor Funding Elevator Pitch Deck. With our professional designs, you can trust that your presentation will pop and make delivering it a smooth process. And with Slidegeeks, you can trust that your presentation will be unique and memorable. So why wait Grab Funding History Virtual Medical Consultancy Investor Funding Elevator Pitch Deck today and make your presentation stand out from the rest Mentioned slide provides insights into company funding history over the years. It includes 3 funding rounds with total of dollar 150 MM raised fund till the year 2022.
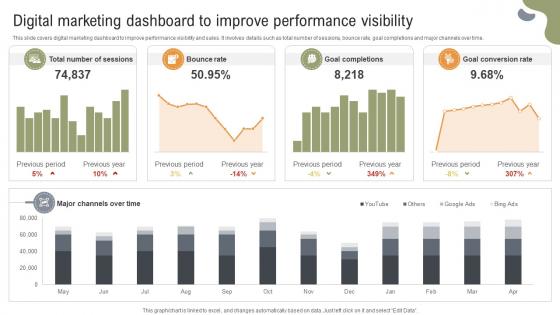
Implementing Strategies To Enhance Digital Marketing Dashboard To Improve Performance
This slide covers digital marketing dashboard to improve performance visibility and sales. It involves details such as total number of sessions, bounce rate, goal completions and major channels over time. Do you have an important presentation coming up Are you looking for something that will make your presentation stand out from the rest Look no further than Implementing Strategies To Enhance Digital Marketing Dashboard To Improve Performance. With our professional designs, you can trust that your presentation will pop and make delivering it a smooth process. And with Slidegeeks, you can trust that your presentation will be unique and memorable. So why wait Grab Implementing Strategies To Enhance Digital Marketing Dashboard To Improve Performance today and make your presentation stand out from the rest This slide covers digital marketing dashboard to improve performance visibility and sales. It involves details such as total number of sessions, bounce rate, goal completions and major channels over time.
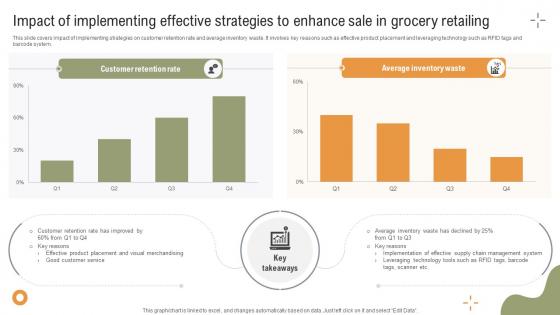
Implementing Strategies To Enhance Impact Of Implementing Effective Strategies To Enhance
This slide covers impact of implementing strategies on customer retention rate and average inventory waste. It involves key reasons such as effective product placement and leveraging technology such as RFID tags and barcode system. Make sure to capture your audiences attention in your business displays with our gratis customizable Implementing Strategies To Enhance Impact Of Implementing Effective Strategies To Enhance. These are great for business strategies, office conferences, capital raising or task suggestions. If you desire to acquire more customers for your tech business and ensure they stay satisfied, create your own sales presentation with these plain slides. This slide covers impact of implementing strategies on customer retention rate and average inventory waste. It involves key reasons such as effective product placement and leveraging technology such as RFID tags and barcode system.


 Continue with Email

 Home
Home


