Bar Graph
Person Installing The Graph Business PowerPoint Templates And PowerPoint Backgrounds 0411
Microsoft PowerPoint Template and Background with 3D puppet installing the business graph Leave a lasting impression with our Person Installing The Graph Business PowerPoint Templates And PowerPoint Backgrounds 0411. Make sure people remember your presentations.
Arrow Graph Going Up Global PowerPoint Templates And PowerPoint Backgrounds 0511
Microsoft PowerPoint Template and Background with arrow graph going up Expound your logic on our Arrow Graph Going Up Global PowerPoint Templates And PowerPoint Backgrounds 0511. Let them in on your chain of thought.

Businessman Holding Up Graph Marketing PowerPoint Templates And PowerPoint Backgrounds 0511
Microsoft PowerPoint Template and Background with young modern businessman holding up graph Get face to face with your audience. Put your thoughts and our Businessman Holding Up Graph Marketing PowerPoint Templates And PowerPoint Backgrounds 0511 right up front.
Business Graph With Check Metaphor PowerPoint Templates And PowerPoint Backgrounds 0511
Microsoft PowerPoint Template and Background with a combination of a check mark and financial graph Our Business Graph With Check Metaphor PowerPoint Templates And PowerPoint Backgrounds 0511 are very falcon like. They keep a sharp eye on the target.

Dices On Financial Graph Business PowerPoint Templates And PowerPoint Backgrounds 0511
Microsoft PowerPoint Template and Background with dices on financial graph Enliven the discussion with our Dices On Financial Graph Business PowerPoint Templates And PowerPoint Backgrounds 0511. The audience will get all animated.

Man Drawing A Graph Marketing PowerPoint Templates And PowerPoint Backgrounds 0511
Microsoft PowerPoint Template and Background with business man drawing a growth graph Start driving performance improvement with our Man Drawing A Graph Marketing PowerPoint Templates And PowerPoint Backgrounds 0511. They will make you look good.
Success Graph With Dollar Business PowerPoint Templates And PowerPoint Backgrounds 0511
Microsoft PowerPoint Template and Background with business graph from dollar coins with arrow showing profits Let new ideas filter in with our Success Graph With Dollar Business PowerPoint Templates And PowerPoint Backgrounds 0511. They will be acceptable to any audience.

Man With A Graph Business PowerPoint Templates And PowerPoint Backgrounds 0611
Microsoft PowerPoint Template and Background with successful business man with a graph Our Man With A Graph Business PowerPoint Templates And PowerPoint Backgrounds 0611 will boost even a faint hope. They build up the belief in positive action.
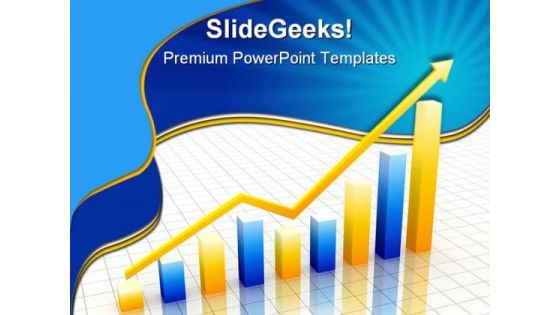
Yellow And Blue Graph Business PowerPoint Templates And PowerPoint Backgrounds 0611
Microsoft PowerPoint Template and Background with business graph with arrow Exercise your mind with our Yellow And Blue Graph Business PowerPoint Templates And PowerPoint Backgrounds 0611. Pump the cells and generate ideas.
Graph With World Map Business PowerPoint Templates And PowerPoint Backgrounds 0611
Microsoft PowerPoint Template and Background with graph with world map and grid in background Our Graph With World Map Business PowerPoint Templates And PowerPoint Backgrounds 0611 are clear to even the farthest. They are designed for distance.
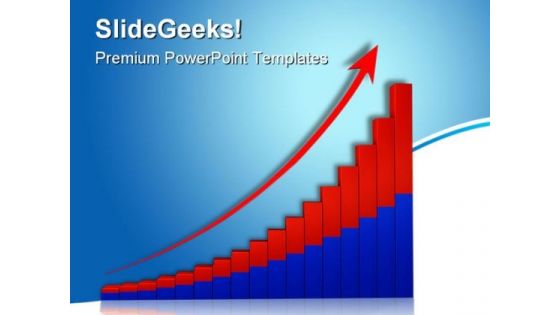
Growth Graph With Arrow01 Business PowerPoint Templates And PowerPoint Backgrounds 0611
Microsoft PowerPoint Template and Background with growth graph with red arrow pointing upwards Construct an enviable career for yourself. Lay the foundation with our Growth Graph With Arrow01 Business PowerPoint Templates And PowerPoint Backgrounds 0611.
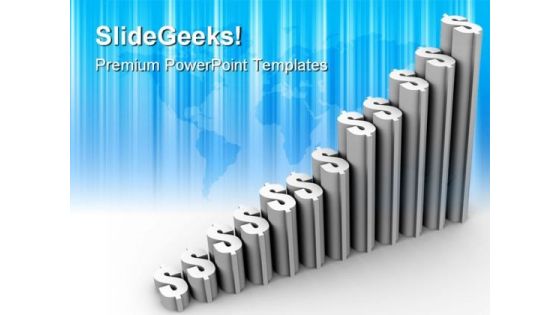
Graph Growth Of Dollars Finance PowerPoint Templates And PowerPoint Backgrounds 0711
Microsoft PowerPoint Template and Background with graph representing growth sign of money Have nothing to fear with our Graph Growth Of Dollars Finance PowerPoint Templates And PowerPoint Backgrounds 0711. Just download, type and present.
Profit Graph With Green Arrow Business PowerPoint Templates And PowerPoint Backgrounds 0811
Microsoft PowerPoint Template and Background with profit graph with green arrows Don't let it drag with our Profit Graph With Green Arrow Business PowerPoint Templates And PowerPoint Backgrounds 0811. They help you keep it crisp and concise.
Dollar Graph With Target Finance PowerPoint Templates And PowerPoint Backgrounds 1211
Microsoft PowerPoint Template and Background with dollar graph and target represents success Be accredited by the connoisseurs. Our Dollar Graph With Target Finance PowerPoint Templates And PowerPoint Backgrounds 1211 certify their approval.
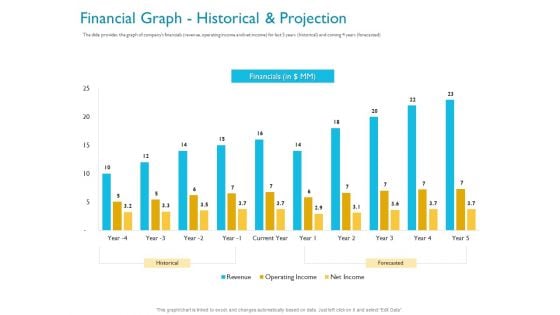
Investor Funding Deck For Hybrid Financing Financial Graph Historical And Projection Ppt Layouts Slides PDF
The slide provides the graph of companys financials revenue, operating income and net income for last 5 years historical and coming 4 years forecasted. Deliver and pitch your topic in the best possible manner with this investor funding deck for hybrid financing financial graph historical and projection ppt layouts slides pdf. Use them to share invaluable insights on historical, forecasted, net income, operating income, financial and impress your audience. This template can be altered and modified as per your expectations. So, grab it now.
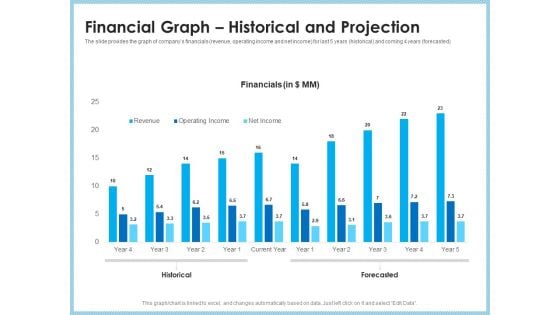
Investment Pitch To Generating Capital From Mezzanine Credit Financial Graph Historical And Projection Microsoft PDF
The slide provides the graph of companys financials revenue, operating income and net income for last 5 years historical and coming 4 years forecasted. Deliver and pitch your topic in the best possible manner with this investment pitch to generating capital from mezzanine credit financial graph historical and projection microsoft pdf. Use them to share invaluable insights on revenue, operating income, net income, current year, historical, forecasted and impress your audience. This template can be altered and modified as per your expectations. So, grab it now.
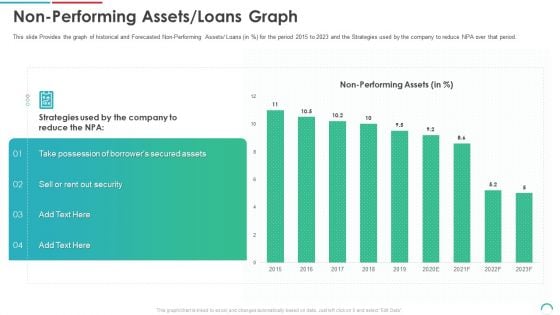
Post Initial Public Offering Equity Financing Pitch Non Performing Assets Loans Graph Infographics PDF
This slide Provides the graph of historical and Forecasted Non-Performing Assets Loans in percent for the period 2015 to 2023 and the Strategies used by the company to reduce NPA over that period. Deliver an awe inspiring pitch with this creative post initial public offering equity financing pitch non performing assets loans graph infographics pdf bundle. Topics like secured assets, performing assets, 2015 to 2023 can be discussed with this completely editable template. It is available for immediate download depending on the needs and requirements of the user.
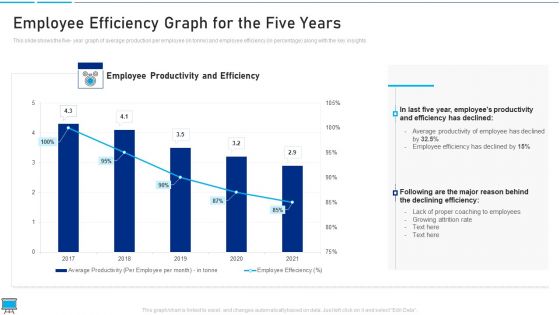
Performance Training Action Plan And Extensive Strategies Employee Efficiency Graph For The Five Years Guidelines PDF
This slide shows the five year graph of average production per employee in tonne and employee efficiency in percentage along with the key insights Deliver and pitch your topic in the best possible manner with this performance training action plan and extensive strategies employee efficiency graph for the five years guidelines pdf Use them to share invaluable insights on declining efficiency, proper coaching to employees, employee efficiency and impress your audience. This template can be altered and modified as per your expectations. So, grab it now.
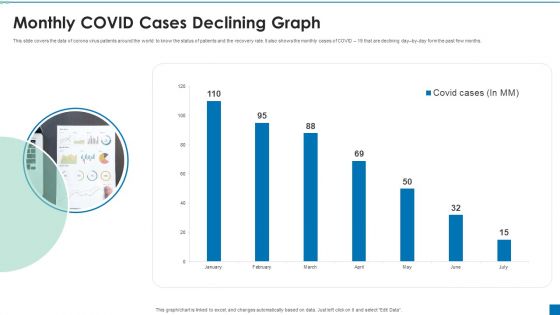
Monthly COVID Cases Declining Graph Ppt PowerPoint Presentation Ideas Slide Portrait PDF
This slide covers the data of corona virus patients around the world to know the status of patients and the recovery rate. It also shows the monthly cases of COVID 19 that are declining day by day form the past few months.Showcasing this set of slides titled Monthly COVID Cases Declining Graph Ppt PowerPoint Presentation Ideas Slide Portrait PDF. The topics addressed in these templates are Monthly Covid Cases, Declining Graph. All the content presented in this PPT design is completely editable. Download it and make adjustments in color, background, font etc. as per your unique business setting.
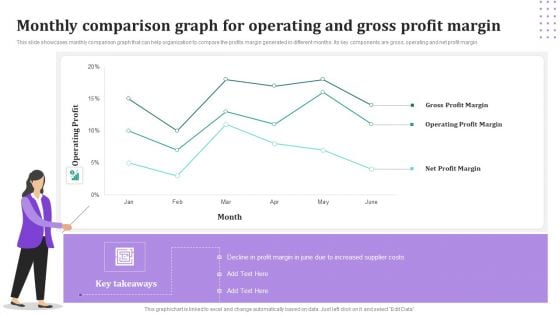
Monthly Comparison Graph For Operating And Gross Profit Margin Pictures PDF
This slide showcases monthly comparison graph that can help organization to compare the profits margin generated in different months. Its key components are gross, operating and net profit margin. Showcasing this set of slides titled Monthly Comparison Graph For Operating And Gross Profit Margin Pictures PDF. The topics addressed in these templates are Gross Profit Margin, Operating Profit Margin, Net Profit Margin. All the content presented in this PPT design is completely editable. Download it and make adjustments in color, background, font etc. as per your unique business setting.
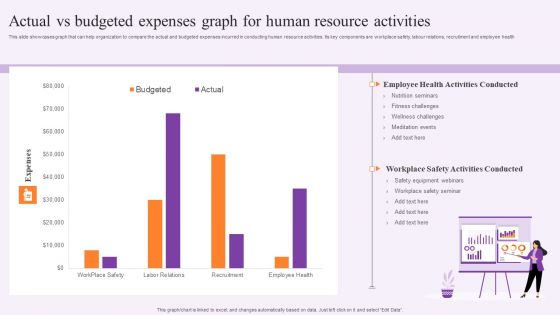
Actual Vs Budgeted Expenses Graph For Human Resource Activities Guidelines PDF
This slide showcases graph that can help organization to compare the actual and budgeted expenses incurred in conducting human resource activities. Its key components are workplace safety, labour relations, recruitment and employee health. Showcasing this set of slides titled Actual Vs Budgeted Expenses Graph For Human Resource Activities Guidelines PDF. The topics addressed in these templates are Safety Equipment Webinars, Employee, Expenses. All the content presented in this PPT design is completely editable. Download it and make adjustments in color, background, font etc. as per your unique business setting.
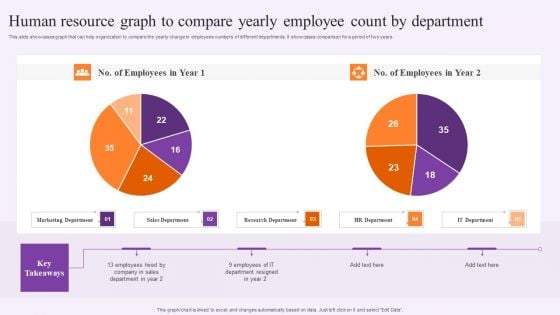
Human Resource Graph To Compare Yearly Employee Count By Department Professional PDF
This slide showcases graph that can help organization to compare the yearly change in employees numbers of different departments. It showcases comparison for a period of two years. Showcasing this set of slides titled Human Resource Graph To Compare Yearly Employee Count By Department Professional PDF. The topics addressed in these templates are Marketing Department, Sales Department, Research Department. All the content presented in this PPT design is completely editable. Download it and make adjustments in color, background, font etc. as per your unique business setting.
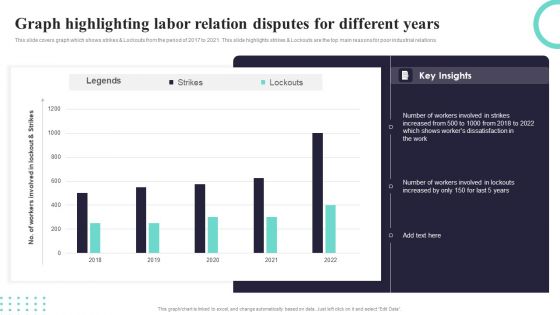
Graph Highlighting Labor Relation Disputes For Different Years Ppt PowerPoint Presentation Gallery Sample PDF
This slide covers graph which shows strikes and Lockouts from the period of 2017 to 2021. This slide highlights strikes and Lockouts are the top main reasons for poor industrial relations. Showcasing this set of slides titled Graph Highlighting Labor Relation Disputes For Different Years Ppt PowerPoint Presentation Gallery Sample PDF. The topics addressed in these templates are Legends, Strikes, Lockouts. All the content presented in this PPT design is completely editable. Download it and make adjustments in color, background, font etc. as per your unique business setting.
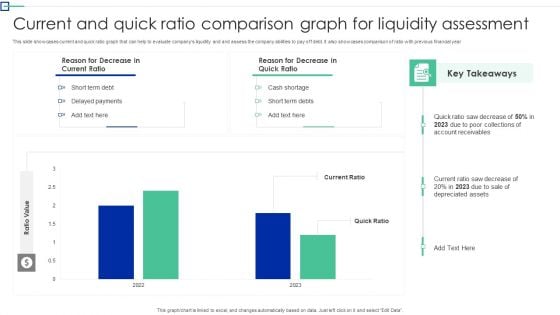
Current And Quick Ratio Comparison Graph For Liquidity Assessment Structure PDF
This slide showcases current and quick ratio graph that can help to evaluate companys liquidity and and assess the company abilities to pay off debt. It also showcases comparison of ratio with previous financial year. Showcasing this set of slides titled Current And Quick Ratio Comparison Graph For Liquidity Assessment Structure PDF. The topics addressed in these templates are Short Term Debt, Delayed Payments, Cash Shortage. All the content presented in this PPT design is completely editable. Download it and make adjustments in color, background, font etc. as per your unique business setting.
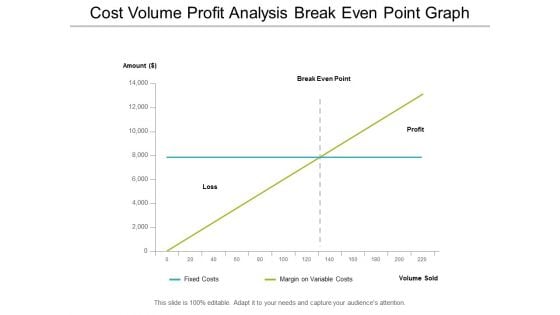
cost volume profit analysis break even point graph ppt powerpoint presentation professional shapes
This is a cost volume profit analysis break even point graph ppt powerpoint presentation professional shapes. This is a four stage process. The stages in this process are break even point,break even analysis,break even level.

Stock Photo 3d Ecg Graph And Red Heart For Heart Health Image Graphics For PowerPoint Slide
This exclusive power point image has been designed with graphic of heart in the centre of graph. This graph is can be used as ECG for heart beat. This template is suitable for medical and heart issues related presentations.

Stock Photo 3d Heart Beat Graph For Heart Health Image Graphics For PowerPoint Slide
This exclusive power point image has been designed with graphic of heart in the centre of graph. This graph may be used as ECG for heart beat. This template is suitable for medical and heart issues related presentations.
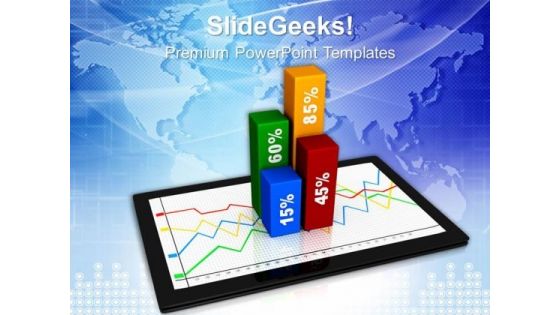
Graph On Ipad Business Growth PowerPoint Templates And PowerPoint Themes 1012
Graph On Ipad Business Growth PowerPoint Templates And PowerPoint Themes 1012-Microsoft Powerpoint Templates and Background with ipad showing success graph-Graph On Ipad Business Growth PowerPoint Templates And PowerPoint Themes 1012-This PowerPoint template can be used for presentations relating to-Ipad showing success graph, business, success, technology, finance, marketing Remove confusionswith our Graph On Ipad Business Growth PowerPoint Templates And PowerPoint Themes 1012. You'll deliver your best presentation yet.
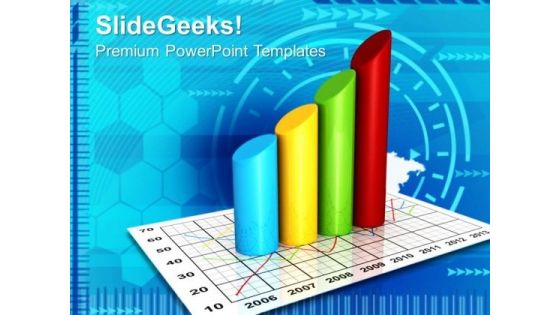
Graph Of Products Sale Business PowerPoint Templates And PowerPoint Themes 0912
Graph Of Products Sale Business PowerPoint Templates And PowerPoint Themes Presentations-Microsoft Powerpoint Templates and Background with graph of products sale-Graph Of Products Sale Business PowerPoint Templates And PowerPoint Themes PresentationsThis PPT can be used for presentations relating to-Graph of products sale, business, cylinders, success, finance, shapes Be bold and dramatic with our Graph Of Products Sale Business PowerPoint Templates And PowerPoint Themes 0912. State the facts with elan.
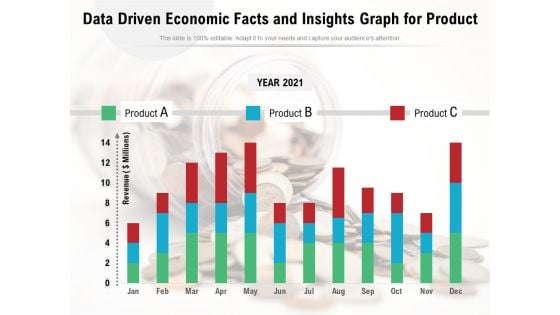
Data Driven Economic Facts And Insights Graph For Product Ppt PowerPoint Presentation Pictures Slide Download PDF
Pitch your topic with ease and precision using this data driven economic facts and insights graph for product ppt powerpoint presentation pictures slide download pdf. This layout presents information on year 2021, product, data driven economic. It is also available for immediate download and adjustment. So, changes can be made in the color, design, graphics or any other component to create a unique layout.
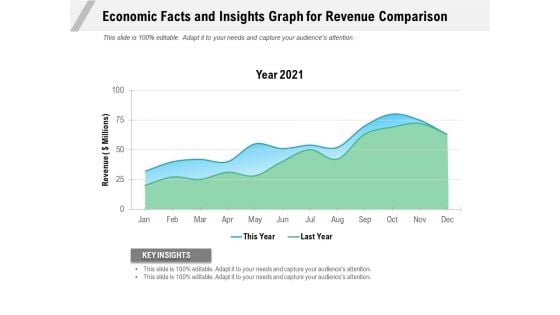
Economic Facts And Insights Graph For Revenue Comparison Ppt PowerPoint Presentation Gallery Portfolio PDF
Pitch your topic with ease and precision using this economic facts and insights graph for revenue comparison ppt powerpoint presentation gallery portfolio pdf. This layout presents information on year 2021, revenue, key insights. It is also available for immediate download and adjustment. So, changes can be made in the color, design, graphics or any other component to create a unique layout.
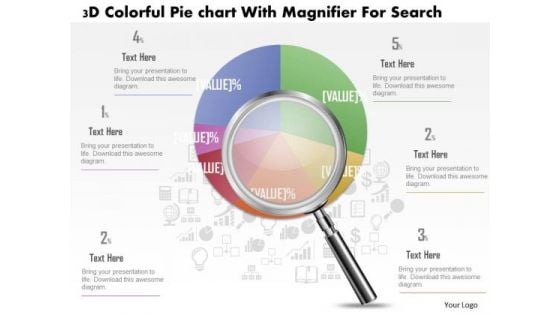
Business Diagram 3d Colorful Pie Graph With Magnifier Data Search PowerPoint Slide
This business slide displays 3d colorful pie graph with magnifier. This diagram is a data visualization tool that gives you a simple way to present statistical information. This slide helps your audience examine and interpret the data you present.
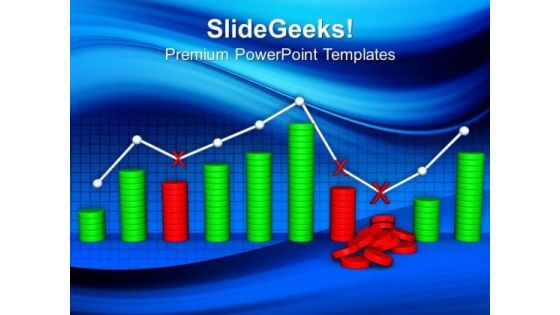
Business Graph With Fall Finance PowerPoint Templates And PowerPoint Themes 0812
Business Graph With Fall Finance PowerPoint Templates And PowerPoint Themes 0812-Microsoft Powerpoint Templates and Background with business graph with fall finance Fence in problems with our Business Graph With Fall Finance PowerPoint Templates And PowerPoint Themes 0812. Try us out and see what a difference our templates make.

Increase Graph And Dollar Sales PowerPoint Templates And PowerPoint Themes 0612
Increase Graph And Dollar Sales PowerPoint Templates And PowerPoint Themes PPT Slides-Microsoft Powerpoint Templates and Background with graph dollar Award yourself with our Increase Graph And Dollar Sales PowerPoint Templates And PowerPoint Themes 0612. You deserve to deal with the best.

Increase Graph And Red Dollar Success PowerPoint Templates And PowerPoint Themes 0612
Increase Graph And Red Dollar Success PowerPoint Templates And PowerPoint Themes Business PPT Templates-Graph with arrow, finance, sales, arrows, success, business Look like an expert with our Increase Graph And Red Dollar Success PowerPoint Templates And PowerPoint Themes 0612. Just download, type and present.
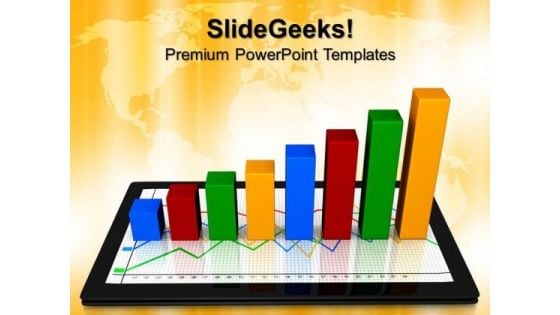
Computer Tablet With Graph Business PowerPoint Templates And PowerPoint Themes 0712
Computer Tablet With Graph Business PowerPoint Templates And PowerPoint Themes 0712-Microsoft Powerpoint Templates and Background with tablets with a business graph Command teams with our Computer Tablet With Graph Business PowerPoint Templates And PowerPoint Themes 0712. Download without worries with our money back guaranteee.
Business Dollar Graph Growth Success PowerPoint Templates And PowerPoint Themes 0712
Business Dollar Graph Growth Success PowerPoint Templates And PowerPoint Themes Business Power Points-Microsoft Powerpoint Templates and Background with dollars graph Consumer connect with our Business Dollar Graph Growth Success PowerPoint Templates And PowerPoint Themes 0712. Enhance customer connectivity of your thoughts.
Computer Tablet With Graph Arrow Business PowerPoint Templates And PowerPoint Themes 0712
Computer Tablet With Graph Arrow Business PowerPoint Templates And PowerPoint Themes Business Power Points-Microsoft Powerpoint Templates and Background with tablets with a business graph Make your audience feel exclusive with our Computer Tablet With Graph Arrow Business PowerPoint Templates And PowerPoint Themes 0712. Give them special attention with your thoughts.
Tablet With Business Graph Arrows PowerPoint Templates And PowerPoint Themes 0812
Tablet With Business Graph Arrows PowerPoint Templates And PowerPoint Themes 0812-Microsoft Powerpoint Templates and Background with computer tablet with graph Our Tablet With Business Graph Arrows PowerPoint Templates And PowerPoint Themes 0812 offer added advantage at no extra fee. They will be a bonus to your thoughts.
Increase In Dollar Graph Business PowerPoint Templates And PowerPoint Themes 0812
Increase In Dollar Graph Business PowerPoint Templates And PowerPoint Themes 0812-Microsoft Powerpoint Templates and Background with increase in dollar graph Examine every deatail with our Increase In Dollar Graph Business PowerPoint Templates And PowerPoint Themes 0812. Put each element to the test.
Computer Tablet With Business Growth Graph Success PowerPoint Templates And PowerPoint Themes 0812
Computer Tablet With Business Growth Graph Success PowerPoint Templates And PowerPoint Themes 0812-Microsoft Powerpoint Templates and Background with computer tablet with graph Get your brains abuzz with our Computer Tablet With Business Growth Graph Success PowerPoint Templates And PowerPoint Themes 0812. Activate and analyse the ideas that emerge.
Computer Tablet With Business Graph PowerPoint Templates And PowerPoint Themes 0912
Computer Tablet With Business Graph PowerPoint Templates And PowerPoint Themes 0912-Microsoft Powerpoint Templates and Background with computer tablet with business growth graph Our Computer Tablet With Business Graph PowerPoint Templates And PowerPoint Themes 0912 have fantastic ability. They will have an astounding effect on the audience.
Computer Tablet With Business Growth Graph Marketing PowerPoint Templates And PowerPoint Themes 0912
Computer Tablet With Business Growth Graph Marketing PowerPoint Templates And PowerPoint Themes 0912-Microsoft Powerpoint Templates and Background with computer tablet with business growth graph Clad your thoughts in our Computer Tablet With Business Growth Graph Marketing PowerPoint Templates And PowerPoint Themes 0912. Dress them appropriately for the event.
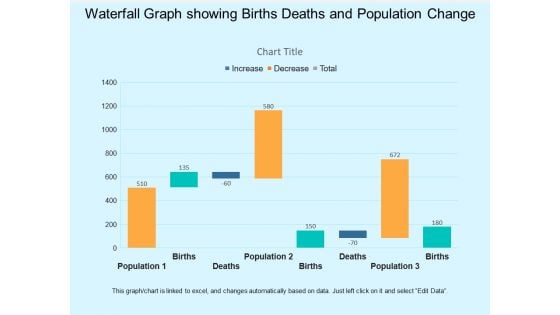
Waterfall Graph Showing Births Deaths And Population Change Ppt PowerPoint Presentation Infographic Template Visual Aids
This is a waterfall graph showing births deaths and population change ppt powerpoint presentation infographic template visual aids. This is a three stage process. The stages in this process are profit and loss, balance sheet, income statement, benefit and loss.
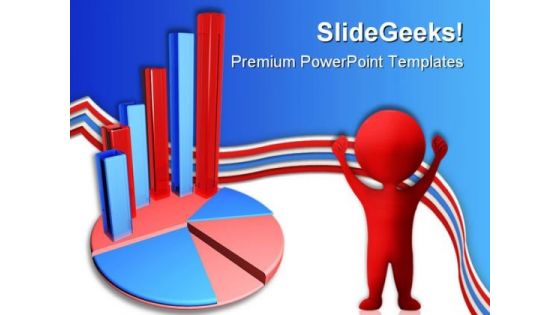
Business Graph On Pie Chart Finance PowerPoint Themes And PowerPoint Slides 0411
Microsoft PowerPoint Theme and Slide with business graph on pie chart Analyse the effect of different factors. Our Business Graph On Pie Chart Finance PowerPoint Themes And PowerPoint Slides 0411 will give them equal attention.
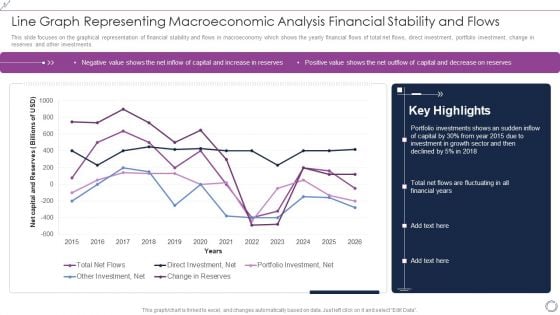
Line Graph Representing Macroeconomic Analysis Financial Stability And Flows Rules PDF
This slide focuses on the graphical representation of financial stability and flows in macroeconomy which shows the yearly financial flows of total net flows, direct investment, portfolio investment, change in reserves and other investments. Showcasing this set of slides titled Line Graph Representing Macroeconomic Analysis Financial Stability And Flows Rules PDF. The topics addressed in these templates are Total Net Flows, Direct Investment, Net, Portfolio Investment, Net. All the content presented in this PPT design is completely editable. Download it and make adjustments in color, background, font etc. as per your unique business setting.
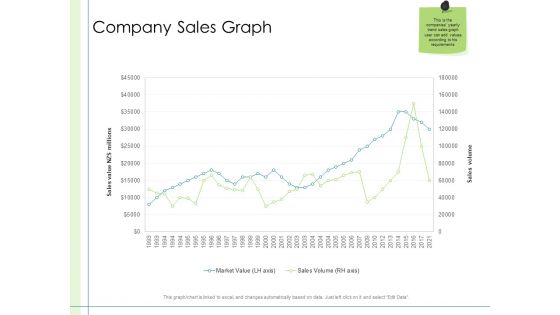
In Depth Business Assessment Company Sales Graph Ppt PowerPoint Presentation Layouts Design Templates PDF
Deliver an awe-inspiring pitch with this creative in depth business assessment company sales graph ppt powerpoint presentation layouts design templates pdf bundle. Topics like market value, sales volume can be discussed with this completely editable template. It is available for immediate download depending on the needs and requirements of the user.
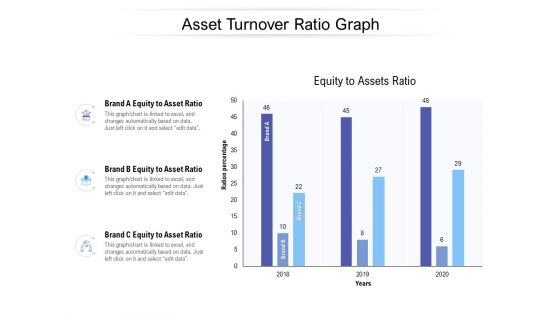
Asset Turnover Ratio Graph Ppt PowerPoint Presentation Outline Graphics Template PDF
Presenting this set of slides with name asset turnover ratio graph ppt powerpoint presentation outline graphics template pdf. The topics discussed in these slides are brand a equity to asset ratio, brand b equity to asset ratio, brand c equity to asset ratio. This is a completely editable PowerPoint presentation and is available for immediate download. Download now and impress your audience.
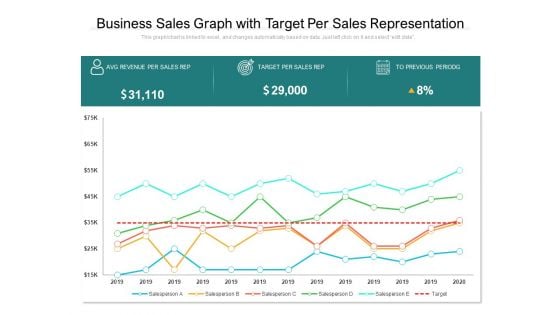
Business Sales Graph With Target Per Sales Representation Ppt PowerPoint Presentation Gallery Templates PDF
Presenting this set of slides with name business sales graph with target per sales representation ppt powerpoint presentation gallery templates pdf. The topics discussed in these slides are revenue, sales, target. This is a completely editable PowerPoint presentation and is available for immediate download. Download now and impress your audience.
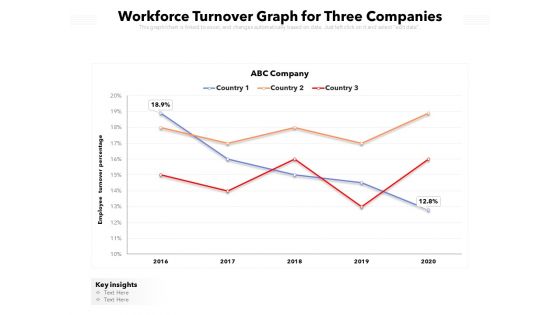
Workforce Turnover Graph For Three Companies Ppt PowerPoint Presentation Infographic Template Visuals PDF
Presenting this set of slides with name workforce turnover graph for three companies ppt powerpoint presentation infographic template visuals pdf. The topics discussed in these slides are key insights, 2016 to 2020, employee turnover percentage. This is a completely editable PowerPoint presentation and is available for immediate download. Download now and impress your audience.
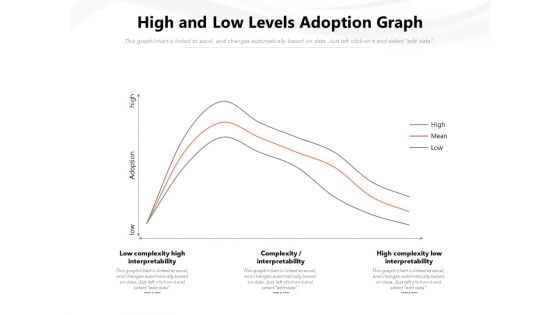
High And Low Levels Adoption Graph Ppt PowerPoint Presentation Gallery Inspiration PDF
Showcasing this set of slides titled high and low levels adoption graph ppt powerpoint presentation gallery inspiration pdf. The topics addressed in these templates are high, mean, low. All the content presented in this PPT design is completely editable. Download it and make ajustments in color, background, font etc. as per your unique business setting.
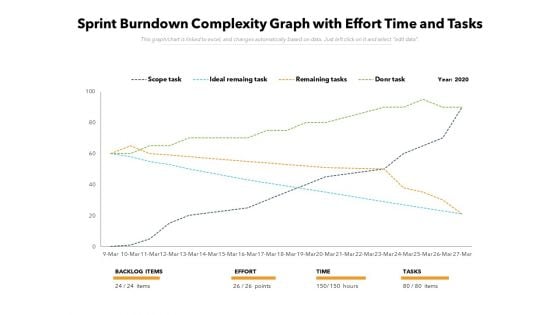
Sprint Burndown Complexity Graph With Effort Time And Tasks Ppt PowerPoint Presentation File Visuals PDF
Showcasing this set of slides titled sprint burndown complexity graph with effort time and tasks ppt powerpoint presentation file visuals pdf. The topics addressed in these templates are effort, tasks, time. All the content presented in this PPT design is completely editable. Download it and make ajustments in color, background, font etc. as per your unique business setting.
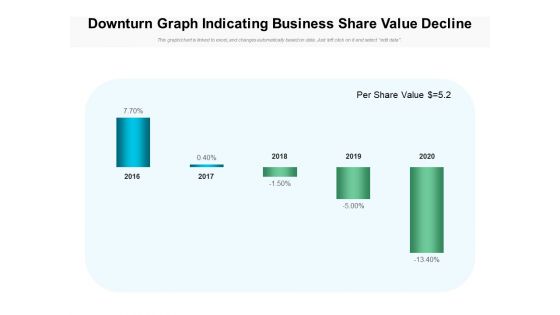
Downturn Graph Indicating Business Share Value Decline Ppt PowerPoint Presentation Professional Elements PDF
Showcasing this set of slides titled downturn graph indicating business share value decline ppt powerpoint presentation professional elements pdf. The topics addressed in these templates are per share value, 2016 to 2020. All the content presented in this PPT design is completely editable. Download it and make adjustments in color, background, font etc. as per your unique business setting.
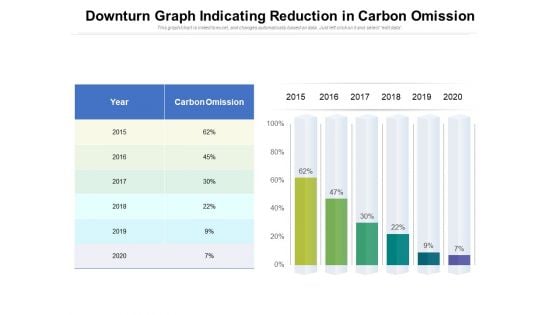
Downturn Graph Indicating Reduction In Carbon Omission Ppt PowerPoint Presentation Outline Inspiration PDF
Showcasing this set of slides titled downturn graph indicating reduction in carbon omission ppt powerpoint presentation outline inspiration pdf. The topics addressed in these templates are carbon omission, year, 2015 to 2020. All the content presented in this PPT design is completely editable. Download it and make adjustments in color, background, font etc. as per your unique business setting.
Startup Pitch To Raise Capital From Crowdfunding Shareholding Structure Graph Pre And Post Funding Icons PDF
Deliver an awe-inspiring pitch with this creative startup pitch to raise capital from crowdfunding shareholding structure graph pre and post funding icons pdf bundle. Topics like founder, employee, seed investors, crowdfunding investors can be discussed with this completely editable template. It is available for immediate download depending on the needs and requirements of the user.
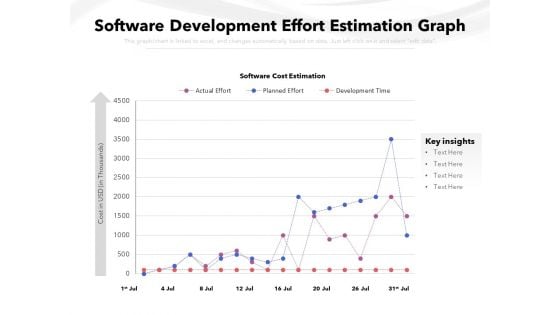
Software Development Effort Estimation Graph Ppt PowerPoint Presentation Styles Show PDF
Showcasing this set of slides titled software development effort estimation graph ppt powerpoint presentation styles show pdf. The topics addressed in these templates are key insights, cost, software cost estimation, actual effort, planned effort, development time. All the content presented in this PPT design is completely editable. Download it and make adjustments in color, background, font etc. as per your unique business setting.
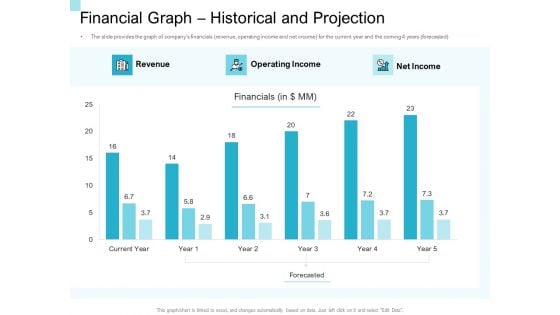
Convertible Market Notes Financial Graph Historical And Projection Ppt Summary Show PDF
Deliver an awe inspiring pitch with this creative convertible market notes financial graph historical and projection ppt summary show pdf bundle. Topics like revenue, operating income, net income, financial can be discussed with this completely editable template. It is available for immediate download depending on the needs and requirements of the user.
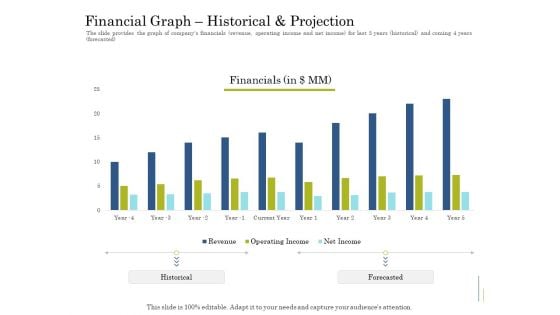
Supplementary Debt Financing Pitch Deck Financial Graph Historical And Projection Brochure PDF
Deliver an awe inspiring pitch with this creative supplementary debt financing pitch deck financial graph historical and projection brochure pdf bundle. Topics like financial, revenue, operating income, net income can be discussed with this completely editable template. It is available for immediate download depending on the needs and requirements of the user.
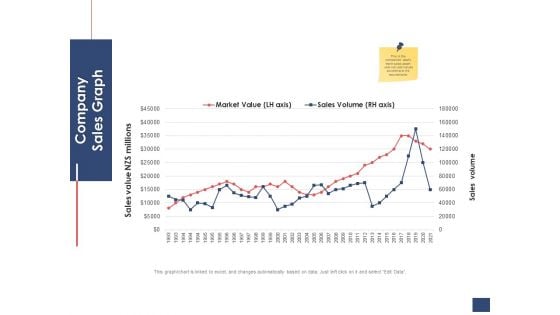
Business Assessment Outline Company Sales Graph Ppt Inspiration Graphics Example PDF
Deliver an awe-inspiring pitch with this creative business assessment outline company sales graph ppt inspiration graphics example pdf bundle. Topics like market value, sales volume can be discussed with this completely editable template. It is available for immediate download depending on the needs and requirements of the user.
Profit Margin Growth Graph With Percentage Ratio Ppt PowerPoint Presentation Professional Icon PDF
Showcasing this set of slides titled profit margin growth graph with percentage ratio ppt powerpoint presentation professional icon pdf. The topics addressed in these templates are profit margin per sale, target per sales rep, 2017 to 2027. All the content presented in this PPT design is completely editable. Download it and make adjustments in color, background, font etc. as per your unique business setting.


 Continue with Email

 Home
Home


