Barriers
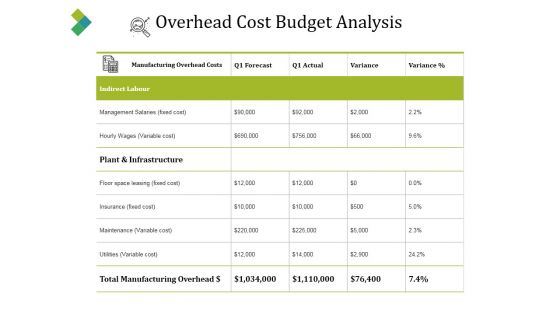
Overhead Cost Budget Analysis Ppt PowerPoint Presentation Pictures Example
This is a overhead cost budget analysis ppt powerpoint presentation pictures example. This is a four stage process. The stages in this process are forecast, actual, variance, indirect labour, utilities.
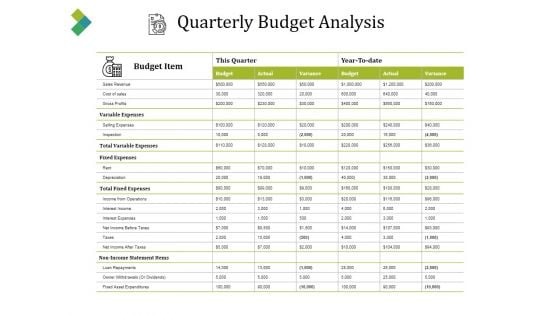
Quarterly Budget Analysis Ppt PowerPoint Presentation Ideas Infographics
This is a quarterly budget analysis ppt powerpoint presentation ideas infographics. This is a two stage process. The stages in this process are budget item, this quarter, budget, actual, variance.
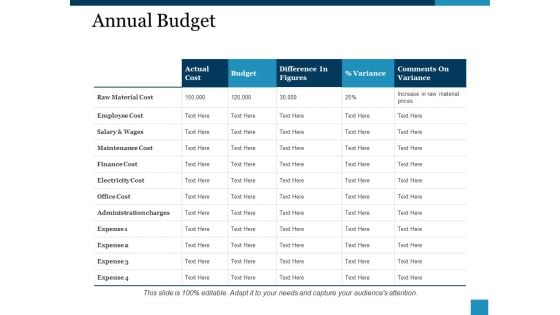
Annual Budget Ppt PowerPoint Presentation Model Samples
This is a annual budget ppt powerpoint presentation model samples. This is a five stage process. The stages in this process are actual cost, budget, percent variance, difference in figures, expense.
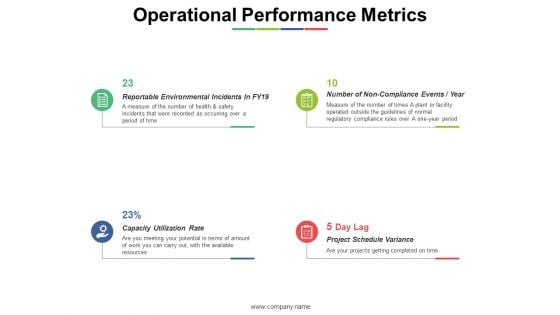
Operational Performance Metrics Ppt PowerPoint Presentation Styles Inspiration
This is a operational performance metrics ppt powerpoint presentation styles inspiration. This is a four stage process. The stages in this process are capacity utilization rate, project schedule variance, operational performance metrics.
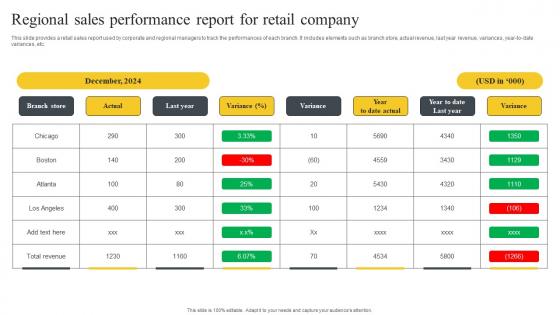
Regional Sales Performance Report For Retail Company Designs Pdf
This slide provides a retail sales report used by corporate and regional managers to track the performances of each branch. It includes elements such as branch store, actual revenue, last year revenue, variances, year-to-date variances, etc. Showcasing this set of slides titled Regional Sales Performance Report For Retail Company Designs Pdf. The topics addressed in these templates are Branch Store, Actual, Last Year. All the content presented in this PPT design is completely editable. Download it and make adjustments in color, background, font etc. as per your unique business setting. This slide provides a retail sales report used by corporate and regional managers to track the performances of each branch. It includes elements such as branch store, actual revenue, last year revenue, variances, year-to-date variances, etc.
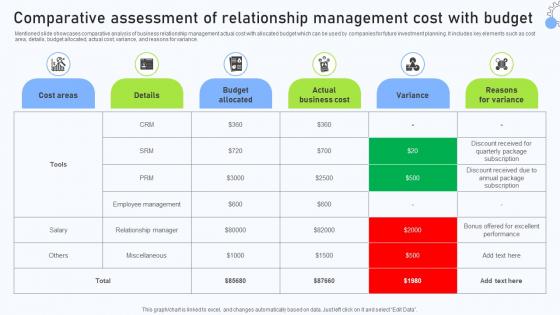
Relationship Management Automation Software Comparative Assessment Of Relationship
Mentioned slide showcases comparative analysis of business relationship management actual cost with allocated budget which can be used by companies for future investment planning. It includes key elements such as cost area, details, budget allocated, actual cost, variance, and reasons for variance. Find a pre-designed and impeccable Relationship Management Automation Software Comparative Assessment Of Relationship. The templates can ace your presentation without additional effort. You can download these easy-to-edit presentation templates to make your presentation stand out from others. So, what are you waiting for Download the template from Slidegeeks today and give a unique touch to your presentation. Mentioned slide showcases comparative analysis of business relationship management actual cost with allocated budget which can be used by companies for future investment planning. It includes key elements such as cost area, details, budget allocated, actual cost, variance, and reasons for variance.
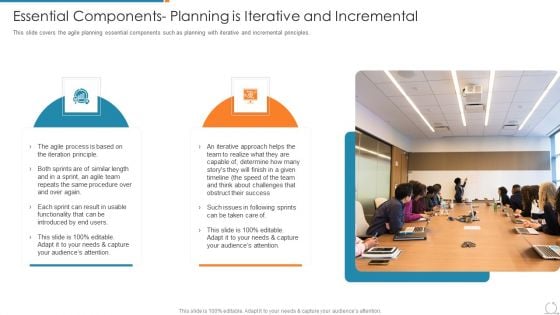
Kanban And Lean Management Essential Components Planning Is Iterative And Incremental Background PDF
This slide covers the agile planning essential components such as planning with iterative and incremental principles.This is a Kanban And Lean Management Essential Components Planning Is Iterative And Incremental Background PDF template with various stages. Focus and dispense information on two stages using this creative set, that comes with editable features. It contains large content boxes to add your information on topics like Usable Functionality, Obstruct Their Success, Iterative Approach You can also showcase facts, figures, and other relevant content using this PPT layout. Grab it now.
Four Phase Business Growth Process Icon Themes PDF
The purpose of this slide is to highlight the stages involved in performance management to overcome obstructions in order to enhance work efficiency. The stages include planning, monitoring, reviewing and regarding. Presenting Four Phase Business Growth Process Icon Themes PDF to dispense important information. This template comprises four stages. It also presents valuable insights into the topics including Scale Business, Profitable Growth, Optimize Customer Value. This is a completely customizable PowerPoint theme that can be put to use immediately. So, download it and address the topic impactfully.
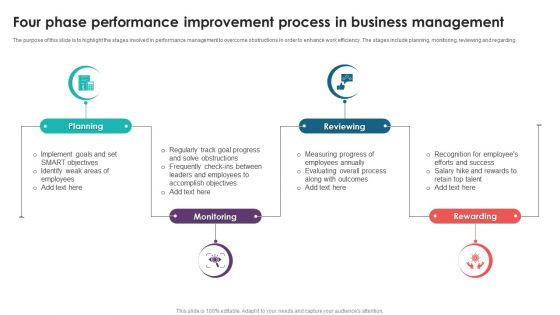
Four Phase Performance Improvement Process In Business Management Introduction PDF
The purpose of this slide is to highlight the stages involved in performance management to overcome obstructions in order to enhance work efficiency. The stages include planning, monitoring, reviewing and regarding. Persuade your audience using this Four Phase Performance Improvement Process In Business Management Introduction PDF. This PPT design covers four stages, thus making it a great tool to use. It also caters to a variety of topics including Planning, Monitoring, Reviewing, Rewarding. Download this PPT design now to present a convincing pitch that not only emphasizes the topic but also showcases your presentation skills.
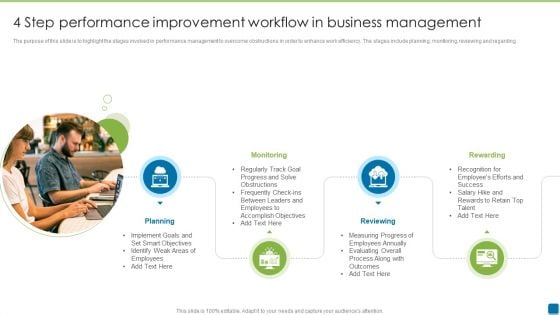
4 Step Performance Improvement Workflow In Business Management Rules PDF
The purpose of this slide is to highlight the stages involved in performance management to overcome obstructions in order to enhance work efficiency. The stages include planning, monitoring, reviewing and regarding. Persuade your audience using this 4 Step Performance Improvement Workflow In Business Management Rules PDF. This PPT design covers four stages, thus making it a great tool to use. It also caters to a variety of topics including Planning, Reviewing, Rewarding, Monitoring. Download this PPT design now to present a convincing pitch that not only emphasizes the topic but also showcases your presentation skills.
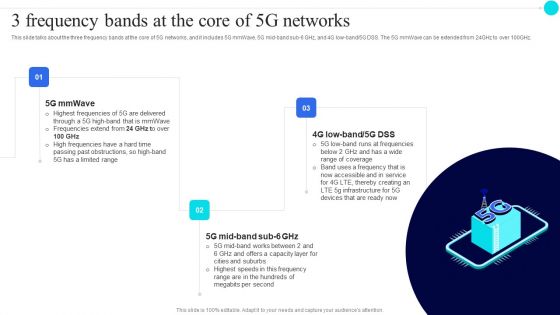
3 Frequency Bands At The Core Of 5G Networks 5G Functional Architecture Template PDF
This slide talks about the three frequency bands at the core of 5G networks, and it includes 5G mmWave, 5G mid band sub 6 GHz, and 4G low band or 5G DSS. The 5G mmWave can be extended from 24GHz to over Presenting 3 Frequency Bands At The Core Of 5G Networks 5G Functional Architecture Template PDF to provide visual cues and insights. Share and navigate important information on three stages that need your due attention. This template can be used to pitch topics like high frequencies, past obstructions, runs frequencies. In addtion, this PPT design contains high resolution images, graphics, etc, that are easily editable and available for immediate download.
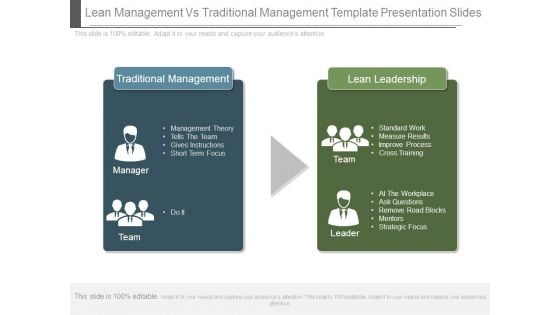
Lean Management Vs Traditional Management Template Presentation Slides
This is a lean management vs traditional management template presentation slides. This is a two stage process. The stages in this process are traditional management, management theory tells the team gives instructions short term focus, manager, do it, team, lean leadership, standard work measure results improve process cross training, at the workplace ask questions remove road blocks mentors strategic focus, team, leader.
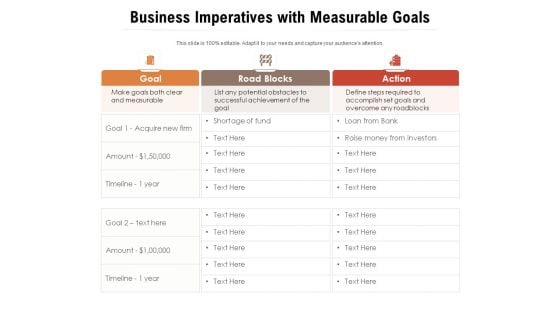
Business Imperatives With Measurable Goals Ppt PowerPoint Presentation Gallery Layouts PDF
Presenting this set of slides with name business imperatives with measurable goals ppt powerpoint presentation gallery layouts pdf. The topics discussed in these slides are goal, road blocks, action. This is a completely editable PowerPoint presentation and is available for immediate download. Download now and impress your audience.
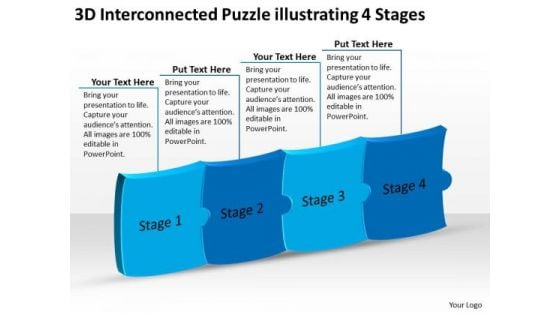
3d Interconnected Puzzle Illustrating 4 Stages Flowchart Programs PowerPoint Templates
We present our 3d interconnected puzzle illustrating 4 stages flowchart programs PowerPoint templates.Use our Business PowerPoint Templates because, You can see clearly through to the bigger bowl ahead. Time your jump to perfection and hit the nail on the head Use our Shapes PowerPoint Templates because,You have some hits, you had some misses. Use our Signs PowerPoint Templates because,you can Master them all and you have it made. Use our Puzzles or Jigsaws PowerPoint Templates because, It gives you really bright ideas. Use our Process and Flows PowerPoint Templates because,your findings are here to help arrive at an accurate diagnosis.Use these PowerPoint slides for presentations relating to 3d, abstract, blue, business, colorful, commerce, concept, conceptual, connect, creativity, depth, design, horizontal, idea, illustration, incomplete, individual, jigsaw, piece, play, problem, puzzle, red, separated, separation, solution, special, symbol, team, teamwork, together, unique. The prominent colors used in the PowerPoint template are Blue, Blue navy, Black. People tell us our 3d interconnected puzzle illustrating 4 stages flowchart programs PowerPoint templates will impress their bosses and teams. The feedback we get is that our business PowerPoint templates and PPT Slides are Classic. People tell us our 3d interconnected puzzle illustrating 4 stages flowchart programs PowerPoint templates are Tasteful. Presenters tell us our blue PowerPoint templates and PPT Slides are Radiant. The feedback we get is that our 3d interconnected puzzle illustrating 4 stages flowchart programs PowerPoint templates are Delightful. Professionals tell us our concept PowerPoint templates and PPT Slides are Wistful. Our 3d Interconnected Puzzle Illustrating 4 Stages Flowchart Programs PowerPoint Templates do not compromise. Excellence is always the aim.
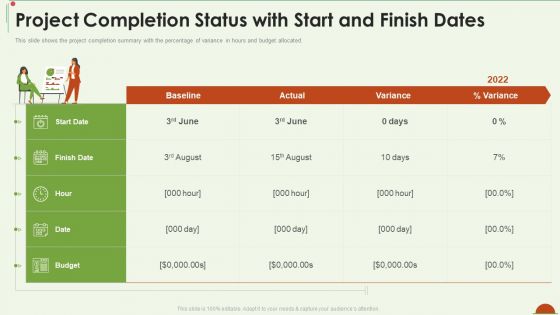
Project Management Under Supervision Project Completion Status With Start And Finish Dates Sample PDF
This slide shows the project completion summary with the percentage of variance in hours and budget allocated. Deliver an awe inspiring pitch with this creative project management under supervision project completion status with start and finish dates sample pdf bundle. Topics like baseline, variance, actual, budget can be discussed with this completely editable template. It is available for immediate download depending on the needs and requirements of the user.
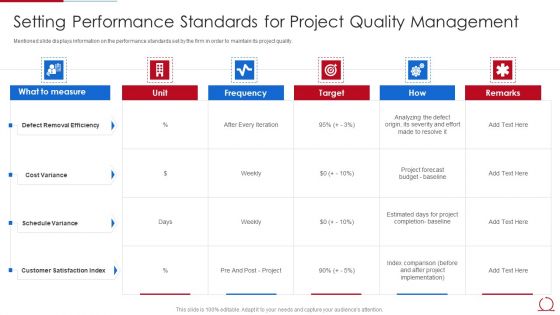
Quality Assurance Model For Agile IT Setting Performance Standards For Project Quality Diagrams PDF
Mentioned slide displays information on the performance standards set by the firm in order to maintain its project quality. Deliver an awe inspiring pitch with this creative quality assurance model for agile it setting performance standards for project quality diagrams pdf bundle. Topics like defect removal efficiency, cost variance, schedule variance, customer satisfaction index can be discussed with this completely editable template. It is available for immediate download depending on the needs and requirements of the user.
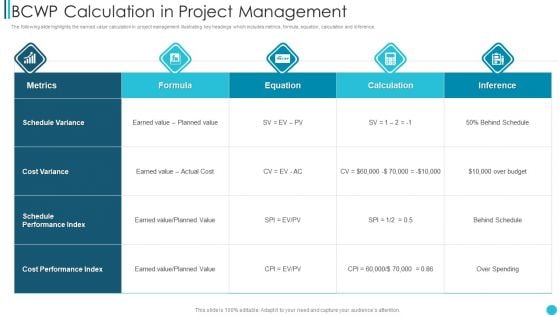
BCWP Calculation In Project Management Background PDF
The following slide highlights the earned value calculation in project management illustrating key headings which includes metrics, formula, equation, calculation and inference.Pitch your topic with ease and precision using this BCWP Calculation In Project Management Background PDF This layout presents information on Schedule Variance, Cost Variance, Performance Index It is also available for immediate download and adjustment. So, changes can be made in the color, design, graphics or any other component to create a unique layout.
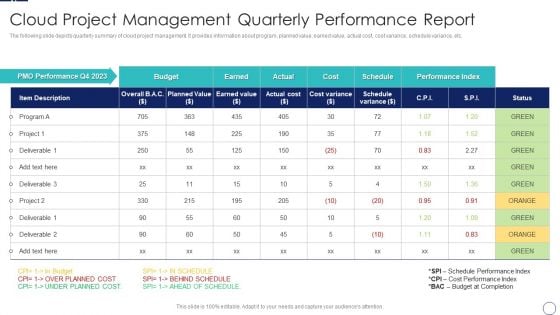
How To Implement Cloud Collaboration Cloud Project Management Quarterly Performance Report Template PDF
The following slide depicts quarterly summary of cloud project management. It provides information about program, planned value, earned value, actual cost, cost variance, schedule variance, etc. Deliver an awe inspiring pitch with this creative How To Implement Cloud Collaboration Cloud Project Management Quarterly Performance Report Template PDF bundle. Topics like PMO Performance, Planned Value, Earned Value can be discussed with this completely editable template. It is available for immediate download depending on the needs and requirements of the user.
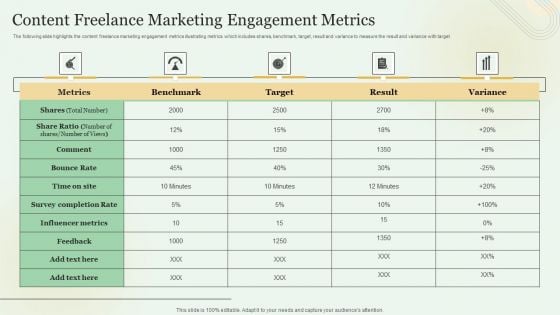
Content Freelance Marketing Engagement Metrics Elements PDF
The following slide highlights the content freelance marketing engagement metrics illustrating metrics which includes shares, benchmark, target, result and variance to measure the result and variance with target. Showcasing this set of slides titled Content Freelance Marketing Engagement Metrics Elements PDF. The topics addressed in these templates are Metrics, Survey Completion Rate, Bounce Rate. All the content presented in this PPT design is completely editable. Download it and make adjustments in color, background, font etc. as per your unique business setting.
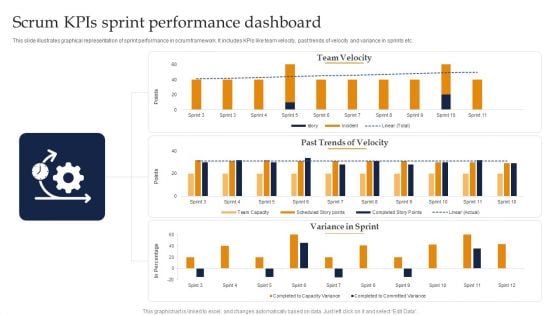
Scrum Kpis Sprint Performance Dashboard Ppt Portfolio Example Introduction PDF
This slide illustrates graphical representation of sprint performance in scrum framework. It includes KPIs like team velocity, past trends of velocity and variance in sprints etc. Showcasing this set of slides titled Scrum Kpis Sprint Performance Dashboard Ppt Portfolio Example Introduction PDF. The topics addressed in these templates are Team Velocity, Past Trends Velocity, Variance Sprint. All the content presented in this PPT design is completely editable. Download it and make adjustments in color, background, font etc. as per your unique business setting.
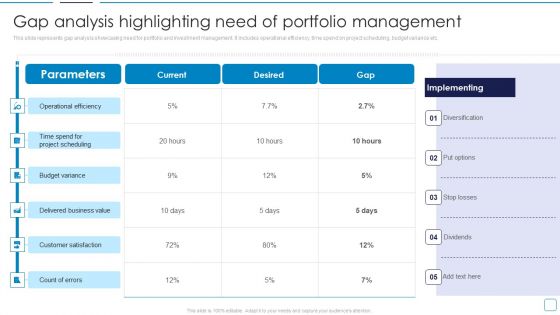
Portfolio Wealth Management Gap Analysis Highlighting Need Of Portfolio Portrait PDF
This slide represents gap analysis showcasing need for portfolio and investment management. It includes operational efficiency, time spend on project scheduling, budget variance etc. Deliver an awe inspiring pitch with this creative Portfolio Wealth Management Gap Analysis Highlighting Need Of Portfolio Portrait PDF bundle. Topics like Operational Efficiency, Budget Variance, Delivered Business Value can be discussed with this completely editable template. It is available for immediate download depending on the needs and requirements of the user.
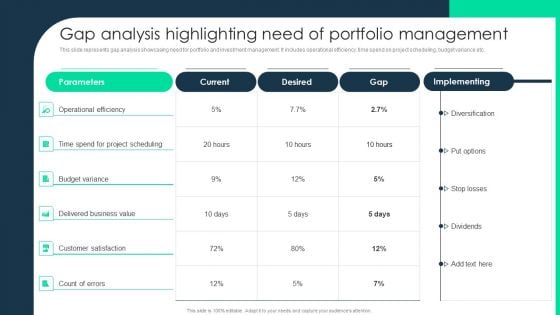
Gap Analysis Highlighting Need Of Portfolio Management Designs PDF
This slide represents gap analysis showcasing need for portfolio and investment management. It includes operational efficiency, time spend on project scheduling, budget variance etc. Deliver an awe inspiring pitch with this creative Gap Analysis Highlighting Need Of Portfolio Management Designs PDF bundle. Topics like Operational Efficiency, Budget Variance, Customer Satisfaction can be discussed with this completely editable template. It is available for immediate download depending on the needs and requirements of the user.

Diversified Profitable Portfolio Gap Analysis Highlighting Need Of Portfolio Management Designs PDF
This slide represents gap analysis showcasing need for portfolio and investment management. It includes operational efficiency, time spend on project scheduling, budget variance etc. Deliver and pitch your topic in the best possible manner with this Diversified Profitable Portfolio Gap Analysis Highlighting Need Of Portfolio Management Designs PDF. Use them to share invaluable insights on Budget Variance, Customer Satisfaction, Delivered Business Value and impress your audience. This template can be altered and modified as per your expectations. So, grab it now.
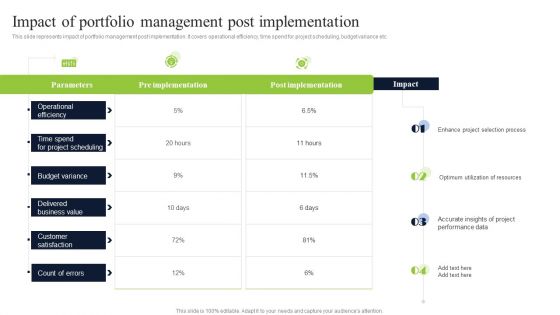
Impact Of Portfolio Management Post Implementation Summary PDF
This slide represents impact of portfolio management post implementation. It covers operational efficiency, time spend for project scheduling, budget variance etc. Deliver an awe inspiring pitch with this creative Impact Of Portfolio Management Post Implementation Summary PDF bundle. Topics like Operational Efficiency, Customer Satisfaction, Budget Variance can be discussed with this completely editable template. It is available for immediate download depending on the needs and requirements of the user.
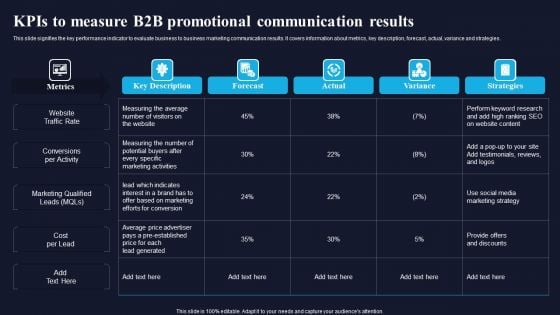
Kpis To Measure B2B Promotional Communication Results Graphics PDF
This slide signifies the key performance indicator to evaluate business to business marketing communication results. It covers information about metrics, key description, forecast, actual, variance and strategies. Showcasing this set of slides titled Kpis To Measure B2B Promotional Communication Results Graphics PDF. The topics addressed in these templates are Key Description, Forecast, Actual, Variance. All the content presented in this PPT design is completely editable. Download it and make adjustments in color, background, font etc. as per your unique business setting.
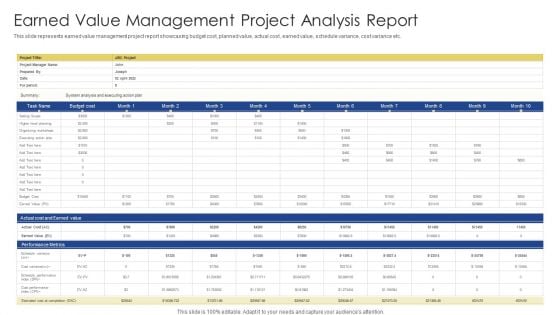
Earned Value Management Project Analysis Report Ppt Ideas Elements PDF
This slide represents earned value management project report showcasing budget cost, planned value, actual cost, earned value, schedule variance, cost variance etc. Showcasing this set of slides titled Earned Value Management Project Analysis Report Ppt Ideas Elements PDF. The topics addressed in these templates are Setting Scope, Higher Level Planning, Organizing Workshops. All the content presented in this PPT design is completely editable. Download it and make adjustments in color, background, font etc. as per your unique business setting.
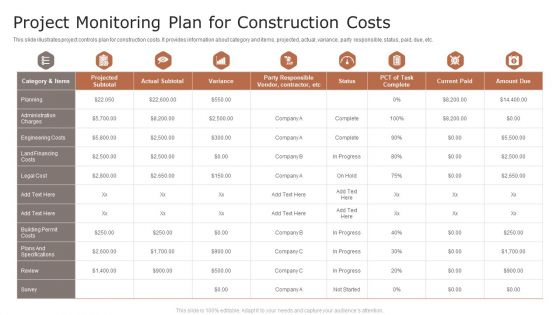
Project Monitoring Plan For Construction Costs Ppt Styles Elements PDF
This slide illustrates project controls plan for construction costs. It provides information about category and items, projected, actual, variance, party responsible, status, paid, due, etc. Pitch your topic with ease and precision using this Project Monitoring Plan For Construction Costs Ppt Styles Elements PDF. This layout presents information on Actual Subtotal, Variance, Current Paid. It is also available for immediate download and adjustment. So, changes can be made in the color, design, graphics or any other component to create a unique layout.
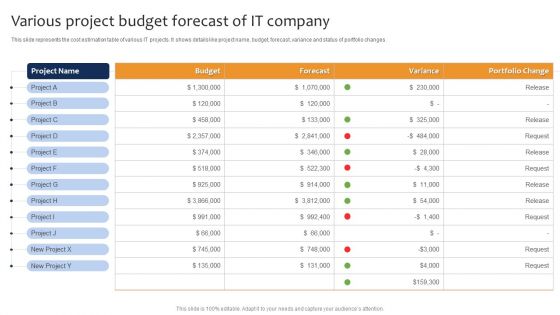
Various Project Budget Forecast Of IT Company Ppt Styles Ideas PDF
This slide represents the cost estimation table of various IT projects. It shows details like project name, budget, forecast, variance and status of portfolio changes. Pitch your topic with ease and precision using this Various Project Budget Forecast Of IT Company Ppt Styles Ideas PDF. This layout presents information on Budget, Forecast, Variance, Project. It is also available for immediate download and adjustment. So, changes can be made in the color, design, graphics or any other component to create a unique layout.
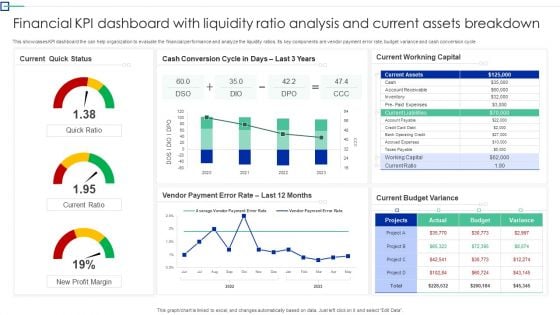
Financial KPI Dashboard With Liquidity Ratio Analysis And Current Assets Breakdown Ideas PDF
This showcases KPI dashboard the can help organization to evaluate the financial performance and analyze the liquidity ratios. Its key components are vendor payment error rate, budget variance and cash conversion cycle. Showcasing this set of slides titled. The topics addressed in these templates are Quick Status, Workning Capital, Budget Variance. All the content presented in this PPT design is completely editable. Download it and make adjustments in color, background, font etc. as per your unique business setting.
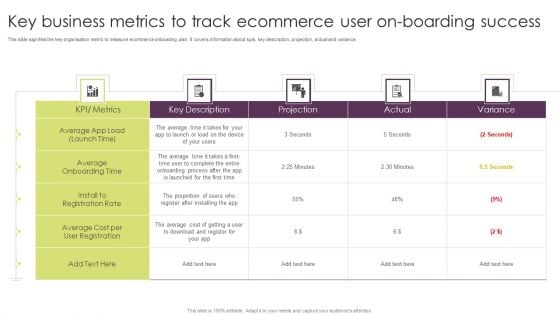
Key Business Metrics To Track Ecommerce User On Boarding Success Pictures PDF
This slide signifies the key organisation metric to measure ecommerce onboading plan. It covers information about kpis, key description, projection, actual and variance. Pitch your topic with ease and precision using this Key Business Metrics To Track Ecommerce User On Boarding Success Pictures PDF. This layout presents information on Key Description, Projection, Variance. It is also available for immediate download and adjustment. So, changes can be made in the color, design, graphics or any other component to create a unique layout.
API Outline Quadrant For Competitive Analysis Ppt Model Icons PDF
The following quadrant analyzes and map the relative position of key players of API Management Market, divided into four different section of challengers, leaders, niche players and visionaries. This is a api outline quadrant for competitive analysis ppt model icons pdf template with various stages. Focus and dispense information on four stages using this creative set, that comes with editable features. It contains large content boxes to add your information on topics like challenges, leaders, niche players, visionaries. You can also showcase facts, figures, and other relevant content using this PPT layout. Grab it now.
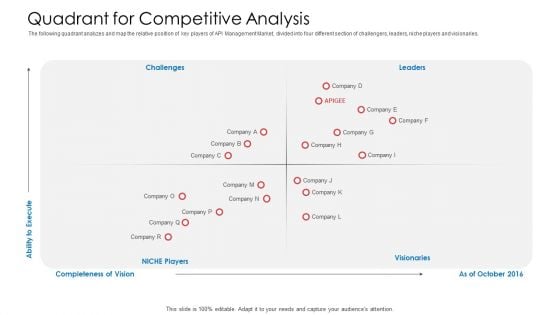
API Administration Solution Quadrant For Competitive Analysis Ppt Show Outfit PDF
The following quadrant analyzes and map the relative position of key players of API Management Market, divided into four different section of challengers, leaders, niche players and visionaries. Presenting api administration solution quadrant for competitive analysis ppt show outfit pdf to provide visual cues and insights. Share and navigate important information on four stages that need your due attention. This template can be used to pitch topics like challenges, leaders, visionaries, niche players. In addtion, this PPT design contains high resolution images, graphics, etc, that are easily editable and available for immediate download.
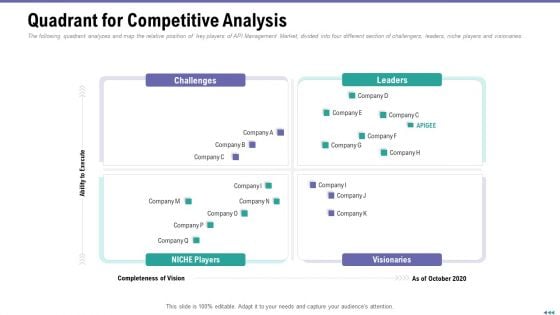
Market Viewpoint Application Programming Interface Governance Quadrant For Competitive Analysis Clipart PDF
The following quadrant analyzes and map the relative position of key players of API Management Market, divided into four different section of challengers, leaders, niche players and visionaries. Presenting market viewpoint application programming interface governance quadrant for competitive analysis clipart pdf to provide visual cues and insights. Share and navigate important information on four stages that need your due attention. This template can be used to pitch topics like challenges, leaders, visionaries, niche players. In addtion, this PPT design contains high resolution images, graphics, etc, that are easily editable and available for immediate download.
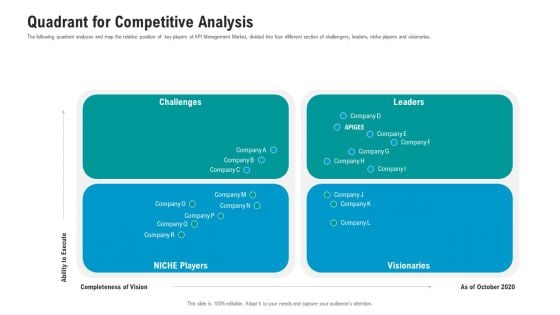
API Ecosystem Quadrant For Competitive Analysis Graphics PDF
The following quadrant analyzes and map the relative position of key players of API Management Market, divided into four different section of challengers, leaders, niche players and visionaries. This is a api ecosystem quadrant for competitive analysis graphics pdf template with various stages. Focus and dispense information on four stages using this creative set, that comes with editable features. It contains large content boxes to add your information on topics like quadrant for competitive analysis. You can also showcase facts, figures, and other relevant content using this PPT layout. Grab it now.
Market Evaluation Of IT Industry Various Types Of Market Segmentation Psychographic Icons PDF
The following slide showcases geographic segmentation which can be used to divided the market based on location. The division can be done on the basis of country, region, city, and population density. Slidegeeks is one of the best resources for PowerPoint templates. You can download easily and regulate Market Evaluation Of IT Industry Various Types Of Market Segmentation Psychographic Icons PDF for your personal presentations from our wonderful collection. A few clicks is all it takes to discover and get the most relevant and appropriate templates. Use our Templates to add a unique zing and appeal to your presentation and meetings. All the slides are easy to edit and you can use them even for advertisement purposes.
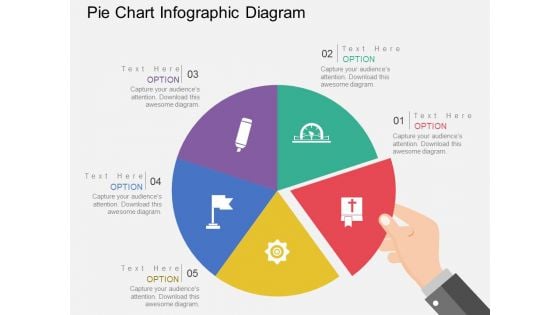
Pie Chart Infographic Diagram Powerpoint Templates
This Power Point template has been designed with pie chart infographic. This business slide is useful to present financial ratio analysis. Use this diagram to make business presentation. Illustrate these thoughts with this slide.
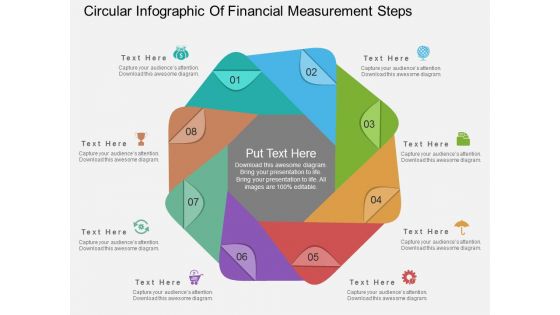
Circular Infographic Of Financial Measurement Steps Powerpoint Template
Use this diagram for display of financial measurement steps. This PPT slide contains diagram of circular infographic. This PowerPoint Template has been designed to portray your concepts in visual manner.
Four Steps Business Circle With Icons Powerpoint Template
Develop competitive advantage with our above template which contains four steps circle diagram with icons. This diagram may use to depict strategic management process. This slide provides an effective way of displaying information.
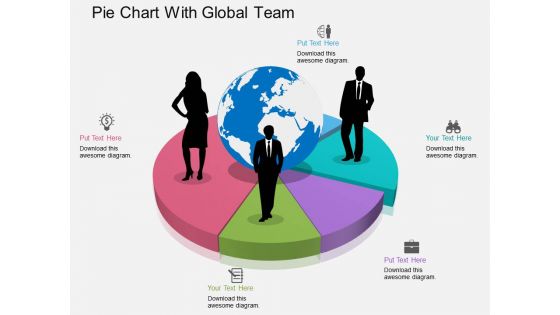
Pie Chart With Global Team Powerpoint Template
This PowerPoint template has been designed with graphics of pie chart with global team. This diagram can be used to display team performance and analysis. Capture the attention of your audience with this slide.
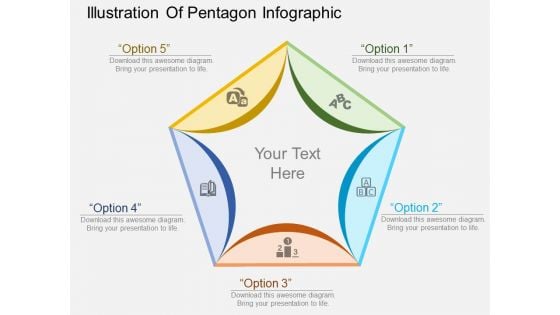
Illustration Of Pentagon Infographic Powerpoint Template
Our above business slide contains pentagon infographic. This PowerPoint template can be used to display the relationship and analysis. Capture the attention of your audience with this slide.
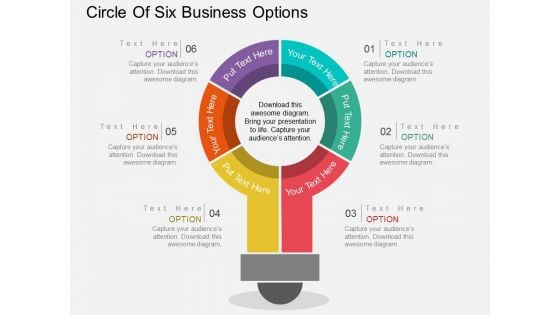
Circle Of Six Business Options Powerpoint Templates
This PowerPoint template has been designed with circle of six business options. This circular infographic contains the concept of target achievement. Add this slide to your presentation and impress your audiences.
Pentagon Inside Circle With Icons Powerpoint Templates
This business slide displays pentagon graphics with icons. This diagram is useful for planning process. This PPT slide helps in cross-functional planning and fully examine potential competitive strategies
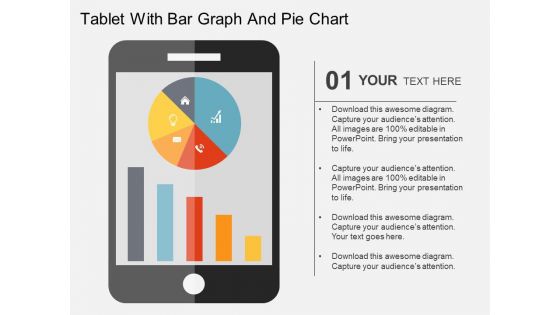
Tablet With Bar Graph And Pie Chart Powerpoint Templates
This business slide has been designed with business graphs on computer tablet. You may download this PPT slide to display statistical analysis. This slide will help you to sequence your thoughts.
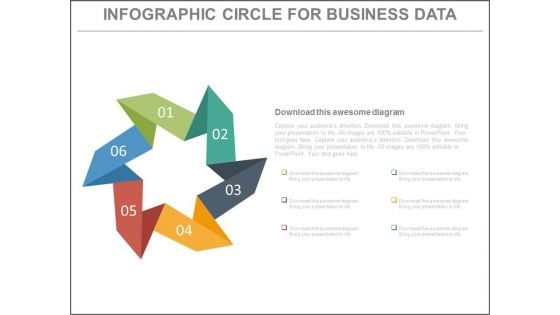
Six Steps Circular Chart For Workflow Powerpoint Slides
This business slide contains circular infographic design. This diagram provides schematic representation of any information. Visual effect this slide helps in maintaining the flow of the discussion and provides more clarity to the subject.
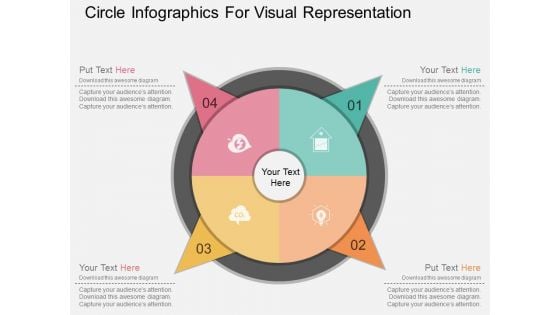
Circle Infographics For Visual Representation Powerpoint Template
This business slide provides background for four option display. Display the options, business steps or workflow using this diagram as a tool. You can present your opinions using this impressive slide.
Flow Of Six Circular Icons Powerpoint Template
Our PowerPoint template has been designed with circular infographic diagram. This business diagram may be used to display process flow. Grab centre stage with this slide and attract the attention of your audience.
Six Staged Business Chart With Icons Powerpoint Template
Our professionally designed business diagram is as an effective tool for communicating ideas and planning. It contains circular business chart with icons. Convey your views with this diagram slide. It will amplify the strength of your logic.
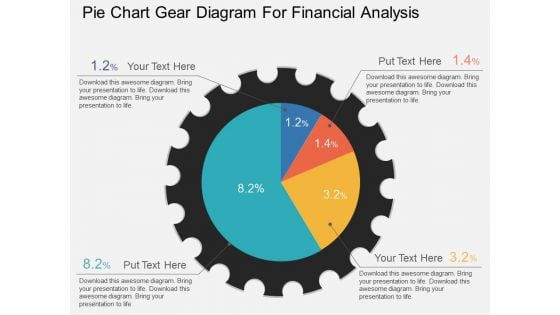
Pie Chart Gear Diagram For Financial Analysis Powerpoint Template
This PowerPoint template has been designed with graphic of pie chart gear diagram. This PPT slide can be used to display financial analysis. Download this PPT diagram slide to make your presentations more effective.
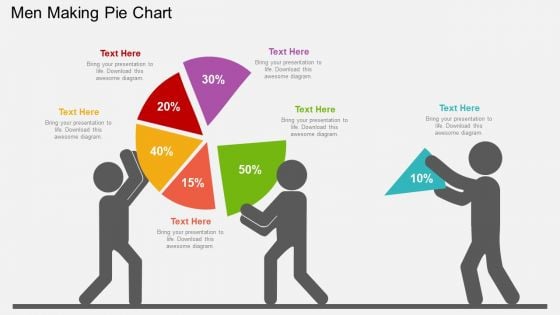
Men Making Pie Chart Powerpoint Templates
Our professionally designed business diagram is as an effective tool for communicating ideas and planning. It contains graphics of business man making pie chart. Design management function in strategic planning with this diagram slide. It will amplify the strength of your logic.
Pie Chart With Seven Business Icons Powerpoint Templates
Our compelling template consists with a design of pie chart with seven business icons. This slide has been professionally designed to exhibit financial ratio analysis. This template offers an excellent background to build impressive presentation.
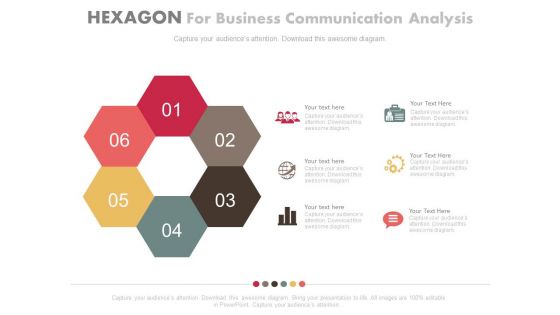
Circular Diagram For Management Development Process Powerpoint Template
This PowerPoint template has been designed with hexagonal circular diagram. Download this slide design for management development processes. Enlighten others on the process with this innovative PowerPoint template.
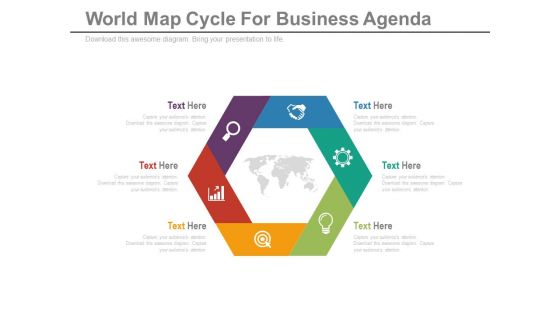
Diagram For Global Business Strategy Powerpoint Template
Our above slide contains hexagonal infographic diagram. This PowerPoint template helps to display global business strategy. Use this diagram to impart more clarity to data and to create more sound impact on viewers.
Circle With Team And Business Icons Powerpoint Slides
This PowerPoint template contains four steps circular diagram with business icons. It also contains team icon in center. You may download this PPT slide to display team strategy and planning steps.
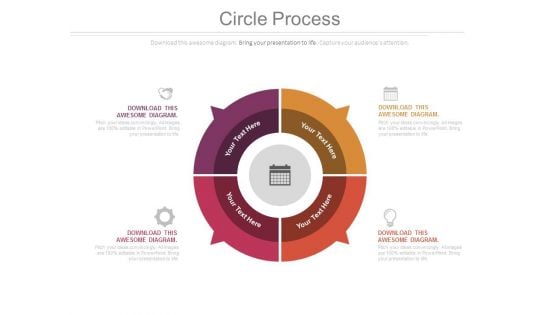
Circular Diagram Of Planning Process Powerpoint Slides
This PowerPoint slide contains graphics of circular diagram. This slide contains four steps with icons in circular flow. Enlighten your viewers on the process with this innovative graphic.
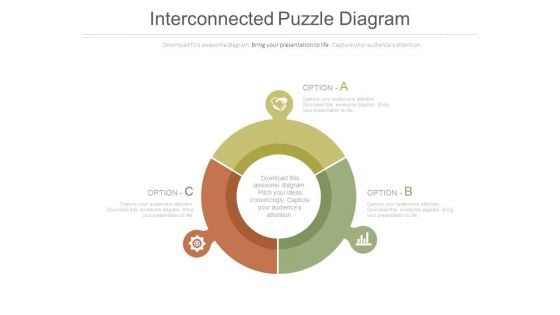
Circular Diagram With Three Sides Powerpoint Slides
This PowerPoint slide has been designed with graphics of circular diagram. This slide contains four steps with icons in circular flow. Enlighten your viewers on the process with this innovative graphic.
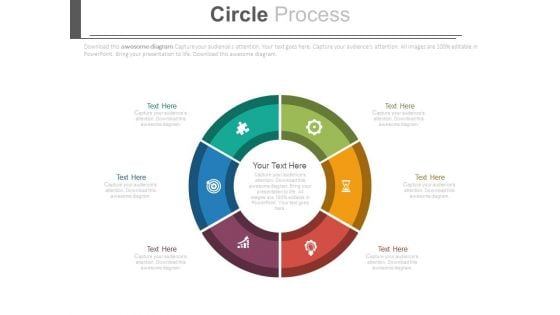
Circular Infographic Design For Process Flow Powerpoint Slides
This PowerPoint slide has been designed with graphics of circular diagram. This slide contains four steps with icons in circular flow. Enlighten your viewers on the process with this innovative graphic.
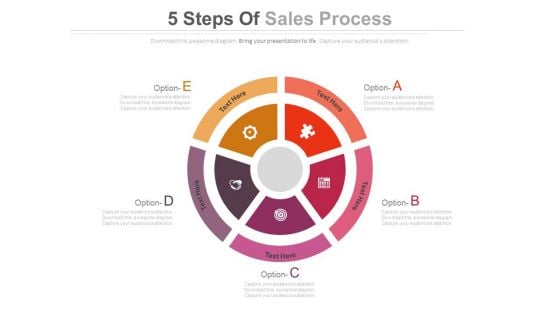
Five Options Circular Infographic Diagram Powerpoint Slides
This PowerPoint template has been designed with circular diagram and business icons. This PPT slide displays five business options in circular flow. Enlighten your viewers on the process with this innovative graphic.
Stop Watch With Business Planning Icons Powerpoint Template
This PPT slide has been designed with graphics of stop watch with business planning icons. Download this PowerPoint to depict business planning and time management. Imprint your concepts with this professional slide in your presentations.?
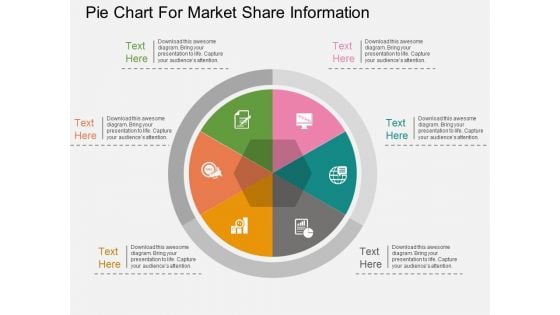
Pie Chart For Market Share Information Powerpoint Template
Our above PPT slide contains diagram of pie chart. This PowerPoint template helps to display market share information. Use this diagram to impart more clarity to information and to create more sound impact on viewers.
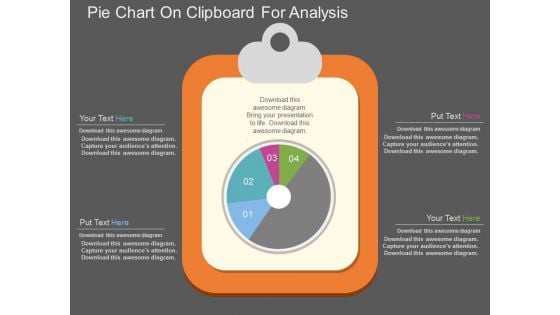
Pie Chart On Clipboard For Analysis Powerpoint Template
This PowerPoint template has been designed with graphics of pie chart on clipboard. Download this PPT slide for business and financial analysis. You may also use this professional template to depict statistical analysis.


 Continue with Email

 Home
Home


