Benefit Infographic
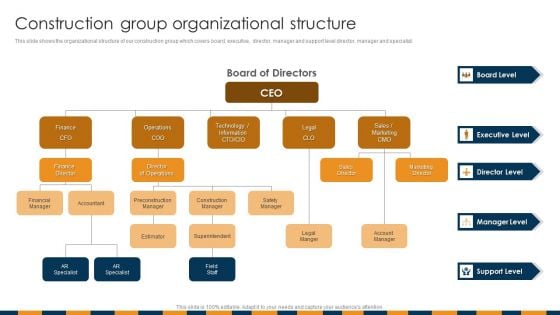
Construction Services Company Profile Construction Group Organizational Structure Infographics PDF
This slide shows the organizational structure of our construction group which covers board, executive, director, manager and support level director, manager and specialist.Presenting Construction Services Company Profile Construction Group Organizational Structure Infographics PDF to provide visual cues and insights. Share and navigate important information on five stages that need your due attention. This template can be used to pitch topics like Financial Manager, Finance Director, Executive Level In addtion, this PPT design contains high resolution images, graphics, etc, that are easily editable and available for immediate download.
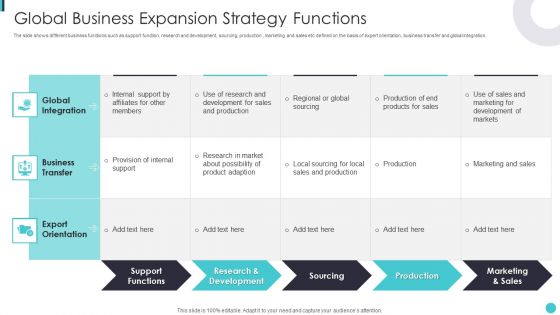
Global Business Expansion Strategy Functions Ppt Infographics Deck PDF
The slide shows different business functions such as support function, research and development, sourcing, production , marketing and sales etc defined on the basis of expert orientation, business transfer and global integration. Showcasing this set of slides titled Global Business Expansion Strategy Functions Ppt Infographics Deck PDF. The topics addressed in these templates are Global Integration, Business Transfer, Export Orientation. All the content presented in this PPT design is completely editable. Download it and make adjustments in color, background, font etc. as per your unique business setting.
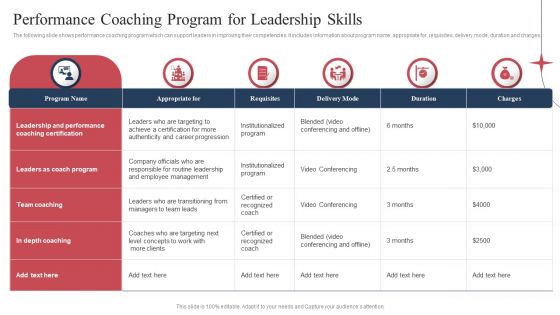
Performance Coaching Program For Leadership Skills Ppt Infographics Sample PDF
The following slide shows performance coaching program which can support leaders in improving their competencies. It includes information about program name, appropriate for, requisites, delivery mode, duration and charges. Pitch your topic with ease and precision using this Performance Coaching Program For Leadership Skills Ppt Infographics Sample PDF. This layout presents information on Team Coaching, In Depth Coaching, Leadership And Performance. It is also available for immediate download and adjustment. So, changes can be made in the color, design, graphics or any other component to create a unique layout.

Medical Care Company Overview CSR Activities Infographics PDF
The slide showcases the community welfare programs run and supported by company. The major CSR programs includes hunger savior, clean water, education 4 all, gender equality, diversity and health program. Presenting Medical Care Company Overview CSR Activities Infographics PDF to provide visual cues and insights. Share and navigate important information on four stages that need your due attention. This template can be used to pitch topics like Gender Equality, Csr Activities. In addtion, this PPT design contains high resolution images, graphics, etc, that are easily editable and available for immediate download.
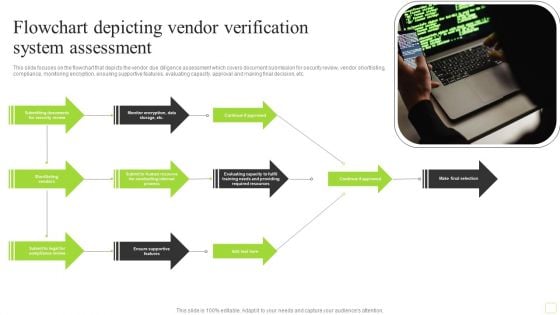
Flowchart Depicting Vendor Verification System Assessment Infographics PDF
This slide focuses on the flowchart that depicts the vendor due diligence assessment which covers document submission for security review, vendor shortlisting, compliance, monitoring encryption, ensuring supportive features, evaluating capacity, approval and making final decision, etc. Presenting Flowchart Depicting Vendor Verification System Assessment Infographics PDF to dispense important information. This template comprises two stages. It also presents valuable insights into the topics including Required Resources, Conducting Internal Process, Security Review. This is a completely customizable PowerPoint theme that can be put to use immediately. So, download it and address the topic impactfully.
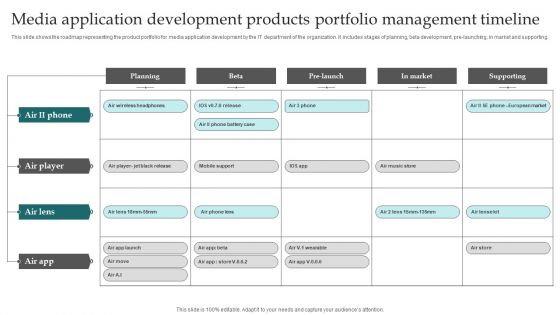
Media Application Development Products Portfolio Management Timeline Infographics PDF
This slide shows the roadmap representing the product portfolio for media application development by the IT department of the organization. It includes stages of planning, beta development, pre-launching, in market and supporting. Pitch your topic with ease and precision using this Media Application Development Products Portfolio Management Timeline Infographics PDF. This layout presents information on Planning, Market, Products Portfolio Management Timeline. It is also available for immediate download and adjustment. So, changes can be made in the color, design, graphics or any other component to create a unique layout.
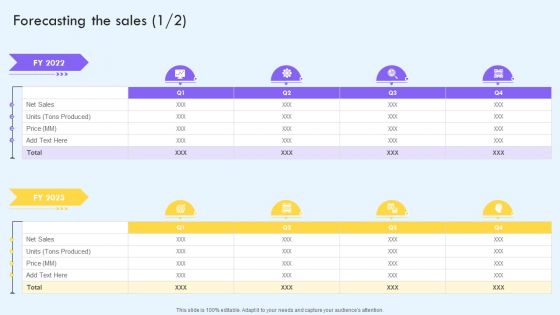
Forecasting The Sales Implementing Social Media Marketing Techniques Infographics PDF
Coming up with a presentation necessitates that the majority of the effort goes into the content and the message you intend to convey. The visuals of a PowerPoint presentation can only be effective if it supplements and supports the story that is being told. Keeping this in mind our experts created Forecasting The Sales Implementing Social Media Marketing Techniques Infographics PDF to reduce the time that goes into designing the presentation. This way, you can concentrate on the message while our designers take care of providing you with the right template for the situation.
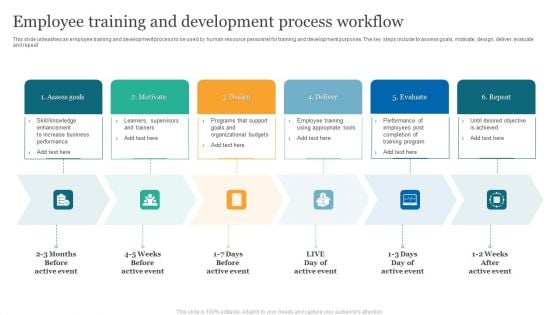
Employee Training And Development Process Workflow Infographics PDF
This slide unleashes an employee training and development process to be used by human resource personnel for training and development purposes. The key steps include to assess goals, motivate, design, deliver, evaluate and repeat. Presenting Employee Training And Development Process Workflow Infographics PDF to dispense important information. This template comprises Six stages. It also presents valuable insights into the topics includingLearners, Supervisors And Trainers, Programs That Support Goals. This is a completely customizable PowerPoint theme that can be put to use immediately. So, download it and address the topic impactfully.
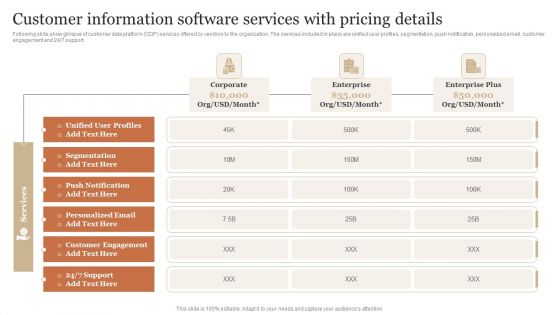
Customer Information Software Services With Pricing Details Infographics PDF
Following slide show glimpse of customer data platform CDP services offered by vendors to the organization. The services included in plans are unified user profiles, segmentation, push notification, personalized email, customer engagement and 24 or 7 support. Showcasing this set of slides titled Customer Information Software Services With Pricing Details Infographics PDF. The topics addressed in these templates are Segmentation, Customer Engagement, Enterprise Plus. All the content presented in this PPT design is completely editable. Download it and make adjustments in color, background, font etc. as per your unique business setting.
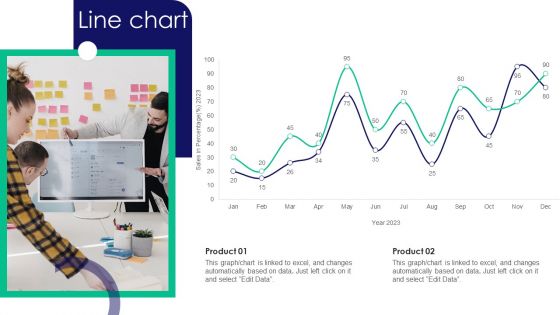
Guide To Business Customer Acquisition Line Chart Infographics PDF
Coming up with a presentation necessitates that the majority of the effort goes into the content and the message you intend to convey. The visuals of a PowerPoint presentation can only be effective if it supplements and supports the story that is being told. Keeping this in mind our experts created Guide To Business Customer Acquisition Line Chart Infographics PDF to reduce the time that goes into designing the presentation. This way, you can concentrate on the message while our designers take care of providing you with the right template for the situation.
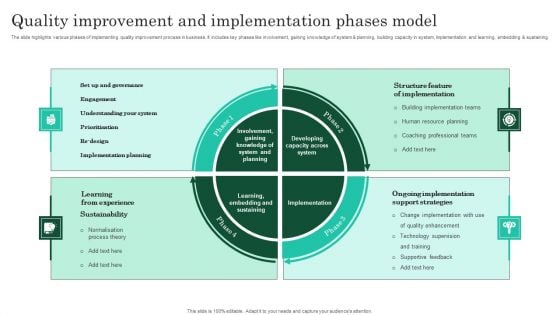
Quality Improvement And Implementation Phases Model Infographics PDF
The slide highlights various phases of implementing quality improvement process in business. It includes key phases like involvement, gaining knowledge of system and planning, building capacity in system, implementation and learning, embedding and sustaining. Presenting Quality Improvement And Implementation Phases Model Infographics PDF to dispense important information. This template comprises four stages. It also presents valuable insights into the topics including Structure Feature Of Implementation, Ongoing Implementation Support Strategies, Implementation Planning. This is a completely customizable PowerPoint theme that can be put to use immediately. So, download it and address the topic impactfully.
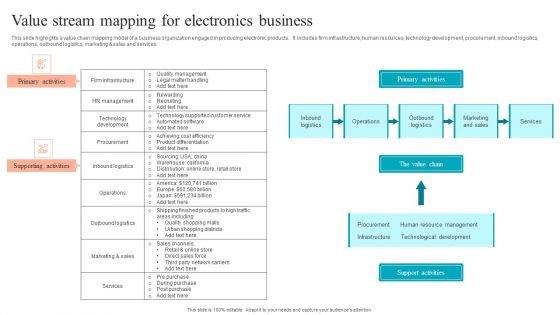
Value Stream Mapping For Electronics Business Infographics PDF
This slide highlights a value chain mapping model of a business organization engaged in producing electronic products. It includes firm infrastructure, human resources, technology development, procurement, inbound logistics, operations, outbound logistics, marketing and sales and services. Showcasing this set of slides titled Value Stream Mapping For Electronics Business Infographics PDF. The topics addressed in these templates are Primary Activities, Supporting Activities, Value Stream. All the content presented in this PPT design is completely editable. Download it and make adjustments in color, background, font etc. as per your unique business setting.
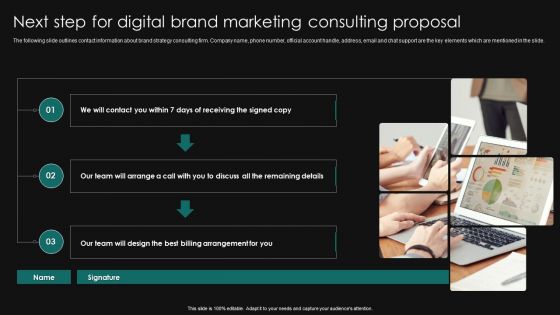
Next Step For Digital Brand Marketing Consulting Proposal Infographics PDF
The following slide outlines contact information about brand strategy consulting firm. Company name, phone number, official account handle, address, email and chat support are the key elements which are mentioned in the slide. Elevate your presentations with our intuitive Next Step For Digital Brand Marketing Consulting Proposal Infographics PDF template. Whether youre delivering a pitch, sharing data, or presenting ideas, our visually-stunning single-slide PPT template is the perfect tool to captivate your audience. With 100 percent editable features and a user-friendly interface, creating professional presentations has never been easier. Download now and leave a lasting impression.
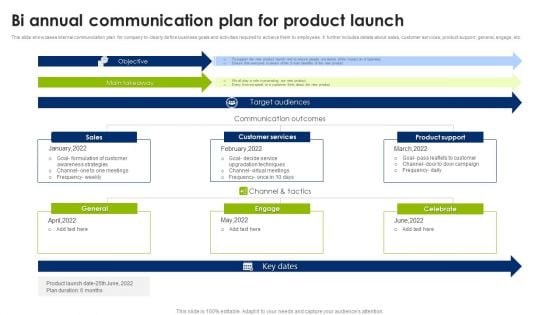
Bi Annual Communication Plan For Product Launch Infographics PDF
This slide showcases internal communication plan for company to clearly define business goals and activities required to achieve them to employees. It further includes details about sales, customer services, product support, general, engage, etc. Pitch your topic with ease and precision using this Bi Annual Communication Plan For Product Launch Infographics PDF. This layout presents information on Objective, Main Takeaway, Sales. It is also available for immediate download and adjustment. So, changes can be made in the color, design, graphics or any other component to create a unique layout.
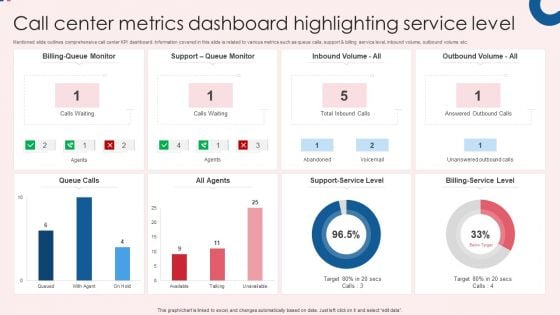
Call Center Metrics Dashboard Highlighting Service Level Infographics PDF
Mentioned slide outlines comprehensive call center KPI dashboard. Information covered in this slide is related to various metrics such as queue calls, support and billing service level, inbound volume, outbound volume etc. Pitch your topic with ease and precision using this Call Center Metrics Dashboard Highlighting Service Level Infographics PDF. This layout presents information on All Agents, Queue Calls, Billing Service Level. It is also available for immediate download and adjustment. So, changes can be made in the color, design, graphics or any other component to create a unique layout.
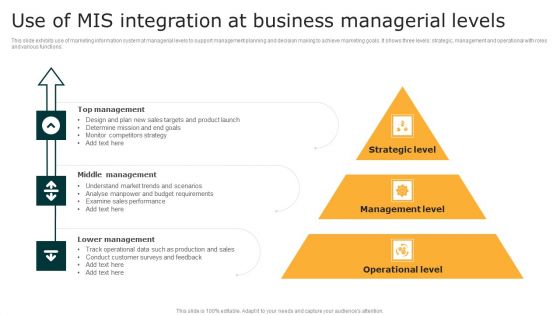
Use Of MIS Integration At Business Managerial Levels Infographics PDF
This slide exhibits use of marketing information system at managerial levels to support management planning and decision making to achieve marketing goals. It shows three levels strategic, management and operational with roles and various functions. Persuade your audience using this Use Of MIS Integration At Business Managerial Levels Infographics PDF. This PPT design covers three stages, thus making it a great tool to use. It also caters to a variety of topics including Management Level, Strategic Level, Operational Level. Download this PPT design now to present a convincing pitch that not only emphasizes the topic but also showcases your presentation skills.
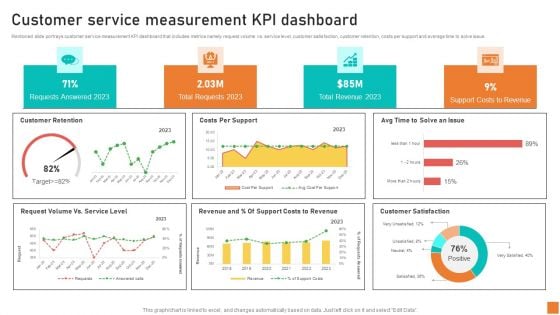
Customer Service Measurement KPI Dashboard Ppt Infographics Themes PDF
Mentioned slide portrays customer service measurement KPI dashboard that includes metrics namely request volume vs. service level, customer satisfaction, customer retention, costs per support and average time to solve issue. If your project calls for a presentation, then Slidegeeks is your go-to partner because we have professionally designed, easy-to-edit templates that are perfect for any presentation. After downloading, you can easily edit Customer Service Measurement KPI Dashboard Ppt Infographics Themes PDF and make the changes accordingly. You can rearrange slides or fill them with different images. Check out all the handy templates
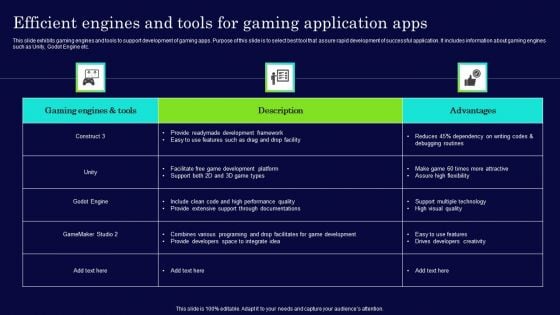
Efficient Engines And Tools For Gaming Application Apps Infographics PDF
This slide exhibits gaming engines and tools to support development of gaming apps. Purpose of this slide is to select best tool that assure rapid development of successful application. It includes information about gaming engines such as Unity, Godot Engine etc. Pitch your topic with ease and precision using this Efficient Engines And Tools For Gaming Application Apps Infographics PDF. This layout presents information on Development Platform, Development Framework, Developers Creativity. It is also available for immediate download and adjustment. So, changes can be made in the color, design, graphics or any other component to create a unique layout.
Digital Advertising Plan For Bakery Business Idea Generation Infographics PDF
Coming up with a presentation necessitates that the majority of the effort goes into the content and the message you intend to convey. The visuals of a PowerPoint presentation can only be effective if it supplements and supports the story that is being told. Keeping this in mind our experts created Digital Advertising Plan For Bakery Business Idea Generation Infographics PDF to reduce the time that goes into designing the presentation. This way, you can concentrate on the message while our designers take care of providing you with the right template for the situation.
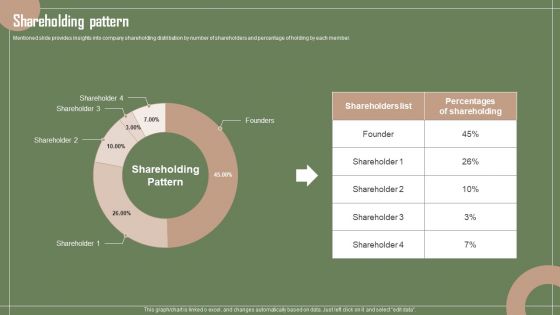
Data Automation Solution Investor Funding Presentation Shareholding Pattern Infographics PDF
Mentioned slide provides insights into company shareholding distribution by number of shareholders and percentage of holding by each member. Coming up with a presentation necessitates that the majority of the effort goes into the content and the message you intend to convey. The visuals of a PowerPoint presentation can only be effective if it supplements and supports the story that is being told. Keeping this in mind our experts created Data Automation Solution Investor Funding Presentation Shareholding Pattern Infographics PDF to reduce the time that goes into designing the presentation. This way, you can concentrate on the message while our designers take care of providing you with the right template for the situation.
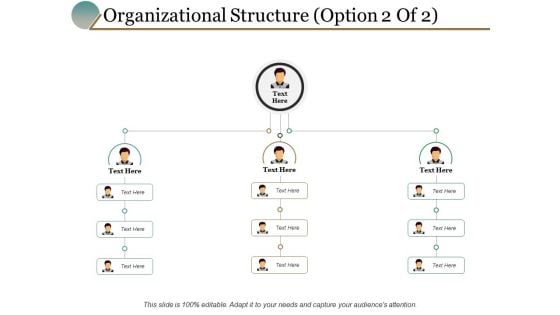
Organizational Structure Option Marketing Ppt PowerPoint Presentation Show Infographics
This is a organizational structure option marketing ppt powerpoint presentation show infographics. This is a three stage process. The stages in this process are business, management, planning, strategy, marketing.
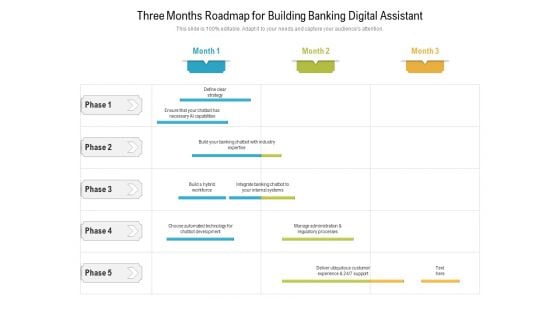
Three Months Roadmap For Building Banking Digital Assistant Infographics
Introducing our three months roadmap for building banking digital assistant infographics. This PPT presentation is Google Slides compatible, therefore, you can share it easily with the collaborators for measuring the progress. Also, the presentation is available in both standard screen and widescreen aspect ratios. So edit the template design by modifying the font size, font type, color, and shapes as per your requirements. As this PPT design is fully editable it can be presented in PDF, JPG and PNG formats.
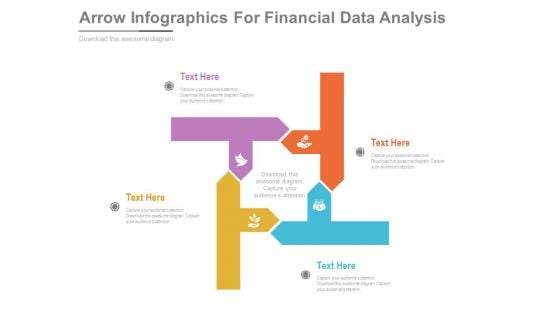
Arrow Infographics For Financial Data Analysis Powerpoint Template
This PowerPoint slide contains diagram of arrows infographic. This professional slide helps to exhibit financial data analysis for business growth. Use this PowerPoint template to make impressive presentations.

Event Management Services Company Profile Client Testimonials Infographics PDF
This slide focuses on client reviews and testimonials post experiencing event management services which helps to build credibility and reliability to business and helps in decision making process.This is a Event Management Services Company Profile Client Testimonials Infographics PDF template with various stages. Focus and dispense information on four stages using this creative set, that comes with editable features. It contains large content boxes to add your information on topics like elegant according, professionalism, executed wedding You can also showcase facts, figures, and other relevant content using this PPT layout. Grab it now.
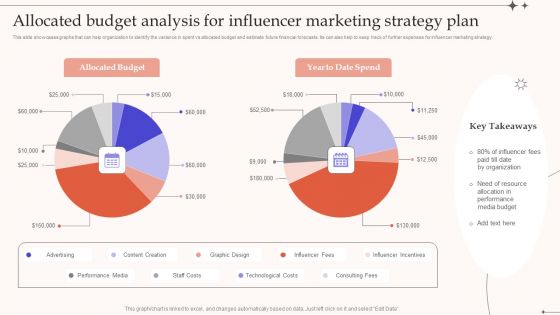
Allocated Budget Analysis For Influencer Marketing Strategy Plan Infographics PDF
This slide showcases graphs that can help organization to identify the variance in spent vs allocated budget and estimate future financial forecasts. Its can also help to keep track of further expenses for influencer marketing strategy.Showcasing this set of slides titled Allocated Budget Analysis For Influencer Marketing Strategy Plan Infographics PDF. The topics addressed in these templates are Allocated Budget, Date Organization, Performance Media Budget. All the content presented in this PPT design is completely editable. Download it and make adjustments in color, background, font etc. as per your unique business setting.
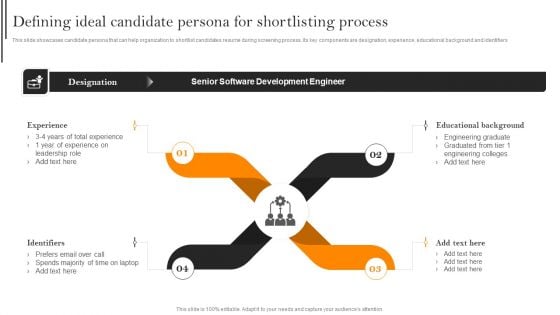
Defining Ideal Candidate Persona For Shortlisting Process Infographics PDF
This slide showcases candidate persona that can help organization to shortlist candidates resume during screening process. Its key components are designation, experience, educational background and identifiers. Want to ace your presentation in front of a live audience Our Defining Ideal Candidate Persona For Shortlisting Process Infographics PDF can help you do that by engaging all the users towards you. Slidegeeks experts have put their efforts and expertise into creating these impeccable powerpoint presentations so that you can communicate your ideas clearly. Moreover, all the templates are customizable, and easy to edit and downloadable. Use these for both personal and commercial use.

Internal Audit Checklist For Production Management Infographics PDF
This slide provides glimpse about audit checklist to ensure high quality production that can help an organization to effective production planning and control. It includes purchasing, inventory control, scheduling, etc. From laying roadmaps to briefing everything in detail, our templates are perfect for you. You can set the stage with your presentation slides. All you have to do is download these easy to edit and customizable templates. Internal Audit Checklist For Production Management Infographics PDF will help you deliver an outstanding performance that everyone would remember and praise you for. Do download this presentation today.
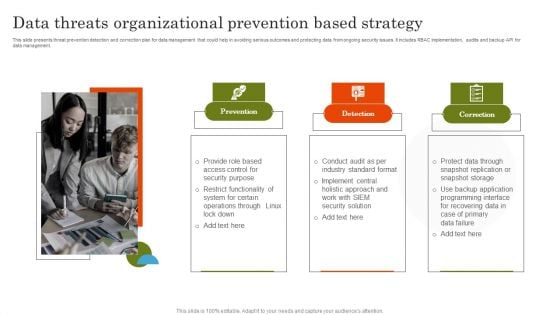
Data Threats Organizational Prevention Based Strategy Infographics PDF
This slide presents threat prevention detection and correction plan for data management that could help in avoiding serious outcomes and protecting data from ongoing security issues. It includes RBAC implementation, audits and backup API for data management. Increase audience engagement and knowledge by dispensing information using Data Threats Organizational Prevention Based Strategy Infographics PDF. This template helps you present information on three stages. You can also present information on Prevention, Detection, Correction using this PPT design. This layout is completely editable so personaize it now to meet your audiences expectations.
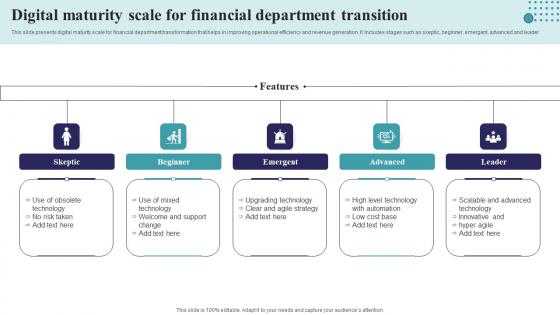
Digital Maturity Scale For Financial Department Transition Infographics Pdf
This slide presents digital maturity scale for financial department transformation that helps in improving operational efficiency and revenue generation. It includes stages such as skeptic, beginner, emergent, advanced and leader Showcasing this set of slides titled Digital Maturity Scale For Financial Department Transition Infographics Pdf The topics addressed in these templates are Skeptic, Emergent, Beginner, Advanced All the content presented in this PPT design is completely editable. Download it and make adjustments in color, background, font etc. as per your unique business setting. This slide presents digital maturity scale for financial department transformation that helps in improving operational efficiency and revenue generation. It includes stages such as skeptic, beginner, emergent, advanced and leader
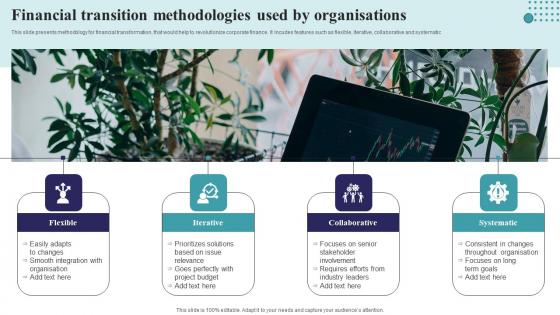
Financial Transition Methodologies Used By Organisations Infographics Pdf
This slide presents methodology for financial transformation, that would help to revolutionize corporate finance. It incudes features such as flexible, iterative, collaborative and systematic Showcasing this set of slides titled Financial Transition Methodologies Used By Organisations Infographics Pdf The topics addressed in these templates are Flexible, Iterative, Collaborative, Systematic All the content presented in this PPT design is completely editable. Download it and make adjustments in color, background, font etc. as per your unique business setting. This slide presents methodology for financial transformation, that would help to revolutionize corporate finance. It incudes features such as flexible, iterative, collaborative and systematic
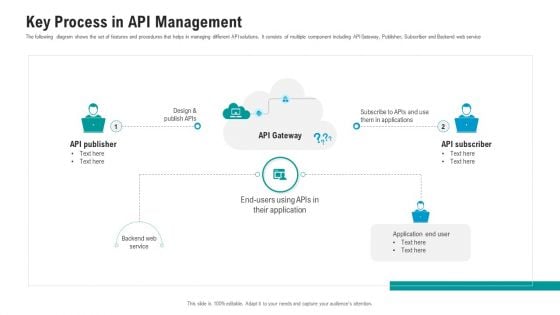
API Ecosystem Key Process In API Management Infographics PDF
The following diagram shows the set of features and procedures that helps in managing different API solutions. It consists of multiple component including API Gateway, Publisher, Subscriber and Backend web service. This is a api ecosystem key process in api management infographics pdf template with various stages. Focus and dispense information on three stages using this creative set, that comes with editable features. It contains large content boxes to add your information on topics like key process in api management. You can also showcase facts, figures, and other relevant content using this PPT layout. Grab it now.
Key Solutions To Overcome The Challenges Ppt Icon Infographics PDF
The slide provides the key solutions which might help the company to overcome its challenges. Key solutions include track customer related metrics, focus more on promotion, personalize and quick services etc. Presenting key solutions to overcome the challenges ppt icon infographics pdf to provide visual cues and insights. Share and navigate important information on four stages that need your due attention. This template can be used to pitch topics like track customer related metrics, resolve service issues faster, personalize services. In addtion, this PPT design contains high resolution images, graphics, etc, that are easily editable and available for immediate download.
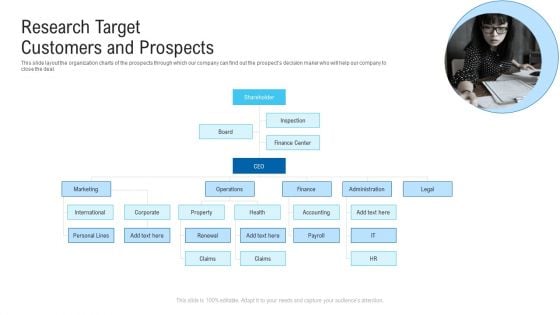
Research Target Customers And Prospects Ppt Infographics Show PDF
This slide layout the organization charts of the prospects through which our company can find out the prospects decision maker who will help our company to close the deal.Presenting research target customers and prospects ppt infographics show pdf. to provide visual cues and insights. Share and navigate important information on seven stages that need your due attention. This template can be used to pitch topics like shareholder, marketing, international, operations. In addtion, this PPT design contains high resolution images, graphics, etc, that are easily editable and available for immediate download.
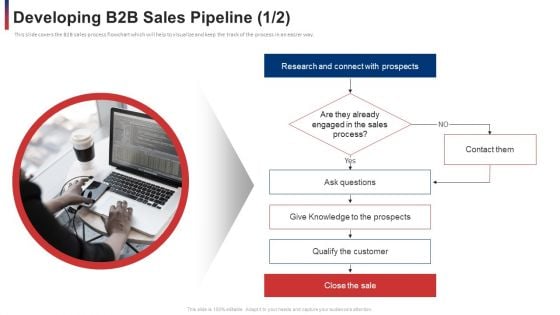
Developing B2b Sales Pipeline Sales Ppt Infographics Layouts PDF
This slide covers the B2B sales process flowchart which will help to visualize and keep the track of the process in an easier way. This is a developing b2b sales pipeline sales ppt infographics layouts pdf. template with various stages. Focus and dispense information on one stages using this creative set, that comes with editable features. It contains large content boxes to add your information on topics like developing b2b sales pipeline. You can also showcase facts, figures, and other relevant content using this PPT layout. Grab it now.
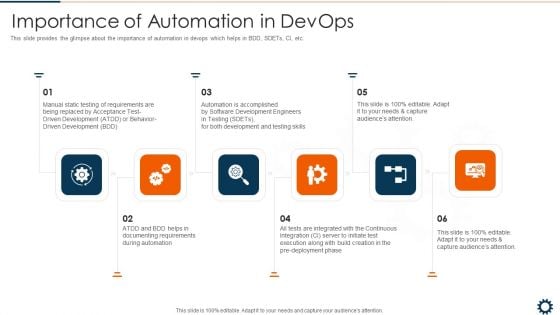
Devops Robotization IT Importance Of Automation In Devops Infographics PDF
This slide provides the glimpse about the importance of automation in devops which helps in BDD, SDETs, CI, etc. This is a devops robotization it importance of automation in devops infographics pdf template with various stages. Focus and dispense information on six stages using this creative set, that comes with editable features. It contains large content boxes to add your information on topics like acceptance, requirements, development, accomplished. You can also showcase facts, figures, and other relevant content using this PPT layout. Grab it now.
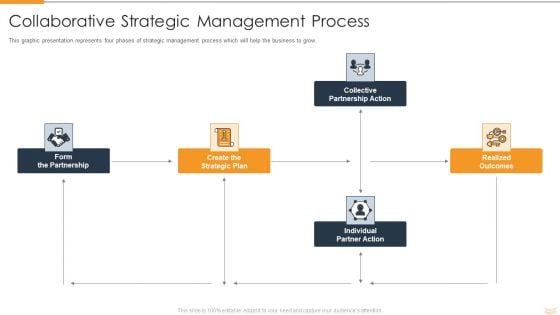
Strategic Partnership Management Plan Collaborative Strategic Management Process Infographics PDF
This graphic presentation represents four phases of strategic management process which will help the business to grow. Presenting strategic partnership management plan collaborative strategic management process infographics pdf to provide visual cues and insights. Share and navigate important information on five stages that need your due attention. This template can be used to pitch topics like collective partnership action, realized outcomes, individual partner action, create the strategic plan, form the partnership. In addtion, this PPT design contains high resolution images, graphics, etc, that are easily editable and available for immediate download.
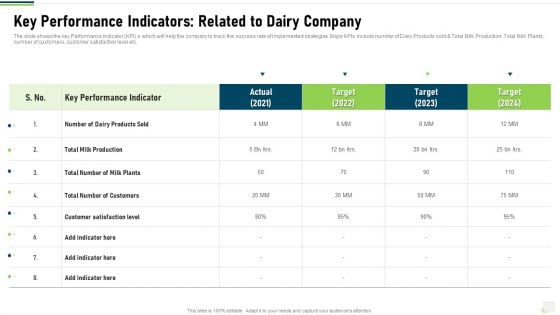
Key Performance Indicators Related To Dairy Company Infographics PDF
The slide shows the key Performance Indicator KPI s which will help the company to track the success rate of implemented strategies. Major KPIs include number of Dairy Products sold and Total Milk Production, Total Milk Plants, number of customers, customer satisfaction level etc. Deliver and pitch your topic in the best possible manner with this key performance indicators related to dairy company infographics pdf. Use them to share invaluable insights on key performance indicators related to dairy company and impress your audience. This template can be altered and modified as per your expectations. So, grab it now.
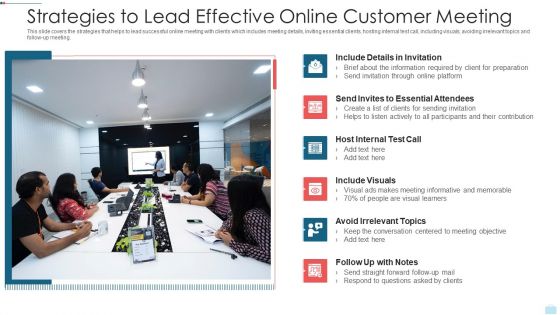
Strategies To Lead Effective Online Customer Meeting Infographics PDF
This slide covers the strategies that helps to lead successful online meeting with clients which includes meeting details, inviting essential clients, hosting internal test call, including visuals, avoiding irrelevant topics and follow-up meeting. Presenting strategies to lead effective online customer meeting infographics pdf to dispense important information. This template comprises six stages. It also presents valuable insights into the topics including include visuals, avoid irrelevant topics, host internal test call. This is a completely customizable PowerPoint theme that can be put to use immediately. So, download it and address the topic impactfully.
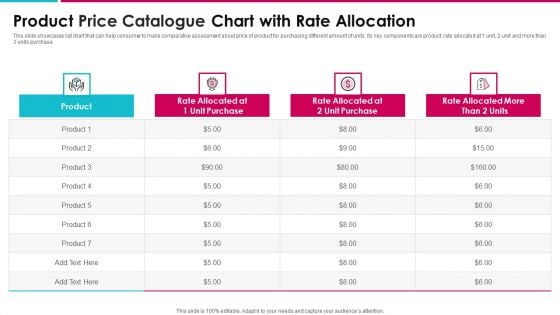
Product Price Catalogue Chart With Rate Allocation Infographics PDF
This slide showcases list chart that can help consumer to make comparative assessment about price of product for purchasing different amount of units. Its key components are product, rate allocated at 1 unit, 2 unit and more than 3 units purchase Pitch your topic with ease and precision using this product price catalogue chart with rate allocation infographics pdf. This layout presents information on product price catalogue chart with rate allocation. It is also available for immediate download and adjustment. So, changes can be made in the color, design, graphics or any other component to create a unique layout.
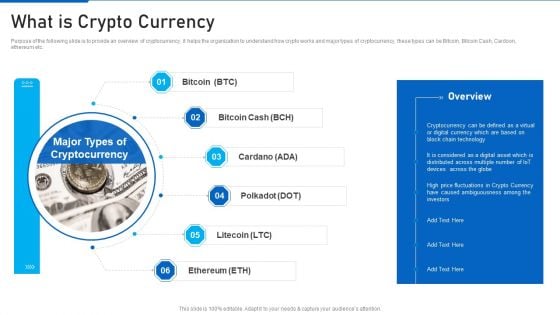
Cryptocurrency Investment Playbook What Is Crypto Currency Infographics PDF
Purpose of the following slide is to provide an overview of cryptocurrency, it helps the organization to understand how crypto works and major types of cryptocurrency, these types can be Bitcoin, Bitcoin Cash, Cardoon, ethereum etc. Presenting cryptocurrency investment playbook what is crypto currency infographics pdf to provide visual cues and insights. Share and navigate important information on six stages that need your due attention. This template can be used to pitch topics like what is crypto currency In addtion, this PPT design contains high resolution images, graphics, etc, that are easily editable and available for immediate download.
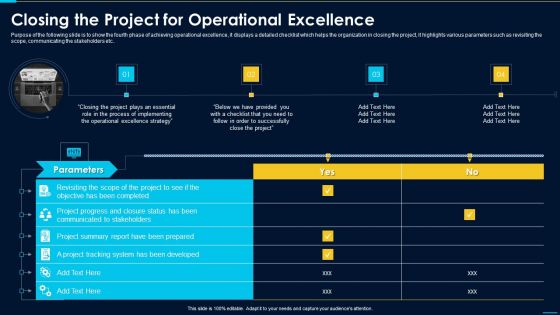
Closing The Project For Operational Excellence Infographics PDF
Purpose of the following slide is to show the fourth phase of achieving operational excellence, it displays a detailed checklist which helps the organization in closing the project, it highlights various parameters such as revisiting the scope, communicating the stakeholders etc.Deliver an awe inspiring pitch with this creative closing the project for operational excellence infographics pdf bundle. Topics like project progress, project summary, system has been developed can be discussed with this completely editable template. It is available for immediate download depending on the needs and requirements of the user.
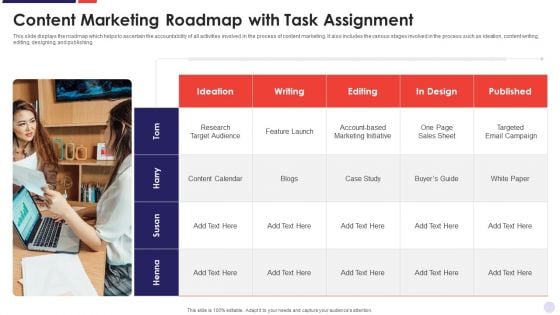
Content Marketing Roadmap With Task Assignment Infographics PDF
This slide displays the roadmap which helps to ascertain the accountability of all activities involved in the process of content marketing. It also includes the various stages involved in the process such as ideation, content writing, editing, designing, and publishing. Presenting Content Marketing Roadmap With Task Assignment Infographics PDF to dispense important information. This template comprises one stage. It also presents valuable insights into the topics including Research Target Audience, Targeted Email Campaign, Feature Launch . This is a completely customizable PowerPoint theme that can be put to use immediately. So, download it and address the topic impactfully.
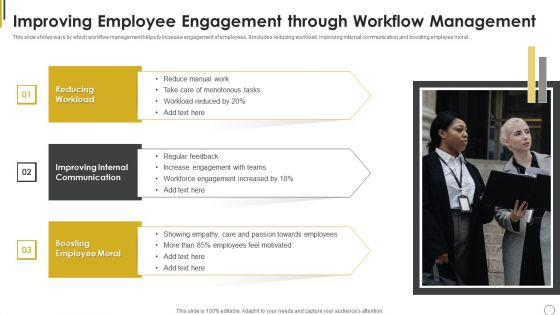
Improving Employee Engagement Through Workflow Management Ppt Infographics Model PDF
This slide shows ways by which workflow management helps to increase engagement of employees. It includes reducing workload, improving internal communication and boosting employee moral. Persuade your audience using this Improving Employee Engagement Through Workflow Management Ppt Infographics Model PDF. This PPT design covers three stages, thus making it a great tool to use. It also caters to a variety of topics including Improving Internal Communication, Boosting Employee Moral, Reducing Workload Teams. Download this PPT design now to present a convincing pitch that not only emphasizes the topic but also showcases your presentation skills.
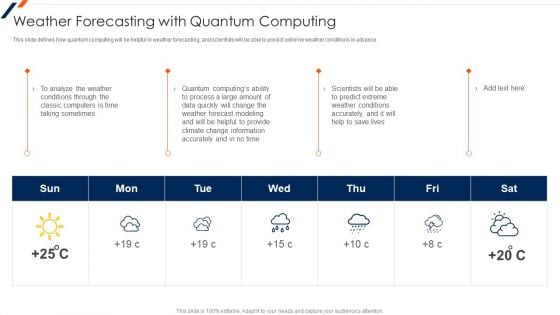
Weather Forecasting With Quantum Computing Ppt Infographics Graphic Images PDF
This slide defines how quantum computing will be helpful in weather forecasting, and scientists will be able to predict extreme weather conditions in advance. Presenting Weather Forecasting With Quantum Computing Ppt Infographics Graphic Images PDF to provide visual cues and insights. Share and navigate important information on seven stages that need your due attention. This template can be used to pitch topics like Weather Forecasting, Quantum Computing. In addtion, this PPT design contains high resolution images, graphics, etc, that are easily editable and available for immediate download.
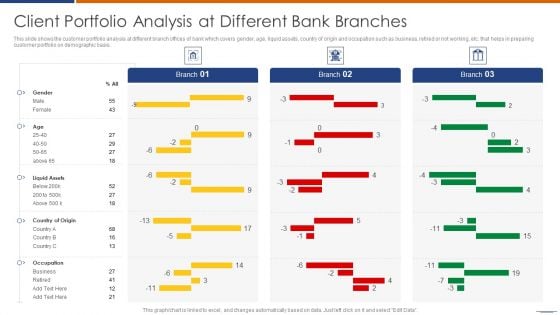
Client Portfolio Analysis At Different Bank Branches Infographics PDF
This slide shows the customer portfolio analysis at different branch offices of bank which covers gender, age, liquid assets, country of origin and occupation such as business, retired or not working, etc. that helps in preparing customer portfolio on demographic basis.Showcasing this set of slides titled Client Portfolio Analysis At Different Bank Branches Infographics PDF The topics addressed in these templates are Client Portfolio, Analysis Different, Bank Branches All the content presented in this PPT design is completely editable. Download it and make adjustments in color, background, font etc. as per your unique business setting.
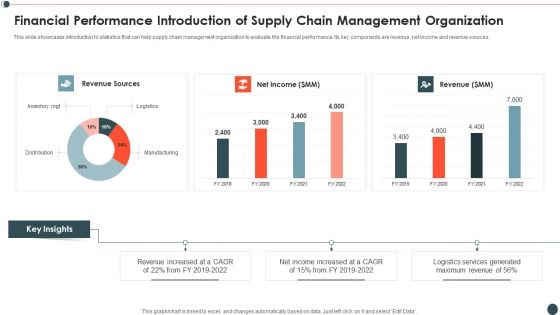
Financial Performance Introduction Of Supply Chain Management Organization Infographics PDF
This slide showcases introduction to statistics that can help supply chain management organization to evaluate the financial performance. Its key components are revenue, net income and revenue sources.Pitch your topic with ease and precision using this Financial Performance Introduction Of Supply Chain Management Organization Infographics PDF This layout presents information on Revenue Sources, Revenue Increased, Income Increased It is also available for immediate download and adjustment. So, changes can be made in the color, design, graphics or any other component to create a unique layout.
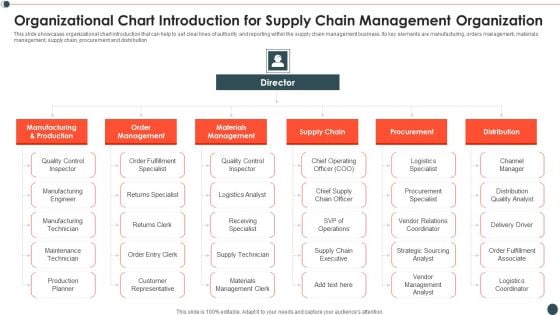
Organizational Chart Introduction For Supply Chain Management Organization Infographics PDF
This slide showcases organizational chart introduction that can help to set clear lines of authority and reporting within the supply chain management business. Its key elements are manufacturing, orders management, materials management, supply chain, procurement and distribution.Showcasing this set of slides titled Organizational Chart Introduction For Supply Chain Management Organization Infographics PDF The topics addressed in these templates are Manufacturing Production, Order Management, Materials Management All the content presented in this PPT design is completely editable. Download it and make adjustments in color, background, font etc. as per your unique business setting.
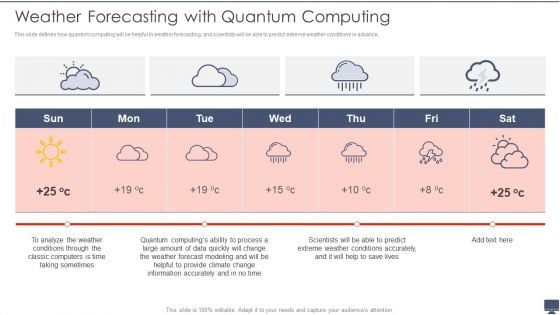
Weather Forecasting With Quantum Computing Ppt Infographics Influencers PDF
This slide defines how quantum computing will be helpful in weather forecasting, and scientists will be able to predict extreme weather conditions in advance. This is a Weather Forecasting With Quantum Computing Ppt Infographics Influencers PDF template with various stages. Focus and dispense information on four stages using this creative set, that comes with editable features. It contains large content boxes to add your information on topics like Analyze, Information Accurately, Quantum Computings. You can also showcase facts, figures, and other relevant content using this PPT layout. Grab it now.
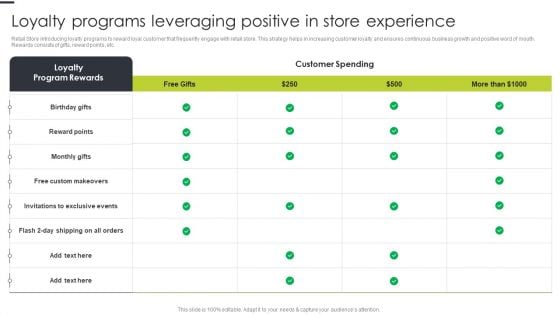
Loyalty Programs Leveraging Positive In Store Experience Infographics PDF
Retail Store introducing loyalty programs to reward loyal customer that frequently engage with retail store. This strategy helps in increasing customer loyalty and ensures continuous business growth and positive word of mouth. Rewards consists of gifts, reward points, etc. Deliver an awe inspiring pitch with this creative Loyalty Programs Leveraging Positive In Store Experience Infographics PDF bundle. Topics like Custom Makeovers, Exclusive Events, Reward Points can be discussed with this completely editable template. It is available for immediate download depending on the needs and requirements of the user.
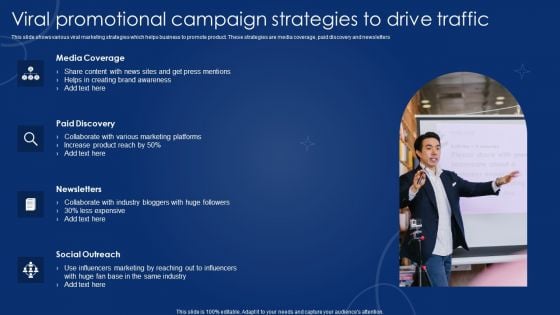
Viral Promotional Campaign Strategies To Drive Traffic Infographics PDF
This slide shows various viral marketing strategies which helps business to promote product. These strategies are media coverage, paid discovery and newsletters. Persuade your audience using this Viral Promotional Campaign Strategies To Drive Traffic Infographics PDF. This PPT design covers four stages, thus making it a great tool to use. It also caters to a variety of topics including Media Coverage, Paid Discovery, Newsletters, Social Outreach. Download this PPT design now to present a convincing pitch that not only emphasizes the topic but also showcases your presentation skills.
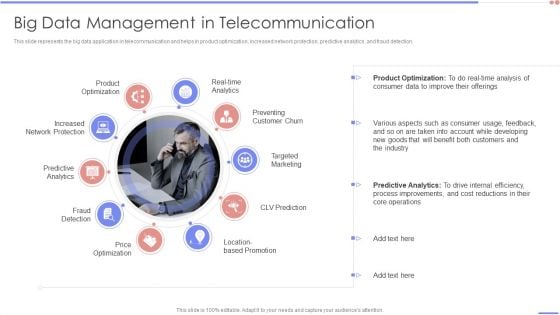
Data Analytics Management Big Data Management In Telecommunication Infographics PDF
This slide represents the big data application in telecommunication and helps in product optimization, increased network protection, predictive analytics, and fraud detection.Presenting Data Analytics Management Big Data Management In Telecommunication Infographics PDF to provide visual cues and insights. Share and navigate important information on ten stages that need your due attention. This template can be used to pitch topics like Product Optimization, Predictive Analytics, Fraud Detection. In addtion, this PPT design contains high resolution images, graphics, etc, that are easily editable and available for immediate download.

Four Stages Of Business Environment Evaluating Infographics PDF
This slide focuses on the four stages of business environment analysis which includes scanning, monitoring, forecasting and assessing that are helpful in identifying the environmental trends and patterns to determine the impact on organization. Persuade your audience using this Four Stages Of Business Environment Evaluating Infographics PDF. This PPT design covers four stages, thus making it a great tool to use. It also caters to a variety of topics including Monitoring, Scanning, Forecasting. Download this PPT design now to present a convincing pitch that not only emphasizes the topic but also showcases your presentation skills.
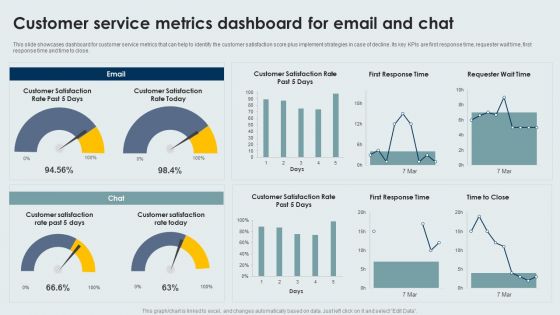
Customer Service Metrics Dashboard For Email And Chat Infographics PDF
This slide showcases dashboard for customer service metrics that can help to identify the customer satisfaction score plus implement strategies in case of decline. Its key KPIs are first response time, requester wait time, first response time and time to close. Pitch your topic with ease and precision using this Customer Service Metrics Dashboard For Email And Chat Infographics PDF. This layout presents information on Customer Service, Metrics Dashboard, Email And Chat. It is also available for immediate download and adjustment. So, changes can be made in the color, design, graphics or any other component to create a unique layout.
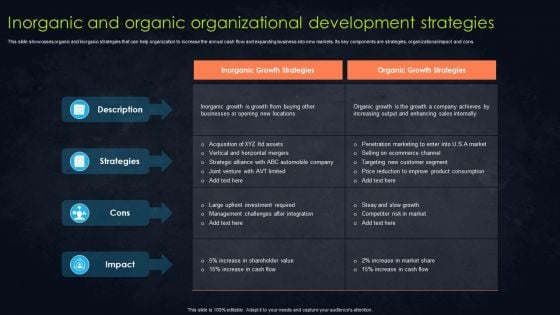
Inorganic And Organic Organizational Development Strategies Infographics PDF
This slide showcases matrix that can help organization to implement organic and inorganic growth strategies based upon market and product type. It also showcases level of risk involved in implementing different strategies. Presenting Inorganic And Organic Organizational Development Strategies Infographics PDF to dispense important information. This template comprises four stages. It also presents valuable insights into the topics including Market Penetration, Product Development, Market Development. This is a completely customizable PowerPoint theme that can be put to use immediately. So, download it and address the topic impactfully.
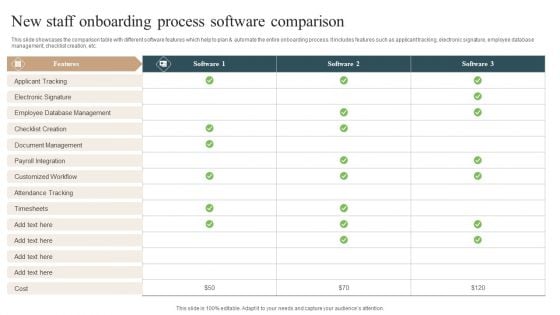
New Staff Onboarding Process Software Comparison Infographics PDF
This slide showcases the comparison table with different software features which help to plan and automate the entire onboarding process. It includes features such as applicant tracking, electronic signature, employee database management, checklist creation, etc. Showcasing this set of slides titled New Staff Onboarding Process Software Comparison Infographics PDF. The topics addressed in these templates are Document Management, Applicant Tracking, Customized Workflow. All the content presented in this PPT design is completely editable. Download it and make adjustments in color, background, font etc. as per your unique business setting.
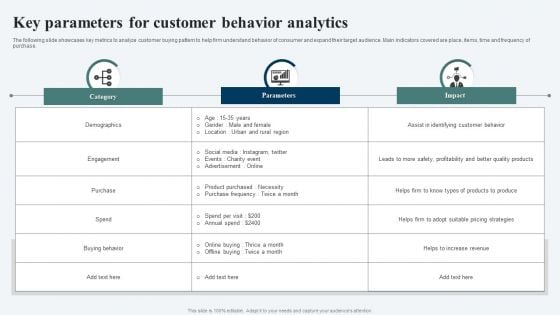
Key Parameters For Customer Behavior Analytics Ppt Infographics Summary PDF
The following slide showcases key metrics to analyze customer buying pattern to help firm understand behavior of consumer and expand their target audience. Main indicators covered are place, items, time and frequency of purchase. Pitch your topic with ease and precision using this Key Parameters For Customer Behavior Analytics Ppt Infographics Summary PDF. This layout presents information on Demographics, Engagement, Purchase. It is also available for immediate download and adjustment. So, changes can be made in the color, design, graphics or any other component to create a unique layout.
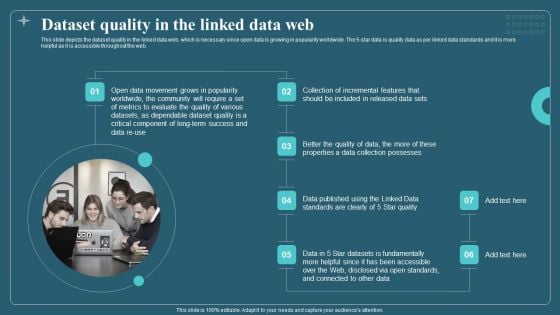
Dataset Quality In The Linked Data Web Infographics PDF
This slide depicts the dataset quality in the linked data web, which is necessary since open data is growing in popularity worldwide. The 5-star data is quality data as per linked data standards and it is more helpful as it is accessible throughout the web. This is a Dataset Quality In The Linked Data Web Infographics PDF template with various stages. Focus and dispense information on seven stages using this creative set, that comes with editable features. It contains large content boxes to add your information on topics like Quality Of Data, Evaluate, Metrics. You can also showcase facts, figures, and other relevant content using this PPT layout. Grab it now.
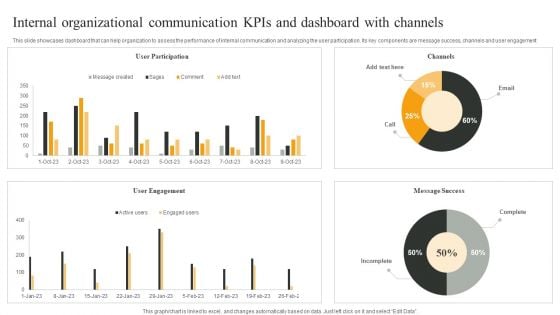
Internal Organizational Communication Kpis And Dashboard With Channels Infographics PDF
This slide showcases dashboard that can help organization to assess the performance of internal communication and analyzing the user participation. Its key components are message success, channels and user engagement. Pitch your topic with ease and precision using this Internal Organizational Communication Kpis And Dashboard With Channels Infographics PDF. This layout presents information on User Participation, User Engagement, Message Success. It is also available for immediate download and adjustment. So, changes can be made in the color, design, graphics or any other component to create a unique layout.
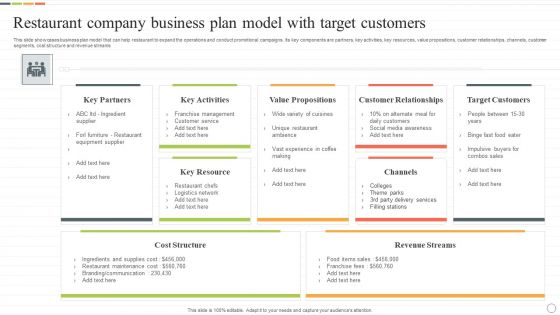
Restaurant Company Business Plan Model With Target Customers Infographics PDF
This slide showcases business plan model that can help restaurant to expand the operations and conduct promotional campaigns. Its key components are partners, key activities, key resources, value propositions, customer relationships, channels, customer segments, cost structure and revenue streams. Pitch your topic with ease and precision using this Restaurant Company Business Plan Model With Target Customers Infographics PDF. This layout presents information on Value Propositions, Customer Relationships, Target Customers. It is also available for immediate download and adjustment. So, changes can be made in the color, design, graphics or any other component to create a unique layout.
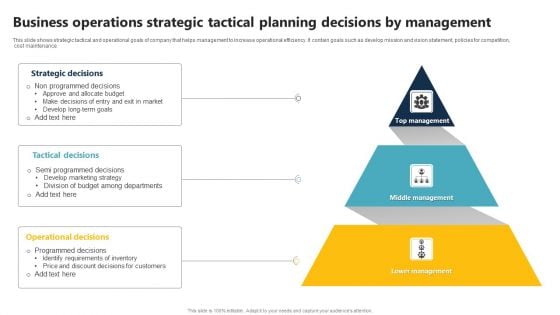
Business Operations Strategic Tactical Planning Decisions By Management Infographics PDF
This slide shows strategic tactical and operational goals of company that helps management to increase operational efficiency. It contain goals such as develop mission and vision statement, policies for competition, cost maintenance. Presenting Business Operations Strategic Tactical Planning Decisions By Management Infographics PDF to dispense important information. This template comprises three stages. It also presents valuable insights into the topics including Strategic Decisions, Tactical Decisions, Operational Decisions. This is a completely customizable PowerPoint theme that can be put to use immediately. So, download it and address the topic impactfully.


 Continue with Email

 Home
Home


