Benefits Dashboard
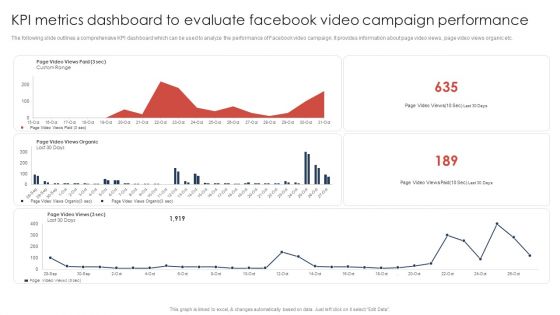
Kpi Metrics Dashboard To Evaluate Facebook Video Campaign Performance Information PDF
The following slide outlines a comprehensive KPI dashboard which can be used to analyze the performance of Facebook video campaign. It provides information about page video views, page video views organic etc. Whether you have daily or monthly meetings, a brilliant presentation is necessary. Kpi Metrics Dashboard To Evaluate Facebook Video Campaign Performance Information PDF can be your best option for delivering a presentation. Represent everything in detail using Kpi Metrics Dashboard To Evaluate Facebook Video Campaign Performance Information PDF and make yourself stand out in meetings. The template is versatile and follows a structure that will cater to your requirements. All the templates prepared by Slidegeeks are easy to download and edit. Our research experts have taken care of the corporate themes as well. So, give it a try and see the results.
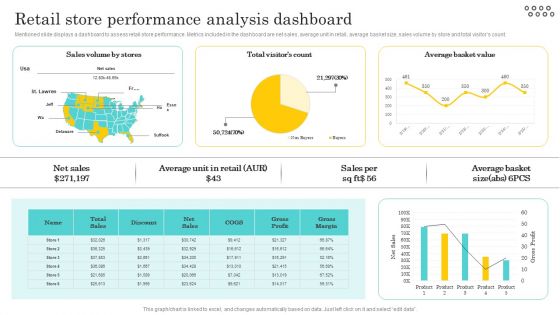
Optimizing And Managing Retail Retail Store Performance Analysis Dashboard Rules PDF
Mentioned slide displays a dashboard to assess retail store performance. Metrics included in the dashboard are net sales, average unit in retail, average basket size, sales volume by store and total visitors count. This Optimizing And Managing Retail Retail Store Performance Analysis Dashboard Rules PDF from Slidegeeks makes it easy to present information on your topic with precision. It provides customization options, so you can make changes to the colors, design, graphics, or any other component to create a unique layout. It is also available for immediate download, so you can begin using it right away. Slidegeeks has done good research to ensure that you have everything you need to make your presentation stand out. Make a name out there for a brilliant performance.

Deploying AML Transaction Monitoring Dashboard To Monitor Bank Transactions And Activities Graphics PDF
This slide showcases dashboard to review bank transactions and activities. It provides information about credit, check, ATM, debit card, transaction volume, decline rate, visa, maestro, network end points, etc. Whether you have daily or monthly meetings, a brilliant presentation is necessary. Deploying AML Transaction Monitoring Dashboard To Monitor Bank Transactions And Activities Graphics PDF can be your best option for delivering a presentation. Represent everything in detail using Deploying AML Transaction Monitoring Dashboard To Monitor Bank Transactions And Activities Graphics PDF and make yourself stand out in meetings. The template is versatile and follows a structure that will cater to your requirements. All the templates prepared by Slidegeeks are easy to download and edit. Our research experts have taken care of the corporate themes as well. So, give it a try and see the results.
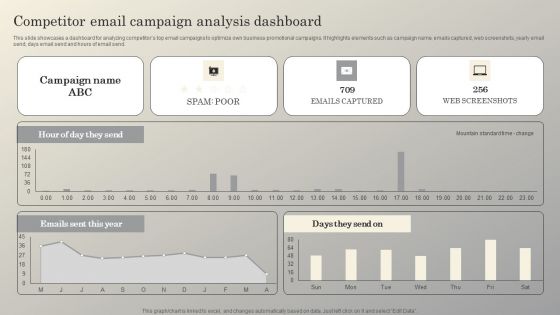
Steps To Conduct Competitor Analysis Competitor Email Campaign Analysis Dashboard Themes PDF
This slide showcases a dashboard for analyzing competitors top email campaigns to optimize own business promotional campaigns. It highlights elements such as campaign name, emails captured, web screenshots, yearly email send, days email send and hours of email send. Steps To Conduct Competitor Analysis Competitor Email Campaign Analysis Dashboard Themes PDF can be your best option for delivering a presentation. Represent everything in detail using Steps To Conduct Competitor Analysis Competitor Email Campaign Analysis Dashboard Themes PDF and make yourself stand out in meetings. The template is versatile and follows a structure that will cater to your requirements. All the templates prepared by Slidegeeks are easy to download and edit. Our research experts have taken care of the corporate themes as well. So, give it a try and see the results.
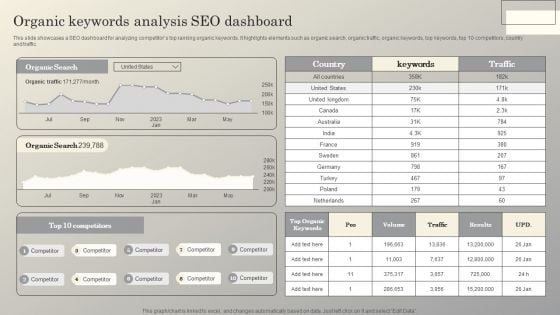
Steps To Conduct Competitor Analysis Organic Keywords Analysis Seo Dashboard Designs PDF
This slide showcases a SEO dashboard for analyzing competitors top ranking organic keywords. It highlights elements such as organic search, organic traffic, organic keywords, top keywords, top 10 competitors, country and traffic. Whether you have daily or monthly meetings, a brilliant presentation is necessary. Steps To Conduct Competitor Analysis Organic Keywords Analysis Seo Dashboard Designs PDF can be your best option for delivering a presentation. Represent everything in detail using Steps To Conduct Competitor Analysis Organic Keywords Analysis Seo Dashboard Designs PDF and make yourself stand out in meetings. The template is versatile and follows a structure that will cater to your requirements. All the templates prepared by Slidegeeks are easy to download and edit. Our research experts have taken care of the corporate themes as well. So, give it a try and see the results.

Introduction To Mobile SEM SEO Reporting Dashboard To Evaluate Website Rank Portrait PDF
The purpose of this slide is to outline mobile search engine optimization SEO reporting dashboard. It covers different metrics such as web traffic overview, total views, content overview, goal value and conversion etc. Get a simple yet stunning designed Introduction To Mobile SEM SEO Reporting Dashboard To Evaluate Website Rank Portrait PDF. It is the best one to establish the tone in your meetings. It is an excellent way to make your presentations highly effective. So, download this PPT today from Slidegeeks and see the positive impacts. Our easy to edit Introduction To Mobile SEM SEO Reporting Dashboard To Evaluate Website Rank Portrait PDF can be your go to option for all upcoming conferences and meetings. So, what are you waiting for Grab this template today.
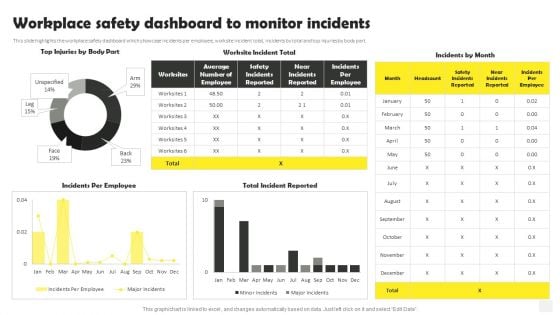
Occupational Health And Safety At Workplace Workplace Safety Dashboard To Monitor Incidents Inspiration PDF
This slide highlights the workplace safety dashboard which showcase incidents per employee, worksite incident total, incidents by total and top injuries by body part. Get a simple yet stunning designed Occupational Health And Safety At Workplace Workplace Safety Dashboard To Monitor Incidents Inspiration PDF. It is the best one to establish the tone in your meetings. It is an excellent way to make your presentations highly effective. So, download this PPT today from Slidegeeks and see the positive impacts. Our easy to edit Occupational Health And Safety At Workplace Workplace Safety Dashboard To Monitor Incidents Inspiration PDF can be your go to option for all upcoming conferences and meetings. So, what are you waiting for Grab this template today.
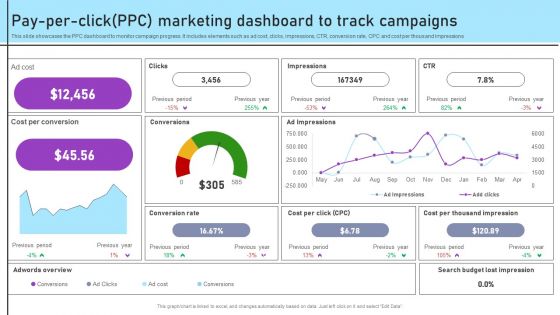
Inbound And Outbound Marketing Tactics Pay Per Click Ppc Marketing Dashboard Topics PDF
This slide showcases the PPC dashboard to monitor campaign progress. It includes elements such as ad cost, clicks, impressions, CTR, conversion rate, CPC and cost per thousand impressions. Get a simple yet stunning designed Inbound And Outbound Marketing Tactics Pay Per Click Ppc Marketing Dashboard Topics PDF. It is the best one to establish the tone in your meetings. It is an excellent way to make your presentations highly effective. So, download this PPT today from Slidegeeks and see the positive impacts. Our easy to edit Inbound And Outbound Marketing Tactics Pay Per Click Ppc Marketing Dashboard Topics PDF can be your go to option for all upcoming conferences and meetings. So, what are you waiting for Grab this template today.
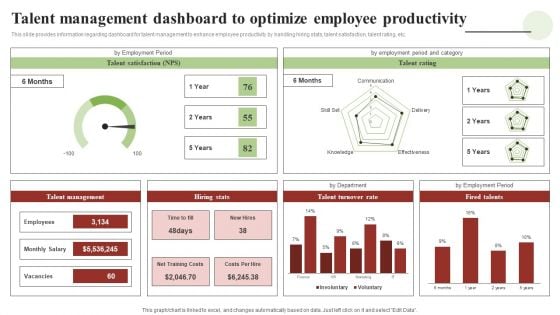
Transforming Human Resource Service Delivery Procedure Talent Management Dashboard To Optimize Themes PDF
This slide provides information regarding dashboard for talent management to enhance employee productivity by handling hiring stats, talent satisfaction, talent rating, etc. Whether you have daily or monthly meetings, a brilliant presentation is necessary. Transforming Human Resource Service Delivery Procedure Talent Management Dashboard To Optimize Themes PDF can be your best option for delivering a presentation. Represent everything in detail using Transforming Human Resource Service Delivery Procedure Talent Management Dashboard To Optimize Themes PDF and make yourself stand out in meetings. The template is versatile and follows a structure that will cater to your requirements. All the templates prepared by Slidegeeks are easy to download and edit. Our research experts have taken care of the corporate themes as well. So, give it a try and see the results.
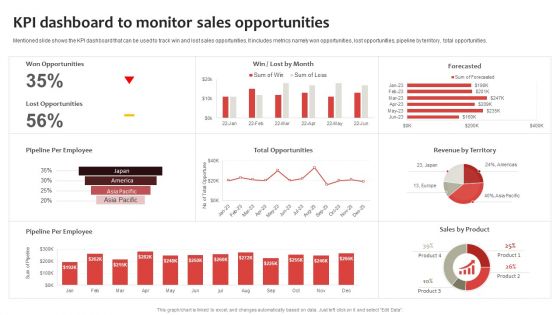
Strategic Plan To Establish And Promote Brand Awareness Kpi Dashboard To Monitor Sales Opportunities Background PDF
Mentioned slide shows the KPI dashboard that can be used to track win and lost sales opportunities. It includes metrics namely won opportunities, lost opportunities, pipeline by territory, total opportunities. Get a simple yet stunning designed Strategic Plan To Establish And Promote Brand Awareness Kpi Dashboard To Monitor Sales Opportunities Background PDF. It is the best one to establish the tone in your meetings. It is an excellent way to make your presentations highly effective. So, download this PPT today from Slidegeeks and see the positive impacts. Our easy to edit Strategic Plan To Establish And Promote Brand Awareness Kpi Dashboard To Monitor Sales Opportunities Background PDF can be your go to option for all upcoming conferences and meetings. So, what are you waiting for Grab this template today.
Secure Access Service Edge Performance Tracking Dashboard Ppt Inspiration Show PDF
This slide demonstrates the performance tracking dashboard for secure access service edge. The purpose of this slide is to showcase the overall performance of the SASE model, including connections, critical network alarms, critical security alerts, application volume, risky applications, and unblocked security threats. Get a simple yet stunning designed Secure Access Service Edge Performance Tracking Dashboard Ppt Inspiration Show PDF. It is the best one to establish the tone in your meetings. It is an excellent way to make your presentations highly effective. So, download this PPT today from Slidegeeks and see the positive impacts. Our easy to edit Secure Access Service Edge Performance Tracking Dashboard Ppt Inspiration Show PDF can be your go to option for all upcoming conferences and meetings. So, what are you waiting for Grab this template today.
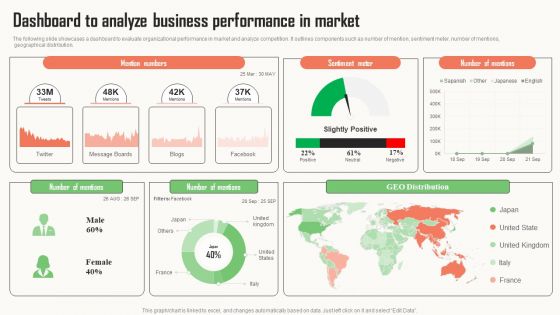
Strategic Market Insight Implementation Guide Dashboard To Analyze Business Performance In Market Slides PDF
The following slide showcases a dashboard to evaluate organizational performance in market and analyze competition. It outlines components such as number of mention, sentiment meter, number of mentions, geographical distribution. Get a simple yet stunning designed Strategic Market Insight Implementation Guide Dashboard To Analyze Business Performance In Market Slides PDF. It is the best one to establish the tone in your meetings. It is an excellent way to make your presentations highly effective. So, download this PPT today from Slidegeeks and see the positive impacts. Our easy to edit Strategic Market Insight Implementation Guide Dashboard To Analyze Business Performance In Market Slides PDF can be your go to option for all upcoming conferences and meetings. So, what are you waiting for Grab this template today.
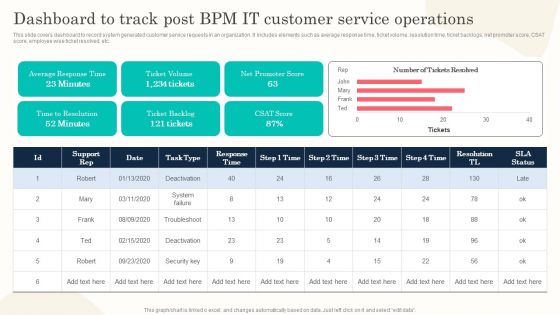
Dashboard To Track Post BPM It Customer Service Operations Introduction PDF
This slide covers dashboard to record system generated customer service requests in an organization. It includes elements such as average response time, ticket volume, resolution time, ticket backlogs, net promoter score, CSAT score, employee wise ticket resolved, etc. Get a simple yet stunning designed Dashboard To Track Post BPM It Customer Service Operations Introduction PDF. It is the best one to establish the tone in your meetings. It is an excellent way to make your presentations highly effective. So, download this PPT today from Slidegeeks and see the positive impacts. Our easy to edit Dashboard To Track Post BPM It Customer Service Operations Introduction PDF can be your go to option for all upcoming conferences and meetings. So, what are you waiting for Grab this template today.
Experiential Shopping Outlet Overview Tracking Essential Retail Store Activities Dashboard Professional PDF
This slide provides details regarding the dashboard for tracking retail store activities in terms of sales, conversion rate, traffic, average transaction value, etc. Whether you have daily or monthly meetings, a brilliant presentation is necessary. Experiential Shopping Outlet Overview Tracking Essential Retail Store Activities Dashboard Professional PDF can be your best option for delivering a presentation. Represent everything in detail using Experiential Shopping Outlet Overview Tracking Essential Retail Store Activities Dashboard Professional PDF and make yourself stand out in meetings. The template is versatile and follows a structure that will cater to your requirements. All the templates prepared by Slidegeeks are easy to download and edit. Our research experts have taken care of the corporate themes as well. So, give it a try and see the results.
Online Marketing Analytics To Enhance Business Growth Kpi Dashboard For Tracking SEO Analytics Themes PDF
This slide covers the KPI dashboard for analyzing SEO metrics such as authority score, organic traffic, organic keywords, paid keywords, ref. Domains, site audit, link-building tool, organic traffic, on-page SEO checker, backlink audit, etc. Get a simple yet stunning designed Online Marketing Analytics To Enhance Business Growth Kpi Dashboard For Tracking SEO Analytics Themes PDF. It is the best one to establish the tone in your meetings. It is an excellent way to make your presentations highly effective. So, download this PPT today from Slidegeeks and see the positive impacts. Our easy to edit Online Marketing Analytics To Enhance Business Growth Kpi Dashboard For Tracking SEO Analytics Themes PDF can be your go to option for all upcoming conferences and meetings. So, what are you waiting for Grab this template today.
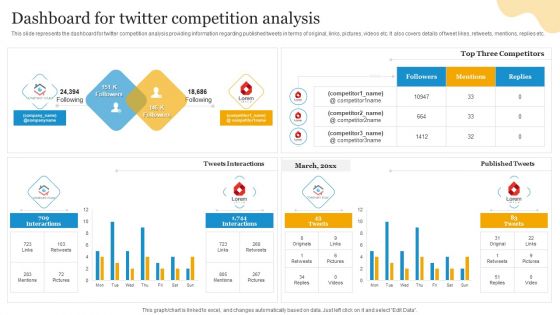
Social Media Advertising Through Twitter Dashboard For Twitter Competition Analysis Designs PDF
This slide represents the dashboard for twitter competition analysis providing information regarding published tweets in terms of original, links, pictures, videos etc. It also covers details of tweet likes, retweets, mentions, replies etc. Get a simple yet stunning designed Social Media Advertising Through Twitter Dashboard For Twitter Competition Analysis Designs PDF. It is the best one to establish the tone in your meetings. It is an excellent way to make your presentations highly effective. So, download this PPT today from Slidegeeks and see the positive impacts. Our easy to edit Social Media Advertising Through Twitter Dashboard For Twitter Competition Analysis Designs PDF can be your go to option for all upcoming conferences and meetings. So, what are you waiting for Grab this template today.
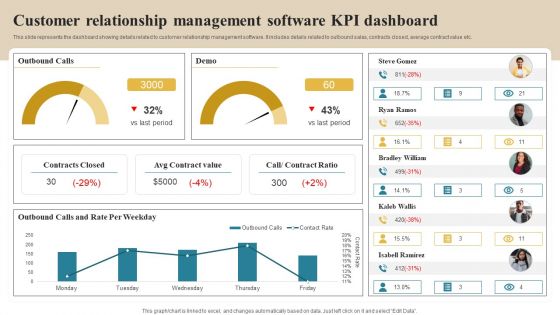
Software Implementation Technique Customer Relationship Management Software KPI Dashboard Designs PDF
This slide represents the dashboard showing details related to customer relationship management software. It includes details related to outbound sales, contracts closed, average contract value etc. Get a simple yet stunning designed Software Implementation Technique Customer Relationship Management Software KPI Dashboard Designs PDF. It is the best one to establish the tone in your meetings. It is an excellent way to make your presentations highly effective. So, download this PPT today from Slidegeeks and see the positive impacts. Our easy to edit Software Implementation Technique Customer Relationship Management Software KPI Dashboard Designs PDF can be your go to option for all upcoming conferences and meetings. So, what are you waiting for Grab this template today.
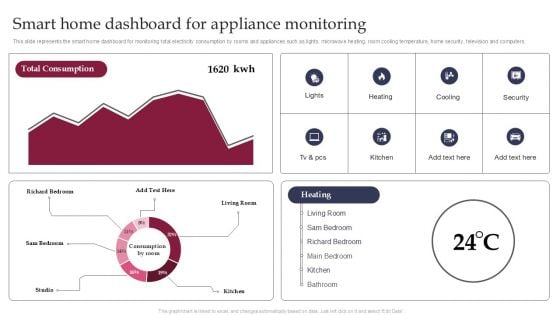
Smart Grid Technology Smart Home Dashboard For Appliance Monitoring Summary PDF
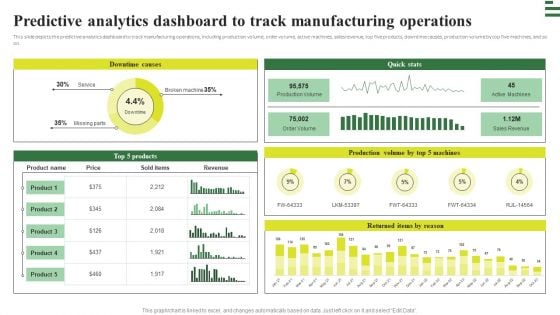
Transforming Manufacturing With Automation Predictive Analytics Dashboard To Track Diagrams PDF
This slide depicts the predictive analytics dashboard to track manufacturing operations, including production volume, order volume, active machines, sales revenue, top five products, downtime causes, production volume by top five machines, and so on. Get a simple yet stunning designed Transforming Manufacturing With Automation Predictive Analytics Dashboard To Track Diagrams PDF. It is the best one to establish the tone in your meetings. It is an excellent way to make your presentations highly effective. So, download this PPT today from Slidegeeks and see the positive impacts. Our easy to edit Transforming Manufacturing With Automation Predictive Analytics Dashboard To Track Diagrams PDF can be your go to option for all upcoming conferences and meetings. So, what are you waiting for Grab this template today.
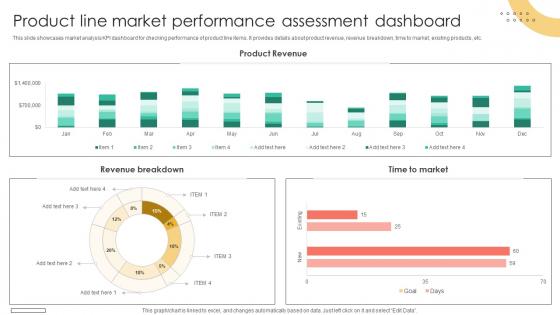
Brand Extension Techniques Product Line Market Performance Assessment Dashboard Strategy SS V
This slide showcases market analysis KPI dashboard for checking performance of product line items. It provides details about product revenue, revenue breakdown, time to market, existing products, etc. This Brand Extension Techniques Product Line Market Performance Assessment Dashboard Strategy SS V from Slidegeeks makes it easy to present information on your topic with precision. It provides customization options, so you can make changes to the colors, design, graphics, or any other component to create a unique layout. It is also available for immediate download, so you can begin using it right away. Slidegeeks has done good research to ensure that you have everything you need to make your presentation stand out. Make a name out there for a brilliant performance. This slide showcases market analysis KPI dashboard for checking performance of product line items. It provides details about product revenue, revenue breakdown, time to market, existing products, etc.
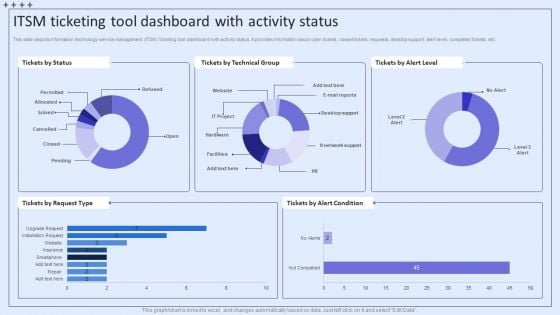
Integrating ITSM To Enhance Service Itsm Ticketing Tool Dashboard With Activity Status Microsoft PDF
This slide depicts information technology service management ITSM ticketing tool dashboard with activity status. It provides information about open tickets, closed tickets, requests, desktop support, alert level, completed tickets, etc. Crafting an eye-catching presentation has never been more straightforward. Let your presentation shine with this tasteful yet straightforward Integrating ITSM To Enhance Service Itsm Ticketing Tool Dashboard With Activity Status Microsoft PDF template. It offers a minimalistic and classy look that is great for making a statement. The colors have been employed intelligently to add a bit of playfulness while still remaining professional. Construct the ideal Integrating ITSM To Enhance Service Itsm Ticketing Tool Dashboard With Activity Status Microsoft PDF that effortlessly grabs the attention of your audience Begin now and be certain to wow your customers.
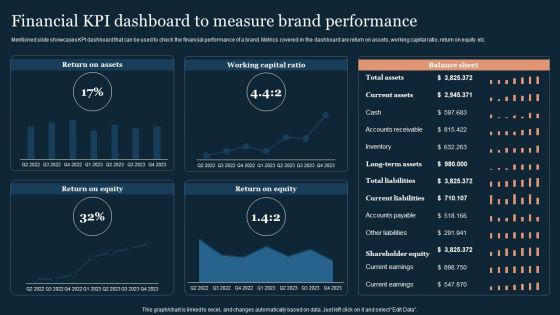
Guide To Develop And Estimate Brand Value Financial KPI Dashboard To Measure Brand Performance Formats PDF
Mentioned slide showcases KPI dashboard that can be used to check the financial performance of a brand. Metrics covered in the dashboard are return on assets, working capital ratio, return on equity etc.Coming up with a presentation necessitates that the majority of the effort goes into the content and the message you intend to convey. The visuals of a PowerPoint presentation can only be effective if it supplements and supports the story that is being told. Keeping this in mind our experts created Guide To Develop And Estimate Brand Value Financial KPI Dashboard To Measure Brand Performance Formats PDF to reduce the time that goes into designing the presentation. This way, you can concentrate on the message while our designers take care of providing you with the right template for the situation.
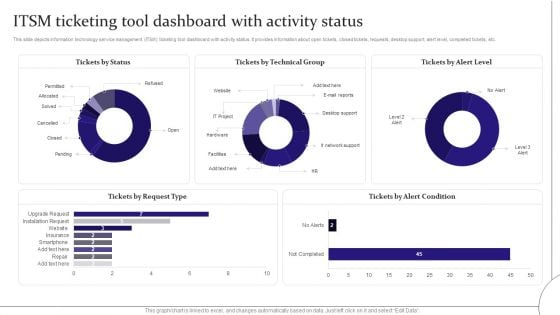
Digitalization Of Service Desk ITSM Ticketing Tool Dashboard With Activity Status Ppt Inspiration Model PDF
This slide depicts information technology service management ITSM ticketing tool dashboard with activity status. It provides information about open tickets, closed tickets, requests, desktop support, alert level, completed tickets, etc. Crafting an eye-catching presentation has never been more straightforward. Let your presentation shine with this tasteful yet straightforward Digitalization Of Service Desk ITSM Ticketing Tool Dashboard With Activity Status Ppt Inspiration Model PDF template. It offers a minimalistic and classy look that is great for making a statement. The colors have been employed intelligently to add a bit of playfulness while still remaining professional. Construct the ideal Digitalization Of Service Desk ITSM Ticketing Tool Dashboard With Activity Status Ppt Inspiration Model PDF that effortlessly grabs the attention of your audience Begin now and be certain to wow your customers.
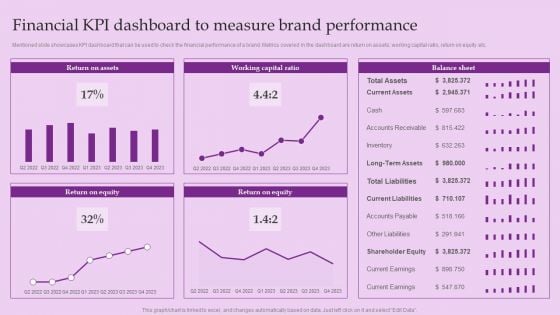
Financial KPI Dashboard To Measure Brand Performance Brand And Equity Evaluation Techniques Elements PDF
Mentioned slide showcases KPI dashboard that can be used to check the financial performance of a brand. Metrics covered in the dashboard are return on assets, working capital ratio, return on equity etc.Coming up with a presentation necessitates that the majority of the effort goes into the content and the message you intend to convey. The visuals of a PowerPoint presentation can only be effective if it supplements and supports the story that is being told. Keeping this in mind our experts created Financial KPI Dashboard To Measure Brand Performance Brand And Equity Evaluation Techniques Elements PDF to reduce the time that goes into designing the presentation. This way, you can concentrate on the message while our designers take care of providing you with the right template for the situation.
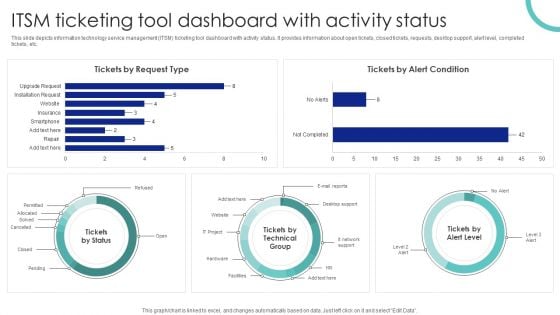
ITSM Ticketing Tool Dashboard With Activity Status Ppt PowerPoint Presentation File Diagrams PDF
This slide depicts information technology service management ITSM ticketing tool dashboard with activity status. It provides information about open tickets, closed tickets, requests, desktop support, alert level, completed tickets, etc. Crafting an eye catching presentation has never been more straightforward. Let your presentation shine with this tasteful yet straightforward ITSM Ticketing Tool Dashboard With Activity Status Ppt PowerPoint Presentation File Diagrams PDF template. It offers a minimalistic and classy look that is great for making a statement. The colors have been employed intelligently to add a bit of playfulness while still remaining professional. Construct the ideal ITSM Ticketing Tool Dashboard With Activity Status Ppt PowerPoint Presentation File Diagrams PDF that effortlessly grabs the attention of your audience Begin now and be certain to wow your customers.
Performance Tracking Dashboard For 5G Architecture 5G Network Structure Diagrams PDF
This slide describes the performance tracking dashboard for 5G architecture by covering the details of subscribers, quality of experience, consumption, customer support, coverage, devices, and dimensions.Explore a selection of the finest Performance Tracking Dashboard For 5G Architecture 5G Network Structure Diagrams PDF here. With a plethora of professionally designed and pre-made slide templates, you can quickly and easily find the right one for your upcoming presentation. You can use our Performance Tracking Dashboard For 5G Architecture 5G Network Structure Diagrams PDF to effectively convey your message to a wider audience. Slidegeeks has done a lot of research before preparing these presentation templates. The content can be personalized and the slides are highly editable. Grab templates today from Slidegeeks.
5G Network Operations Performance Tracking Dashboard For 5G Architecture Demonstration PDF
This slide describes the performance tracking dashboard for 5G architecture by covering the details of subscribers, quality of experience, consumption, customer support, coverage, devices, and dimensions. Are you searching for a 5G Network Operations Performance Tracking Dashboard For 5G Architecture Demonstration PDF that is uncluttered, straightforward, and original. Its easy to edit, and you can change the colors to suit your personal or business branding. For a presentation that expresses how much effort youve put in, this template is ideal With all of its features, including tables, diagrams, statistics, and lists, its perfect for a business plan presentation. Make your ideas more appealing with these professional slides. Download 5G Network Operations Performance Tracking Dashboard For 5G Architecture Demonstration PDF from Slidegeeks today.
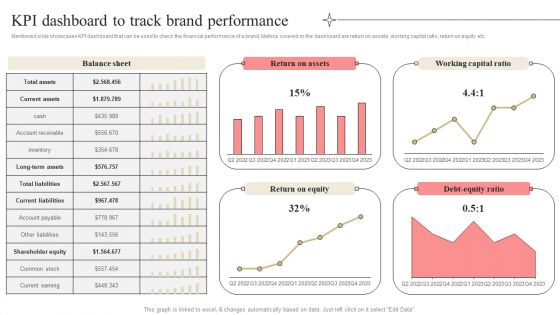
Developing Market Leading Businesses KPI Dashboard To Track Brand Performance Summary PDF
Mentioned slide showcases KPI dashboard that can be used to check the financial performance of a brand. Metrics covered in the dashboard are return on assets, working capital ratio, return on equity etc. Coming up with a presentation necessitates that the majority of the effort goes into the content and the message you intend to convey. The visuals of a PowerPoint presentation can only be effective if it supplements and supports the story that is being told. Keeping this in mind our experts created Developing Market Leading Businesses KPI Dashboard To Track Brand Performance Summary PDF to reduce the time that goes into designing the presentation. This way, you can concentrate on the message while our designers take care of providing you with the right template for the situation.
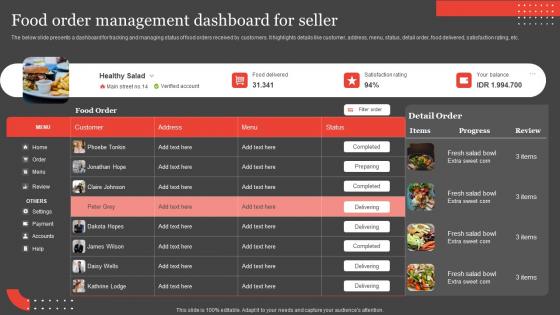
International Food Delivery Market Food Order Management Dashboard For Seller Graphics Pdf
The below slide presents a dashboard for tracking and managing status of food orders received by customers. It highlights details like customer, address, menu, status, detail order, food delivered, satisfaction rating, etc. Coming up with a presentation necessitates that the majority of the effort goes into the content and the message you intend to convey. The visuals of a PowerPoint presentation can only be effective if it supplements and supports the story that is being told. Keeping this in mind our experts created International Food Delivery Market Food Order Management Dashboard For Seller Graphics Pdf to reduce the time that goes into designing the presentation. This way, you can concentrate on the message while our designers take care of providing you with the right template for the situation. The below slide presents a dashboard for tracking and managing status of food orders received by customers. It highlights details like customer, address, menu, status, detail order, food delivered, satisfaction rating, etc.
Online Customer Interaction Dashboard For Tracking Customer Service Team Performance Infographics PDF
This slide covers the KPI dashboard for analyzing the performance of client support department. It includes metrics such as first call resolution, unresolved calls, average response rate, the best day to call, average time to solve issues, etc. Deliver and pitch your topic in the best possible manner with this Online Customer Interaction Dashboard For Tracking Customer Service Team Performance Infographics PDF. Use them to share invaluable insights on Response Time, Issue Solving, Call Resolution and impress your audience. This template can be altered and modified as per your expectations. So, grab it now.
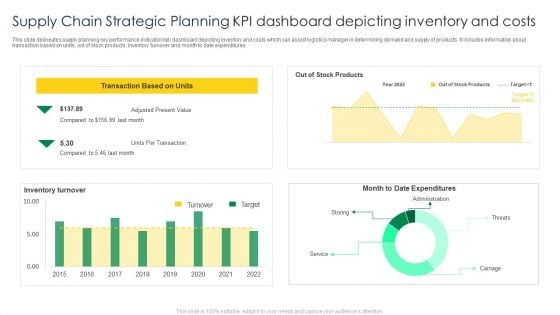
Supply Chain Strategic Planning KPI Dashboard Depicting Inventory And Costs Template PDF
This slide delineates supply planning key performance indicator kpi dashboard depicting inventory and costs which can assist logistics manager in determining demand and supply of products. It includes information about transaction based on units, out of stock products, inventory turnover and month to date expenditures. Showcasing this set of slides titled Supply Chain Strategic Planning KPI Dashboard Depicting Inventory And Costs Template PDF. The topics addressed in these templates are Transaction Based Units, 2016 To 2022. All the content presented in this PPT design is completely editable. Download it and make adjustments in color, background, font etc. as per your unique business setting.
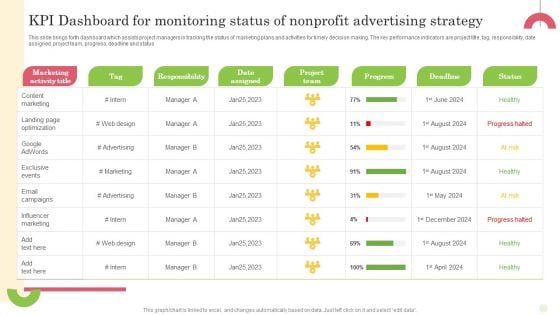
Kpi Dashboard For Monitoring Status Of Nonprofit Advertising Strategy Portrait PDF
This slide brings forth dashboard which assists project managers in tracking the status of marketing plans and activities for timely decision making. The key performance indicators are project title, tag, responsibility, date assigned, project team, progress, deadline and status Pitch your topic with ease and precision using this Kpi Dashboard For Monitoring Status Of Nonprofit Advertising Strategy Portrait PDF. This layout presents information on Tag, Responsibility, Date Assigned. It is also available for immediate download and adjustment. So, changes can be made in the color, design, graphics or any other component to create a unique layout.
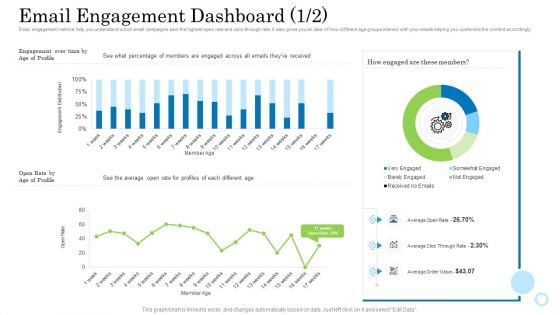
Customer Behavioral Data And Analytics Email Engagement Dashboard Rate Designs PDF
Email engagement metrics help you understand which email campaigns saw the highest open rate and click-through rate. It also gives you an idea of how different age groups interact with your emails helping you customize the content accordingly. Deliver an awe inspiring pitch with this creative customer behavioral data and analytics email engagement dashboard rate designs pdf bundle. Topics like email engagement dashboard can be discussed with this completely editable template. It is available for immediate download depending on the needs and requirements of the user.
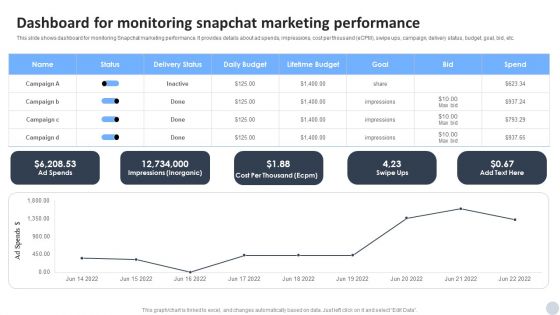
Social Media Marketing Strategies To Generate Lead Dashboard For Monitoring Snapchat Marketing Performance Infographics PDF
This slide shows dashboard for monitoring Snapchat marketing performance. It provides details about ad spends, impressions, cost per thousand eCPM, swipe ups, campaign, delivery status, budget, goal, bid, etc. Create an editable Social Media Marketing Strategies To Generate Lead Dashboard For Monitoring Snapchat Marketing Performance Infographics PDF that communicates your idea and engages your audience. Whether you are presenting a business or an educational presentation, pre designed presentation templates help save time. Social Media Marketing Strategies To Generate Lead Dashboard For Monitoring Snapchat Marketing Performance Infographics PDF is highly customizable and very easy to edit, covering many different styles from creative to business presentations. Slidegeeks has creative team members who have crafted amazing templates. So, go and get them without any delay.
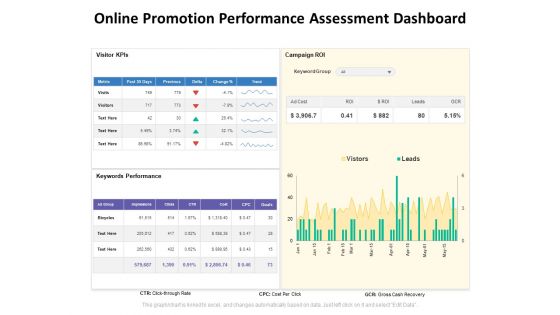
Online Promotion Performance Assessment Dashboard Ppt PowerPoint Presentation Inspiration Aids PDF
Presenting this set of slides with name online promotion performance assessment dashboard ppt powerpoint presentation inspiration aids pdf. The topics discussed in these slides are visitor kpis, keywords performance, campaign roi, leads. This is a completely editable PowerPoint presentation and is available for immediate download. Download now and impress your audience.
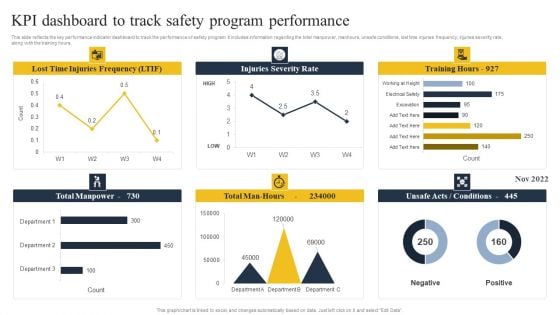
Security Control Techniques For Real Estate Project KPI Dashboard To Track Safety Program Performance Brochure PDF
This slide reflects the key performance indicator dashboard to track the performance of safety program. It includes information regarding the total manpower, manhours, unsafe conditions, lost time injuries frequency, injuries severity rate, along with the training hours. Create an editable Security Control Techniques For Real Estate Project KPI Dashboard To Track Safety Program Performance Brochure PDF that communicates your idea and engages your audience. Whether youre presenting a business or an educational presentation, pre-designed presentation templates help save time. Security Control Techniques For Real Estate Project KPI Dashboard To Track Safety Program Performance Brochure PDF is highly customizable and very easy to edit, covering many different styles from creative to business presentations. Slidegeeks has creative team members who have crafted amazing templates. So, go and get them without any delay.
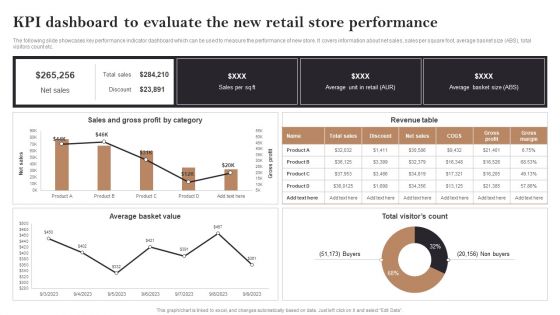
Kpi Dashboard To Evaluate The New Retail Store Performance Opening Retail Store In Untapped Download PDF
The following slide showcases key performance indicator dashboard which can be used to measure the performance of new store. It covers information about net sales, sales per square foot, average basket size ABS, total visitors count etc.Create an editable Kpi Dashboard To Evaluate The New Retail Store Performance Opening Retail Store In Untapped Download PDF that communicates your idea and engages your audience. Whether you are presenting a business or an educational presentation, pre-designed presentation templates help save time. Kpi Dashboard To Evaluate The New Retail Store Performance Opening Retail Store In Untapped Download PDF is highly customizable and very easy to edit, covering many different styles from creative to business presentations. Slidegeeks has creative team members who have crafted amazing templates. So, go and get them without any delay.
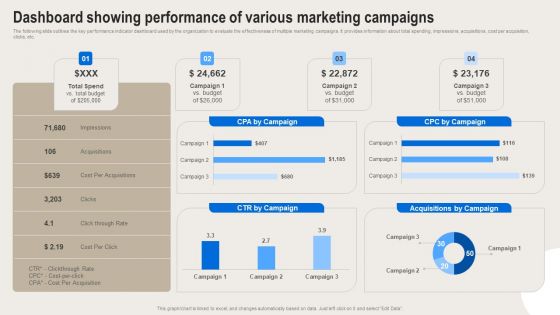
Formulating Branding Strategy To Enhance Revenue And Sales Dashboard Showing Performance Of Various Graphics PDF
The following slide outlines the key performance indicator dashboard used by the organization to evaluate the effectiveness of multiple marketing campaigns. It provides information about total spending, impressions, acquisitions, cost per acquisition, clicks, etc. Create an editable Formulating Branding Strategy To Enhance Revenue And Sales Dashboard Showing Performance Of Various Graphics PDF that communicates your idea and engages your audience. Whether youre presenting a business or an educational presentation, pre designed presentation templates help save time. Formulating Branding Strategy To Enhance Revenue And Sales Dashboard Showing Performance Of Various Graphics PDF is highly customizable and very easy to edit, covering many different styles from creative to business presentations. Slidegeeks has creative team members who have crafted amazing templates. So, go and get them without any delay.
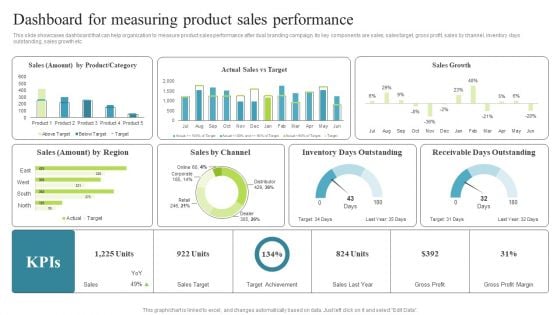
Dashboard For Measuring Product Sales Performance Multi Brand Promotion Campaign For Customer Engagement Professional PDF
This slide showcases dashboard that can help organization to measure product sales performance after dual branding campaign. Its key components are sales, sales target, gross profit, sales by channel, inventory days outstanding, sales growth etc From laying roadmaps to briefing everything in detail, our templates are perfect for you. You can set the stage with your presentation slides. All you have to do is download these easy to edit and customizable templates. Dashboard For Measuring Product Sales Performance Multi Brand Promotion Campaign For Customer Engagement Professional PDF will help you deliver an outstanding performance that everyone would remember and praise you for. Do download this presentation today.
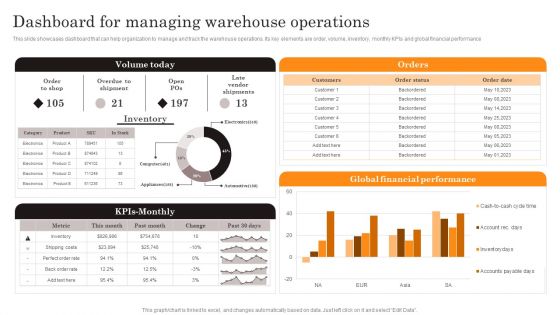
Procurement Strategies For Reducing Stock Wastage Dashboard For Managing Warehouse Infographics PDF
This slide showcases dashboard that can help organization to manage and track the warehouse operations. Its key elements are order, volume, inventory, monthly KPIs and global financial performance. Here you can discover an assortment of the finest PowerPoint and Google Slides templates. With these templates, you can create presentations for a variety of purposes while simultaneously providing your audience with an eye catching visual experience. Download Procurement Strategies For Reducing Stock Wastage Dashboard For Managing Warehouse Infographics PDF to deliver an impeccable presentation. These templates will make your job of preparing presentations much quicker, yet still, maintain a high level of quality. Slidegeeks has experienced researchers who prepare these templates and write high quality content for you. Later on, you can personalize the content by editing the Procurement Strategies For Reducing Stock Wastage Dashboard For Managing Warehouse Infographics PDF.
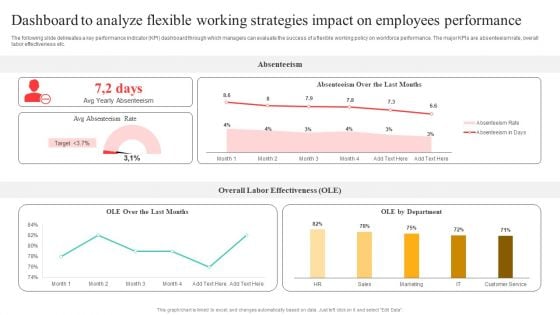
Flexible Working Policies And Guidelines Dashboard To Analyze Flexible Working Strategies Information PDF
The following slide delineates a key performance indicator KPI dashboard through which managers can evaluate the success of a flexible working policy on workforce performance. The major KPIs are absenteeism rate, overall labor effectiveness etc. Create an editable Flexible Working Policies And Guidelines Dashboard To Analyze Flexible Working Strategies Information PDF that communicates your idea and engages your audience. Whether youre presenting a business or an educational presentation, pre designed presentation templates help save time. Flexible Working Policies And Guidelines Dashboard To Analyze Flexible Working Strategies Information PDF is highly customizable and very easy to edit, covering many different styles from creative to business presentations. Slidegeeks has creative team members who have crafted amazing templates. So, go and get them without any delay.
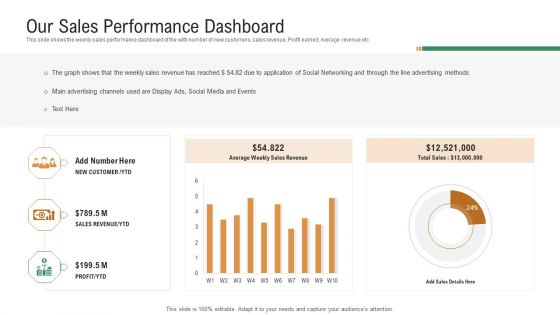
Investor Pitch Deck To Generate Venture Capital Funds Our Sales Performance Dashboard Ppt Show Format PDF
This slide shows the weekly sales performance dashboard of the with number of new customers, sales revenue, Profit earned, Average revenue etc. Deliver and pitch your topic in the best possible manner with this investor pitch deck to generate venture capital funds our sales performance dashboard ppt show format pdf. Use them to share invaluable insights on sales revenue, profit, main advertising channels, social networking, advertising methods and impress your audience. This template can be altered and modified as per your expectations. So, grab it now.
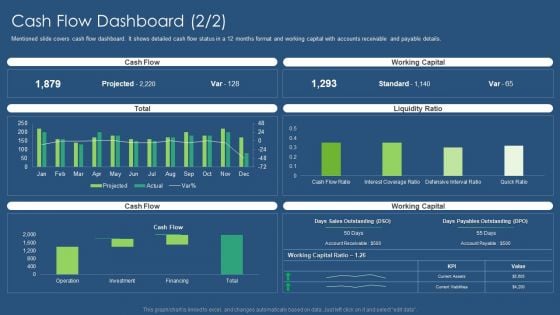
Sustainability Calculation With KPI Cash Flow Dashboard Liquidity Ratio Inspiration PDF Introduction PDF
Following slide covers cash flow dashboard covering details like beginning cash on hand, cash going in, cash going out, profit loss and ending cash on hand. It also includes detail of accounts receivable and payable. Deliver an awe inspiring pitch with this creative sustainability calculation with kpi cash flow dashboard cash designs pdf bundle. Topics like beginning cash on hand, cash going out, profit and loss, ending cash on hand can be discussed with this completely editable template. It is available for immediate download depending on the needs and requirements of the user.
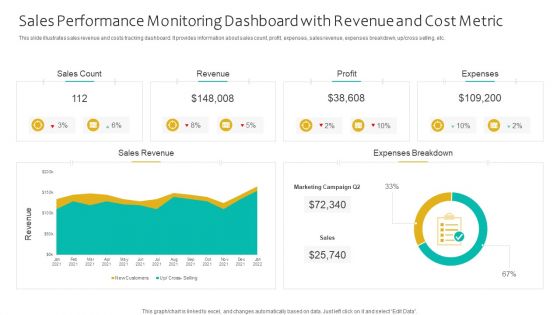
Sales Performance Monitoring Dashboard With Revenue And Cost Metric Ppt Portfolio Good PDF
This slide illustrates sales revenue and costs tracking dashboard. It provides information about sales count, profit, expenses, sales revenue, expenses breakdown, up or cross selling, etc. Showcasing this set of slides titled Sales Performance Monitoring Dashboard With Revenue And Cost Metric Ppt Portfolio Good PDF. The topics addressed in these templates are Sales Count, Revenue, Profit, Expenses. All the content presented in this PPT design is completely editable. Download it and make adjustments in color, background, font etc. as per your unique business setting.
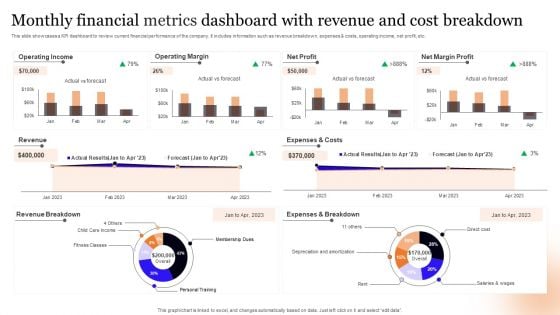
Monthly Financial Metrics Dashboard With Revenue And Cost Breakdown Information PDF
This slide showcases a KPI dashboard to review current financial performance of the company. It includes information such as revenue breakdown, expenses and costs, operating income, net profit, etc. Pitch your topic with ease and precision using this Monthly Financial Metrics Dashboard With Revenue And Cost Breakdown Information PDF. This layout presents information on Operating Income, Operating Margin, Net Profit. It is also available for immediate download and adjustment. So, changes can be made in the color, design, graphics or any other component to create a unique layout.
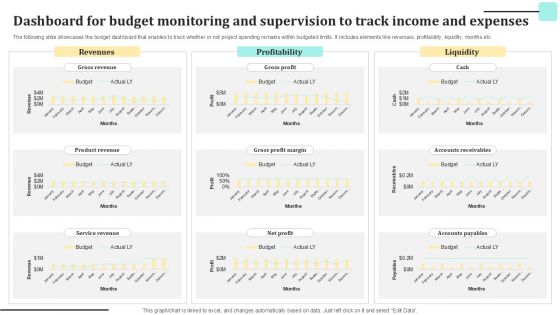
Dashboard For Budget Monitoring And Supervision To Track Income And Expenses Guidelines PDF
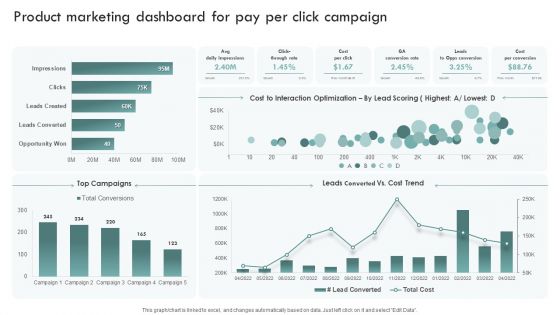
Brand Awareness Plan Product Marketing Dashboard For Pay Per Click Campaign Template PDF
This graph or chart is linked to excel, and changes automatically based on data. Just left click on it and select Edit Data. Get a simple yet stunning designed Brand Awareness Plan Product Marketing Dashboard For Pay Per Click Campaign Template PDF. It is the best one to establish the tone in your meetings. It is an excellent way to make your presentations highly effective. So, download this PPT today from Slidegeeks and see the positive impacts. Our easy-to-edit Brand Awareness Plan Product Marketing Dashboard For Pay Per Click Campaign Template PDF can be your go-to option for all upcoming conferences and meetings. So, what are you waiting for Grab this template today.
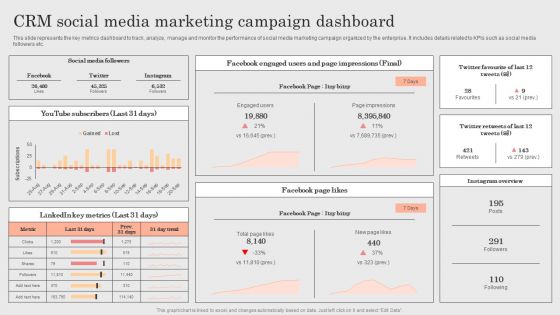
Integrating CRM Solution To Acquire Potential Customers CRM Social Media Marketing Campaign Dashboard Template PDF
This slide represents the key metrics dashboard to track, analyze, manage and monitor the performance of social media marketing campaign organized by the enterprise. It includes details related to KPIs such as social media followers etc. Formulating a presentation can take up a lot of effort and time, so the content and message should always be the primary focus. The visuals of the PowerPoint can enhance the presenters message, so our Integrating CRM Solution To Acquire Potential Customers CRM Social Media Marketing Campaign Dashboard Template PDF was created to help save time. Instead of worrying about the design, the presenter can concentrate on the message while our designers work on creating the ideal templates for whatever situation is needed. Slidegeeks has experts for everything from amazing designs to valuable content, we have put everything into Integrating CRM Solution To Acquire Potential Customers CRM Social Media Marketing Campaign Dashboard Template PDF
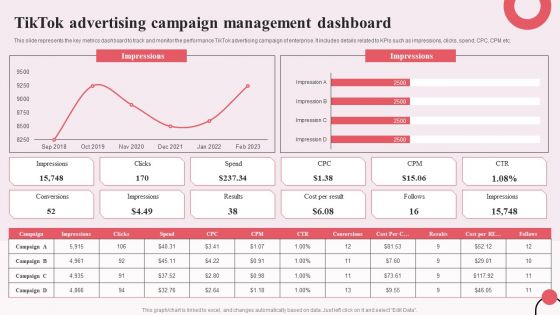
Tiktok Digital Marketing Campaign Tiktok Advertising Campaign Management Dashboard Designs PDF
This slide represents the key metrics dashboard to track and monitor the performance TikTok advertising campaign of enterprise. It includes details related to KPIs such as impressions, clicks, spend, CPC, CPM etc. Formulating a presentation can take up a lot of effort and time, so the content and message should always be the primary focus. The visuals of the PowerPoint can enhance the presenters message, so our Tiktok Digital Marketing Campaign Tiktok Advertising Campaign Management Dashboard Designs PDF was created to help save time. Instead of worrying about the design, the presenter can concentrate on the message while our designers work on creating the ideal templates for whatever situation is needed. Slidegeeks has experts for everything from amazing designs to valuable content, we have put everything into Tiktok Digital Marketing Campaign Tiktok Advertising Campaign Management Dashboard Designs PDF
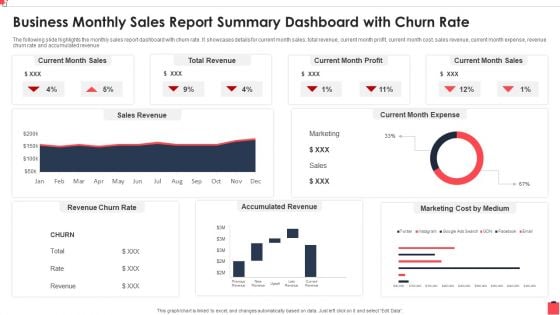
Business Monthly Sales Report Summary Dashboard With Churn Rate Background PDF
The following slide highlights the monthly sales report dashboard with churn rate. It showcases details for current month sales, total revenue, current month profit, current month cost, sales revenue, current month expense, revenue churn rate and accumulated revenue.Pitch your topic with ease and precision using this Business Monthly Sales Report Summary Dashboard With Churn Rate Background PDF This layout presents information on Total Revenue, Accumulated Revenue, Marketing Medium It is also available for immediate download and adjustment. So, changes can be made in the color, design, graphics or any other component to create a unique layout.
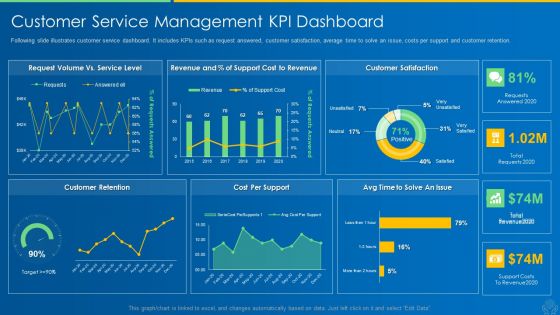
AI And ML Driving Monetary Value For Organization Customer Service Management Kpi Dashboard Formats PDF
Following slide illustrates customer service dashboard. It includes KPIs such as request answered, customer satisfaction, average time to solve an issue, costs per support and customer retention. Deliver and pitch your topic in the best possible manner with this ai and ml driving monetary value for organization customer service management kpi dashboard formats pdf. Use them to share invaluable insights on customer retention, cost per support, customer satisfaction, cost to revenue and impress your audience. This template can be altered and modified as per your expectations. So, grab it now.
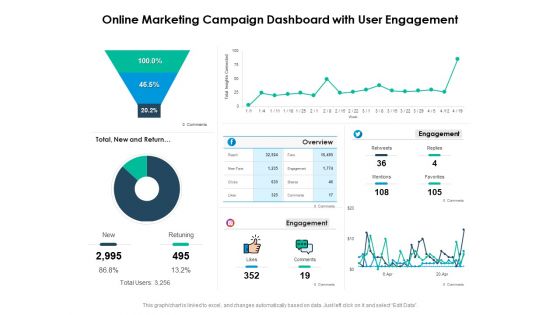
Online Marketing Campaign Dashboard With User Engagement Ppt PowerPoint Presentation Portfolio Aids PDF
Presenting this set of slides with name online marketing campaign dashboard with user engagement ppt powerpoint presentation portfolio aids pdf. The topics discussed in these slides are engagement, overview, retuning, total, new and return. This is a completely editable PowerPoint presentation and is available for immediate download. Download now and impress your audience.
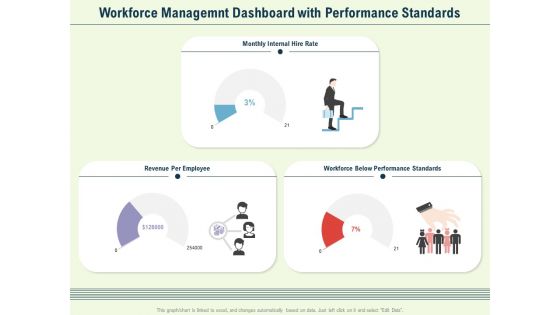
Workforce Managemnt Dashboard With Performance Standards Ppt PowerPoint Presentation Visual Aids Ideas PDF
Presenting this set of slides with name workforce management dashboard with performance standards ppt powerpoint presentation visual aids ideas pdf. The topics discussed in these slides are monthly internal hire rate, revenue per employee, workforce below performance standards. This is a completely editable PowerPoint presentation and is available for immediate download. Download now and impress your audience.
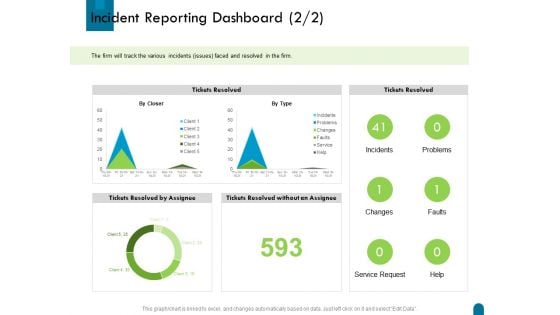
Crisis Management Incident Reporting Dashboard Faults Ppt Gallery Visual Aids PDF
Deliver an awe-inspiring pitch with this creative crisis management incident reporting dashboard faults ppt gallery visual aids pdf bundle. Topics like tickets resolved, tickets resolved by assignee, tickets resolved without an assignee can be discussed with this completely editable template. It is available for immediate download depending on the needs and requirements of the user.
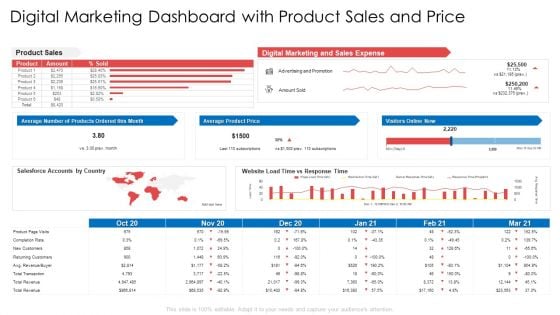
Digital Marketing Dashboard With Product Sales And Price Ppt Gallery Visual Aids PDF
Deliver an awe inspiring pitch with this creative digital marketing dashboard with product sales and price ppt gallery visual aids pdf bundle. Topics like average product price, average number of products ordered this month, digital marketing and sales expense, product sales can be discussed with this completely editable template. It is available for immediate download depending on the needs and requirements of the user.
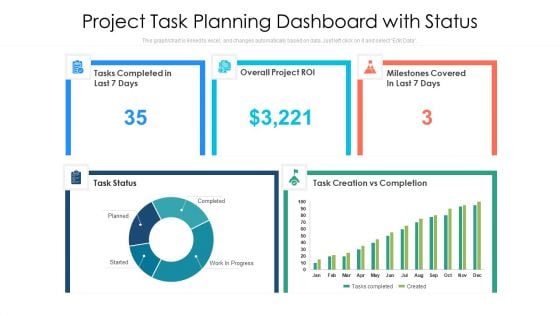
Project Task Planning Dashboard With Status Ppt PowerPoint Presentation Gallery Visual Aids PDF
Pitch your topic with ease and precision using this project task planning dashboard with status ppt powerpoint presentation gallery visual aids pdf. This layout presents information on task creation vs completion, milestones covered, overall project. It is also available for immediate download and adjustment. So, changes can be made in the color, design, graphics or any other component to create a unique layout.
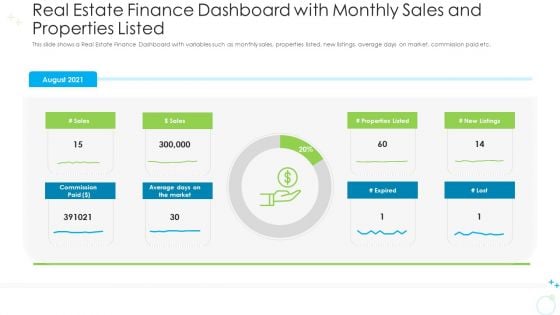
Real Estate Finance Dashboard With Monthly Sales And Properties Listed Ppt Gallery Visual Aids Pdf
Deliver and pitch your topic in the best possible manner with this real estate finance dashboard with monthly sales and properties listed ppt gallery visual aids pdf. Use them to share invaluable insights on average, market, sales and impress your audience. This template can be altered and modified as per your expectations. So, grab it now.
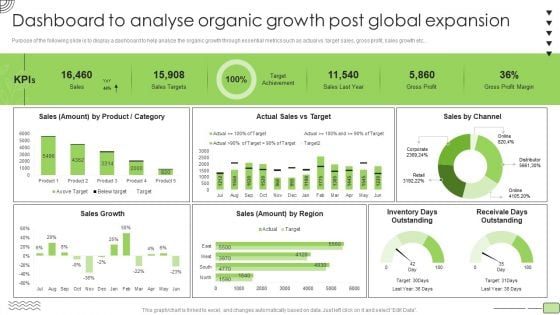
Organic Business Growth Strategies Dashboard To Analyse Organic Growth Post Global Expansion Background PDF
Purpose of the following slide is to display a dashboard to help analyze the organic growth through essential metrics such as actual vs. target sales, gross profit, sales growth etc. Deliver and pitch your topic in the best possible manner with this Organic Business Growth Strategies Dashboard To Analyse Organic Growth Post Global Expansion Background PDF. Use them to share invaluable insights on Sales, Product, Target and impress your audience. This template can be altered and modified as per your expectations. So, grab it now.
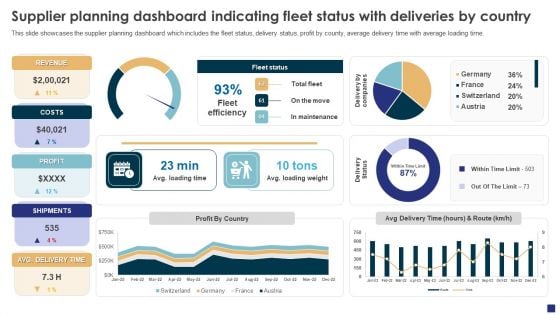
Comprehensive Guide To Ecommerce Supplier Planning Dashboard Indicating Fleet Status Mockup PDF
This slide showcases the supplier planning dashboard which includes the fleet status, delivery status, profit by county, average delivery time with average loading time. Want to ace your presentation in front of a live audience Our Comprehensive Guide To Ecommerce Supplier Planning Dashboard Indicating Fleet Status Mockup PDF can help you do that by engaging all the users towards you.. Slidegeeks experts have put their efforts and expertise into creating these impeccable powerpoint presentations so that you can communicate your ideas clearly. Moreover, all the templates are customizable, and easy-to-edit and downloadable. Use these for both personal and commercial use.
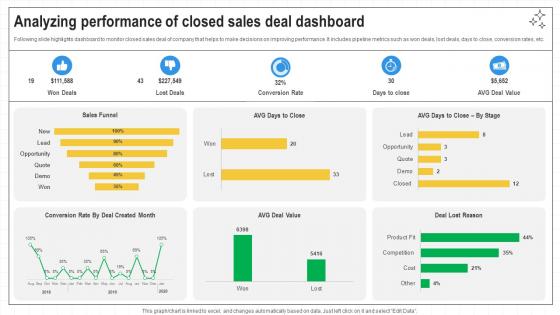
Closing Techniques To Seal Analyzing Performance Of Closed Sales Deal Dashboard SA SS V
Following slide highlights dashboard to monitor closed sales deal of company that helps to make decisions on improving performance. It includes pipeline metrics such as won deals, lost deals, days to close, conversion rates, etc. Want to ace your presentation in front of a live audience Our Closing Techniques To Seal Analyzing Performance Of Closed Sales Deal Dashboard SA SS V can help you do that by engaging all the users towards you. Slidegeeks experts have put their efforts and expertise into creating these impeccable powerpoint presentations so that you can communicate your ideas clearly. Moreover, all the templates are customizable, and easy-to-edit and downloadable. Use these for both personal and commercial use. Following slide highlights dashboard to monitor closed sales deal of company that helps to make decisions on improving performance. It includes pipeline metrics such as won deals, lost deals, days to close, conversion rates, etc.


 Continue with Email

 Home
Home


