Benefits Dashboard
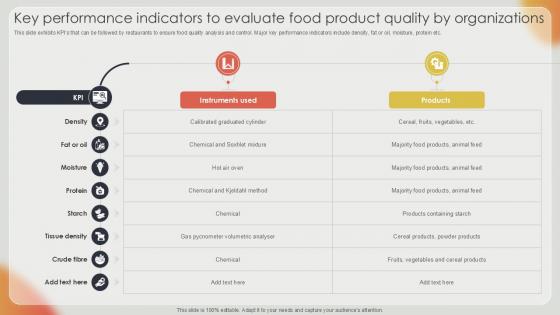
Key Performance Indicators To Effective Strategies For Strengthening Food Ppt Template
This slide exhibits KPIs that can be followed by restaurants to ensure food quality analysis and control. Major key performance indicators include density, fat or oil, moisture, protein etc. Coming up with a presentation necessitates that the majority of the effort goes into the content and the message you intend to convey. The visuals of a PowerPoint presentation can only be effective if it supplements and supports the story that is being told. Keeping this in mind our experts created Key Performance Indicators To Effective Strategies For Strengthening Food Ppt Template to reduce the time that goes into designing the presentation. This way, you can concentrate on the message while our designers take care of providing you with the right template for the situation. This slide exhibits KPIs that can be followed by restaurants to ensure food quality analysis and control. Major key performance indicators include density, fat or oil, moisture, protein etc.
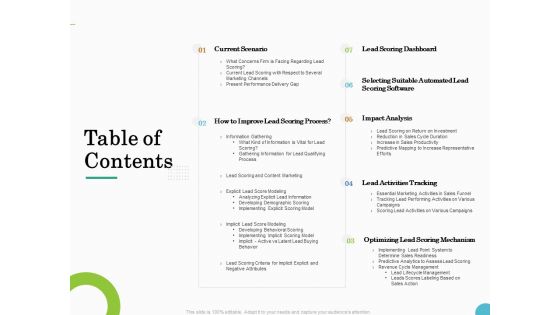
Lead Ranking Sales Methodology Model Table Of Contents Ppt PowerPoint Presentation Visual Aids Diagrams PDF
Presenting this set of slides with name lead ranking sales methodology model table of contents ppt powerpoint presentation visual aids diagrams pdf. The topics discussed in these slides are current scenario, improve lead scoring process, lead scoring dashboard, selecting suitable automated lead scoring software, impact analysis, lead activities tracking, optimizing lead scoring mechanism. This is a completely editable PowerPoint presentation and is available for immediate download. Download now and impress your audience.

Table Of Contents For Construction Project Playbook Contd Ppt Outline Aids PDF
This is a table of contents for construction project playbook contd ppt outline aids pdf template with various stages. Focus and dispense information on four stages using this creative set, that comes with editable features. It contains large content boxes to add your information on topics like ensuring workforce safety, construction team, cost management, dashboard. You can also showcase facts, figures, and other relevant content using this PPT layout. Grab it now.
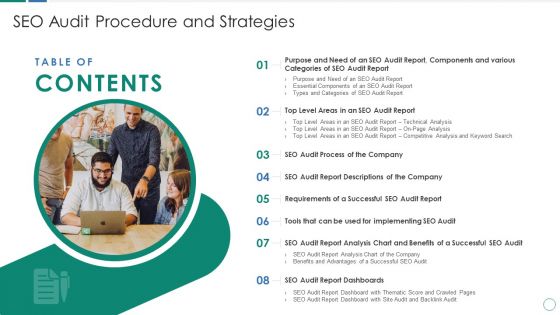
Table Of Contents SEO Audit Procedure And Strategies Ppt Infographics Visual Aids PDF
This is a Table Of Contents SEO Audit Procedure And Strategies Ppt Infographics Visual Aids PDF template with various stages. Focus and dispense information on eight stages using this creative set, that comes with editable features. It contains large content boxes to add your information on topics like SEO Audit Process, SEO Audit Report, Successful SEO Audit Report, SEO Audit Report Dashboards. You can also showcase facts, figures, and other relevant content using this PPT layout. Grab it now.
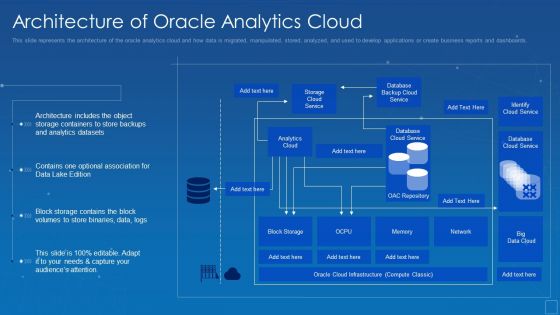
Oracle Cloud Data Analytics Administration IT Architecture Of Oracle Analytics Cloud Microsoft PDF
This slide represents the architecture of the oracle analytics cloud and how data is migrated, manipulated, stored, analyzed, and used to develop applications or create business reports and dashboards. Deliver an awe inspiring pitch with this creative oracle cloud data analytics administration it architecture of oracle analytics cloud microsoft pdf bundle. Topics like datasets, analytics, architecture, containers, association, optional can be discussed with this completely editable template. It is available for immediate download depending on the needs and requirements of the user.
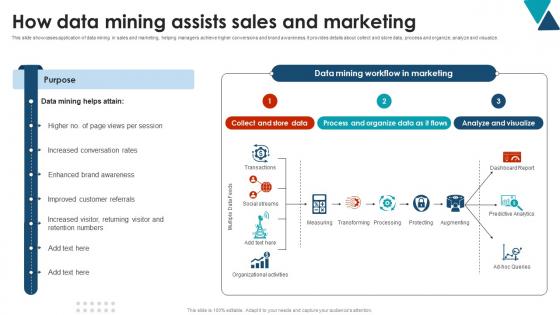
How Data Mining Assists Sales And Marketing Using Data Mining Tools To Optimize Processes AI SS V
This slide showcases application of data mining in sales and marketing, helping managers achieve higher conversions and brand awareness. It provides details about collect and store data, process and organize, analyze and visualize. This How Data Mining Assists Sales And Marketing Using Data Mining Tools To Optimize Processes AI SS V from Slidegeeks makes it easy to present information on your topic with precision. It provides customization options, so you can make changes to the colors, design, graphics, or any other component to create a unique layout. It is also available for immediate download, so you can begin using it right away. Slidegeeks has done good research to ensure that you have everything you need to make your presentation stand out. Make a name out there for a brilliant performance. This slide showcases application of data mining in sales and marketing, helping managers achieve higher conversions and brand awareness. It provides details about collect and store data, process and organize, analyze and visualize.
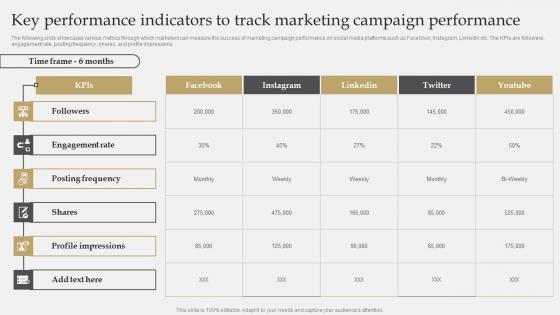
IT Industry Market Research Key Performance Indicators To Track Marketing Campaign Rules Pdf
The following slide showcases various metrics through which marketers can measure the success of marketing campaign performance on social media platforms such as Facebook, Instagram, LinkedIn etc. The KPIs are followers, engagement rate, posting frequency, shares, and profile impressions. Whether you have daily or monthly meetings, a brilliant presentation is necessary. IT Industry Market Research Key Performance Indicators To Track Marketing Campaign Rules Pdf can be your best option for delivering a presentation. Represent everything in detail using IT Industry Market Research Key Performance Indicators To Track Marketing Campaign Rules Pdf and make yourself stand out in meetings. The template is versatile and follows a structure that will cater to your requirements. All the templates prepared by Slidegeeks are easy to download and edit. Our research experts have taken care of the corporate themes as well. So, give it a try and see the results. The following slide showcases various metrics through which marketers can measure the success of marketing campaign performance on social media platforms such as Facebook, Instagram, LinkedIn etc. The KPIs are followers, engagement rate, posting frequency, shares, and profile impressions.

Ethical Hacking Training Options Ppt Professional Gallery PDF
This slide represents the ethical hacking training options including online bootcamp and corporate training and their prices options, availability of support and date of the class. This is a ethical hacking training options ppt professional gallery pdf template with various stages. Focus and dispense information on two stages using this creative set, that comes with editable features. It contains large content boxes to add your information on topics like management, system, enterprises, pricing, dashboards. You can also showcase facts, figures, and other relevant content using this PPT layout. Grab it now.
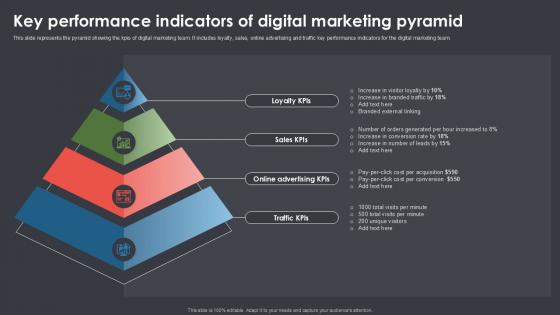
Key Performance Indicators Of Digital Marketing Pyramid Ppt Presentation SS
The following slide showcases green business management with triple bottom line method. It provides information about people, planet, profits, ambitions, commitments, enablers, etc Welcome to our selection of the Key Performance Indicators Of Digital Marketing Pyramid Ppt Presentation SS These are designed to help you showcase your creativity and bring your sphere to life. Planning and Innovation are essential for any business that is just starting out. This collection contains the designs that you need for your everyday presentations. All of our PowerPoints are 100Percent editable, so you can customize them to suit your needs. This multi-purpose template can be used in various situations. Grab these presentation templates today. The following slide showcases green business management with triple bottom line method. It provides information about people, planet, profits, ambitions, commitments, enablers, etc
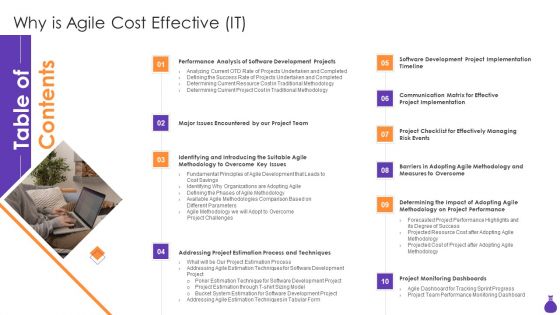
Table Of Contents Why Is Agile Cost Effective IT Wd Ppt PowerPoint Presentation File Visual Aids PDF
Presenting Table Of Contents Why Is Agile Cost Effective IT Wd Ppt PowerPoint Presentation File Visual Aids PDF to provide visual cues and insights. Share and navigate important information on ten stages that need your due attention. This template can be used to pitch topics like Addressing Project Estimation, Process And Techniques, Project Monitoring Dashboards, Major Issues Encountered By Our Project Team. In addtion, this PPT design contains high resolution images, graphics, etc, that are easily editable and available for immediate download.
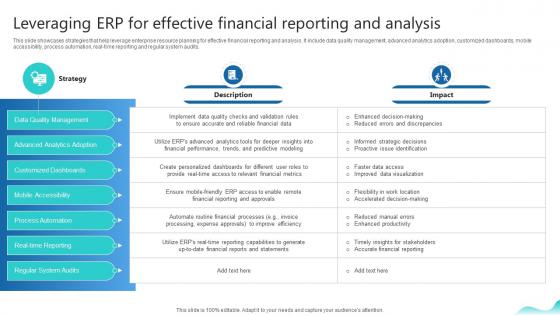
Leveraging Erp For Effective Financial Reporting Erp And Digital Transformation For Maximizing DT SS V
This slide showcases strategies that help leverage enterprise resource planning for effective financial reporting and analysis. It include data quality management, advanced analytics adoption, customized dashboards, mobile accessibility, process automation, real-time reporting and regular system audits.Make sure to capture your audiences attention in your business displays with our gratis customizable Leveraging Erp For Effective Financial Reporting Erp And Digital Transformation For Maximizing DT SS V. These are great for business strategies, office conferences, capital raising or task suggestions. If you desire to acquire more customers for your tech business and ensure they stay satisfied, create your own sales presentation with these plain slides. This slide showcases strategies that help leverage enterprise resource planning for effective financial reporting and analysis. It include data quality management, advanced analytics adoption, customized dashboards, mobile accessibility, process automation, real-time reporting and regular system audits.
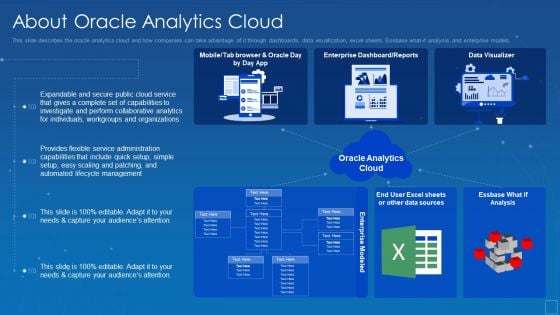
Oracle Cloud Data Analytics Administration IT About Oracle Analytics Cloud Clipart PDF
This slide describes the oracle analytics cloud and how companies can take advantage of it through dashboards, data visualization, excel sheets, Essbase what if analysis, and enterprise models. Deliver and pitch your topic in the best possible manner with this oracle cloud data analytics administration it about oracle analytics cloud clipart pdf. Use them to share invaluable insights on management, lifecycle, capabilities, service, flexible and impress your audience. This template can be altered and modified as per your expectations. So, grab it now.
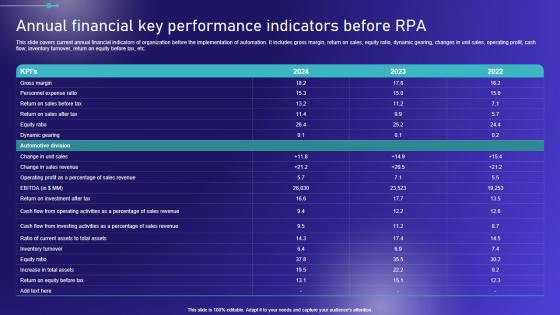
Annual Financial Key Performance Indicators Before Embracing Robotic Process Graphics PDF
This slide covers current annual financial indicators of organization before the implementation of automation. It includes gross margin, return on sales, equity ratio, dynamic gearing, changes in unit sales, operating profit, cash flow, inventory turnover, return on equity before tax, etc. Want to ace your presentation in front of a live audience Our Annual Financial Key Performance Indicators Before Embracing Robotic Process Graphics PDF can help you do that by engaging all the users towards you. Slidegeeks experts have put their efforts and expertise into creating these impeccable powerpoint presentations so that you can communicate your ideas clearly. Moreover, all the templates are customizable, and easy-to-edit and downloadable. Use these for both personal and commercial use. This slide covers current annual financial indicators of organization before the implementation of automation. It includes gross margin, return on sales, equity ratio, dynamic gearing, changes in unit sales, operating profit, cash flow, inventory turnover, return on equity before tax, etc.
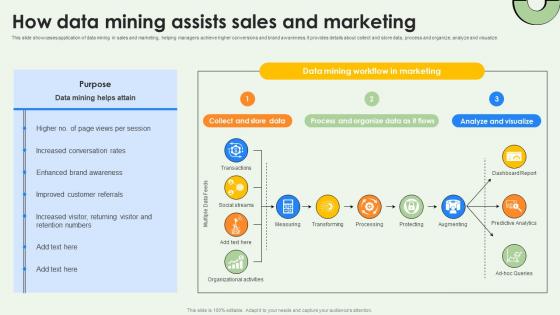
Data Warehousing And How Data Mining Assists Sales And Marketing AI SS V
This slide showcases application of data mining in sales and marketing, helping managers achieve higher conversions and brand awareness. It provides details about collect and store data, process and organize, analyze and visualize. There are so many reasons you need a Data Warehousing And How Data Mining Assists Sales And Marketing AI SS V. The first reason is you can not spend time making everything from scratch, Thus, Slidegeeks has made presentation templates for you too. You can easily download these templates from our website easily. This slide showcases application of data mining in sales and marketing, helping managers achieve higher conversions and brand awareness. It provides details about collect and store data, process and organize, analyze and visualize.
Client Self Service Key Performance Indicators Icons Pdf
The following slide highlights key performance indicators of customer self service to offer enterprises actual and desired cost of support, measure efficiency etc. It includes key performance indicators such as net promoter score, customer effort score, self-service re-contact rate, conversion ratio and case deflection rate. Pitch your topic with ease and precision using this Client Self Service Key Performance Indicators Icons Pdf. This layout presents information on Description, Target, Actual. It is also available for immediate download and adjustment. So, changes can be made in the color, design, graphics or any other component to create a unique layout. The following slide highlights key performance indicators of customer self service to offer enterprises actual and desired cost of support, measure efficiency etc. It includes key performance indicators such as net promoter score, customer effort score, self-service re-contact rate, conversion ratio and case deflection rate.

Diverse Platform Tools For Social Media Data Analytics Cracking The Code Of Social Media
This slide represents diverse tools for social media data analytics. The purpose of this slide is to outline the different tools for social media data analytics such as Facebook page insight, audience insight, account home, tweet activity dashboard, etc Want to ace your presentation in front of a live audience Our Diverse Platform Tools For Social Media Data Analytics Cracking The Code Of Social Media can help you do that by engaging all the users towards you. Slidegeeks experts have put their efforts and expertise into creating these impeccable powerpoint presentations so that you can communicate your ideas clearly. Moreover, all the templates are customizable, and easy-to-edit and downloadable. Use these for both personal and commercial use. This slide represents diverse tools for social media data analytics. The purpose of this slide is to outline the different tools for social media data analytics such as Facebook page insight, audience insight, account home, tweet activity dashboard, etc.
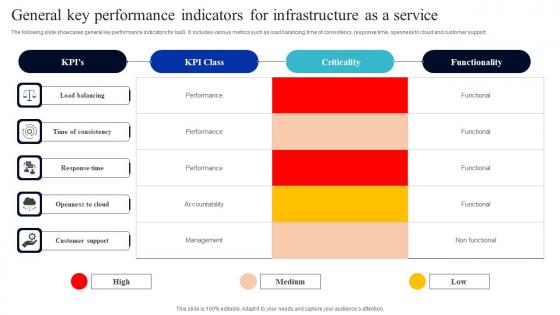
General Key Performance Indicators For Infrastructure As A Service Download Pdf
The following slide showcases general key performance indicators for IaaS. It includes various metrics such as load balancing, time of consistency, response time, openness to cloud and customer support. Pitch your topic with ease and precision using this General Key Performance Indicators For Infrastructure As A Service Download Pdf. This layout presents information on Response Time, Openness To Cloud, Customer Support. It is also available for immediate download and adjustment. So, changes can be made in the color, design, graphics or any other component to create a unique layout. The following slide showcases general key performance indicators for IaaS. It includes various metrics such as load balancing, time of consistency, response time, openness to cloud and customer support.
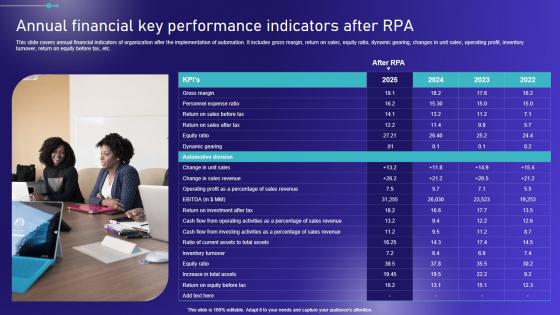
Annual Financial Key Performance Indicators After Embracing Robotic Process Elements PDF
This slide covers annual financial indicators of organization after the implementation of automation. It includes gross margin, return on sales, equity ratio, dynamic gearing, changes in unit sales, operating profit, inventory turnover, return on equity before tax, etc. Slidegeeks is one of the best resources for PowerPoint templates. You can download easily and regulate Annual Financial Key Performance Indicators After Embracing Robotic Process Elements PDF for your personal presentations from our wonderful collection. A few clicks is all it takes to discover and get the most relevant and appropriate templates. Use our Templates to add a unique zing and appeal to your presentation and meetings. All the slides are easy to edit and you can use them even for advertisement purposes. This slide covers annual financial indicators of organization after the implementation of automation. It includes gross margin, return on sales, equity ratio, dynamic gearing, changes in unit sales, operating profit, inventory turnover, return on equity before tax, etc.
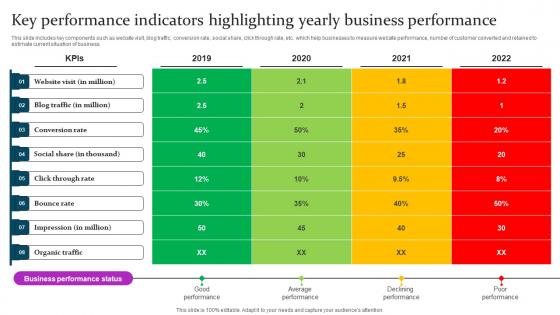
Key Performance Indicators Marketing Mix Communication Guide Client Elements Pdf
This slide includes key components such as website visit, blog traffic, conversion rate, social share, click through rate, etc. which help businesses to measure website performance, number of customer converted and retained to estimate current situation of business. Whether you have daily or monthly meetings, a brilliant presentation is necessary. Key Performance Indicators Marketing Mix Communication Guide Client Elements Pdf can be your best option for delivering a presentation. Represent everything in detail using Key Performance Indicators Marketing Mix Communication Guide Client Elements Pdf and make yourself stand out in meetings. The template is versatile and follows a structure that will cater to your requirements. All the templates prepared by Slidegeeks are easy to download and edit. Our research experts have taken care of the corporate themes as well. So, give it a try and see the results. This slide includes key components such as website visit, blog traffic, conversion rate, social share, click through rate, etc. which help businesses to measure website performance, number of customer converted and retained to estimate current situation of business.
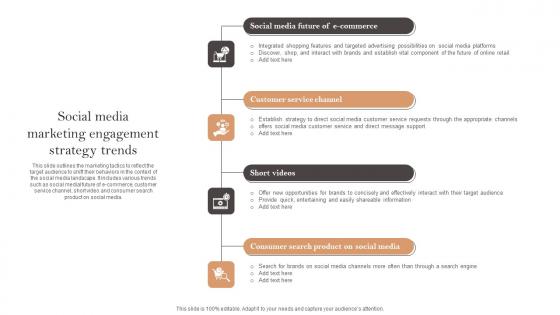
Social Media Marketing Engagement Strategy Trends Ppt Visual Aids Show Pdf
This slide outlines the marketing tactics to reflect the target audience to shift their behaviors in the context of the social media landscape. It includes various trends such as social medial future of e-commerce, customer service channel, short video and consumer search product on social media. Pitch your topic with ease and precision using this Social Media Marketing Engagement Strategy Trends Ppt Visual Aids Show Pdf. This layout presents information on E Commerce, Customer Service Channel, Short Video. It is also available for immediate download and adjustment. So, changes can be made in the color, design, graphics or any other component to create a unique layout. This slide outlines the marketing tactics to reflect the target audience to shift their behaviors in the context of the social media landscape. It includes various trends such as social medial future of e-commerce, customer service channel, short video and consumer search product on social media.
Comparative Analysis Of Key Automl Tools Data Analytics SS V
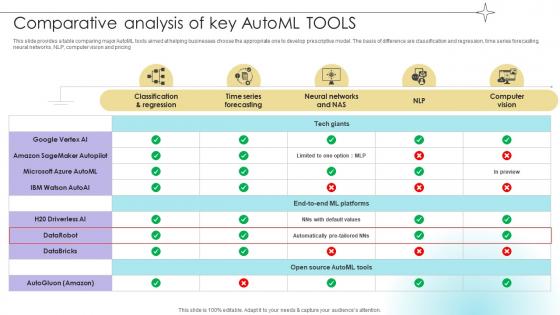
This slide provides a table comparing major AutoML tools aimed at helping businesses choose the appropriate one to develop prescriptive model. The basis of difference are classification and regression, time series forecasting, neural networks, NLP, computer vision and pricing.The Comparative Analysis Of Key Automl Tools Data Analytics SS V is a compilation of the most recent design trends as a series of slides. It is suitable for any subject or industry presentation, containing attractive visuals and photo spots for businesses to clearly express their messages. This template contains a variety of slides for the user to input data, such as structures to contrast two elements, bullet points, and slides for written information. Slidegeeks is prepared to create an impression. This slide provides a table comparing major AutoML tools aimed at helping businesses choose the appropriate one to develop prescriptive model. The basis of difference are classification and regression, time series forecasting, neural networks, NLP, computer vision and pricing.
Essential Cybersecurity Key Performance Indicators Download Pdf
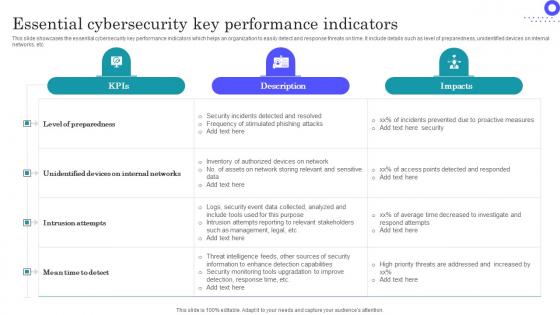
Showcasing this set of slides titled Essential Cybersecurity Key Performance Indicators Download Pdf The topics addressed in these templates are Level Preparedness, Internal Networks, Intrusion Attempts All the content presented in this PPT design is completely editable. Download it and make adjustments in color, background, font etc. as per your unique business setting. This slide showcases the essential cybersecurity key performance indicators which helps an organization to easily detect and response threats on time. It include details such as level of preparedness, unidentified devices on internal networks, etc.

Cybersecurity Key Performance Indicators With Applications Summary Pdf
Pitch your topic with ease and precision using this Cybersecurity Key Performance Indicators With Applications Summary Pdf This layout presents information on Identify Weaknesses, Review Improvement, Security Policies It is also available for immediate download and adjustment. So, changes can be made in the color, design, graphics or any other component to create a unique layout. This slide showcases the cyber security key performance indicators with applications which helps an organization to determine readiness. It include details such as security policies, identify weaknesses, obligation to compliance framework, etc.
Step By Step Process To Conduct Trends Analysis Product Analytics Implementation Data Analytics V
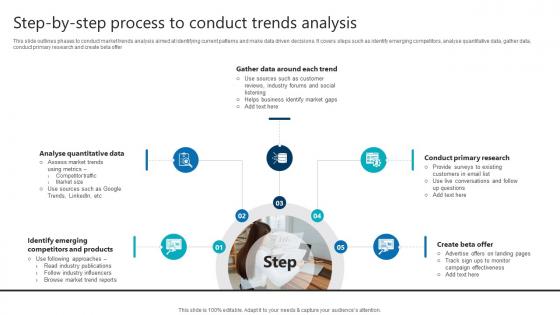
This slide outlines phases to conduct market trends analysis aimed at identifying current patterns and make data driven decisions. It covers steps such as identify emerging competitors, analyse quantitative data, gather data, conduct primary research and create beta offerComing up with a presentation necessitates that the majority of the effort goes into the content and the message you intend to convey. The visuals of a PowerPoint presentation can only be effective if it supplements and supports the story that is being told. Keeping this in mind our experts created Step By Step Process To Conduct Trends Analysis Product Analytics Implementation Data Analytics V to reduce the time that goes into designing the presentation. This way, you can concentrate on the message while our designers take care of providing you with the right template for the situation. This slide outlines phases to conduct market trends analysis aimed at identifying current patterns and make data driven decisions. It covers steps such as identify emerging competitors, analyse quantitative data, gather data, conduct primary research and create beta offer
Key Performance Indicators Deployment Of Marketing Communication Clipart Pdf
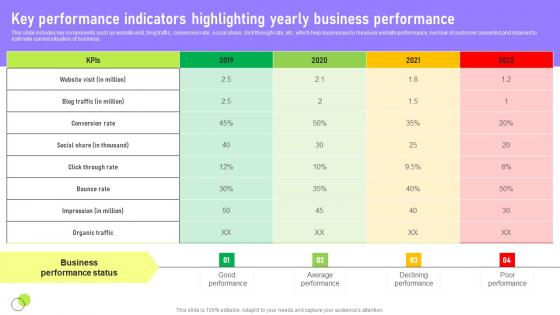
This slide includes key components such as website visit, blog traffic, conversion rate, social share, click through rate, etc. which help businesses to measure website performance, number of customer converted and retained to estimate current situation of business. Are you in need of a template that can accommodate all of your creative concepts This one is crafted professionally and can be altered to fit any style. Use it with Google Slides or PowerPoint. Include striking photographs, symbols, depictions, and other visuals. Fill, move around, or remove text boxes as desired. Test out color palettes and font mixtures. Edit and save your work, or work with colleagues. Download Key Performance Indicators Deployment Of Marketing Communication Clipart Pdf and observe how to make your presentation outstanding. Give an impeccable presentation to your group and make your presentation unforgettable. This slide includes key components such as website visit, blog traffic, conversion rate, social share, click through rate, etc. which help businesses to measure website performance, number of customer converted and retained to estimate current situation of business.
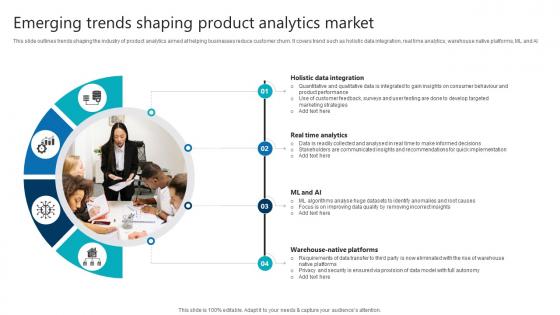
Emerging Trends Shaping Product Analytics Market Product Analytics Implementation Data Analytics V
This slide outlines trends shaping the industry of product analytics aimed at helping businesses reduce customer churn. It covers trend such as holistic data integration, real time analytics, warehouse native platforms, ML and AI Formulating a presentation can take up a lot of effort and time, so the content and message should always be the primary focus. The visuals of the PowerPoint can enhance the presenters message, so our Emerging Trends Shaping Product Analytics Market Product Analytics Implementation Data Analytics V was created to help save time. Instead of worrying about the design, the presenter can concentrate on the message while our designers work on creating the ideal templates for whatever situation is needed. Slidegeeks has experts for everything from amazing designs to valuable content, we have put everything into Emerging Trends Shaping Product Analytics Market Product Analytics Implementation Data Analytics V. This slide outlines trends shaping the industry of product analytics aimed at helping businesses reduce customer churn. It covers trend such as holistic data integration, real time analytics, warehouse native platforms, ML and AI
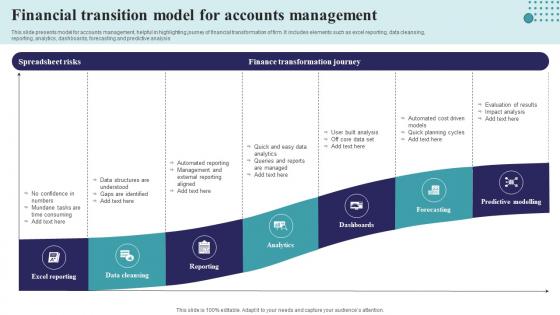
Financial Transition Model For Accounts Management Structure Pdf
This slide presents model for accounts management, helpful in highlighting journey of financial transformation of firm. It includes elements such as excel reporting, data cleansing, reporting, analytics, dashboards, forecasting and predictive analysis Pitch your topic with ease and precision using this Financial Transition Model For Accounts Management Structure Pdf This layout presents information on Excel Reporting, Data Cleansing, Reporting, Analytics It is also available for immediate download and adjustment. So, changes can be made in the color, design, graphics or any other component to create a unique layout. This slide presents model for accounts management, helpful in highlighting journey of financial transformation of firm. It includes elements such as excel reporting, data cleansing, reporting, analytics, dashboards, forecasting and predictive analysis
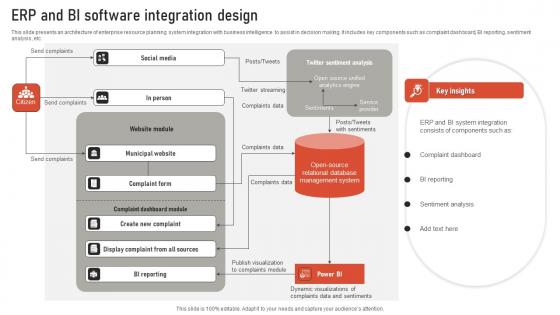
Erpp And BI Software Integration Design Designs Pdf
This slide presents an architecture of enterprise resource planning system integration with business intelligence to assist in decision making. It includes key components such as complaint dashboard, BI reporting, sentiment analysis, etc. Showcasing this set of slides titled Erpp And BI Software Integration Design Designs Pdf. The topics addressed in these templates are Social Media, Management System, Sentiment Analysis. All the content presented in this PPT design is completely editable. Download it and make adjustments in color, background, font etc. as per your unique business setting. This slide presents an architecture of enterprise resource planning system integration with business intelligence to assist in decision making. It includes key components such as complaint dashboard, BI reporting, sentiment analysis, etc.

Global Data Security Industry Report Commonly Used Acronyms In Cybersecurity Industry IR SS V
The slide represents acronyms and terminology used in the cybersecurity industry. The slide aims to help audience better comprehend and navigate industry specific language, allowing for improved communication and comprehension of cybersecurity industry concepts, trends, and discussions. There are so many reasons you need a Global Data Security Industry Report Commonly Used Acronyms In Cybersecurity Industry IR SS V. The first reason is you can not spend time making everything from scratch, Thus, Slidegeeks has made presentation templates for you too. You can easily download these templates from our website easily. The slide represents acronyms and terminology used in the cybersecurity industry. The slide aims to help audience better comprehend and navigate industry specific language, allowing for improved communication and comprehension of cybersecurity industry concepts, trends, and discussions.
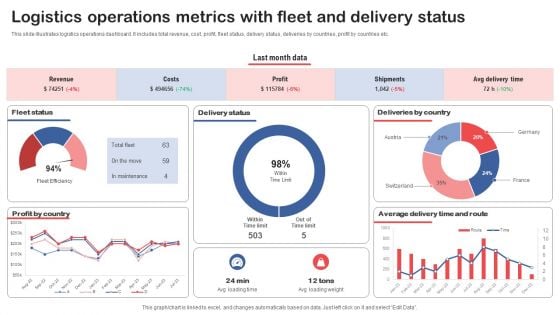
Logistics Operations Metrics With Fleet And Delivery Status Slides PDF
This slide illustrates logistics operations dashboard. It includes total revenue, cost, profit, fleet status, delivery status, deliveries by countries, profit by countries etc. Pitch your topic with ease and precision using this Logistics Operations Metrics With Fleet And Delivery Status Slides PDF. This layout presents information on Fleet Status, Delivery Status, Deliveries By Country. It is also available for immediate download and adjustment. So, changes can be made in the color, design, graphics or any other component to create a unique layout.
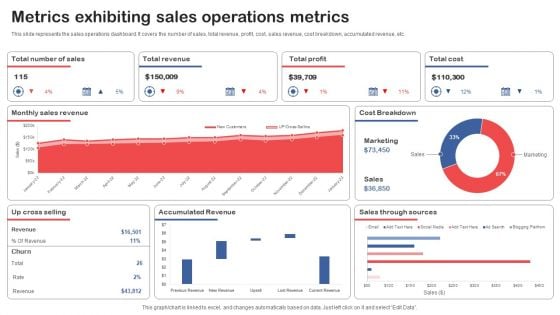
Metrics Exhibiting Sales Operations Metrics Topics PDF
This slide represents the sales operations dashboard. It covers the number of sales, total revenue, profit, cost, sales revenue, cost breakdown, accumulated revenue, etc. Showcasing this set of slides titled Metrics Exhibiting Sales Operations Metrics Topics PDF. The topics addressed in these templates are Total Revenue, Total Profit, Total Cost. All the content presented in this PPT design is completely editable. Download it and make adjustments in color, background, font etc. as per your unique business setting.
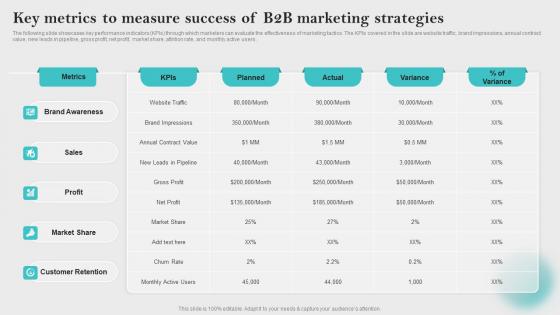
Key Metrics To Measure Success Innovative Business Promotion Ideas Pictures Pdf
The following slide showcases key performance indicators KPIs through which marketers can evaluate the effectiveness of marketing tactics. The KPIs covered in the slide are website traffic, brand impressions, annual contract value, new leads in pipeline, gross profit, net profit, market share, attrition rate, and monthly active users. Slidegeeks has constructed Key Metrics To Measure Success Innovative Business Promotion Ideas Pictures Pdf after conducting extensive research and examination. These presentation templates are constantly being generated and modified based on user preferences and critiques from editors. Here, you will find the most attractive templates for a range of purposes while taking into account ratings and remarks from users regarding the content. This is an excellent jumping off point to explore our content and will give new users an insight into our top notch PowerPoint Templates. The following slide showcases key performance indicators KPIs through which marketers can evaluate the effectiveness of marketing tactics. The KPIs covered in the slide are website traffic, brand impressions, annual contract value, new leads in pipeline, gross profit, net profit, market share, attrition rate, and monthly active users.

HR Analytics Metrics For Data Driven Decision Summary Pdf
This slide illustrates human resource key performance indicators that help organization to analyze actionable insights for taking effective and date driven decision. It includes KPIs such as recruitment, employee engagement, retention and diversity and inclusion.Pitch your topic with ease and precision using this HR Analytics Metrics For Data Driven Decision Summary Pdf This layout presents information on Estimate Accumulated, Involved Recruitment, Provide Actionable Insight It is also available for immediate download and adjustment. So, changes can be made in the color, design, graphics or any other component to create a unique layout. This slide illustrates human resource key performance indicators that help organization to analyze actionable insights for taking effective and date driven decision. It includes KPIs such as recruitment, employee engagement, retention and diversity and inclusion.
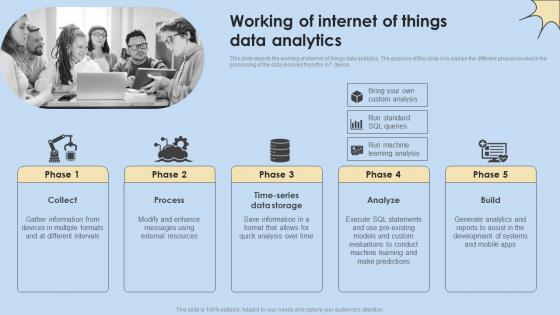
Working Of Internet Of Things Data Analytics Internet Of Things Analysis Professional Pdf
This slide depicts the working of internet of things data analytics. The purpose of this slide is to explain the different phases involve in the processing of the data received from the IoT device. Get a simple yet stunning designed Working Of Internet Of Things Data Analytics Internet Of Things Analysis Professional Pdf. It is the best one to establish the tone in your meetings. It is an excellent way to make your presentations highly effective. So, download this PPT today from Slidegeeks and see the positive impacts. Our easy-to-edit Working Of Internet Of Things Data Analytics Internet Of Things Analysis Professional Pdf can be your go-to option for all upcoming conferences and meetings. So, what are you waiting for Grab this template today. This slide depicts the working of internet of things data analytics. The purpose of this slide is to explain the different phases involve in the processing of the data received from the IoT device.

Overview Optimizing Business Intelligence With Erp Erp And Digital Transformation For Maximizing DT SS V
This slide presents an overview of how transforming ERP helps in optimizing business intelligence. It includes features advanced analytics, customizable dashboards, data integration, predictive analytics, ad hoc reporting, etc.Welcome to our selection of the Overview Optimizing Business Intelligence With Erp Erp And Digital Transformation For Maximizing DT SS V. These are designed to help you showcase your creativity and bring your sphere to life. Planning and Innovation are essential for any business that is just starting out. This collection contains the designs that you need for your everyday presentations. All of our PowerPoints are 100 percent editable, so you can customize them to suit your needs. This multi-purpose template can be used in various situations. Grab these presentation templates today. This slide presents an overview of how transforming ERP helps in optimizing business intelligence. It includes features advanced analytics, customizable dashboards, data integration, predictive analytics, ad hoc reporting, etc.
Business Report Analysis Vector Icon Ppt PowerPoint Presentation Gallery Visual Aids PDF
Presenting business report analysis vector icon ppt powerpoint presentation gallery visual aids pdf to dispense important information. This template comprises three stages. It also presents valuable insights into the topics including business report analysis vector icon. This is a completely customizable PowerPoint theme that can be put to use immediately. So, download it and address the topic impactfully.
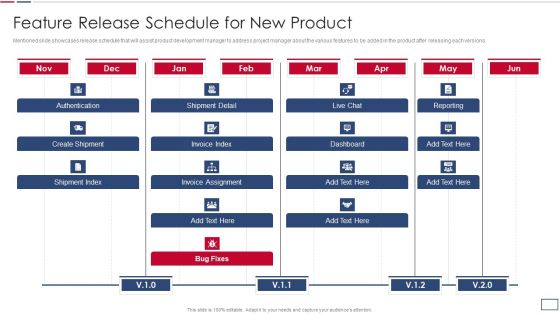
Software Developer Playbook Feature Release Schedule For New Product Slides PDF
Mentioned slide showcases release schedule that will assist product development manager to address project manager about the various features to be added in the product after releasing each versions. Deliver an awe inspiring pitch with this creative software developer playbook feature release schedule for new product slides pdf bundle. Topics like authentication, create shipment, shipment index, invoice assignment, dashboard, reporting can be discussed with this completely editable template. It is available for immediate download depending on the needs and requirements of the user.

Comparative Analysis Of Online Business Simulation Software Inspiration PDF
This slide shows comparative assessment of corporate simulation platforms. It provides information about instructor training, simulations, dashboard, assistance, collaboration, leaderboard, etc. Showcasing this set of slides titled Comparative Analysis Of Online Business Simulation Software Inspiration PDF. The topics addressed in these templates are Simulations Available, Team Collaboration, Pricing Per Month. All the content presented in this PPT design is completely editable. Download it and make adjustments in color, background, font etc. as per your unique business setting.
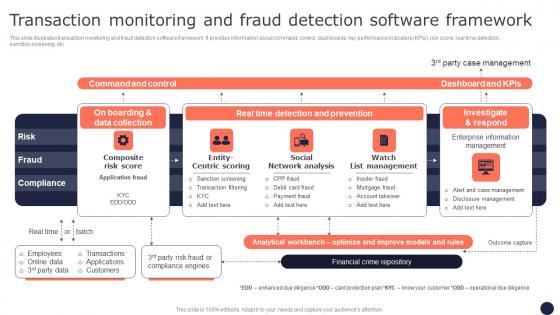
Transaction Monitoring And Fraud Detection Mitigating Corporate Scams And Robberies Clipart Pdf
This slide illustrates transaction monitoring and fraud detection software framework. It provides information about command, control, dashboards, key performance indicators KPIs, risk score, real time detection, sanction screening, etc. Get a simple yet stunning designed Transaction Monitoring And Fraud Detection Mitigating Corporate Scams And Robberies Clipart Pdf. It is the best one to establish the tone in your meetings. It is an excellent way to make your presentations highly effective. So, download this PPT today from Slidegeeks and see the positive impacts. Our easy-to-edit Transaction Monitoring And Fraud Detection Mitigating Corporate Scams And Robberies Clipart Pdf can be your go-to option for all upcoming conferences and meetings. So, what are you waiting for Grab this template today. This slide illustrates transaction monitoring and fraud detection software framework. It provides information about command, control, dashboards, key performance indicators KPIs, risk score, real time detection, sanction screening, etc.
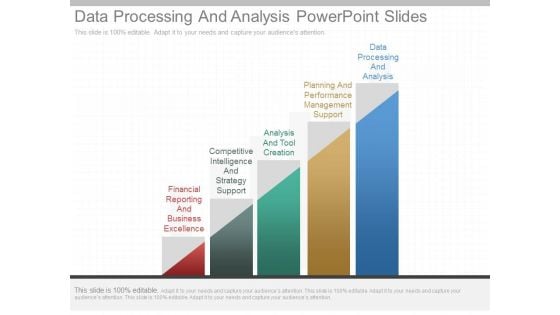
Data Processing And Analysis Powerpoint Slides
This is a data processing and analysis powerpoint slides. This is a five stage process. The stages in this process are financial reporting and business excellence, competitive intelligence and strategy support, analysis and tool creation, planning and performance management support, data processing and analysis.
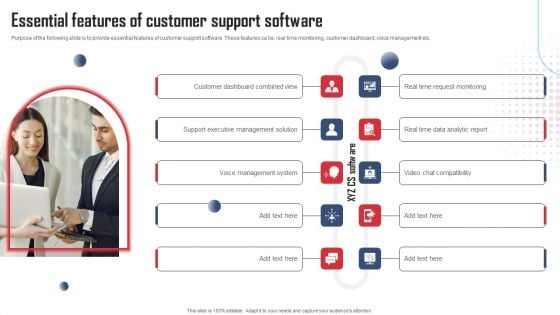
Service Distinctiveness Essential Features Of Customer Support Software Structure PDF
Purpose of the following slide is to provide essential features of customer support software. These features ca be real time monitoring, customer dashboard, voice management etc. Welcome to our selection of the Service Distinctiveness Essential Features Of Customer Support Software Structure PDF. These are designed to help you showcase your creativity and bring your sphere to life. Planning and Innovation are essential for any business that is just starting out. This collection contains the designs that you need for your everyday presentations. All of our PowerPoints are 100 percent editable, so you can customize them to suit your needs. This multi-purpose template can be used in various situations. Grab these presentation templates today.
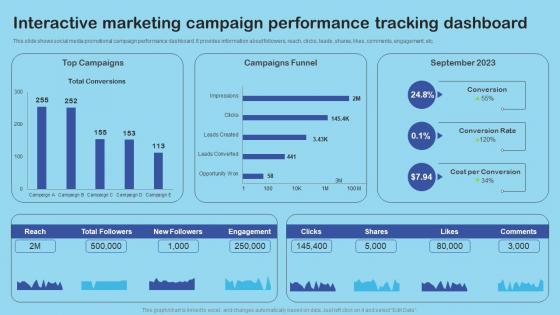
Interactive Marketing Campaign Performance Enhance Client Engagement With Interactive Pictures Pdf
This slide shows social media promotional campaign performance dashboard. It provides information about followers, reach, clicks, leads, shares, likes, comments, engagement, etc. Whether you have daily or monthly meetings, a brilliant presentation is necessary. Interactive Marketing Campaign Performance Enhance Client Engagement With Interactive Pictures Pdf can be your best option for delivering a presentation. Represent everything in detail using Interactive Marketing Campaign Performance Enhance Client Engagement With Interactive Pictures Pdf and make yourself stand out in meetings. The template is versatile and follows a structure that will cater to your requirements. All the templates prepared by Slidegeeks are easy to download and edit. Our research experts have taken care of the corporate themes as well. So, give it a try and see the results. This slide shows social media promotional campaign performance dashboard. It provides information about followers, reach, clicks, leads, shares, likes, comments, engagement, etc.
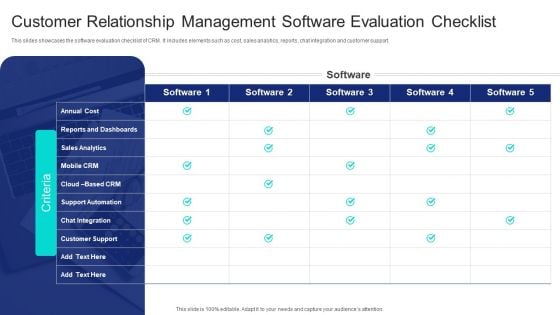
Customer Relationship Management Software Evaluation Checklist Ppt PowerPoint Presentation File Professional PDF
This slides showcases the software evaluation checklist of CRM. It includes elements such as cost, sales analytics, reports, chat integration and customer support. Showcasing this set of slides titled Customer Relationship Management Software Evaluation Checklist Ppt PowerPoint Presentation File Professional PDF. The topics addressed in these templates are Reports And Dashboards, Sales Analytics, Mobile CRM. All the content presented in this PPT design is completely editable. Download it and make adjustments in color, background, font etc. as per your unique business setting.
Key Metrics To Measure Success Digital Marketing Strategies Improve Enterprise Sales Icons Pdf
The following slide showcases key performance indicators KPIs through which marketers can evaluate the effectiveness of marketing tactics. The KPIs covered in the slide are website traffic, brand impressions, annual contract value, new leads in pipeline, gross profit, net profit, market share, attrition rate, and monthly active users. Do you know about Slidesgeeks Key Metrics To Measure Success Digital Marketing Strategies Improve Enterprise Sales Icons Pdf These are perfect for delivering any kind od presentation. Using it, create PowerPoint presentations that communicate your ideas and engage audiences. Save time and effort by using our pre designed presentation templates that are perfect for a wide range of topic. Our vast selection of designs covers a range of styles, from creative to business, and are all highly customizable and easy to edit. Download as a PowerPoint template or use them as Google Slides themes. The following slide showcases key performance indicators KPIs through which marketers can evaluate the effectiveness of marketing tactics. The KPIs covered in the slide are website traffic, brand impressions, annual contract value, new leads in pipeline, gross profit, net profit, market share, attrition rate, and monthly active users.
Achieving Proactive From Reactive Kpis For Human Resource Service Delivery Icons PDF
This slide depicts the KPIs for human resource service delivery with the help of AI and how some of these KPIs will be analyzed automatically through AI. Deliver an awe inspiring pitch with this creative Achieving Proactive From Reactive Kpis For Human Resource Service Delivery Icons PDF bundle. Topics like Dashboard, New Hires, Completed Training Ratio can be discussed with this completely editable template. It is available for immediate download depending on the needs and requirements of the user.
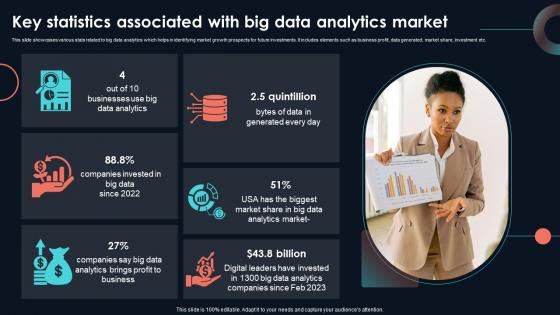
Key Statistics Associated With Big Data Developing Strategic Insights Using Big Data Analytics SS V
This slide showcases various stats related to big data analytics which helps in identifying market growth prospects for future investments. It includes elements such as business profit, data generated, market share, investment etc. If you are looking for a format to display your unique thoughts, then the professionally designed Key Statistics Associated With Big Data Developing Strategic Insights Using Big Data Analytics SS V is the one for you. You can use it as a Google Slides template or a PowerPoint template. Incorporate impressive visuals, symbols, images, and other charts. Modify or reorganize the text boxes as you desire. Experiment with shade schemes and font pairings. Alter, share or cooperate with other people on your work. Download Key Statistics Associated With Big Data Developing Strategic Insights Using Big Data Analytics SS V and find out how to give a successful presentation. Present a perfect display to your team and make your presentation unforgettable. This slide showcases various stats related to big data analytics which helps in identifying market growth prospects for future investments. It includes elements such as business profit, data generated, market share, investment etc.
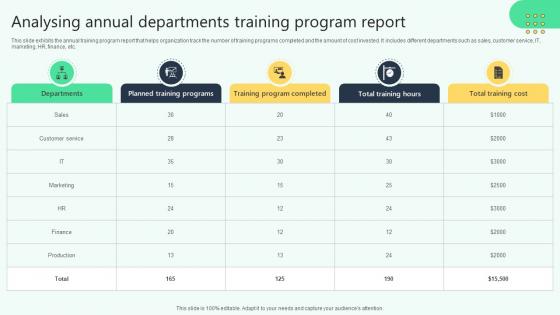
Analysing Annual Departments Training Program Report Analysing Hr Data For Effective Decision Making
This slide exhibits the annual training program report that helps organization track the number of training programs completed and the amount of cost invested. It includes different departments such as sales, customer service, IT, marketing, HR, finance, etc. Slidegeeks is one of the best resources for PowerPoint templates. You can download easily and regulate Analysing Annual Departments Training Program Report Analysing Hr Data For Effective Decision Making for your personal presentations from our wonderful collection. A few clicks is all it takes to discover and get the most relevant and appropriate templates. Use our Templates to add a unique zing and appeal to your presentation and meetings. All the slides are easy to edit and you can use them even for advertisement purposes. This slide exhibits the annual training program report that helps organization track the number of training programs completed and the amount of cost invested. It includes different departments such as sales, customer service, IT, marketing, HR, finance, etc.
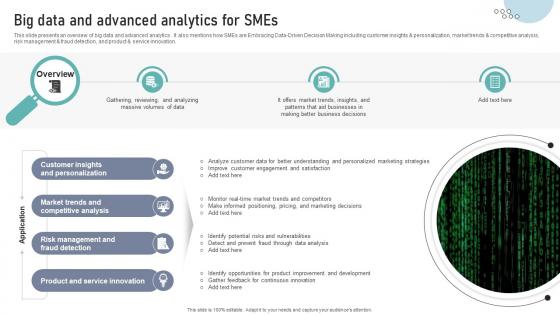
Big Data And Advanced Analytics For SMEs DT SS V
This slide presents an overview of big data and advanced analytics . It also mentions how SMEs are Embracing Data-Driven Decision Making including customer insights and personalization, market trends and competitive analysis, risk management and fraud detection, and product and service innovation.Get a simple yet stunning designed Big Data And Advanced Analytics For SMEs DT SS V. It is the best one to establish the tone in your meetings. It is an excellent way to make your presentations highly effective. So, download this PPT today from Slidegeeks and see the positive impacts. Our easy-to-edit Big Data And Advanced Analytics For SMEs DT SS V can be your go-to option for all upcoming conferences and meetings. So, what are you waiting for Grab this template today. This slide presents an overview of big data and advanced analytics . It also mentions how SMEs are Embracing Data-Driven Decision Making including customer insights and personalization, market trends and competitive analysis, risk management and fraud detection, and product and service innovation.

Adopting Affiliate Marketing Tools With Purpose Comprehensive Guide For Marketing Technology
Following slide provides information about company adopted affiliated marketing software. It includes key elements such as dashboard, conversion tracking, impression tracking, organic tracking, and updated mobile app.Want to ace your presentation in front of a live audience Our Adopting Affiliate Marketing Tools With Purpose Comprehensive Guide For Marketing Technology can help you do that by engaging all the users towards you. Slidegeeks experts have put their efforts and expertise into creating these impeccable powerpoint presentations so that you can communicate your ideas clearly. Moreover, all the templates are customizable, and easy-to-edit and downloadable. Use these for both personal and commercial use. Following slide provides information about company adopted affiliated marketing software. It includes key elements such as dashboard, conversion tracking, impression tracking, organic tracking, and updated mobile app.
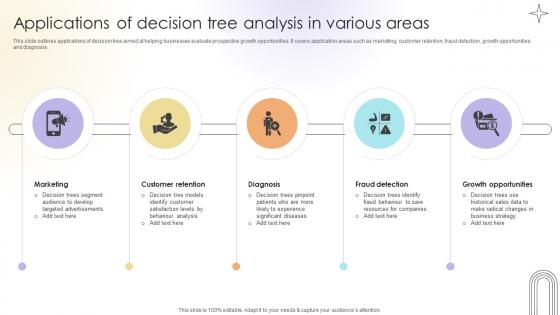
Applications Of Decision Tree Analysis In Various Areas Data Analytics SS V
This slide outlines applications of decision tree aimed at helping businesses evaluate prospective growth opportunities. It covers application areas such as marketing, customer retention, fraud detection, growth opportunities and diagnosis.Get a simple yet stunning designed Applications Of Decision Tree Analysis In Various Areas Data Analytics SS V. It is the best one to establish the tone in your meetings. It is an excellent way to make your presentations highly effective. So, download this PPT today from Slidegeeks and see the positive impacts. Our easy-to-edit Applications Of Decision Tree Analysis In Various Areas Data Analytics SS V can be your go-to option for all upcoming conferences and meetings. So, what are you waiting for Grab this template today. This slide outlines applications of decision tree aimed at helping businesses evaluate prospective growth opportunities. It covers application areas such as marketing, customer retention, fraud detection, growth opportunities and diagnosis.
Business Research And Analysis Ppt PowerPoint Presentation Ideas Graphics Design
This is a business research and analysis ppt powerpoint presentation ideas graphics design. This is a three stage process. The stages in this process are support, assistance, hand holding.
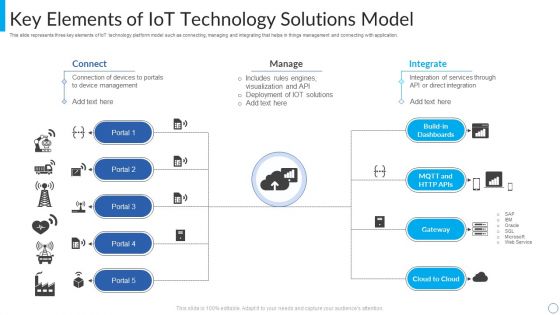
Key Elements Of Iot Technology Solutions Model Mockup PDF
This slide represents three key elements of IoT technology platform model such as connecting, managing and integrating that helps in things management and connecting with application. Pitch your topic with ease and precision using this Key Elements Of Iot Technology Solutions Model Mockup PDF. This layout presents information on Build In Dashboards, Technology, Solutions Model. It is also available for immediate download and adjustment. So, changes can be made in the color, design, graphics or any other component to create a unique layout.
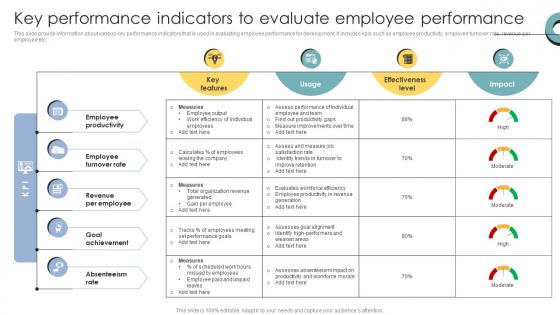
Skill Enhancement Performance Key Performance Indicators To Evaluate Employee Performance
This slide provide information about various key performance indicators that is used in evaluating employee performance for development. It includes kpis such as employee productivity, employee turnover rate, revenue per employee etc. Get a simple yet stunning designed Skill Enhancement Performance Key Performance Indicators To Evaluate Employee Performance. It is the best one to establish the tone in your meetings. It is an excellent way to make your presentations highly effective. So, download this PPT today from Slidegeeks and see the positive impacts. Our easy-to-edit Skill Enhancement Performance Key Performance Indicators To Evaluate Employee Performance can be your go-to option for all upcoming conferences and meetings. So, what are you waiting for Grab this template today. This slide provide information about various key performance indicators that is used in evaluating employee performance for development. It includes kpis such as employee productivity, employee turnover rate, revenue per employee etc.
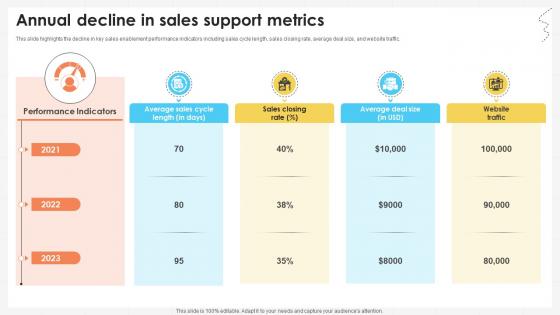
Business Development Team Annual Decline In Sales Support Metrics SA SS V
This slide highlights the decline in key sales enablement performance indicators including sales cycle length, sales closing rate, average deal size, and website traffic. Create an editable Business Development Team Annual Decline In Sales Support Metrics SA SS V that communicates your idea and engages your audience. Whether you are presenting a business or an educational presentation, pre-designed presentation templates help save time. Business Development Team Annual Decline In Sales Support Metrics SA SS V is highly customizable and very easy to edit, covering many different styles from creative to business presentations. Slidegeeks has creative team members who have crafted amazing templates. So, go and get them without any delay. This slide highlights the decline in key sales enablement performance indicators including sales cycle length, sales closing rate, average deal size, and website traffic.
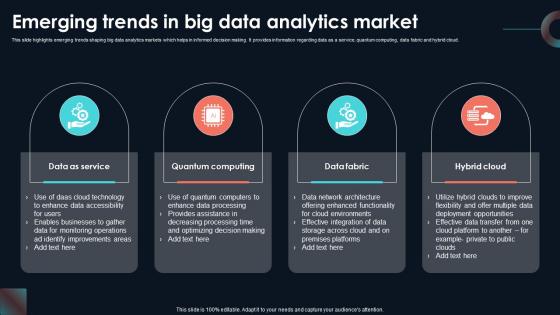
Emerging Trends In Big Data Analytics Developing Strategic Insights Using Big Data Analytics SS V
This slide highlights emerging trends shaping big data analytics markets which helps in informed decision making. It provides information regarding data as a service, quantum computing, data fabric and hybrid cloud. The Emerging Trends In Big Data Analytics Developing Strategic Insights Using Big Data Analytics SS V is a compilation of the most recent design trends as a series of slides. It is suitable for any subject or industry presentation, containing attractive visuals and photo spots for businesses to clearly express their messages. This template contains a variety of slides for the user to input data, such as structures to contrast two elements, bullet points, and slides for written information. Slidegeeks is prepared to create an impression. This slide highlights emerging trends shaping big data analytics markets which helps in informed decision making. It provides information regarding data as a service, quantum computing, data fabric and hybrid cloud.
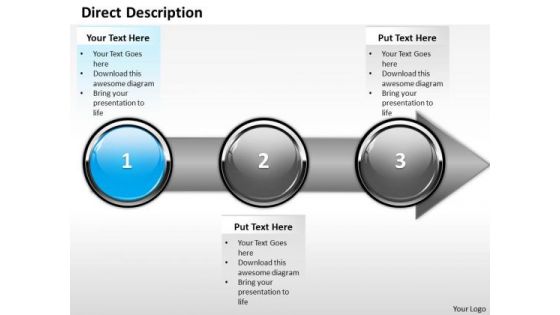
Ppt Consecutive Demonstration Of Arrow Process Using Stage 1 PowerPoint Templates
PPT consecutive demonstration of arrow process using stage 1 PowerPoint Templates-With this pre-designed process arrows diagram you can visualize almost any type of concept, chronological process or steps of your strategies.-PPT consecutive demonstration of arrow process using stage 1 PowerPoint Templates-Arrow, Bank, Benefit, Business, Calculate, Calculation, Capitalist, Communication, Company, Concern, Connection, Data, Diagram, Digital, Drawing, Earnings, Economic, Finance, Financial, Flow, Forecast, Gain, Goal, Graph, Growth, Illustration, Increase, Information, Interest, Investing, Management, Market, Money, Move, Network, Objective, Plan, Process, Profit, Progress, Report, Rise, Risk, Shares, Statistics, Stock, System, Technology Keep them enthused with our Ppt Consecutive Demonstration Of Arrow Process Using Stage 1 PowerPoint Templates. You will come out on top.
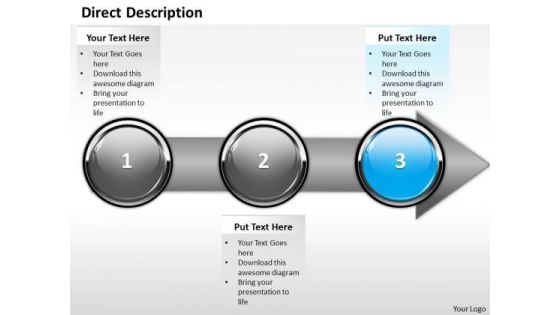
Ppt Direct Description Of Arrow Process Using Stage 3 PowerPoint Templates
PPT direct description of arrow process using stage 3 PowerPoint Templates-With this pre-designed process arrows diagram you can visualize almost any type of concept, chronological process or steps of your strategies.-PPT direct description of arrow process using stage 3 PowerPoint Templates-Arrow, Bank, Benefit, Business, Calculate, Calculation, Capitalist, Communication, Company, Concern, Connection, Data, Diagram, Digital, Drawing, Earnings, Economic, Finance, Financial, Flow, Forecast, Gain, Goal, Graph, Growth, Illustration, Increase, Information, Interest, Investing, Management, Market, Money, Move, Network, Objective, Plan, Process, Profit, Progress, Report, Rise, Risk, Shares, Statistics, Stock, System, Technology Our Ppt Direct Description Of Arrow Process Using Stage 3 PowerPoint Templates will soon be your favourites. They will delight you with their charm.
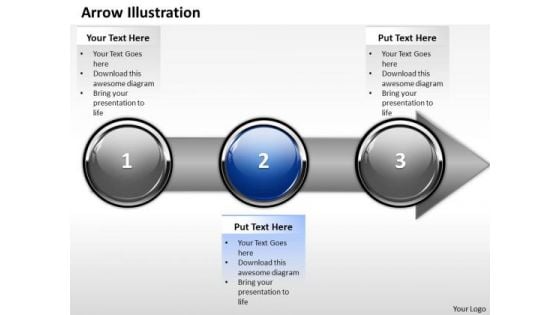
Ppt Direct Illustration Of Banking Process Using Stage 2 PowerPoint Templates
PPT direct illustration of banking process using stage 2 PowerPoint Templates-With this pre-designed process arrows diagram you can visualize almost any type of concept, chronological process or steps of your strategies.-PPT direct illustration of banking process using stage 2 PowerPoint Templates-Arrow, Bank, Benefit, Business, Calculate, Calculation, Capitalist, Communication, Company, Concern, Connection, Data, Diagram, Digital, Drawing, Earnings, Economic, Finance, Financial, Flow, Forecast, Gain, Goal, Graph, Growth, Illustration, Increase, Information, Interest, Investing, Management, Market, Money, Move, Network, Objective, Plan, Process, Profit, Progress, Report, Rise, Risk, Shares, Statistics, Stock, System, Technology Our Ppt Direct Illustration Of Banking Process Using Stage 2 PowerPoint Templates have a glossy look. Your thoughts will also acquire a sheen.
CRM System Deployment Plan Implementation Steps Determine Metrics Supporting Icons PDF
This slide covers various KPIs that need to be measured to achieve organizational goals. It includes metrics such as salespersons performance report, number of leads converted, leads generated through campaigns, monthly sales report, number of unresolved cases, etc. This is a CRM System Deployment Plan Implementation Steps Determine Metrics Supporting Icons PDF template with various stages. Focus and dispense information on one stages using this creative set, that comes with editable features. It contains large content boxes to add your information on topics like Report And Dashboard, Metrics, Resource. You can also showcase facts, figures, and other relevant content using this PPT layout. Grab it now.

Key Performance Indicators Of IBN Outsourcing Company PPT Presentation SS
The slide shows the key Performance Indicator KPIs which will help the company to track the success rate of implemented strategies. Some of the KPIs are Customer Attrition Rate, Product, Service Adoption Rate, Average Customer Queue Time , Customer Satisfaction Rate etc. Are you in need of a template that can accommodate all of your creative concepts This one is crafted professionally and can be altered to fit any style. Use it with Google Slides or PowerPoint. Include striking photographs, symbols, depictions, and other visuals. Fill, move around, or remove text boxes as desired. Test out color palettes and font mixtures. Edit and save your work, or work with colleagues. Download Key Performance Indicators Of IBN Outsourcing Company PPT Presentation SS and observe how to make your presentation outstanding. Give an impeccable presentation to your group and make your presentation unforgettable. The slide shows the key Performance Indicator KPIs which will help the company to track the success rate of implemented strategies. Some of the KPIs are Customer Attrition Rate, Product, Service Adoption Rate, Average Customer Queue Time , Customer Satisfaction Rate etc.


 Continue with Email

 Home
Home


