Benefits Dashboard
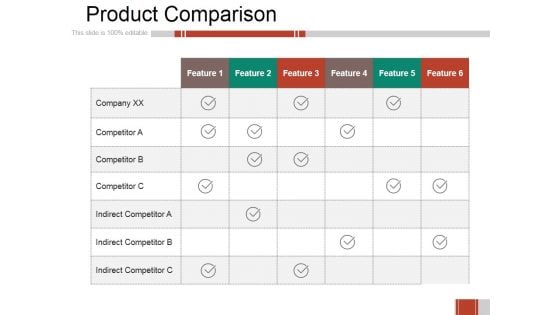
Product Comparison Ppt PowerPoint Presentation Visual Aids Gallery
This is a product comparison ppt powerpoint presentation visual aids gallery. This is a six stage process. The stages in this process are business, table, marketing, data analysis, feature.
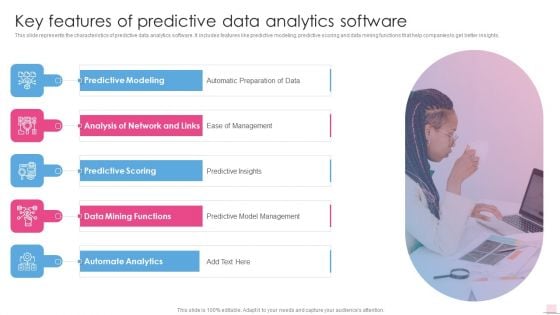
Key Features Of Predictive Data Analytics Software Business Analysis Modification Toolkit Graphics PDF
This slide represents the characteristics of predictive data analytics software. It includes features like predictive modeling, predictive scoring and data mining functions that help companies to get better insights.Presenting Key Features Of Predictive Data Analytics Software Business Analysis Modification Toolkit Graphics PDF to provide visual cues and insights. Share and navigate important information on five stages that need your due attention. This template can be used to pitch topics like Automate Analytics, Predictive Modeling, Automatic Preparation. In addtion, this PPT design contains high resolution images, graphics, etc, that are easily editable and available for immediate download.
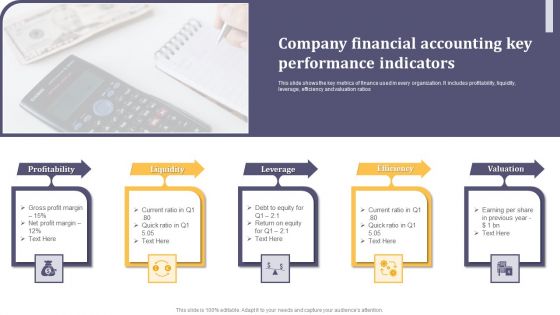
Company Financial Accounting Key Performance Indicators Ppt Slides PDF
This slide shows the key metrics of finance used in every organization. It includes profitability, liquidity, leverage, efficiency and valuation ratios. Presenting Company Financial Accounting Key Performance Indicators Ppt Slides PDF to dispense important information. This template comprises five stages. It also presents valuable insights into the topics including Profitability, Liquidity, Leverage. This is a completely customizable PowerPoint theme that can be put to use immediately. So, download it and address the topic impactfully.
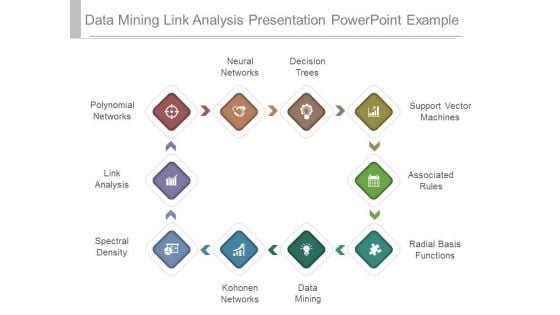
Data Mining Link Analysis Presentation Powerpoint Example
This is a data mining link analysis presentation powerpoint example. This is a ten stage process. The stages in this process are polynomial networks, link analysis, spectral density, kohonen networks, data mining, radial basis functions, associated rules, support vector machines, decision trees, neural network.

Decision Support System What Is Cloud Data Warehouse Ppt Visual Aids Pictures PDF
This slide depicts what a cloud data warehouse is and how it can store data from many data sources and is scalable as per the organizational needs. Presenting Decision Support System What Is Cloud Data Warehouse Ppt Visual Aids Pictures PDF to provide visual cues and insights. Share and navigate important information on four stages that need your due attention. This template can be used to pitch topics like Data Sources, Cloud Data Warehouse, Essential Component. In addtion, this PPT design contains high resolution images, graphics, etc, that are easily editable and available for immediate download.
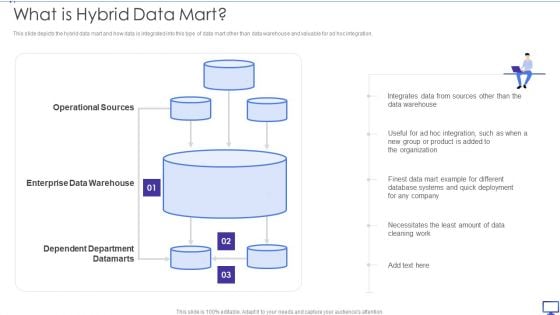
Decision Support System What Is Hybrid Data Mart Ppt Outline Visual Aids PDF
This slide depicts the hybrid data mart and how data is integrated into this type of data mart other than data warehouse and valuable for ad hoc integration. Presenting Decision Support System What Is Hybrid Data Mart Ppt Outline Visual Aids PDF to provide visual cues and insights. Share and navigate important information on three stages that need your due attention. This template can be used to pitch topics like Operational Sources, Enterprise Data Warehouse, Dependent Department Datamarts. In addtion, this PPT design contains high resolution images, graphics, etc, that are easily editable and available for immediate download.
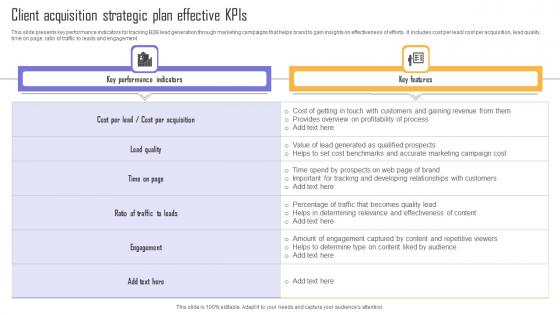
Client Acquisition Strategic Plan Effective Kpis Microsoft Pdf
This slide presents key performance indicators for tracking B2B lead generation through marketing campaigns that helps brand to gain insights on effectiveness of efforts. It includes cost per lead cost per acquisition, lead quality, time on page, ratio of traffic to leads and engagement. Pitch your topic with ease and precision using this Client Acquisition Strategic Plan Effective Kpis Microsoft Pdf. This layout presents information on Key Performance Indicators, Key Features. It is also available for immediate download and adjustment. So, changes can be made in the color, design, graphics or any other component to create a unique layout. This slide presents key performance indicators for tracking B2B lead generation through marketing campaigns that helps brand to gain insights on effectiveness of efforts. It includes cost per lead cost per acquisition, lead quality, time on page, ratio of traffic to leads and engagement.
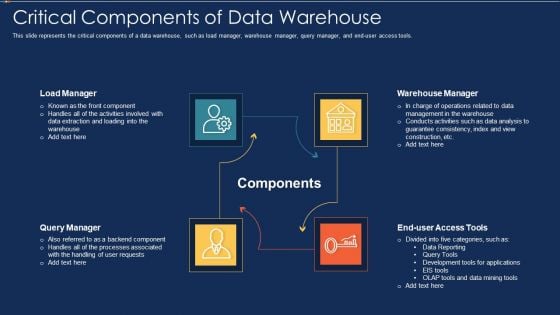
Data Warehousing IT Critical Components Of Data Warehouse Ppt File Aids PDF
This slide represents the critical components of a data warehouse, such as load manager, warehouse manager, query manager, and end-user access tools. This is a data warehousing it critical components of data warehouse ppt file aids pdf template with various stages. Focus and dispense information on four stages using this creative set, that comes with editable features. It contains large content boxes to add your information on topics like load manager, query manager, warehouse manager, end user access tools. You can also showcase facts, figures, and other relevant content using this PPT layout. Grab it now.
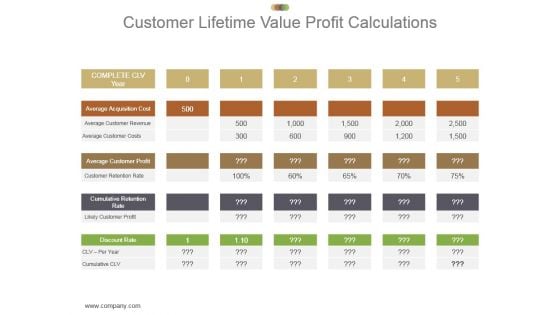
Customer Lifetime Value Profit Calculations Ppt Presentation
This is a customer lifetime value profit calculations ppt presentation. This is a five stage process. The stages in this process are complete clv year, average acquisition cost, average customer revenue, average customer costs, average customer profit, customer retention rate, cumulative retention rate, likely customer profit, discount rate.
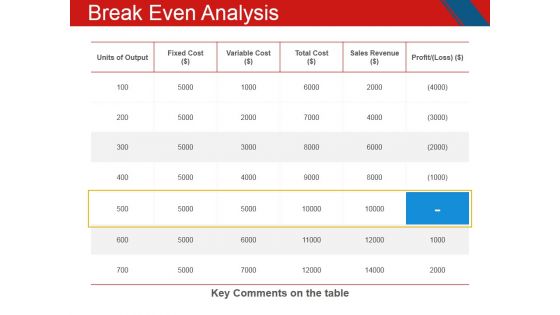
Break Even Analysis Ppt PowerPoint Presentation Inspiration Templates
This is a break even analysis ppt powerpoint presentation inspiration templates. This is a five stage process. The stages in this process are units of output, fixed cost, variable cost, total cost, sales revenue, profit.
Analyzing Descriptive Data To Formulate Personalized Marketing Plan Ppt Visual Aids Icon PDF
This slide showcases descriptive data that can be collected to formulate personalized marketing campaign. It also shows ways to collect data from different sources. Are you in need of a template that can accommodate all of your creative concepts This one is crafted professionally and can be altered to fit any style. Use it with Google Slides or PowerPoint. Include striking photographs, symbols, depictions, and other visuals. Fill, move around, or remove text boxes as desired. Test out color palettes and font mixtures. Edit and save your work, or work with colleagues. Download Analyzing Descriptive Data To Formulate Personalized Marketing Plan Ppt Visual Aids Icon PDF and observe how to make your presentation outstanding. Give an impeccable presentation to your group and make your presentation unforgettable.
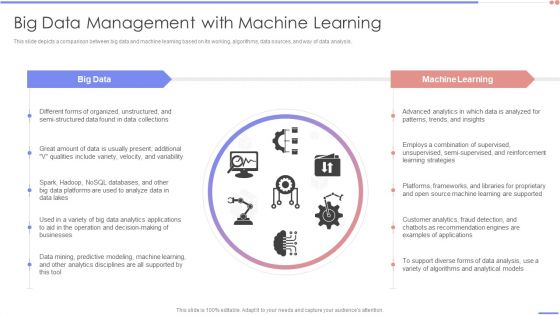
Data Analytics Management Big Data Management With Machine Learning Elements PDF
This slide depicts a comparison between big data and machine learning based on its working, algorithms, data sources, and way of data analysis.Deliver an awe inspiring pitch with this creative Data Analytics Management Big Data Management With Machine Learning Elements PDF bundle. Topics like Combination Supervised, Supervised Reinforcement, Learning Supported can be discussed with this completely editable template. It is available for immediate download depending on the needs and requirements of the user.
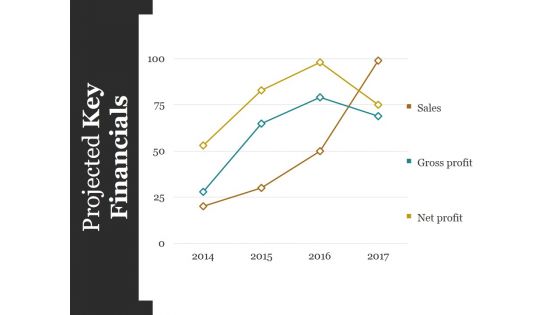
Projected Key Financials Template Ppt PowerPoint Presentation Styles Graphics Design
This is a projected key financials template ppt powerpoint presentation styles graphics design. This is a four stage process. The stages in this process are sales, gross profit, net profit.
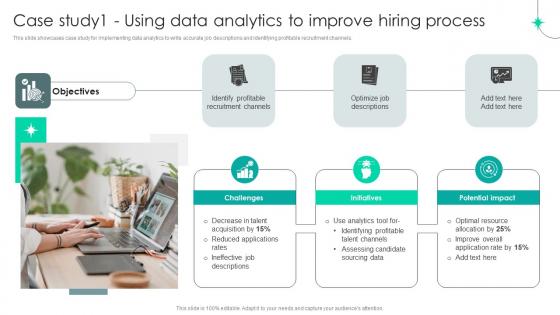
Strategic Staffing Using Data Case Study1 Using Data Analytics To Improve Hiring CRP DK SS V
This slide showcases case study for implementing data analytics to write accurate job descriptions and identifying profitable recruitment channels. Find highly impressive Strategic Staffing Using Data Case Study1 Using Data Analytics To Improve Hiring CRP DK SS V on Slidegeeks to deliver a meaningful presentation. You can save an ample amount of time using these presentation templates. No need to worry to prepare everything from scratch because Slidegeeks experts have already done a huge research and work for you. You need to download Strategic Staffing Using Data Case Study1 Using Data Analytics To Improve Hiring CRP DK SS V for your upcoming presentation. All the presentation templates are 100 percent editable and you can change the color and personalize the content accordingly. Download now This slide showcases case study for implementing data analytics to write accurate job descriptions and identifying profitable recruitment channels.
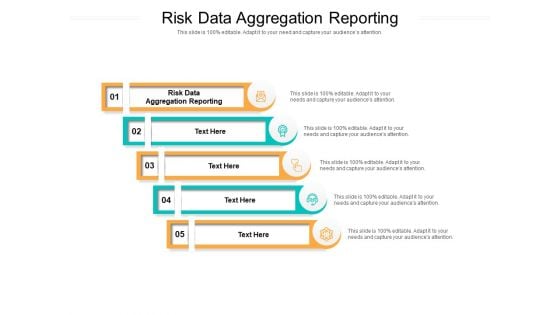
Risk Data Aggregation Reporting Ppt PowerPoint Presentation Gallery Structure Cpb Pdf
Presenting this set of slides with name risk data aggregation reporting ppt powerpoint presentation gallery structure cpb pdf. This is an editable Powerpoint five stages graphic that deals with topics like risk data aggregation reporting to help convey your message better graphically. This product is a premium product available for immediate download and is 100 percent editable in Powerpoint. Download this now and use it in your presentations to impress your audience.
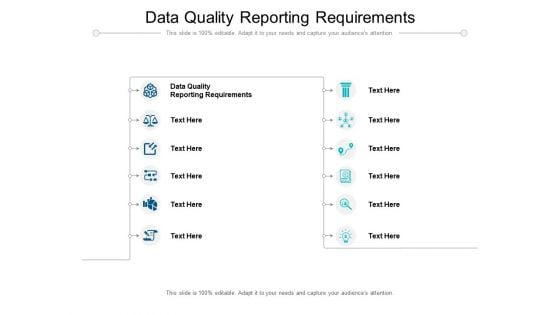
Data Quality Reporting Requirements Ppt PowerPoint Presentation Portfolio Introduction Cpb Pdf
Presenting this set of slides with name data quality reporting requirements ppt powerpoint presentation portfolio introduction cpb pdf. This is an editable Powerpoint twelve stages graphic that deals with topics like data quality reporting requirements to help convey your message better graphically. This product is a premium product available for immediate download and is 100 percent editable in Powerpoint. Download this now and use it in your presentations to impress your audience.
Futures Options Data Analysis Ppt PowerPoint Presentation Pictures Brochure Cpb Pdf
Presenting this set of slides with name futures options data analysis ppt powerpoint presentation pictures brochure cpb pdf. This is an editable Powerpoint four stages graphic that deals with topics like futures options data analysis to help convey your message better graphically. This product is a premium product available for immediate download and is 100 percent editable in Powerpoint. Download this now and use it in your presentations to impress your audience.
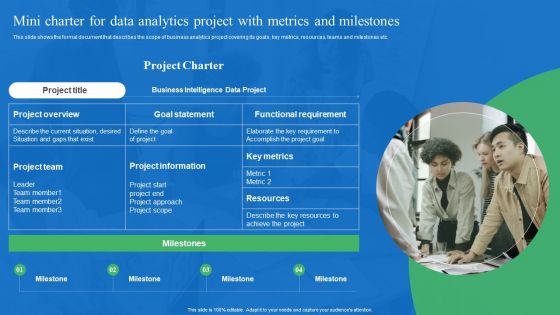
Mini Charter For Data Analytics Project With Metrics And Milestones Clipart PDF
This slide shows the formal document that describes the scope of business analytics project covering its goals, key metrics, resources, teams and milestones etc. This Mini Charter For Data Analytics Project With Metrics And Milestones Clipart PDF from Slidegeeks makes it easy to present information on your topic with precision. It provides customization options, so you can make changes to the colors, design, graphics, or any other component to create a unique layout. It is also available for immediate download, so you can begin using it right away. Slidegeeks has done good research to ensure that you have everything you need to make your presentation stand out. Make a name out there for a brilliant performance.

Increasing Business Awareness Evaluating Kpis To Determine Gap In Business Strategy SS V
This slide analyzes the performance of key metrics of insurance business. It includes information about metrics such as new policies per agent, customer acquisition cost, policy sales growth, average premium per customer. Whether you have daily or monthly meetings, a brilliant presentation is necessary. Increasing Business Awareness Evaluating Kpis To Determine Gap In Business Strategy SS V can be your best option for delivering a presentation. Represent everything in detail using Increasing Business Awareness Evaluating Kpis To Determine Gap In Business Strategy SS V and make yourself stand out in meetings. The template is versatile and follows a structure that will cater to your requirements. All the templates prepared by Slidegeeks are easy to download and edit. Our research experts have taken care of the corporate themes as well. So, give it a try and see the results. This slide analyzes the performance of key metrics of insurance business. It includes information about metrics such as new policies per agent, customer acquisition cost, policy sales growth, average premium per customer.
Business Diagram Metrics For Performance Measurement Presentation Template
This diagram slide has been designed with graphic of matrix. You may use this matrix for performance management. Download this diagram to make interactive presentations.
Circular Performance Measurement Metrics PowerPoint Templates
Communicate with your group through this slide of circles. It will facilitate understanding of your views. This diagram can be used to display performance measurement in business presentations.

Data Lineage Based On The Choice Of Technique Deploying Data Lineage IT Guidelines PDF
This slide talks about the types of data lineage based on the choice of technique, including design, business, and operational lineage. It helps in root cause analysis, fixing pipeline issues, and directing testing. From laying roadmaps to briefing everything in detail, our templates are perfect for you. You can set the stage with your presentation slides. All you have to do is download these easy-to-edit and customizable templates. Data Lineage Based On The Choice Of Technique Deploying Data Lineage IT Guidelines PDF will help you deliver an outstanding performance that everyone would remember and praise you for. Do download this presentation today.
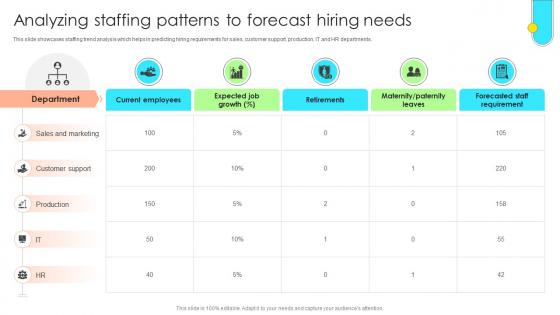
Data Driven Approach To Optimise Analyzing Staffing Patterns To Forecast CRP SS V
This slide showcases staffing trend analysis which helps in predicting hiring requirements for sales, customer support, production, IT and HR departments. Get a simple yet stunning designed Data Driven Approach To Optimise Analyzing Staffing Patterns To Forecast CRP SS V. It is the best one to establish the tone in your meetings. It is an excellent way to make your presentations highly effective. So, download this PPT today from Slidegeeks and see the positive impacts. Our easy-to-edit Data Driven Approach To Optimise Analyzing Staffing Patterns To Forecast CRP SS V can be your go-to option for all upcoming conferences and meetings. So, what are you waiting for Grab this template today. This slide showcases staffing trend analysis which helps in predicting hiring requirements for sales, customer support, production, IT and HR departments.
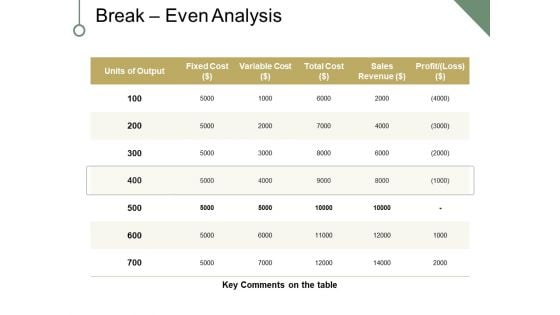
Break Even Analysis Ppt PowerPoint Presentation Portfolio Clipart
This is a break even analysis ppt powerpoint presentation portfolio clipart. This is a five stage process. The stages in this process are fixed cost, variable cost, sales revenue, profit, key comments on the table, units of output.
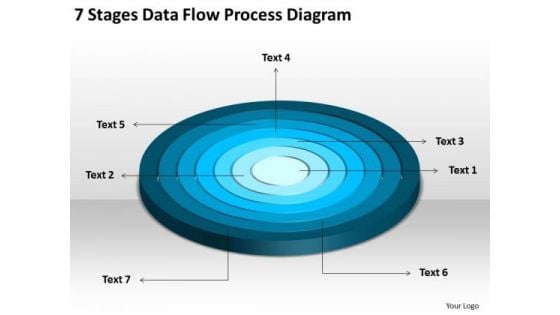
7 Stages Data Flow Process Diagram Business Plan PowerPoint Templates
We present our 7 stages data flow process diagram business plan PowerPoint templates.Download and present our Circle Charts PowerPoint Templates because Our PowerPoint Templates and Slides ensures Effective communication. They help you put across your views with precision and clarity. Download our Shapes PowerPoint Templates because Our PowerPoint Templates and Slides will let your team Walk through your plans. See their energy levels rise as you show them the way. Present our Signs PowerPoint Templates because Our PowerPoint Templates and Slides are Clear and concise. Use them and dispel any doubts your team may have. Present our Maketing PowerPoint Templates because Our PowerPoint Templates and Slides are aesthetically designed to attract attention. We gaurantee that they will grab all the eyeballs you need. Download and present our Metaphors-Visual Concepts PowerPoint Templates because Our PowerPoint Templates and Slides offer you the needful to organise your thoughts. Use them to list out your views in a logical sequence.Use these PowerPoint slides for presentations relating to diagram, circular, market, bar, advertise, interface, business, concept, vector, sign, success, presentation, symbol, template, circle, brochure, finance, data, description, report, marketing, title, label, abstract, management, graph, four, illustration, icon, pie, chart, strategy, catalog, research, web, design, growth, text, professional, banner, account, profit, information, background, info-graphic, analyze, financial, button, goals. The prominent colors used in the PowerPoint template are Blue, Blue light, White. Amuse your audience with our 7 Stages Data Flow Process Diagram Business Plan PowerPoint Templates. Some of them are designed to be far out.
Managing Portfolio Of Growth Options Icons Slide Ppt Infographics Example Topics PDF
Presenting this set of slides containing editable icons for topic managing portfolio of growth options icons slide ppt infographics example topics pdf. All icons in this slide are 100 percent editable. You can replace icons in your deck with any of these icons. Download now and impress your audience.
Investor Deck For Capital Generation From Substitute Funding Options Magnifying Glass Slides PDF
Presenting this set of slides with name investor deck for capital generation from substitute funding options magnifying glass slides pdf. This is a five stage process. The stages in this process are magnifying glass. This is a completely editable PowerPoint presentation and is available for immediate download. Download now and impress your audience.
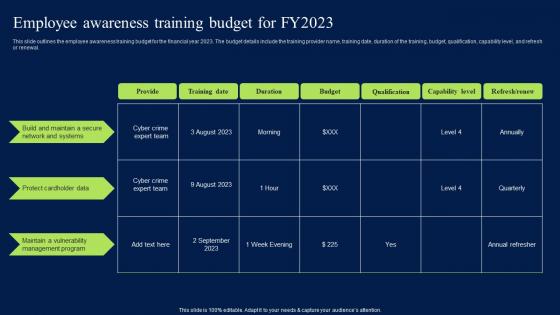
Employee Awareness Training Budget For FY2023 Infographics PDF
This slide outlines the employee awareness training budget for the financial year 2023. The budget details include the training provider name, training date, duration of the training, budget, qualification, capability level, and refresh or renewal. This Employee Awareness Training Budget For FY2023 Infographics PDF from Slidegeeks makes it easy to present information on your topic with precision. It provides customization options, so you can make changes to the colors, design, graphics, or any other component to create a unique layout. It is also available for immediate download, so you can begin using it right away. Slidegeeks has done good research to ensure that you have everything you need to make your presentation stand out. Make a name out there for a brilliant performance. This slide outlines the employee awareness training budget for the financial year 2023. The budget details include the training provider name, training date, duration of the training, budget, qualification, capability level, and refresh or renewal.
Strategic Planning And Execution A Comprehensive Guide Magnifying Glass Clipart PDF
Get a simple yet stunning designed Strategic Planning And Execution A Comprehensive Guide Magnifying Glass Clipart PDF. It is the best one to establish the tone in your meetings. It is an excellent way to make your presentations highly effective. So, download this PPT today from Slidegeeks and see the positive impacts. Our easy to edit Strategic Planning And Execution A Comprehensive Guide Magnifying Glass Clipart PDF can be your go to option for all upcoming conferences and meetings. So, what are you waiting for Grab this template today.
Magnifier Glass Ppt Powerpoint Presentation Infographics Aids
This is a magnifier glass ppt powerpoint presentation infographics aids. This is a six stage process. The stages in this process are magnifying glass, marketing, business, marketing, search.

Transforming Recruitment Process Case Study1 Using Data Analytics To Improve CRP DK SS
This slide showcases case study for implementing data analytics to write accurate job descriptions and identifying profitable recruitment channels. Find highly impressive Transforming Recruitment Process Case Study1 Using Data Analytics To Improve CRP DK SS on Slidegeeks to deliver a meaningful presentation. You can save an ample amount of time using these presentation templates. No need to worry to prepare everything from scratch because Slidegeeks experts have already done a huge research and work for you. You need to download Transforming Recruitment Process Case Study1 Using Data Analytics To Improve CRP DK SS for your upcoming presentation. All the presentation templates are 100 percent editable and you can change the color and personalize the content accordingly. Download now This slide showcases case study for implementing data analytics to write accurate job descriptions and identifying profitable recruitment channels.
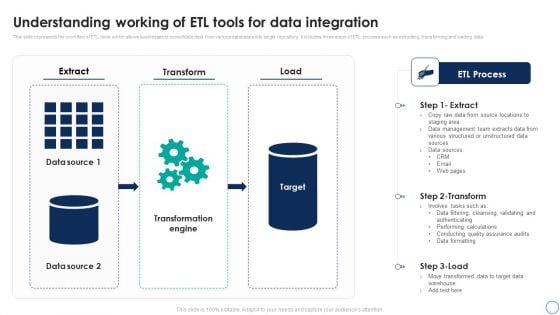
Business Analytics Application Understanding Working Of ETL Tools For Data Structure PDF
This slide represents the workflow of ETL tools which allows businesses to consolidate data from various databases into single repository. It includes three steps of ETL process such as extracting, transforming and loading data. This Business Analytics Application Understanding Working Of ETL Tools For Data Structure PDF from Slidegeeks makes it easy to present information on your topic with precision. It provides customization options, so you can make changes to the colors, design, graphics, or any other component to create a unique layout. It is also available for immediate download, so you can begin using it right away. Slidegeeks has done good research to ensure that you have everything you need to make your presentation stand out. Make a name out there for a brilliant performance.
Outsourced Support Ppt Powerpoint Presentation Infographics Show Cpb
This is a outsourced support ppt powerpoint presentation infographics show cpb. This is a three stage process. The stages in this process are outsourced support.
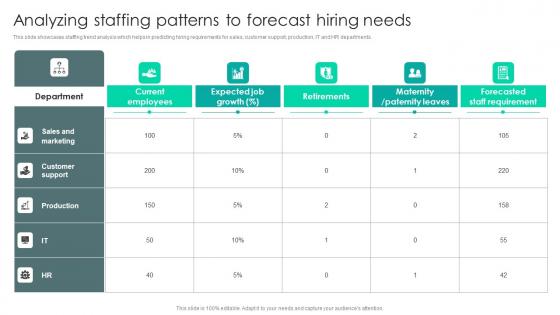
Strategic Staffing Using Data Analyzing Staffing Patterns To Forecast Hiring Needs CRP DK SS V
This slide showcases staffing trend analysis which helps in predicting hiring requirements for sales, customer support, production, IT and HR departments. From laying roadmaps to briefing everything in detail, our templates are perfect for you. You can set the stage with your presentation slides. All you have to do is download these easy-to-edit and customizable templates. Strategic Staffing Using Data Analyzing Staffing Patterns To Forecast Hiring Needs CRP DK SS V will help you deliver an outstanding performance that everyone would remember and praise you for. Do download this presentation today. This slide showcases staffing trend analysis which helps in predicting hiring requirements for sales, customer support, production, IT and HR departments.
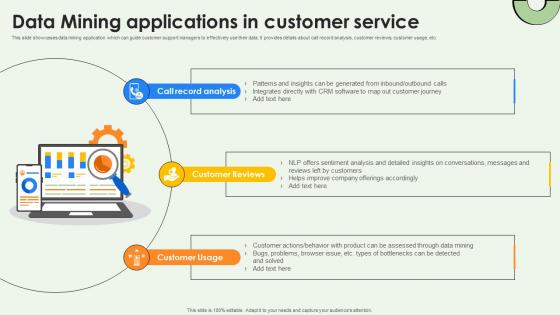
Data Mining Applications In Customer Service Data Warehousing And Data Mining Guide AI SS V
This slide showcases data mining application which can guide customer support managers to effectively use their data. It provides details about call record analysis, customer reviews, customer usage, etc. There are so many reasons you need a Data Mining Applications In Customer Service Data Warehousing And Data Mining Guide AI SS V. The first reason is you can not spend time making everything from scratch, Thus, Slidegeeks has made presentation templates for you too. You can easily download these templates from our website easily. This slide showcases data mining application which can guide customer support managers to effectively use their data. It provides details about call record analysis, customer reviews, customer usage, etc.
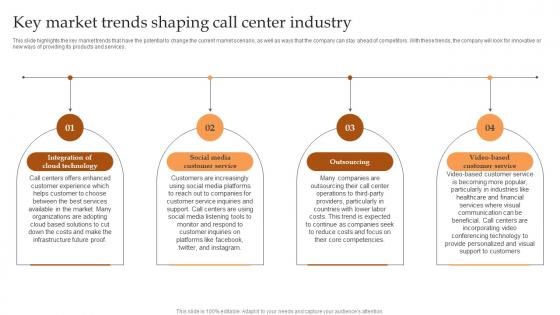
Key Market Trends Shaping Call Center Industry IT And Tech Support Business Microsoft Pdf
This slide highlights the key market trends that have the potential to change the current market scenario, as well as ways that the company can stay ahead of competitors. With these trends, the company will look for innovative or new ways of providing its products and services. Presenting this PowerPoint presentation, titled Key Market Trends Shaping Call Center Industry IT And Tech Support Business Microsoft Pdf with topics curated by our researchers after extensive research. This editable presentation is available for immediate download and provides attractive features when used. Download now and captivate your audience. Presenting this Key Market Trends Shaping Call Center Industry IT And Tech Support Business Microsoft Pdf Our researchers have carefully researched and created these slides with all aspects taken into consideration. This is a completely customizable Key Market Trends Shaping Call Center Industry IT And Tech Support Business Microsoft Pdf that is available for immediate downloading. Download now and make an impact on your audience. Highlight the attractive features available with our PPTs. This slide highlights the key market trends that have the potential to change the current market scenario, as well as ways that the company can stay ahead of competitors. With these trends, the company will look for innovative or new ways of providing its products and services.
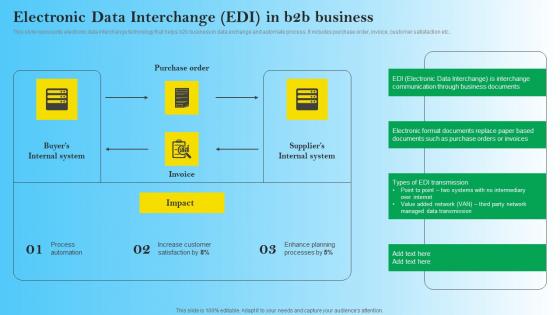
Electronic Data Interchange Edi In B2B Business B2B Digital Commerce Infographics Pdf
This slide represents electronic data interchange technology that helps b2b business in data exchange and automate process. It includes purchase order, invoice, customer satisfaction etc. Get a simple yet stunning designed Electronic Data Interchange Edi In B2B Business B2B Digital Commerce Infographics Pdf It is the best one to establish the tone in your meetings. It is an excellent way to make your presentations highly effective. So, download this PPT today from Slidegeeks and see the positive impacts. Our easy-to-edit Electronic Data Interchange Edi In B2B Business B2B Digital Commerce Infographics Pdf can be your go-to option for all upcoming conferences and meetings. So, what are you waiting for Grab this template today. This slide represents electronic data interchange technology that helps b2b business in data exchange and automate process. It includes purchase order, invoice, customer satisfaction etc.
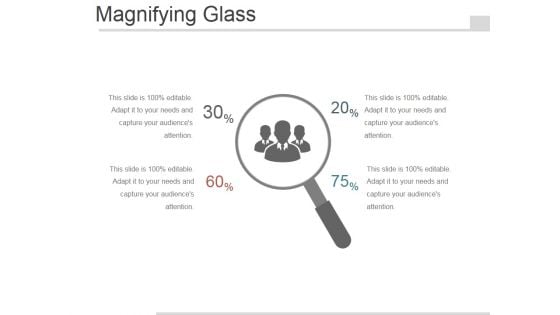
Magnifying Glass Ppt PowerPoint Presentation Visual Aids
This is a magnifying glass ppt powerpoint presentation visual aids. This is a two stage process. The stages in this process are management, magnifying glass, business, marketing.
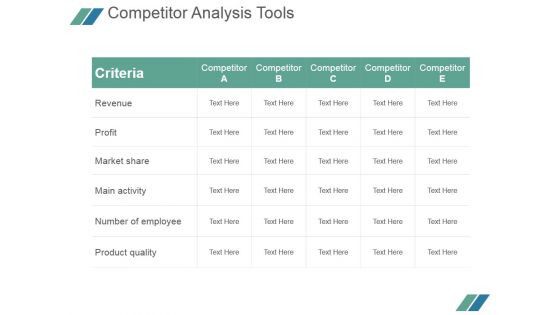
Competitor Analysis Tools Ppt PowerPoint Presentation Example File
This is a competitor analysis tools ppt powerpoint presentation example file. This is a five stage process. The stages in this process are criteria, revenue, profit, market share, main activity, number of employee, product quality.
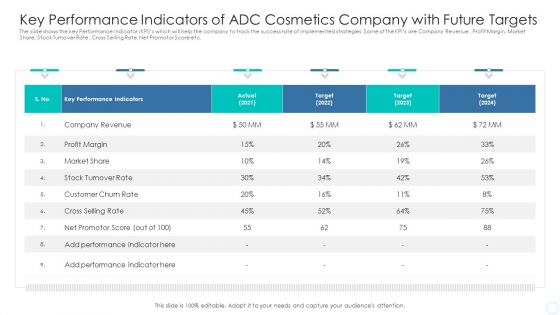
Key Performance Indicators Of ADC Cosmetics Company With Future Targets Infographics PDF
The slide shows the key Performance Indicator KPIs which will help the company to track the success rate of implemented strategies. Some of the KPIs are Company Revenue , Profit Margin, Market Share, Stock Turnover Rate , Cross Selling Rate, Net Promotor Score etc. Deliver and pitch your topic in the best possible manner with this key performance indicators of adc cosmetics company with future targets infographics pdf. Use them to share invaluable insights on company revenue, profit margin, market share, stock turnover rate, customer churn rate and impress your audience. This template can be altered and modified as per your expectations. So, grab it now.
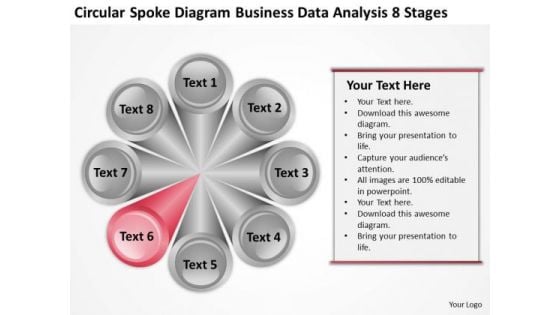
Spoke Diagram Business Data Analysis 8 Stages Plan Help PowerPoint Templates
We present our spoke diagram business data analysis 8 stages plan help PowerPoint templates.Use our Finance PowerPoint Templates because Our PowerPoint Templates and Slides will let you Hit the target. Go the full distance with ease and elan. Use our Leadership PowerPoint Templates because Our PowerPoint Templates and Slides are created with admirable insight. Use them and give your group a sense of your logical mind. Use our Circle Charts PowerPoint Templates because You should Bet on your luck with our PowerPoint Templates and Slides. Be assured that you will hit the jackpot. Download our Business PowerPoint Templates because Timeline crunches are a fact of life. Meet all deadlines using our PowerPoint Templates and Slides. Download our Process and Flows PowerPoint Templates because Our PowerPoint Templates and Slides will let you Hit the right notes. Watch your audience start singing to your tune.Use these PowerPoint slides for presentations relating to Chart, segmented, pie, hub, wheel, isolated, divided, business, communication, diagram, circle, graphic, process, element, tire, graph, marketing, illustration, icon, circular, round, clipart, design, success, set, spoke, button. The prominent colors used in the PowerPoint template are Red, Gray, White. Your audience will love what they are looking at. Impress them with our Spoke Diagram Business Data Analysis 8 Stages Plan Help PowerPoint Templates. You will be at the top of your game.

Data Science Model For Healthcare Analytics Microsoft PDF
The following slide presents a framework showing key steps to execute healthcare analytics using data science. It includes key components such as data fusion, data integration, data driven models, knowledge driven models, data analytics, decision analytics, analytics outcome, etc. Showcasing this set of slides titled Data Science Model For Healthcare Analytics Microsoft PDF. The topics addressed in these templates are Analytics Methods, Analytics Models, Analytics Options. All the content presented in this PPT design is completely editable. Download it and make adjustments in color, background, font etc. as per your unique business setting.
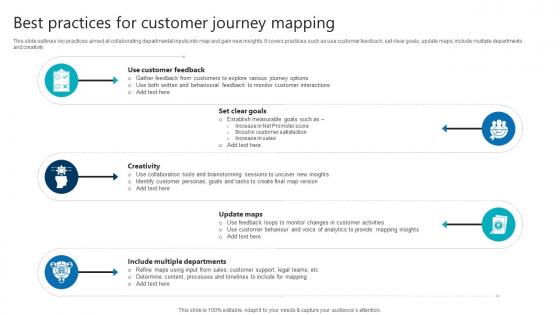
Best Practices For Customer Journey Mapping Product Analytics Implementation Data Analytics V
This slide outlines key practices aimed at collaborating departmental inputs into map and gain new insights. It covers practices such as use customer feedback, set clear goals, update maps, include multiple departments and creativity.Want to ace your presentation in front of a live audience Our Best Practices For Customer Journey Mapping Product Analytics Implementation Data Analytics V can help you do that by engaging all the users towards you. Slidegeeks experts have put their efforts and expertise into creating these impeccable powerpoint presentations so that you can communicate your ideas clearly. Moreover, all the templates are customizable, and easy-to-edit and downloadable. Use these for both personal and commercial use. This slide outlines key practices aimed at collaborating departmental inputs into map and gain new insights. It covers practices such as use customer feedback, set clear goals, update maps, include multiple departments and creativity.
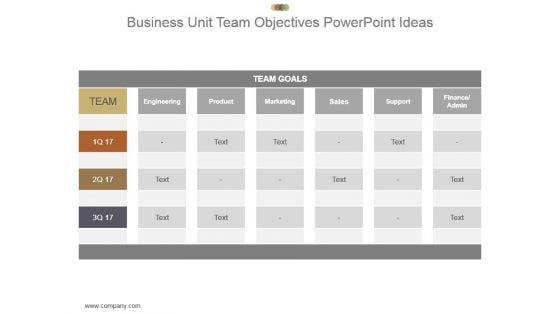
Business Unit Team Objectives Powerpoint Ideas
This is a business unit team objectives powerpoint ideas. This is a four stage process. The stages in this process are team, team goals, engineering, product, marketing, sales, support, finance admin.
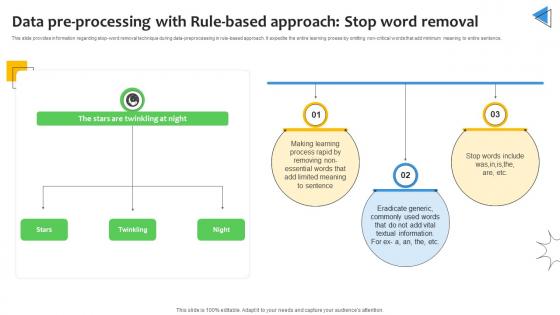
Data Pre Processing With Rule Based Approach Sentiment Analysis Demystified Understanding AI SS V
This slide provides information regarding stop-word removal technique during data-preprocessing in rule-based approach. It expedite the entire learning proess by omitting non-critical words that add minimum meaning to entire sentence. Whether you have daily or monthly meetings, a brilliant presentation is necessary. Data Pre Processing With Rule Based Approach Sentiment Analysis Demystified Understanding AI SS V can be your best option for delivering a presentation. Represent everything in detail using Data Pre Processing With Rule Based Approach Sentiment Analysis Demystified Understanding AI SS V and make yourself stand out in meetings. The template is versatile and follows a structure that will cater to your requirements. All the templates prepared by Slidegeeks are easy to download and edit. Our research experts have taken care of the corporate themes as well. So, give it a try and see the results. This slide provides information regarding stop-word removal technique during data-preprocessing in rule-based approach. It expedite the entire learning proess by omitting non-critical words that add minimum meaning to entire sentence.
Object Of Marketing Segmentation Ppt PowerPoint Presentation Gallery Visual Aids
This is a object of marketing segmentation ppt powerpoint presentation gallery visual aids. This is a one stage process. The stages in this process are magnifier glass, strategy, communication, business, marketing, search.
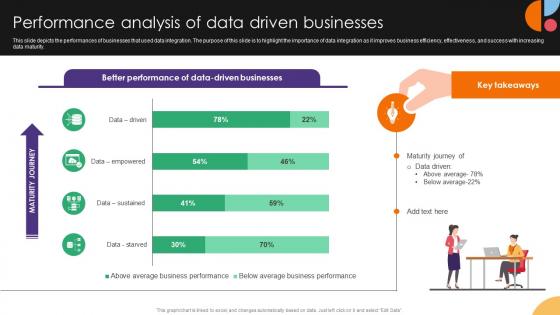
Performance Analysis Of Data Driven Businesses Data Integration Strategies For Business
This slide depicts the performances of businesses that used data integration. The purpose of this slide is to highlight the importance of data integration as it improves business efficiency, effectiveness, and success with increasing data maturity. From laying roadmaps to briefing everything in detail, our templates are perfect for you. You can set the stage with your presentation slides. All you have to do is download these easy-to-edit and customizable templates. Performance Analysis Of Data Driven Businesses Data Integration Strategies For Business will help you deliver an outstanding performance that everyone would remember and praise you for. Do download this presentation today. This slide depicts the performances of businesses that used data integration. The purpose of this slide is to highlight the importance of data integration as it improves business efficiency, effectiveness, and success with increasing data maturity.
Magnifying Ppt PowerPoint Presentation Show Aids
This is a magnifying ppt powerpoint presentation show aids. This is a three stage process. The stages in this process are magnifying glass, business, marketing, management, planning.
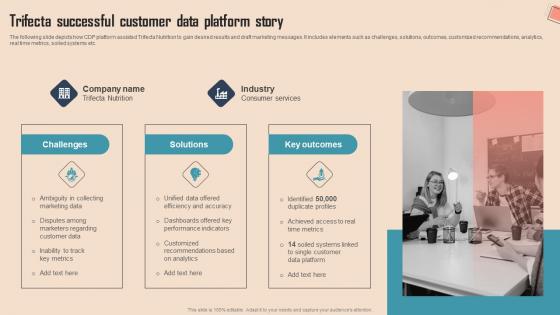
Trifecta Successful Customer Data Platform Comprehensive CDP Guide For Promoters Background Pdf
The following slide depicts how CDP platform assisted Trifecta Nutrition to gain desired results and draft marketing messages. It includes elements such as challenges, solutions, outcomes, customized recommendations, analytics, real time metrics, soiled systems etc.Do you know about Slidesgeeks Trifecta Successful Customer Data Platform Comprehensive CDP Guide For Promoters Background Pdf These are perfect for delivering any kind od presentation. Using it, create PowerPoint presentations that communicate your ideas and engage audiences. Save time and effort by using our pre-designed presentation templates that are perfect for a wide range of topic. Our vast selection of designs covers a range of styles, from creative to business, and are all highly customizable and easy to edit. Download as a PowerPoint template or use them as Google Slides themes. The following slide depicts how CDP platform assisted Trifecta Nutrition to gain desired results and draft marketing messages. It includes elements such as challenges, solutions, outcomes, customized recommendations, analytics, real time metrics, soiled systems etc.
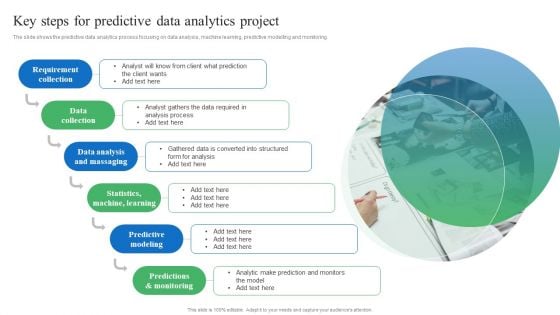
Toolkit For Data Science And Analytics Transition Key Steps For Predictive Data Analytics Project Infographics PDF
The slide shows the predictive data analytics process focusing on data analysis, machine learning, predictive modelling and monitoring. Formulating a presentation can take up a lot of effort and time, so the content and message should always be the primary focus. The visuals of the PowerPoint can enhance the presenters message, so our Toolkit For Data Science And Analytics Transition Key Steps For Predictive Data Analytics Project Infographics PDF was created to help save time. Instead of worrying about the design, the presenter can concentrate on the message while our designers work on creating the ideal templates for whatever situation is needed. Slidegeeks has experts for everything from amazing designs to valuable content, we have put everything into Toolkit For Data Science And Analytics Transition Key Steps For Predictive Data Analytics Project Infographics PDF.
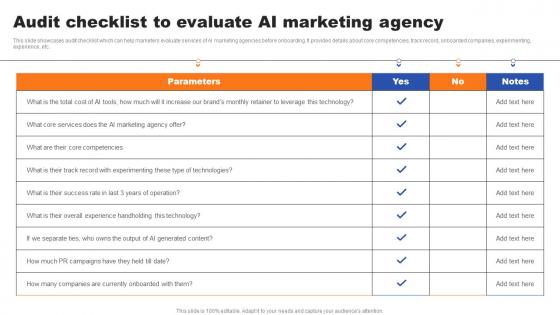
Audit Checklist To Evaluate AI Marketing Agency Ppt Infographic Template Ideas PDF
This slide showcases audit checklist which can help marketers evaluate services of AI marketing agencies before onboarding. It provides details about core competencies, track record, onboarded companies, experimenting, experience, etc. From laying roadmaps to briefing everything in detail, our templates are perfect for you. You can set the stage with your presentation slides. All you have to do is download these easy-to-edit and customizable templates. Audit Checklist To Evaluate AI Marketing Agency Ppt Infographic Template Ideas PDF will help you deliver an outstanding performance that everyone would remember and praise you for. Do download this presentation today. This slide showcases audit checklist which can help marketers evaluate services of AI marketing agencies before onboarding. It provides details about core competencies, track record, onboarded companies, experimenting, experience, etc.
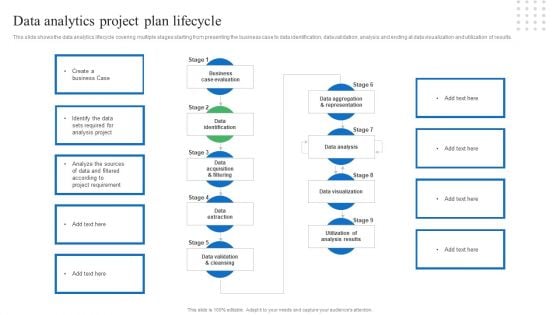
Toolkit For Data Science And Analytics Transition Data Analytics Project Plan Lifecycle Introduction PDF
The slide outline the key steps for data analytics methodology. It initiates with defining business objectives to data understanding, modelling and ends at data visualization and presentation. From laying roadmaps to briefing everything in detail, our templates are perfect for you. You can set the stage with your presentation slides. All you have to do is download these easy to edit and customizable templates. Toolkit For Data Science And Analytics Transition Data Analytics Project Plan Lifecycle Introduction PDF will help you deliver an outstanding performance that everyone would remember and praise you for. Do download this presentation today.
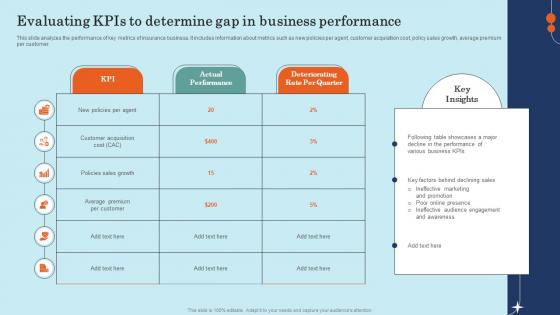
Evaluating KPIs To Determine Gap In Business Effective General Insurance Marketing Pictures Pdf
This slide analyzes the performance of key metrics of insurance business. It includes information about metrics such as new policies per agent, customer acquisition cost, policy sales growth, average premium per customer.Whether you have daily or monthly meetings, a brilliant presentation is necessary. Evaluating KPIs To Determine Gap In Business Effective General Insurance Marketing Pictures Pdf can be your best option for delivering a presentation. Represent everything in detail using Evaluating KPIs To Determine Gap In Business Effective General Insurance Marketing Pictures Pdf and make yourself stand out in meetings. The template is versatile and follows a structure that will cater to your requirements. All the templates prepared by Slidegeeks are easy to download and edit. Our research experts have taken care of the corporate themes as well. So, give it a try and see the results. This slide analyzes the performance of key metrics of insurance business. It includes information about metrics such as new policies per agent, customer acquisition cost, policy sales growth, average premium per customer.
Financial Charts Data Analysis Vector Icon Ppt PowerPoint Presentation Visual Aids Summary Cpb
This is a financial charts data analysis vector icon ppt powerpoint presentation visual aids summary cpb. This is a three stage process. The stages in this process are data analysis, analytics architecture, analytics framework.
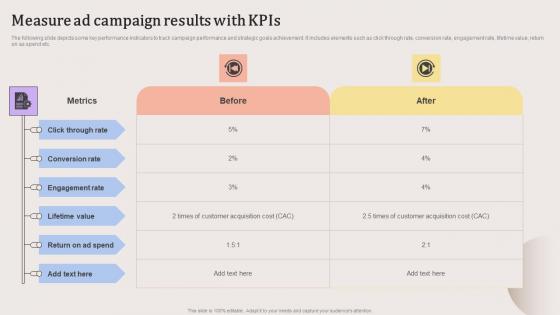
Measure Ad Campaign Results With KPIs Evaluating Strengths And Weaknesses Elements Pdf
The following slide depicts some key performance indicators to track campaign performance and strategic goals achievement. It includes elements such as click through rate, conversion rate, engagement rate, lifetime value, return on as spend etc.From laying roadmaps to briefing everything in detail, our templates are perfect for you. You can set the stage with your presentation slides. All you have to do is download these easy-to-edit and customizable templates. Measure Ad Campaign Results With KPIs Evaluating Strengths And Weaknesses Elements Pdf will help you deliver an outstanding performance that everyone would remember and praise you for. Do download this presentation today. The following slide depicts some key performance indicators to track campaign performance and strategic goals achievement. It includes elements such as click through rate, conversion rate, engagement rate, lifetime value, return on as spend etc.
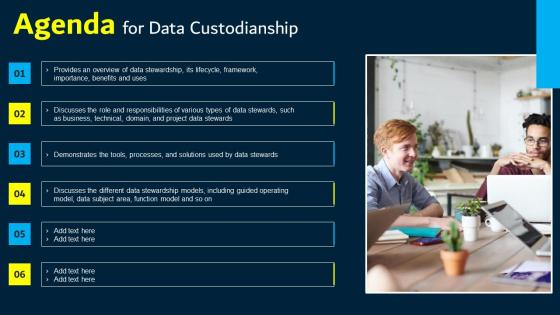
Agenda For Data Custodianship Professional Pdf
Whether you have daily or monthly meetings, a brilliant presentation is necessary. Agenda For Data Custodianship Professional Pdf can be your best option for delivering a presentation. Represent everything in detail using Agenda For Data Custodianship Professional Pdf and make yourself stand out in meetings. The template is versatile and follows a structure that will cater to your requirements. All the templates prepared by Slidegeeks are easy to download and edit. Our research experts have taken care of the corporate themes as well. So, give it a try and see the results. Our Agenda For Data Custodianship Professional Pdf are topically designed to provide an attractive backdrop to any subject. Use them to look like a presentation pro.
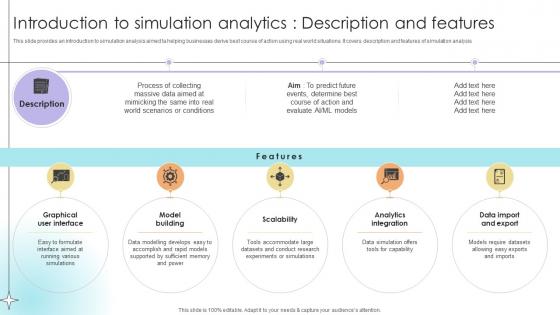
Introduction To Simulation Analytics Description And Features Data Analytics SS V
This slide provides an introduction to simulation analysis aimed ta helping businesses derive best course of action using real world situations. It covers description and features of simulation analysis. From laying roadmaps to briefing everything in detail, our templates are perfect for you. You can set the stage with your presentation slides. All you have to do is download these easy-to-edit and customizable templates. Introduction To Simulation Analytics Description And Features Data Analytics SS V will help you deliver an outstanding performance that everyone would remember and praise you for. Do download this presentation today. This slide provides an introduction to simulation analysis aimed ta helping businesses derive best course of action using real world situations. It covers description and features of simulation analysis
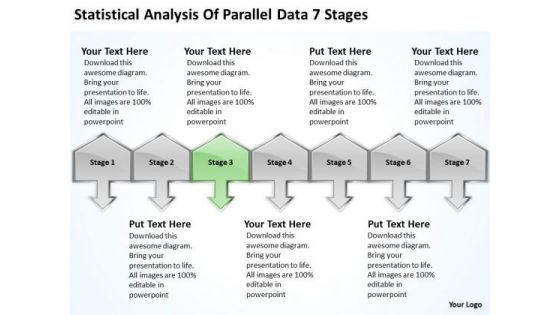
Analysis Of Parallel Data 7 Stages Ppt Franchise Business Plan Sample PowerPoint Slides
We present our analysis of parallel data 7 stages ppt franchise business plan sample PowerPoint Slides.Download our Arrows PowerPoint Templates because You have gained great respect for your brilliant ideas. Use our PowerPoint Templates and Slides to strengthen and enhance your reputation. Download and present our Shapes PowerPoint Templates because you can see clearly through to the bigger bowl ahead. Time your jump to perfection and hit the nail on the head. Download our Metaphors-Visual Concepts PowerPoint Templates because you know that the core of any organisation is the people who work for it. Use our Signs PowerPoint Templates because support groups are an essential element of the on going struggle against cancer. Download our Business PowerPoint Templates because this diagram can set an example to enthuse your team with the passion and fervour of your ideas.Use these PowerPoint slides for presentations relating to achieve, achievement, action, business, chinese, company, concept, conceptual, corporate, definition, idea, macro, market, nature, organization, paintbrush, plan, profit, research, results, sand, shape, single, success, successful, symbol, text, translation, treasure, vision, word. The prominent colors used in the PowerPoint template are Green, Gray, Black. People tell us our analysis of parallel data 7 stages ppt franchise business plan sample PowerPoint Slides are Quaint. Use our action PowerPoint templates and PPT Slides are Nifty. Use our analysis of parallel data 7 stages ppt franchise business plan sample PowerPoint Slides are Ultra. PowerPoint presentation experts tell us our corporate PowerPoint templates and PPT Slides are Magical. People tell us our analysis of parallel data 7 stages ppt franchise business plan sample PowerPoint Slides are Spiffy. Customers tell us our corporate PowerPoint templates and PPT Slides are Dynamic. Preach the value of good business ethics. Our Analysis Of Parallel Data 7 Stages Ppt Franchise Business Plan Sample PowerPoint Slides will keep the faith.
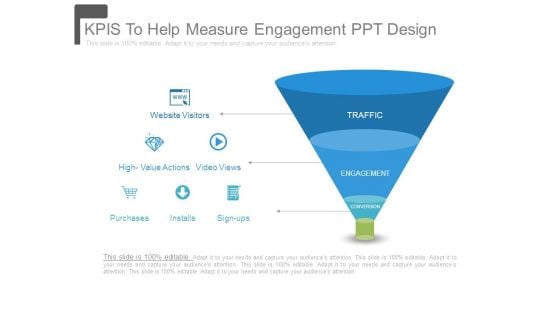
Kpis To Help Measure Engagement Ppt Design
This is a kpis to help measure engagement ppt design. This is a three stage process. The stages in this process are traffic, engagement, conversion, website visitors, high value actions, video views, purchases, installs, sign ups.

Data Warehousing And Data Mining Vs Machine Learning Comparative Analysis AI SS V
This slide showcases comparative analysis of data mining and machine learning, helping researchers finalize which methods or blend is best for their operations. It provides information about meaning, human intervention, purpose and use cases. Create an editable Data Warehousing And Data Mining Vs Machine Learning Comparative Analysis AI SS V that communicates your idea and engages your audience. Whether you are presenting a business or an educational presentation, pre-designed presentation templates help save time. Data Warehousing And Data Mining Vs Machine Learning Comparative Analysis AI SS V is highly customizable and very easy to edit, covering many different styles from creative to business presentations. Slidegeeks has creative team members who have crafted amazing templates. So, go and get them without any delay. This slide showcases comparative analysis of data mining and machine learning, helping researchers finalize which methods or blend is best for their operations. It provides information about meaning, human intervention, purpose and use cases.


 Continue with Email

 Home
Home


