Benefits Dashboard
Tracking Goals Achievement Status Dashboard Themes PDF
This slide showcases the objective status report, which helps track current the percentage of the targets achieved and left. It also includes the number of overdue targets and unachieved departmental goals. Pitch your topic with ease and precision using this Tracking Goals Achievement Status Dashboard Themes PDF. This layout presents information on Achieved Objectives, Unachieved Objectives, Overdue. It is also available for immediate download and adjustment. So, changes can be made in the color, design, graphics or any other component to create a unique layout.
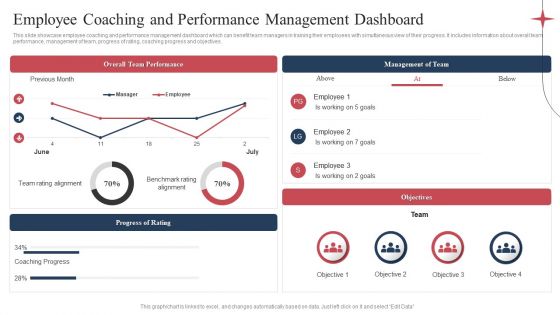
Employee Coaching And Performance Management Dashboard Microsoft PDF
This slide showcase employee coaching and performance management dashboard which can benefit team managers in training their employees with simultaneous view of their progress. It includes information about overall team performance, management of team, progress of rating, coaching progress and objectives. Showcasing this set of slides titled Employee Coaching And Performance Management Dashboard Microsoft PDF. The topics addressed in these templates are Overall Team Performance, Management Of Team, Objectives, Progress Of Rating. All the content presented in this PPT design is completely editable. Download it and make adjustments in color, background, font etc. as per your unique business setting.
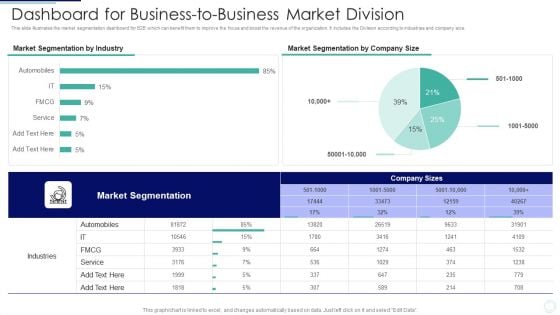
Dashboard For Business To Business Market Division Inspiration PDF
This slide illustrates the market segmentation dashboard for B2B which can benefit them to improve the focus and boost the revenue of the organization. It includes the Division according to industries and company size. Showcasing this set of slides titled Dashboard For Business To Business Market Division Inspiration PDF. The topics addressed in these templates are Industries, Service, Automobiles. All the content presented in this PPT design is completely editable. Download it and make adjustments in color, background, font etc. as per your unique business setting.
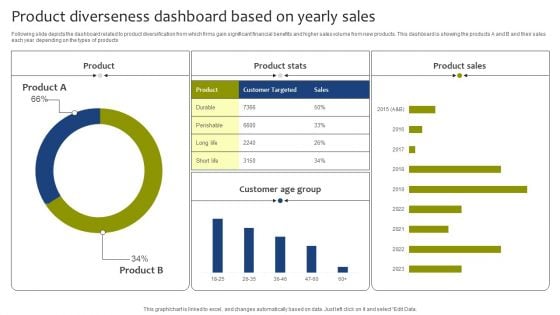
Product Diverseness Dashboard Based On Yearly Sales Graphics PDF
Following slide depicts the dashboard related to product diversification from which firms gain significant financial benefits and higher sales volume from new products. This dashboard is showing the products A and B and their sales each year depending on the types of products. Showcasing this set of slides titled Product Diverseness Dashboard Based On Yearly Sales Graphics PDF. The topics addressed in these templates areProduct Stats, Product Sales, Customer Age Group . All the content presented in this PPT design is completely editable. Download it and make adjustments in color, background, font etc. as per your unique business setting.
Retail Assortment Dashboard Depicting Store Performance Ppt Icon Structure PDF
This slide shows product assortment dashboard depicting store performance which can benefit managers in reviewing the current situation of outlets and make decisions according to reached benchmarks. It includes details about achieved sales, rate of conversion, weekday vs. Weekend sales, daily trend, etc. Showcasing this set of slides titled Retail Assortment Dashboard Depicting Store Performance Ppt Icon Structure PDF. The topics addressed in these templates are Achieved Sales, Rate Of Conversion, Daily Trend, Outlet Sales. All the content presented in this PPT design is completely editable. Download it and make adjustments in color, background, font etc. as per your unique business setting.
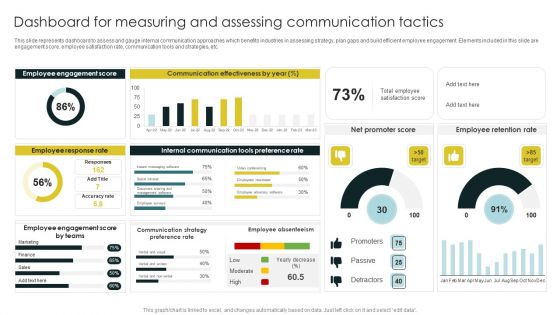
Dashboard For Measuring And Assessing Communication Tactics Information PDF
This slide represents dashboard to assess and gauge internal communication approaches which benefits industries in assessing strategy, plan gaps and build efficient employee engagement. Elements included in this slide are engagement score, employee satisfaction rate, communication tools and strategies, etc. Showcasing this set of slides titled Dashboard For Measuring And Assessing Communication Tactics Information PDF. The topics addressed in these templates are Employee Engagement, Employee Response Rate, Communication Effectiveness. All the content presented in this PPT design is completely editable. Download it and make adjustments in color, background, font etc. as per your unique business setting.
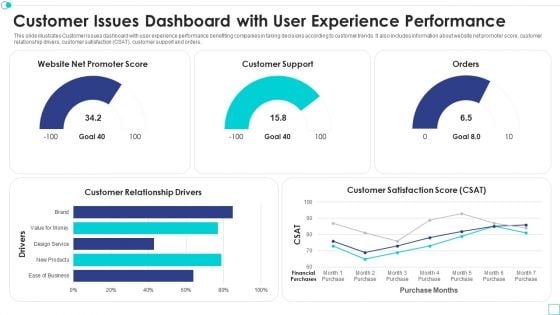
Customer Issues Dashboard With User Experience Performance Graphics PDF
This slide illustrates Customer Issues dashboard with user experience performance benefiting companies in taking decisions according to customer trends. It also includes information about website net promoter score, customer relationship drivers, customer satisfaction CSAT, customer support and orders. Showcasing this set of slides titled customer issues dashboard with user experience performance graphics pdf. The topics addressed in these templates are customer issues dashboard with user experience performance. All the content presented in this PPT design is completely editable. Download it and make adjustments in color, background, font etc. as per your unique business setting.
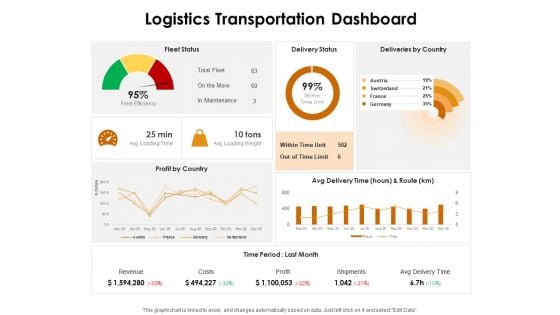
KPI Dashboards Per Industry Logistics Transportation Dashboard Ppt PowerPoint Presentation Portfolio Show PDF
Deliver an awe-inspiring pitch with this creative kpi dashboards per industry logistics transportation dashboard ppt powerpoint presentation portfolio show pdf bundle. Topics like fleet status, delivery status, delivery country, profit country, avg delivery time hours and route can be discussed with this completely editable template. It is available for immediate download depending on the needs and requirements of the user.
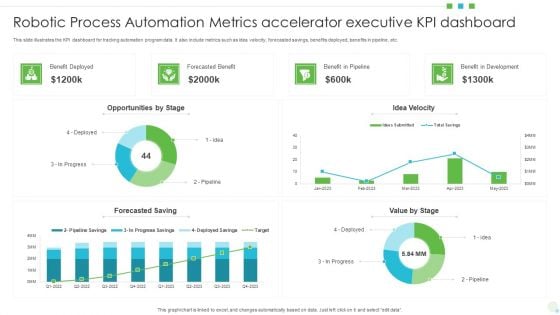
Robotic Process Automation Metrics Accelerator Executive KPI Dashboard Formats PDF
This slide illustrates the KPI dashboard for tracking automation program data. It also include metrics such as idea velocity, forecasted savings, benefits deployed, benefits in pipeline, etc. Showcasing this set of slides titled Robotic Process Automation Metrics Accelerator Executive KPI Dashboard Formats PDF. The topics addressed in these templates are Opportunities, Benefit In Development, Value. All the content presented in this PPT design is completely editable. Download it and make adjustments in color, background, font etc. as per your unique business setting.
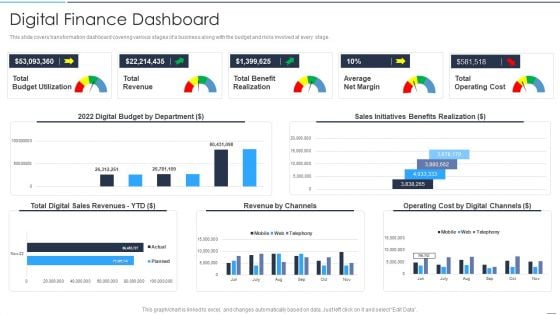
Accelerate Online Journey Now Digital Finance Dashboard Graphics PDF
This slide covers transformation dashboard covering various stages of a business along with the budget and risks involved at every stage.Deliver and pitch your topic in the best possible manner with this Accelerate Online Journey Now Digital Finance Dashboard Graphics PDF Use them to share invaluable insights on Budget Utilization, Benefit Realization, Initiatives Benefits and impress your audience. This template can be altered and modified as per your expectations. So, grab it now.
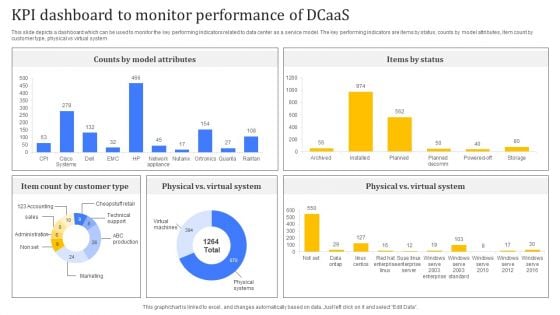
KPI Dashboard To Monitor Performance Of Dcaas Pictures PDF
Following slide highlights major benefits of applying data center as a service to business operations which can be used by businesses looking to modernize their IT infrastructure. Major benefits are in terms of scalability, flexibility, cost effectiveness, and security. Pitch your topic with ease and precision using this KPI Dashboard To Monitor Performance Of Dcaas Pictures PDF. This layout presents information on Customer Type, Counts By Model Attributes, Items By Status. It is also available for immediate download and adjustment. So, changes can be made in the color, design, graphics or any other component to create a unique layout.
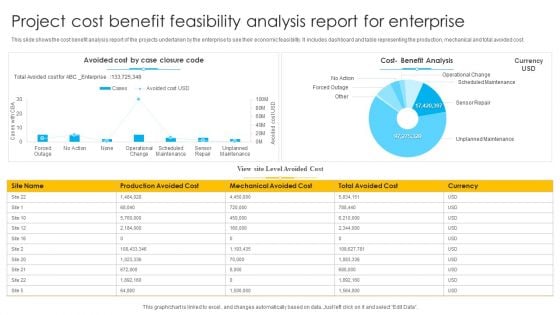
Project Cost Benefit Feasibility Analysis Report For Enterprise Ppt Layouts Background Image PDF
This slide shows the cost benefit analysis report of the projects undertaken by the enterprise to see their economic feasibility. It includes dashboard and table representing the production, mechanical and total avoided cost. Showcasing this set of slides titled Project Cost Benefit Feasibility Analysis Report For Enterprise Ppt Layouts Background Image PDF. The topics addressed in these templates are Avoided Cost, Case Closure Code, Cost Benefit Analysis, Total Avoided Cost. All the content presented in this PPT design is completely editable. Download it and make adjustments in color, background, font etc. as per your unique business setting.
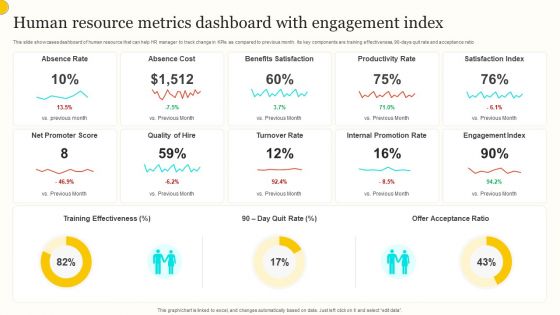
Human Resource Metrics Dashboard With Engagement Index Guidelines PDF
This slide showcases dashboard of human resource that can help HR manager to track change in KPIs as compared to previous month. Its key components are training effectiveness, 90 days quit rate and acceptance ratio. Pitch your topic with ease and precision using this Human Resource Metrics Dashboard With Engagement Index Guidelines PDF. This layout presents information on Absence Rate, Absence Cost, Benefits Satisfaction. It is also available for immediate download and adjustment. So, changes can be made in the color, design, graphics or any other component to create a unique layout.
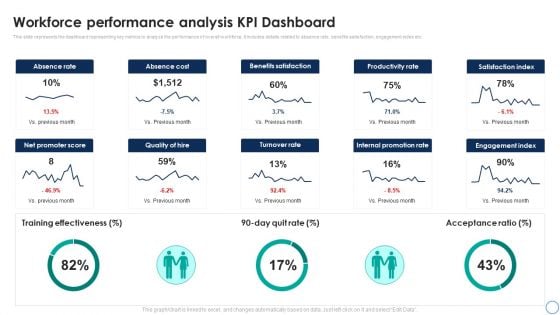
Business Analytics Application Workforce Performance Analysis KPI Dashboard Template PDF
This slide represents the dashboard representing key metrics to analyze the performance of overall workforce. It includes details related to absence rate, benefits satisfaction, engagement index etc. Take your projects to the next level with our ultimate collection of Business Analytics Application Workforce Performance Analysis KPI Dashboard Template PDF. Slidegeeks has designed a range of layouts that are perfect for representing task or activity duration, keeping track of all your deadlines at a glance. Tailor these designs to your exact needs and give them a truly corporate look with your own brand colors theyll make your projects stand out from the rest.
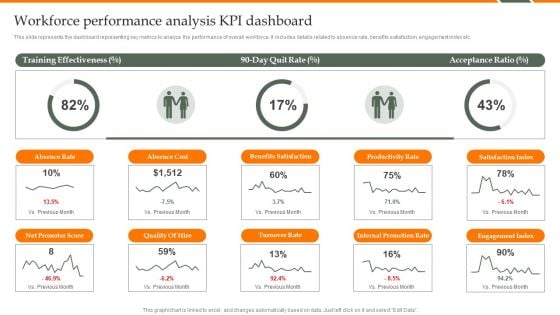
Human Resource Analytics Workforce Performance Analysis KPI Dashboard Structure PDF
This slide represents the dashboard representing key metrics to analyze the performance of overall workforce. It includes details related to absence rate, benefits satisfaction, engagement index etc. Find a pre-designed and impeccable Human Resource Analytics Workforce Performance Analysis KPI Dashboard Structure PDF. The templates can ace your presentation without additional effort. You can download these easy-to-edit presentation templates to make your presentation stand out from others. So, what are you waiting for Download the template from Slidegeeks today and give a unique touch to your presentation.
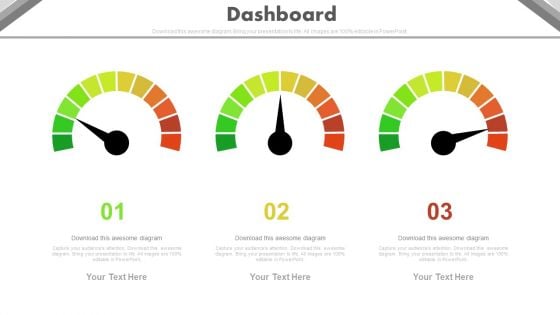
Three Steps Dashboard Charts For Financial Review Powerpoint Slides
This PowerPoint template has been designed with three dashboards. Use this PPT slide to depict financial review and plan. This professional diagram slide will help you express your views to target audience.
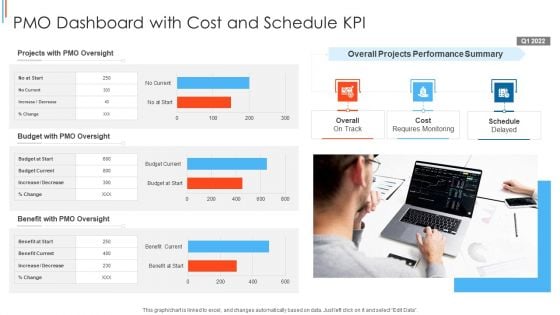
PMO Dashboard With Cost And Schedule KPI Template PDF
Showcasing this set of slides titled PMO Dashboard With Cost And Schedule KPI Themes PDF The topics addressed in these templates are Projects With Pmo Oversight, Budget With Pmo Oversight, Benefit With Pmo Oversight All the content presented in this PPT design is completely editable. Download it and make adjustments in color, background, font etc. as per your unique business setting.
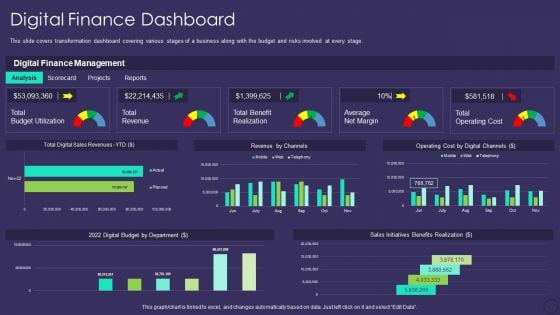
Comprehensive Business Digitization Deck Digital Finance Dashboard Demonstration PDF
This slide covers transformation dashboard covering various stages of a business along with the budget and risks involved at every stage. Deliver and pitch your topic in the best possible manner with this comprehensive business digitization deck digital finance dashboard demonstration pdf. Use them to share invaluable insights on budget utilization, revenue, benefit realization, average net margin, operating cost and impress your audience. This template can be altered and modified as per your expectations. So, grab it now.
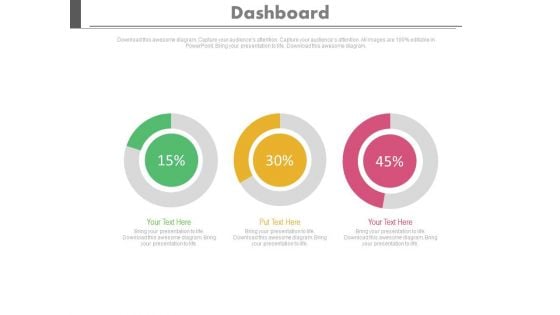
Three Dashboard With Percentage Value Growth Powerpoint Slides
This PowerPoint template has been designed with three dashboards. Use this PPT slide to depict rise in business profit. This professional diagram slide will help you express your views to target audience.
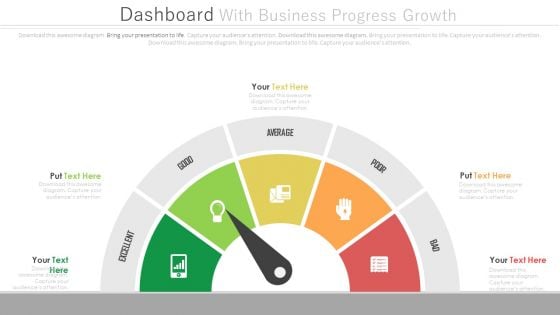
Dashboard To Simplify Business Data Analysis Powerpoint Slides
This PowerPoint template graphics of meter chart. Download this PPT chart to simplify business data analysis. This PowerPoint slide is of great help in the business sector to make realistic presentations and provides effective way of presenting your newer thoughts.
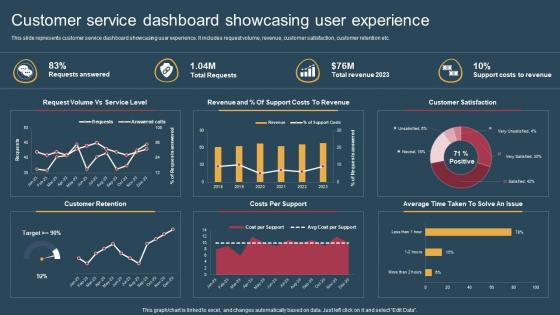
Customer Service Dashboard Conversion Of Customer Support Services Pictures Pdf
This slide represents customer service dashboard showcasing user experience. It includes request volume, revenue, customer satisfaction, customer retention etc. Get a simple yet stunning designed Customer Service Dashboard Conversion Of Customer Support Services Pictures Pdf. It is the best one to establish the tone in your meetings. It is an excellent way to make your presentations highly effective. So, download this PPT today from Slidegeeks and see the positive impacts. Our easy to edit Customer Service Dashboard Conversion Of Customer Support Services Pictures Pdf can be your go to option for all upcoming conferences and meetings. So, what are you waiting for Grab this template today. This slide represents customer service dashboard showcasing user experience. It includes request volume, revenue, customer satisfaction, customer retention etc.
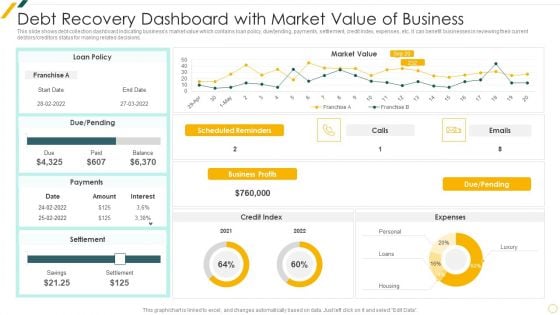
Debt Recovery Dashboard With Market Value Of Business Template PDF
This slide shows debt collection dashboard indicating businesss market value which contains loan policy, due ending, payments, settlement, credit index, expenses, etc. It can benefit businesses in reviewing their current debtors creditors status for making related decisions.Showcasing this set of slides titled Debt Recovery Dashboard With Market Value Of Business Template PDF The topics addressed in these templates are Debt Recovery, Dashboard Market, Value Of Business All the content presented in this PPT design is completely editable. Download it and make adjustments in color, background, font etc. as per your unique business setting.
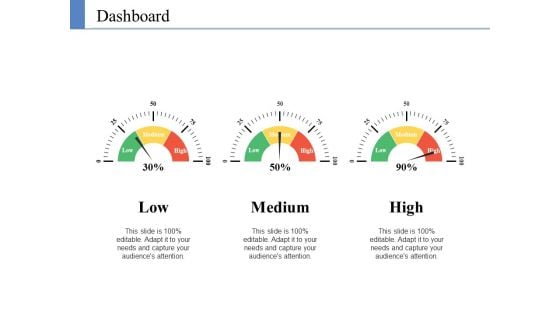
Dashboard Ppt PowerPoint Presentation Infographic Template Visual Aids
This is a dashboard ppt powerpoint presentation infographic template visual aids. This is a three stage process. The stages in this process are low, medium, high.
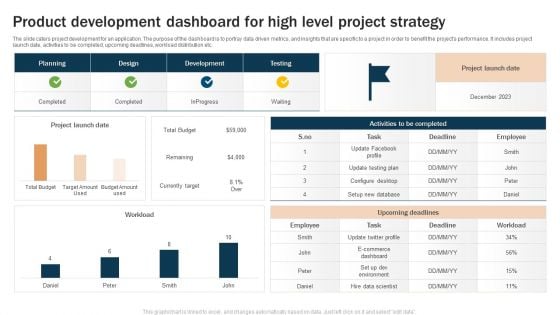
Product Development Dashboard For High Level Project Strategy Microsoft PDF
The slide caters project development for an application. The purpose of the dashboard is to portray data driven metrics, and insights that are specific to a project in order to benefit the projects performance. It includes project launch date, activities to be completed, upcoming deadlines, workload distribution etc. Showcasing this set of slides titled Product Development Dashboard For High Level Project Strategy Microsoft PDF. The topics addressed in these templates are Upcoming Deadlines, Project Launch, Upcoming Deadlines. All the content presented in this PPT design is completely editable. Download it and make adjustments in color, background, font etc. as per your unique business setting.
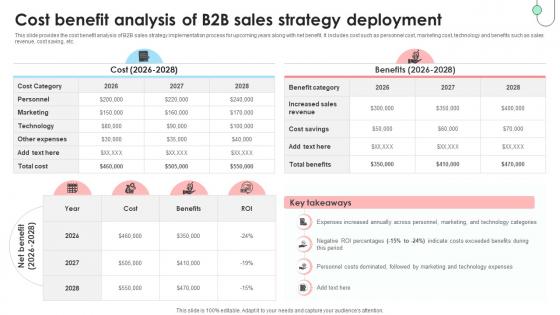
Navigating B2B Sales Cost Benefit Analysis Of B2B Sales Strategy Deployment SA SS V
This slide provides the cost benefit analysis of B2B sales strategy implementation process for upcoming years along with net benefit. It includes cost such as personnel cost, marketing cost, technology and benefits such as sales revenue, cost saving, etc. The Navigating B2B Sales Cost Benefit Analysis Of B2B Sales Strategy Deployment SA SS V is a compilation of the most recent design trends as a series of slides. It is suitable for any subject or industry presentation, containing attractive visuals and photo spots for businesses to clearly express their messages. This template contains a variety of slides for the user to input data, such as structures to contrast two elements, bullet points, and slides for written information. Slidegeeks is prepared to create an impression. This slide provides the cost benefit analysis of B2B sales strategy implementation process for upcoming years along with net benefit. It includes cost such as personnel cost, marketing cost, technology and benefits such as sales revenue, cost saving, etc.
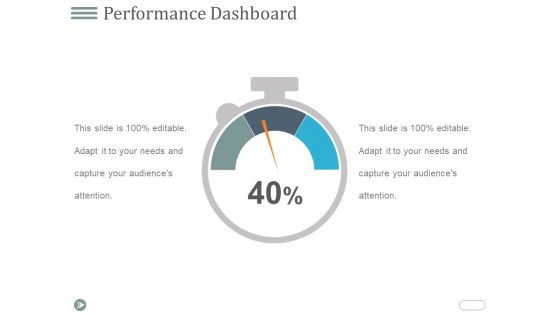
Performance Dashboard Ppt PowerPoint Presentation Visual Aids Example 2015
This is a performance dashboard ppt powerpoint presentation visual aids example 2015. This is a one stage process. The stages in this process are dashboard, percentage, business, marketing, strategy.
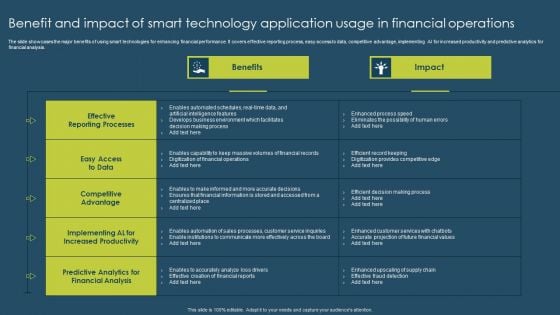
Benefit And Impact Of Smart Technology Application Usage In Financial Operations Summary PDF
The slide showcases the major benefits of using smart technologies for enhancing financial performance. It covers effective reporting process, easy access to data, competitive advantage, implementing AI for increased productivity and predictive analytics for financial analysis. Showcasing this set of slides titled Benefit And Impact Of Smart Technology Application Usage In Financial Operations Summary PDF. The topics addressed in these templates are Benefits, Impact. All the content presented in this PPT design is completely editable. Download it and make adjustments in color, background, font etc. as per your unique business setting.
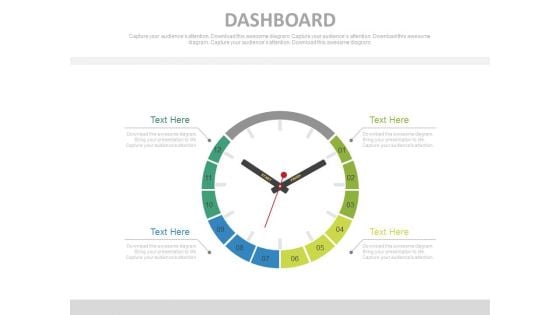
Clock Dashboard Design For Time Management Powerpoint Slides
This innovative, stunningly beautiful template has been designed with graphics of clock dashboard. It helps to portray concepts of time planning and management. This PowerPoint template helps to display your information in a useful, simple and orderly way.
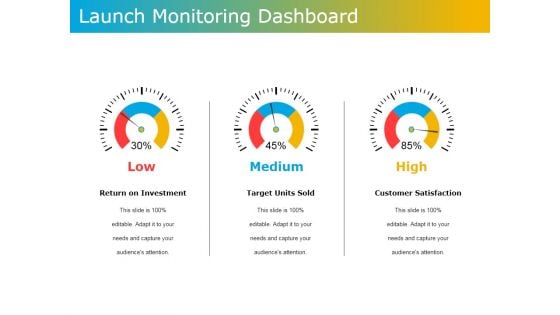
Launch Monitoring Dashboard Ppt PowerPoint Presentation File Aids
This is a launch monitoring dashboard ppt powerpoint presentation file aids. This is a three stage process. The stages in this process are return on investment, target units sold, customer satisfaction, medium, high.
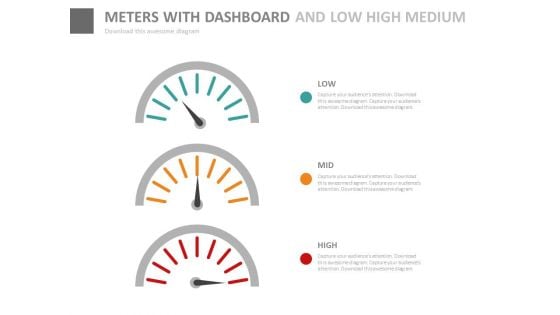
Dashboard With Low High Medium Indication Powerpoint Slides
This innovative, stunningly beautiful dashboard has been designed for data visualization. It contains dashboard with low, high and medium indication. This PowerPoint template helps to display your information in a useful, simple and orderly way.
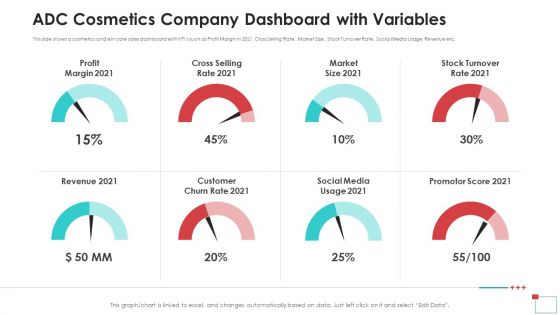
ADC Cosmetics Company Dashboard With Variables Introduction PDF
This slide shows a cosmetics and skin care sales dashboard with KPIs such as Profit Margin in 2021, Cross Selling Rate, Market Size, Stock Turnover Rate, Social Media Usage, Revenue etc. Presenting adc cosmetics company dashboard with variables introduction pdf to provide visual cues and insights. Share and navigate important information on eight stages that need your due attention. This template can be used to pitch topics like profit margin, revenue, market size, social media, promotor score. In addition, this PPT design contains high-resolution images, graphics, etc, that are easily editable and available for immediate download.
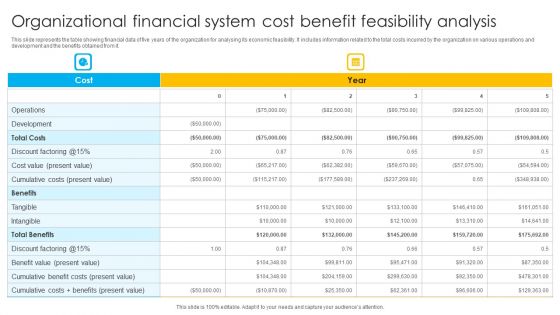
Organizational Financial System Cost Benefit Feasibility Analysis Ppt Outline Summary PDF
This slide represents the table showing financial data of five years of the organization for analysing its economic feasibility. It includes information related to the total costs incurred by the organization on various operations and development and the benefits obtained from it. Showcasing this set of slides titled Organizational Financial System Cost Benefit Feasibility Analysis Ppt Outline Summary PDF. The topics addressed in these templates are Operations, Cost, Development. All the content presented in this PPT design is completely editable. Download it and make adjustments in color, background, font etc. as per your unique business setting.
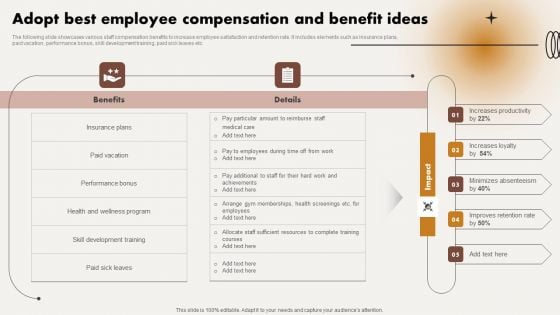
Adopt Best Employee Compensation And Benefit Ideas Ppt Infographics Graphics Example PDF
The following slide showcases various staff compensation benefits to increase employee satisfaction and retention rate. It includes elements such as insurance plans, paid vacation, performance bonus, skill development training, paid sick leaves etc. Presenting this PowerPoint presentation, titled Adopt Best Employee Compensation And Benefit Ideas Ppt Infographics Graphics Example PDF, with topics curated by our researchers after extensive research. This editable presentation is available for immediate download and provides attractive features when used. Download now and captivate your audience. Presenting this Adopt Best Employee Compensation And Benefit Ideas Ppt Infographics Graphics Example PDF. Our researchers have carefully researched and created these slides with all aspects taken into consideration. This is a completely customizable Adopt Best Employee Compensation And Benefit Ideas Ppt Infographics Graphics Example PDF that is available for immediate downloading. Download now and make an impact on your audience. Highlight the attractive features available with our PPTs.
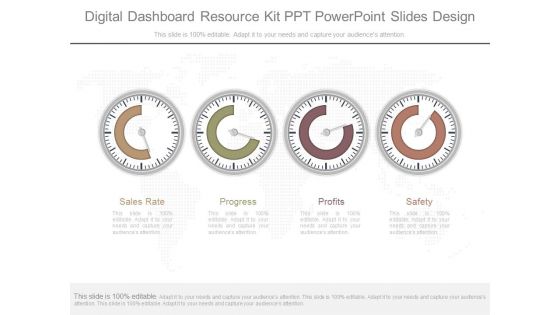
Digital Dashboard Resource Kit Ppt Powerpoint Slides Design
This is a digital dashboard resource kit ppt powerpoint slides design. This is a four stage process. The stages in this process are sales rate, progress, profits, safety.
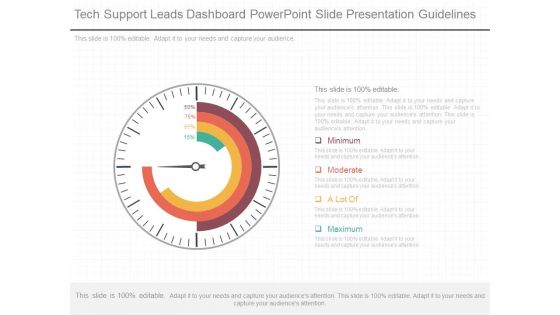
Tech Support Leads Dashboard Powerpoint Slide Presentation Guidelines
This is a tech support leads dashboard powerpoint slide presentation guidelines. This is a four stage process. The stages in this process are minimum, moderate, a lot of, maximum.
Impact Of Cost Benefit Feasibility On Project Management Icon Ppt Gallery Information PDF
Presenting Impact Of Cost Benefit Feasibility On Project Management Icon Ppt Gallery Information PDF to dispense important information. This template comprises three stages. It also presents valuable insights into the topics including Impact Cost, Benefit Feasibility, Project Management, Icon. This is a completely customizable PowerPoint theme that can be put to use immediately. So, download it and address the topic impactfully.
Benefit Of Block Chain Technology For Securing Confidential Data Icon Topics PDF
Presenting Benefit Of Block Chain Technology For Securing Confidential Data Icon Topics PDF to dispense important information. This template comprises four stages. It also presents valuable insights into the topics including Benefit Of Block Chain, Technology For Securing, Confidential Data Icon This is a completely customizable PowerPoint theme that can be put to use immediately. So, download it and address the topic impactfully.
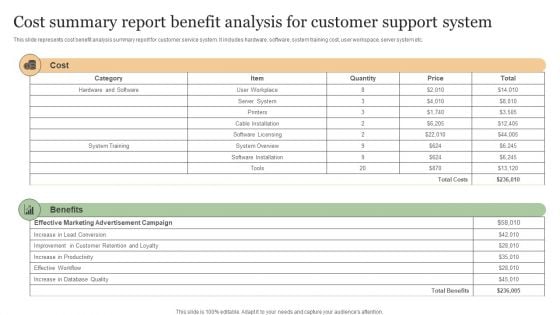
Cost Summary Report Benefit Analysis For Customer Support System Ideas PDF
This slide represents cost benefit analysis summary report for customer service system. It includes hardware, software, system training cost, user workspace, server system etc. Showcasing this set of slides titled Cost Summary Report Benefit Analysis For Customer Support System Ideas PDF. The topics addressed in these templates are Effective Marketing, Advertisement Campaign, Increase In Productivity. All the content presented in this PPT design is completely editable. Download it and make adjustments in color, background, font etc. as per your unique business setting.
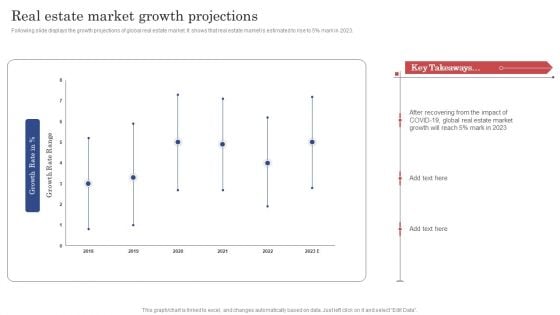
Construction Project Cost Benefit Analysis Report Real Estate Market Growth Projections Rules PDF
Following slide displays the growth projections of global real estate market. It shows that real estate market is estimated to rise to 5 percent mark in 2023. The Construction Project Cost Benefit Analysis Report Real Estate Market Growth Projections Rules PDF is a compilation of the most recent design trends as a series of slides. It is suitable for any subject or industry presentation, containing attractive visuals and photo spots for businesses to clearly express their messages. This template contains a variety of slides for the user to input data, such as structures to contrast two elements, bullet points, and slides for written information. Slidegeeks is prepared to create an impression.
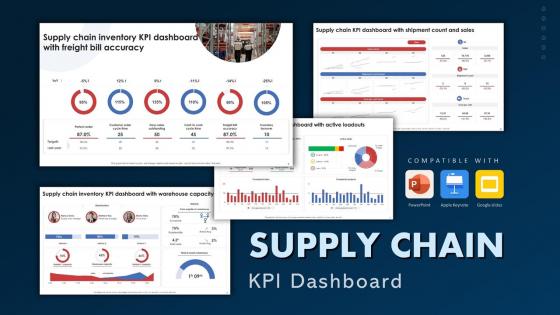
Supply Chain KPI Dashboard Powerpoint Ppt Template Bundles
Use this Supply Chain KPI Dashboard Powerpoint Ppt Template Bundles to ensure the business world gets to know you as a presentation expert with tremendous recall value. With its focus on providing the worlds best designs to highlight business ideas that have the potential to change the world, this PPT Template is sure to win you clients. The complete deck in Freight Bill KPI, Warehouse Capacity, Average Purchase Value, Supply Chain Metrics, Total Savings slides is a compendium of information, structured in a manner that provides the best framework for a presentation. Use this completely editable and customizable presentation to make an impact and improve your order book. Download now. Supply chain KPIs key performance indicators are metrics that measure the performance of a supply chain and help with decision-making. Our Supply Chain KPI Dashboard Powerpoint Ppt Template Bundles are topically designed to provide an attractive backdrop to any subject.
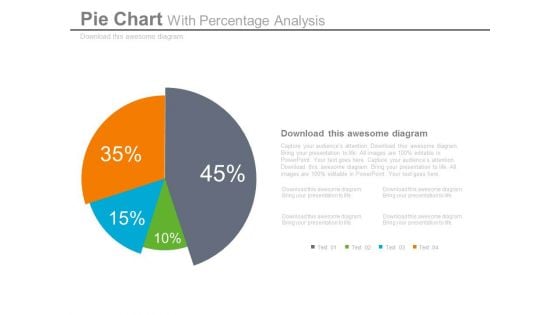
Pie Chart Dashboard Style For Percentage Analysis Powerpoint Slides
This dashboard PPT template contains graphics of pie chart. This dashboard PowerPoint template helps to display percentage analysis in a visual manner. Download this PPT slide for quick decision-making.
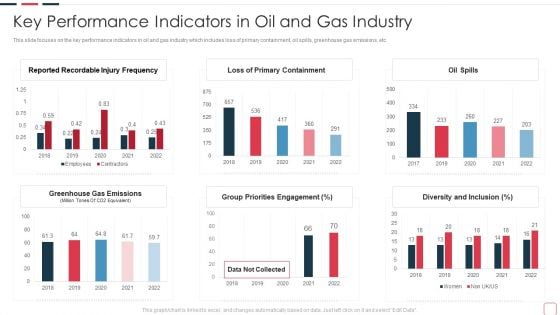
Price Benefit Internet Things Digital Twins Execution After Covid Key Performance Indicators In Oil Slides PDF
This slide focuses on the key performance indicators in oil and gas industry which includes loss of primary containment, oil spills, greenhouse gas emissions, etc. Deliver an awe inspiring pitch with this creative price benefit internet things digital twins execution after covid key performance indicators in oil slides pdf bundle. Topics like key performance indicators in oil and gas industry can be discussed with this completely editable template. It is available for immediate download depending on the needs and requirements of the user.
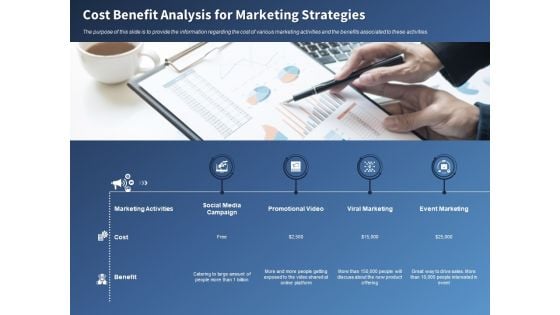
Performance Assessment Sales Initiative Report Cost Benefit Analysis For Marketing Strategies Ppt Layouts Brochure PDF
Presenting this set of slides with name performance assessment sales initiative report cost benefit analysis for marketing strategies ppt layouts brochure pdf. This is a four stage process. The stages in this process are marketing, cost, social media, campaign, marketing. This is a completely editable PowerPoint presentation and is available for immediate download. Download now and impress your audience.
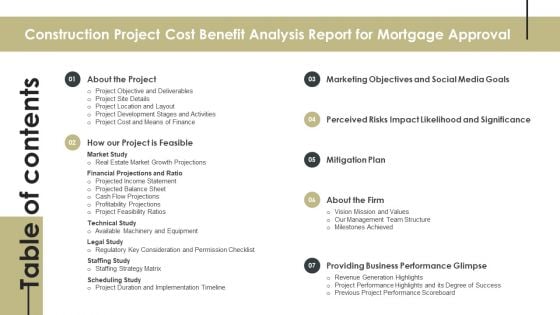
Table Of Contents For Construction Project Cost Benefit Analysis Report For Mortgage Approval Download PDF
The Table Of Contents For Construction Project Cost Benefit Analysis Report For Mortgage Approval Download PDF is a compilation of the most recent design trends as a series of slides. It is suitable for any subject or industry presentation, containing attractive visuals and photo spots for businesses to clearly express their messages. This template contains a variety of slides for the user to input data, such as structures to contrast two elements, bullet points, and slides for written information. Slidegeeks is prepared to create an impression.
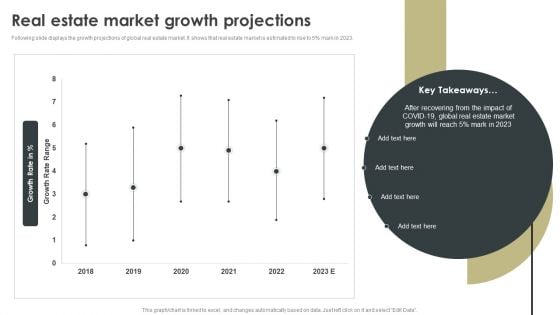
Construction Project Cost Benefit Analysis Report For Mortgage Approval Real Estate Market Growth Projections Formats PDF
Following slide displays the growth projections of global real estate market. It shows that real estate market is estimated to rise to 5 percent mark in 2023. Get a simple yet stunning designed Construction Project Cost Benefit Analysis Report For Mortgage Approval Real Estate Market Growth Projections Formats PDF. It is the best one to establish the tone in your meetings. It is an excellent way to make your presentations highly effective. So, download this PPT today from Slidegeeks and see the positive impacts. Our easy to edit Construction Project Cost Benefit Analysis Report For Mortgage Approval Real Estate Market Growth Projections Formats PDF can be your go to option for all upcoming conferences and meetings. So, what are you waiting for Grab this template today.
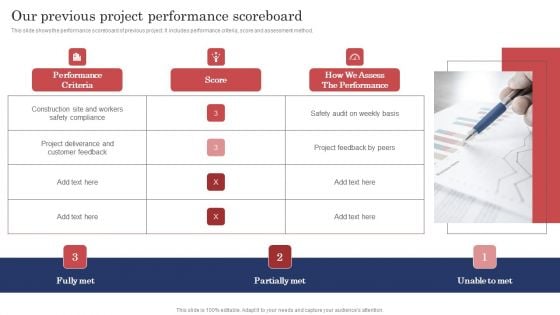
Construction Project Cost Benefit Analysis Report Our Previous Project Performance Scoreboard Infographics PDF
This slide shows the performance scoreboard of previous project. It includes performance criteria, score and assessment method. Do you have to make sure that everyone on your team knows about any specific topic I yes, then you should give Construction Project Cost Benefit Analysis Report Our Previous Project Performance Scoreboard Infographics PDF a try. Our experts have put a lot of knowledge and effort into creating this impeccable Construction Project Cost Benefit Analysis Report Our Previous Project Performance Scoreboard Infographics PDF. You can use this template for your upcoming presentations, as the slides are perfect to represent even the tiniest detail. You can download these templates from the Slidegeeks website and these are easy to edit. So grab these today.
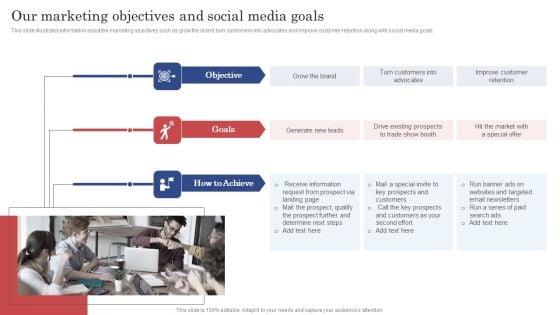
Construction Project Cost Benefit Analysis Report Our Marketing Objectives And Social Media Goals Themes PDF
This slide illustrates information about the marketing objectives such as grow the brand, turn customers into advocates and improve customer retention along with social media goals. There are so many reasons you need a Construction Project Cost Benefit Analysis Report Our Marketing Objectives And Social Media Goals Themes PDF. The first reason is you can not spend time making everything from scratch, Thus, Slidegeeks has made presentation templates for you too. You can easily download these templates from our website easily.
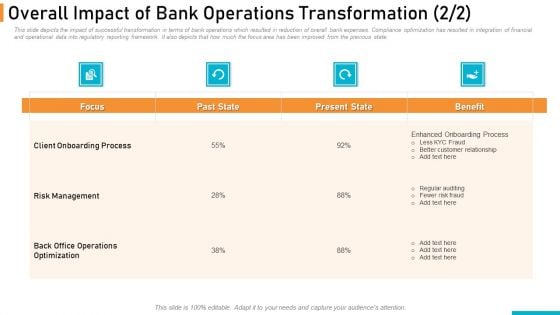
Executing Online Solution In Banking Overall Impact Of Bank Operations Transformation Benefit Designs PDF
This slide depicts the impact of successful transformation in terms of bank operations which resulted in reduction of overall bank expenses. Compliance optimization has resulted in integration of financial and operational data into regulatory reporting framework. It also depicts that how much the focus area has been improved from the previous state.Deliver and pitch your topic in the best possible manner with this executing online solution in banking overall impact of bank operations transformation benefit designs pdf. Use them to share invaluable insights on risk management, client onboarding process, back office operations optimization and impress your audience. This template can be altered and modified as per your expectations. So, grab it now.
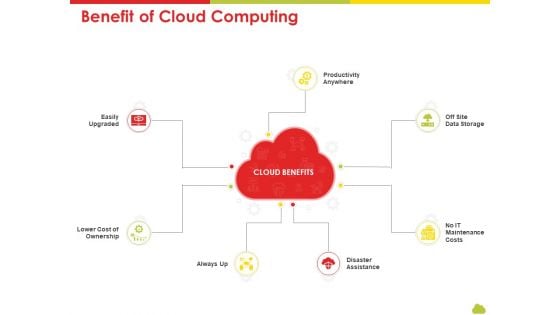
Mesh Computing Technology Hybrid Private Public Iaas Paas Saas Workplan Benefit Of Cloud Computing Infographics PDF
Presenting mesh computing technology hybrid private public iaas paas saas workplan benefit of cloud computing infographics pdf to provide visual cues and insights. Share and navigate important information on seven stages that need your due attention. This template can be used to pitch topics like maintenance, costs, data storage, disaster assistance. In addtion, this PPT design contains high resolution images, graphics, etc, that are easily editable and available for immediate download.
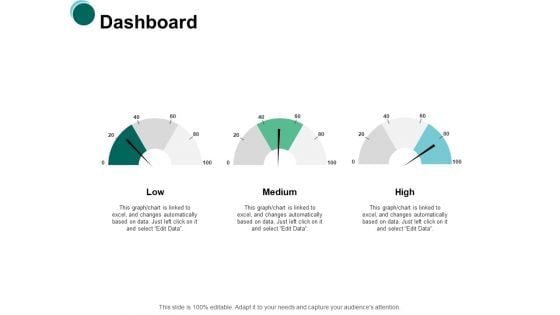
Dashboard Meausrement Ppt PowerPoint Presentation Portfolio Visual Aids
Presenting this set of slides with name dashboard meausrement ppt powerpoint presentation portfolio visual aids. This is a stage process. The stages in this process are dashboard, marketing, management, investment, analysis. This is a completely editable PowerPoint presentation and is available for immediate download. Download now and impress your audience.
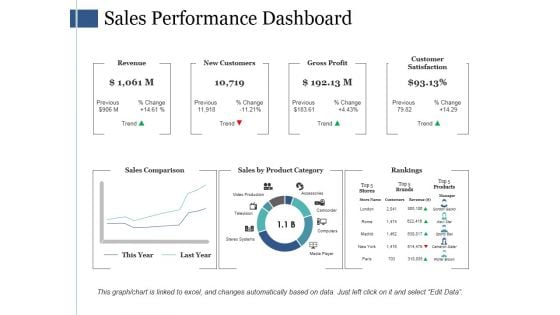
Sales Performance Dashboard Ppt PowerPoint Presentation Ideas Portfolio
This is a sales performance dashboard ppt powerpoint presentation ideas portfolio. This is a three stage process. The stages in this process are revenue, new customers, gross profit, customer satisfaction, sales comparison.
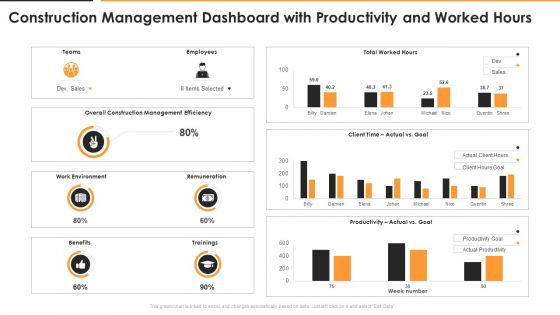
Construction Management Dashboard With Productivity And Worked Hours Diagrams PDF
Deliver and pitch your topic in the best possible manner with this construction management dashboard with productivity and worked hours diagrams pdf. Use them to share invaluable insights on productivity, benefits, environment and impress your audience. This template can be altered and modified as per your expectations. So, grab it now.
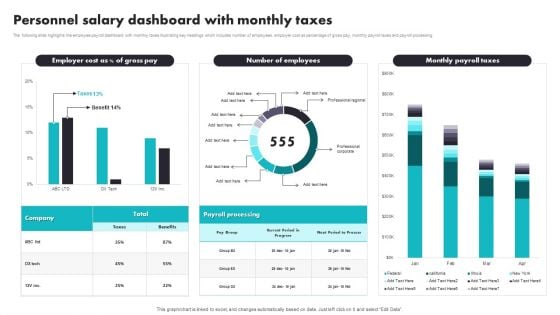
Personnel Salary Dashboard With Monthly Taxes Introduction PDF
The following slide highlights the employee payroll dashboard with monthly taxes illustrating key headings which includes number of employees, employer cost as percentage of gross pay, monthly payroll taxes and payroll processing. Pitch your topic with ease and precision using this Personnel Salary Dashboard With Monthly Taxes Introduction PDF. This layout presents information on Payroll Processing, Benefits. It is also available for immediate download and adjustment. So, changes can be made in the color, design, graphics or any other component to create a unique layout.
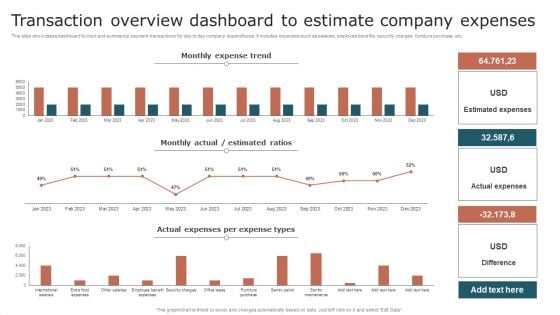
Transaction Overview Dashboard To Estimate Company Expenses Mockup PDF
This slide showcases dashboard to track and summarize payment transactions for day to day company expenditures. It includes expenses such as salaries, employee benefits, security charges, furniture purchase, etc. Showcasing this set of slides titled Transaction Overview Dashboard To Estimate Company Expenses Mockup PDF. The topics addressed in these templates are Monthly Expense Trend, Estimated Ratios, Actual Expenses. All the content presented in this PPT design is completely editable. Download it and make adjustments in color, background, font etc. as per your unique business setting.
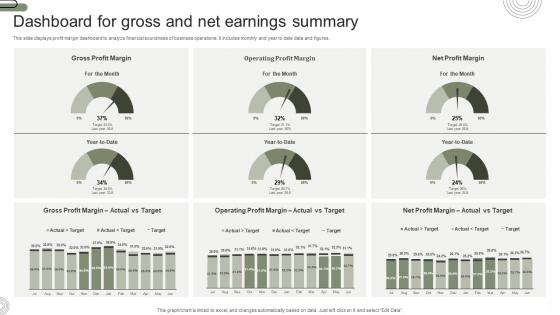
Dashboard For Gross And Net Earnings Summary Designs Pdf
This slide displays profit margin dashboard to analyze financial soundness of business operations. It includes monthly and year to date data and figures. Showcasing this set of slides titled Dashboard For Gross And Net Earnings Summary Designs Pdf. The topics addressed in these templates are Dashboard For Gross, Net Earnings Summary, Financial Soundness. All the content presented in this PPT design is completely editable. Download it and make adjustments in color, background, font etc. as per your unique business setting. This slide displays profit margin dashboard to analyze financial soundness of business operations. It includes monthly and year to date data and figures.
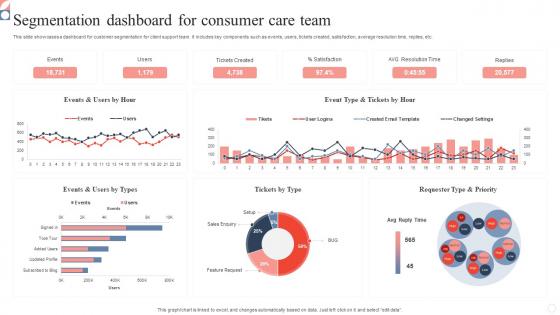
Segmentation Dashboard For Consumer Care Team Slides Pdf
This slide showcases a dashboard for customer segmentation for client support team. It includes key components such as events, users, tickets created, satisfaction, average resolution time, replies, etc. Showcasing this set of slides titled Segmentation Dashboard For Consumer Care Team Slides Pdf. The topics addressed in these templates are Segmentation Dashboard, Consumer Care Team, Satisfaction. All the content presented in this PPT design is completely editable. Download it and make adjustments in color, background, font etc. as per your unique business setting. This slide showcases a dashboard for customer segmentation for client support team. It includes key components such as events, users, tickets created, satisfaction, average resolution time, replies, etc.
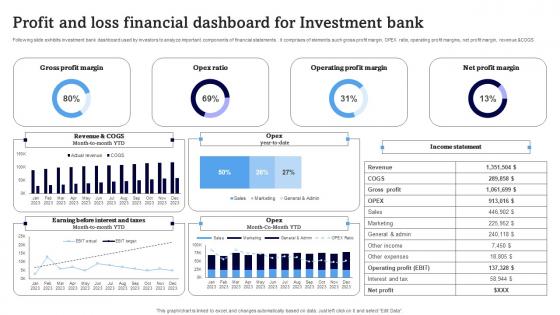
Profit And Loss Financial Dashboard For Investment Bank Download Pdf
Following slide exhibits investment bank dashboard used by investors to analyze important components of financial statements . it comprises of elements such gross profit margin, OPEX ratio, operating profit margins, net profit margin, revenue andCOGS Pitch your topic with ease and precision using this Profit And Loss Financial Dashboard For Investment Bank Download Pdf. This layout presents information on Gross Profit Margin, Opex Ratio, Operating Profit Margin. It is also available for immediate download and adjustment. So, changes can be made in the color, design, graphics or any other component to create a unique layout. Following slide exhibits investment bank dashboard used by investors to analyze important components of financial statements . it comprises of elements such gross profit margin, OPEX ratio, operating profit margins, net profit margin, revenue andCOGS
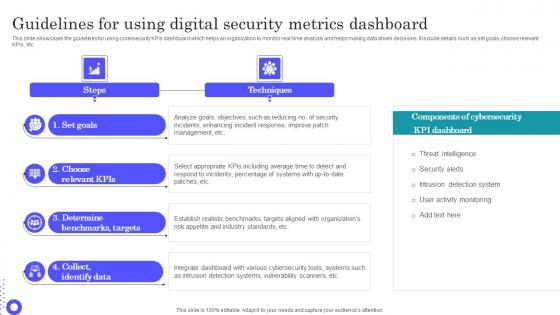
Guidelines For Using Digital Security Metrics Dashboard Introduction Pdf
Pitch your topic with ease and precision using this Guidelines For Using Digital Security Metrics Dashboard Introduction Pdf This layout presents information on Benchmarks Targets, Integrate Dashboard, Incidents Enhancing It is also available for immediate download and adjustment. So, changes can be made in the color, design, graphics or any other component to create a unique layout. This slide showcases the guidelines for using cybersecurity KPIs dashboard which helps an organization to monitor real time analysis and helps making data driven decisions. It include details such as set goals, choose relevant KPIs, etc.

KPI Dashboard For Estimating Monthly Cash Flow Infographics Pdf
Following slide demonstrates KPI dashboard to forecast monthly business money flow for cash flow management planning. It includes components such as projected profit before tax, net operating cash flow, net financial cash flow, net investing cash flow, etc. Showcasing this set of slides titled KPI Dashboard For Estimating Monthly Cash Flow Infographics Pdf. The topics addressed in these templates are KPI Dashboard, Estimating Monthly Cash Flow, Net Financial Cash Flow. All the content presented in this PPT design is completely editable. Download it and make adjustments in color, background, font etc. as per your unique business setting. Following slide demonstrates KPI dashboard to forecast monthly business money flow for cash flow management planning. It includes components such as projected profit before tax, net operating cash flow, net financial cash flow, net investing cash flow, etc.
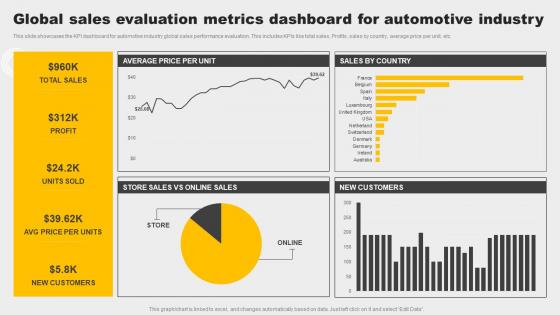
Global Sales Evaluation Metrics Dashboard For Automotive Industry Demonstration Pdf
This slide showcases the KPI dashboard for automotive industry global sales performance evaluation. This includes KPIs like total sales, Profits, sales by country, average price per unit, etc. Pitch your topic with ease and precision using this Global Sales Evaluation Metrics Dashboard For Automotive Industry Demonstration Pdf. This layout presents information on Customers, Profit, Sales. It is also available for immediate download and adjustment. So, changes can be made in the color, design, graphics or any other component to create a unique layout. This slide showcases the KPI dashboard for automotive industry global sales performance evaluation. This includes KPIs like total sales, Profits, sales by country, average price per unit, etc.


 Continue with Email

 Home
Home


