Big Data Analysis

How Experian Reduces Turnover Rate In Organisation Analysing Hr Data For Effective Decision Making
This slide covers a case study of Experian organization that tackles high employee turnover issues through hr analysis. It includes the main issue, factor analysis, strategies implementation, benefits to the business. Explore a selection of the finest How Experian Reduces Turnover Rate In Organisation Analysing Hr Data For Effective Decision Making here. With a plethora of professionally designed and pre-made slide templates, you can quickly and easily find the right one for your upcoming presentation. You can use our How Experian Reduces Turnover Rate In Organisation Analysing Hr Data For Effective Decision Making to effectively convey your message to a wider audience. Slidegeeks has done a lot of research before preparing these presentation templates. The content can be personalized and the slides are highly editable. Grab templates today from Slidegeeks. This slide covers a case study of Experian organization that tackles high employee turnover issues through hr analysis. It includes the main issue, factor analysis, strategies implementation, benefits to the business.
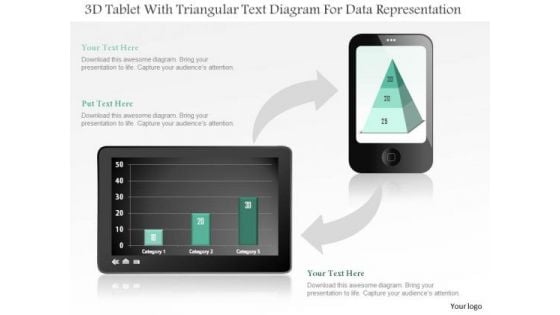
Business Diagram 3d Tablet With Triangular Text Diagram For Data Representation PowerPoint Slide
This business diagram displays bar graph on tablet and pyramid chart on mobile phone. Use this diagram, to make reports for interactive business presentations. Create professional presentations using this diagram.

Transforming Recruitment Process Tips To Streamline Recruitment Data Management CRP DK SS
This slide showcases best practices to optimize recruitment data management through pre planning, using applicant tracking system etc. Slidegeeks is here to make your presentations a breeze with Transforming Recruitment Process Tips To Streamline Recruitment Data Management CRP DK SS With our easy-to-use and customizable templates, you can focus on delivering your ideas rather than worrying about formatting. With a variety of designs to choose from, you are sure to find one that suits your needs. And with animations and unique photos, illustrations, and fonts, you can make your presentation pop. So whether you are giving a sales pitch or presenting to the board, make sure to check out Slidegeeks first This slide showcases best practices to optimize recruitment data management through pre planning, using applicant tracking system etc.

Agenda For Optimizing Decision Making The Power Of Prescriptive Analytics Data Analytics SS V
Boost your pitch with our creative Agenda For Optimizing Decision Making The Power Of Prescriptive Analytics Data Analytics SS V. Deliver an awe-inspiring pitch that will mesmerize everyone. Using these presentation templates you will surely catch everyones attention. You can browse the ppts collection on our website. We have researchers who are experts at creating the right content for the templates. So you do not have to invest time in any additional work. Just grab the template now and use them. Our Agenda For Optimizing Decision Making The Power Of Prescriptive Analytics Data Analytics SS V are topically designed to provide an attractive backdrop to any subject. Use them to look like a presentation pro.

Business Diagram Three Heads With Pie For Data Driven Technology PowerPoint Slide
This business diagram displays three human faces with pie charts. This Power Point template has been designed to compare and present business data. You may use this diagram to impart professional appearance to your presentations.
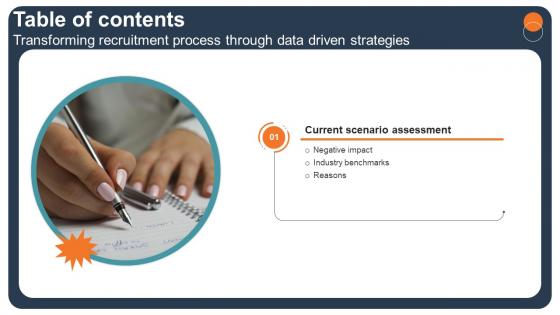
Table Of Contents For Transforming Recruitment Process Through Data Driven Strategies CRP DK SS
Slidegeeks is one of the best resources for PowerPoint templates. You can download easily and regulate Table Of Contents For Transforming Recruitment Process Through Data Driven Strategies CRP DK SS for your personal presentations from our wonderful collection. A few clicks is all it takes to discover and get the most relevant and appropriate templates. Use our Templates to add a unique zing and appeal to your presentation and meetings. All the slides are easy to edit and you can use them even for advertisement purposes. Our Table Of Contents For Transforming Recruitment Process Through Data Driven Strategies CRP DK SS are topically designed to provide an attractive backdrop to any subject. Use them to look like a presentation pro.

Analyzing Impact Of Current Hr Management Process Analysing Hr Data For Effective Decision Making
This slide comprises the impact of poor HR management on organizational goals. These challenges include rising business cost, high customer dissatisfaction, and unmotivated employees. Do you have to make sure that everyone on your team knows about any specific topic I yes, then you should give Analyzing Impact Of Current Hr Management Process Analysing Hr Data For Effective Decision Making a try. Our experts have put a lot of knowledge and effort into creating this impeccable Analyzing Impact Of Current Hr Management Process Analysing Hr Data For Effective Decision Making. You can use this template for your upcoming presentations, as the slides are perfect to represent even the tiniest detail. You can download these templates from the Slidegeeks website and these are easy to edit. So grab these today This slide comprises the impact of poor HR management on organizational goals. These challenges include rising business cost, high customer dissatisfaction, and unmotivated employees.
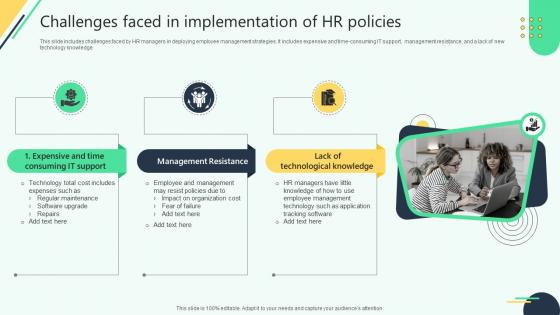
Challenges Faced In Implementation Of Hr Policies Analysing Hr Data For Effective Decision Making
This slide includes challenges faced by HR managers in deploying employee management strategies. It includes expensive and time-consuming IT support, management resistance, and a lack of new technology knowledge Get a simple yet stunning designed Challenges Faced In Implementation Of Hr Policies Analysing Hr Data For Effective Decision Making. It is the best one to establish the tone in your meetings. It is an excellent way to make your presentations highly effective. So, download this PPT today from Slidegeeks and see the positive impacts. Our easy-to-edit Challenges Faced In Implementation Of Hr Policies Analysing Hr Data For Effective Decision Making can be your go-to option for all upcoming conferences and meetings. So, what are you waiting for Grab this template today. This slide includes challenges faced by HR managers in deploying employee management strategies. It includes expensive and time-consuming IT support, management resistance, and a lack of new technology knowledge
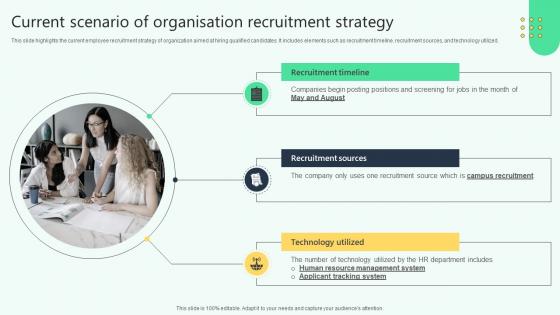
Current Scenario Of Organisation Recruitment Strategy Analysing Hr Data For Effective Decision Making
This slide highlights the current employee recruitment strategy of organization aimed at hiring qualified candidates. It includes elements such as recruitment timeline, recruitment sources, and technology utilized. Whether you have daily or monthly meetings, a brilliant presentation is necessary. Current Scenario Of Organisation Recruitment Strategy Analysing Hr Data For Effective Decision Making can be your best option for delivering a presentation. Represent everything in detail using Current Scenario Of Organisation Recruitment Strategy Analysing Hr Data For Effective Decision Making and make yourself stand out in meetings. The template is versatile and follows a structure that will cater to your requirements. All the templates prepared by Slidegeeks are easy to download and edit. Our research experts have taken care of the corporate themes as well. So, give it a try and see the results. This slide highlights the current employee recruitment strategy of organization aimed at hiring qualified candidates. It includes elements such as recruitment timeline, recruitment sources, and technology utilized.
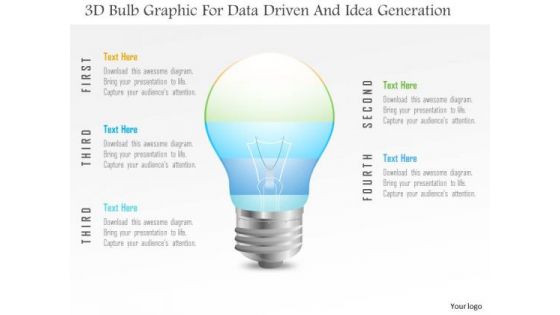
Business Diagram 3d Bulb Graphic For Data Driven And Idea Generation PowerPoint Slide
This Power Point template has been designed with 3d bulb graphic. Use this slide to represent technology idea and strategy concepts. Download this diagram for your business presentations and get exclusive comments on your efforts.
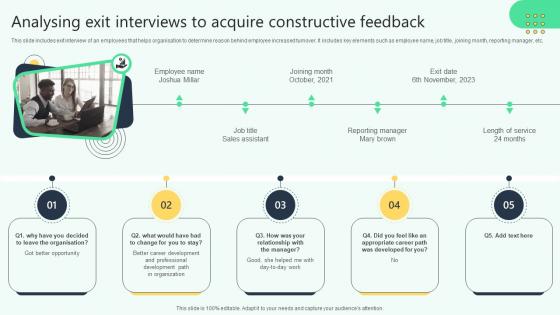
Analysing Exit Interviews To Acquire Constructive Feedback Analysing Hr Data For Effective Decision Making
This slide includes exit interview of an employees that helps organisation to determine reason behind employee increased turnover. It includes key elements such as employee name, job title, joining month, reporting manager, etc. Want to ace your presentation in front of a live audience Our Analysing Exit Interviews To Acquire Constructive Feedback Analysing Hr Data For Effective Decision Making can help you do that by engaging all the users towards you. Slidegeeks experts have put their efforts and expertise into creating these impeccable powerpoint presentations so that you can communicate your ideas clearly. Moreover, all the templates are customizable, and easy-to-edit and downloadable. Use these for both personal and commercial use. This slide includes exit interview of an employees that helps organisation to determine reason behind employee increased turnover. It includes key elements such as employee name, job title, joining month, reporting manager, etc.
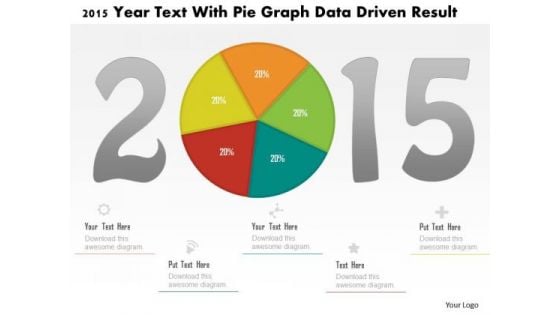
Business Diagram 2015 Year Text With Pie Graph Data Driven Result PowerPoint Slide
This business diagram displays 2015 year numbers with pie chart. This diagram is suitable to display business strategy for year 2015. Download this professional slide to present information in an attractive manner
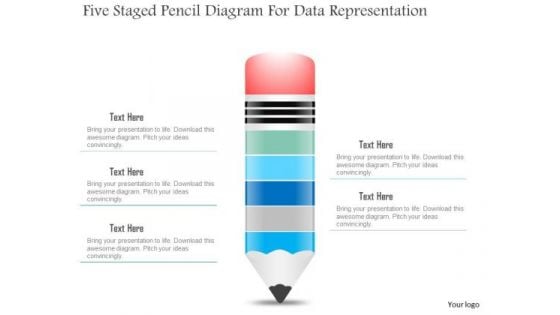
Business Diagram Five Staged Pencil Diagram For Data Representation PowerPoint Slide
This business slide displays five staged pencil diagram. It contains pencil graphic divided into five parts. This diagram slide depicts processes, stages, steps, points, options and education information display. Use this diagram, in your presentations to express your views innovatively.
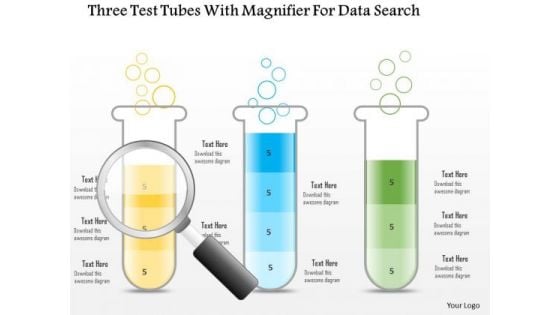
Business Diagram Three Test Tubes With Magnifier For Data Search PowerPoint Slide
This business diagram displays three test tubes with magnifying glass. This diagram is suitable to depict flow of business activities or steps. Download this professional slide to present information in an attractive manner.
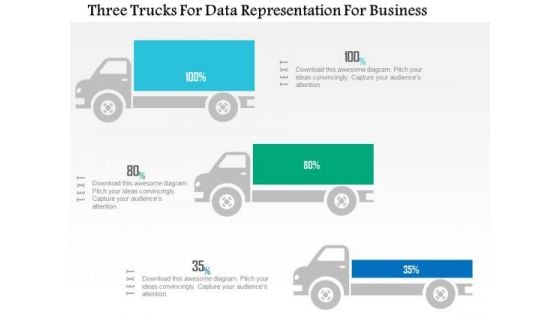
Business Diagram Three Trucks For Data Representation For Business PowerPoint Slide
This business diagram displays three trucks graphic. This diagram contains trucks for percentage value growth. Use this diagram to display business growth over a period of time.
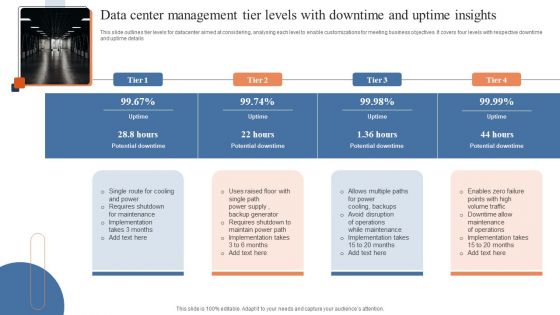
Data Center Management Tier Levels With Downtime And Uptime Insights Template PDF
This slide outlines tier levels for datacenter aimed at considering, analysing each level to enable customizations for meeting business objectives. It covers four levels with respective downtime and uptime details. Showcasing this set of slides titled Data Center Management Tier Levels With Downtime And Uptime Insights Template PDF. The topics addressed in these templates are Single Route Cooling, Allows Multiple Paths, Enables Zero Failure. All the content presented in this PPT design is completely editable. Download it and make adjustments in color, background, font etc. as per your unique business setting.

Prescriptive Analytics Software Tool IBM Decision Optimization Data Analytics SS V
This slide provides an overview of advanced analytic tool Alteryx. It covers details regarding unique selling propositions, customer reviews and pricing plans of Alteryx.The best PPT templates are a great way to save time, energy, and resources. Slidegeeks have 100 percent editable powerpoint slides making them incredibly versatile. With these quality presentation templates, you can create a captivating and memorable presentation by combining visually appealing slides and effectively communicating your message. Download Prescriptive Analytics Software Tool IBM Decision Optimization Data Analytics SS V from Slidegeeks and deliver a wonderful presentation. This slide provides an overview of advanced analytic tool Alteryx. It covers details regarding unique selling propositions, customer reviews and pricing plans of Alteryx.

5G Technology Can Connect More Devices Than 4G Comparative Analysis Of 4G And 5G Technologies Structure PDF
This slide represents how 5G technology can connect more devices than 4G. 5G can provide high precision data to each device and handle 1 million devices per square kilometer.Presenting 5G Technology Can Connect More Devices Than 4G Comparative Analysis Of 4G And 5G Technologies Structure PDF to provide visual cues and insights. Share and navigate important information on five stages that need your due attention. This template can be used to pitch topics like Automatically Delivering, Each Device, Might Struggle. In addtion, this PPT design contains high resolution images, graphics, etc, that are easily editable and available for immediate download.
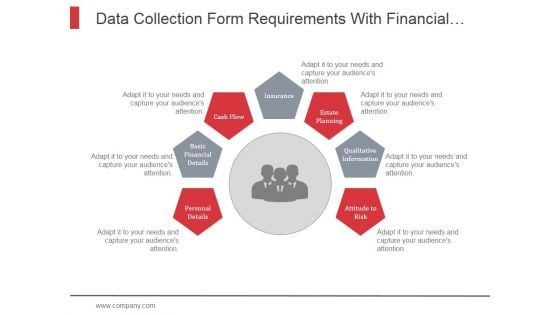
Data Collection Form Requirements With Financial Details Ppt PowerPoint Presentation Pictures
This is a data collection form requirements with financial details ppt powerpoint presentation pictures. This is a stage seven process. The stages in this process are form, financial form, data collection, financial details, data analysis.
Data Processing System Input And Output Ppt PowerPoint Presentation Icon Information
This is a data processing system input and output ppt powerpoint presentation icon information. This is a four stage process. The stages in this process are data flow, data management, big data.
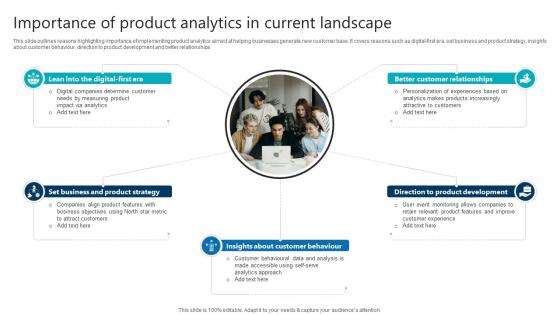
Importance Of Product Analytics In Current Landscape Product Analytics Implementation Data Analytics V
This slide outlines reasons highlighting importance of implementing product analytics aimed at helping businesses generate new customer base. It covers reasons such as digital-first era, set business and product strategy, insights about customer behaviour, direction to product development and better relationships Slidegeeks has constructed Importance Of Product Analytics In Current Landscape Product Analytics Implementation Data Analytics V after conducting extensive research and examination. These presentation templates are constantly being generated and modified based on user preferences and critiques from editors. Here, you will find the most attractive templates for a range of purposes while taking into account ratings and remarks from users regarding the content. This is an excellent jumping-off point to explore our content and will give new users an insight into our top-notch PowerPoint Templates. This slide outlines reasons highlighting importance of implementing product analytics aimed at helping businesses generate new customer base. It covers reasons such as digital-first era, set business and product strategy, insights about customer behaviour, direction to product development and better relationships

Data Strategy Management And Audit Corrective And Preventive Actions Ppt PowerPoint Presentation Pictures Designs Download
This is a data strategy management and audit corrective and preventive actions ppt powerpoint presentation pictures designs download. This is a nine stage process. The stages in this process are data flow, data management, big data.
Data Management Best Practices With Icons Ppt PowerPoint Presentation Pictures Guidelines
This is a data management best practices with icons ppt powerpoint presentation pictures guidelines. This is a five stage process. The stages in this process are data flow, data management, big data.
Data Management Steps With Icons Ppt PowerPoint Presentation Infographic Template Deck
This is a data management steps with icons ppt powerpoint presentation infographic template deck. This is a five stage process. The stages in this process are data flow, data management, big data.
Data Process Management With Icons Ppt PowerPoint Presentation Infographic Template Images
This is a data process management with icons ppt powerpoint presentation infographic template images. This is a four stage process. The stages in this process are data flow, data management, big data.
Five Steps Of Data Storage With Icons Ppt PowerPoint Presentation Styles Samples
This is a five steps of data storage with icons ppt powerpoint presentation styles samples. This is a five stage process. The stages in this process are data flow, data management, big data.
Four Steps Data Process Management With Icons Ppt PowerPoint Presentation Slides Guide
This is a four steps data process management with icons ppt powerpoint presentation slides guide. This is a four stage process. The stages in this process are data flow, data management, big data.
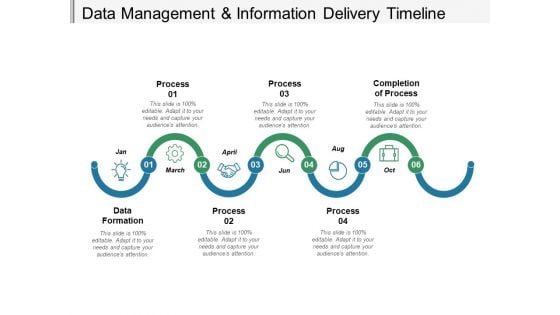
Data Management And Information Delivery Timeline Ppt PowerPoint Presentation Inspiration Example File
This is a data management and information delivery timeline ppt powerpoint presentation inspiration example file. This is a six stage process. The stages in this process are data flow, data management, big data.
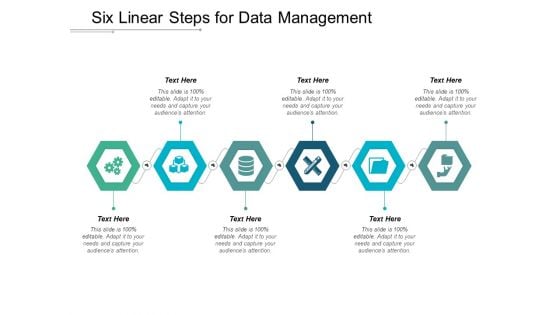
Six Linear Steps For Data Management Ppt PowerPoint Presentation Infographic Template Layout Ideas
This is a six linear steps for data management ppt powerpoint presentation infographic template layout ideas. This is a six stage process. The stages in this process are data flow, data management, big data.
Data Center And Virtualization Vector Icon Ppt Powerpoint Presentation Outline Objects
This is a data center and virtualization vector icon ppt powerpoint presentation outline objects. This is a three stage process. The stages in this process are data management icon, big data icon.
5 Vs Large Data Sets Applications Circular Icons Ppt PowerPoint Presentation Picture
This is a 5 vs large data sets applications circular icons ppt powerpoint presentation picture. This is a five stage process. The stages in this process are big data, volume, velocity, variety, veracity, value.
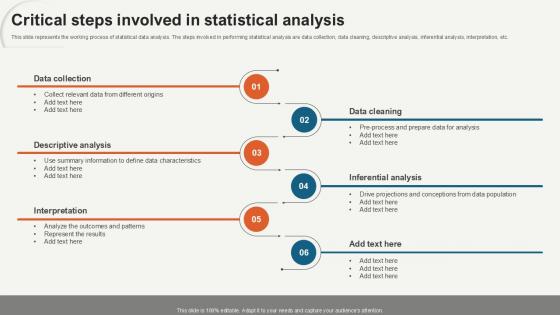
Critical Steps Involved In Statistical Data Analytics For Informed Decision Ppt Presentation
This slide represents the working process of statistical data analysis. The steps involved in performing statistical analysis are data collection, data cleaning, descriptive analysis, inferential analysis, interpretation, etc. Slidegeeks is here to make your presentations a breeze with Critical Steps Involved In Statistical Data Analytics For Informed Decision Ppt Presentation With our easy-to-use and customizable templates, you can focus on delivering your ideas rather than worrying about formatting. With a variety of designs to choose from, you are sure to find one that suits your needs. And with animations and unique photos, illustrations, and fonts, you can make your presentation pop. So whether you are giving a sales pitch or presenting to the board, make sure to check out Slidegeeks first This slide represents the working process of statistical data analysis. The steps involved in performing statistical analysis are data collection, data cleaning, descriptive analysis, inferential analysis, interpretation, etc.
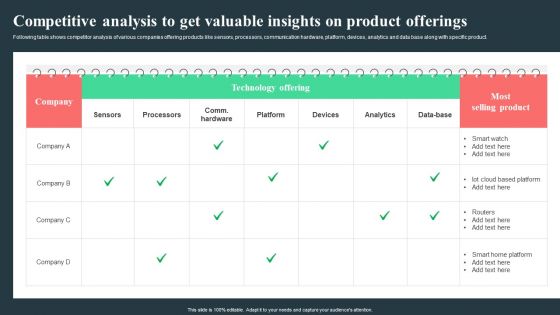
Strategic Guide For Positioning Expanded Brand Competitive Analysis To Get Valuable Insights On Product Offerings Slides PDF
Following table shows competitor analysis of various companies offering products like sensors, processors, communication hardware, platform, devices, analytics and data base along with specific product. Get a simple yet stunning designed Strategic Guide For Positioning Expanded Brand Competitive Analysis To Get Valuable Insights On Product Offerings Slides PDF. It is the best one to establish the tone in your meetings. It is an excellent way to make your presentations highly effective. So, download this PPT today from Slidegeeks and see the positive impacts. Our easy-to-edit Strategic Guide For Positioning Expanded Brand Competitive Analysis To Get Valuable Insights On Product Offerings Slides PDF can be your go-to option for all upcoming conferences and meetings. So, what are you waiting for. Grab this template today.
Data Science Server Network Vector Icon Ppt Powerpoint Presentation Model Infographics
This is a data science server network vector icon ppt powerpoint presentation model infographics. The topics discussed in this diagram are data management icon, big data icon. This is a completely editable PowerPoint presentation, and is available for immediate download.
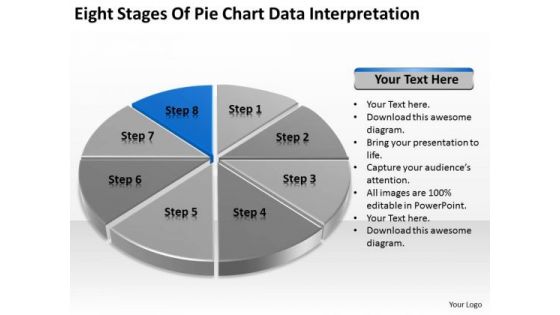
Eight Stages Of Pie Chart Data Interpretation Detailed Business Plan PowerPoint Templates
We present our eight stages of pie chart data interpretation detailed business plan PowerPoint templates.Download and present our Competition PowerPoint Templates because You can Stir your ideas in the cauldron of our PowerPoint Templates and Slides. Cast a magic spell on your audience. Download and present our Marketing PowerPoint Templates because You should Kick up a storm with our PowerPoint Templates and Slides. The heads of your listeners will swirl with your ideas. Download and present our Arrows PowerPoint Templates because Your ideas provide food for thought. Our PowerPoint Templates and Slides will help you create a dish to tickle the most discerning palate. Present our Circle Charts PowerPoint Templates because You can Stir your ideas in the cauldron of our PowerPoint Templates and Slides. Cast a magic spell on your audience. Download our Business PowerPoint Templates because You can Score a slam dunk with our PowerPoint Templates and Slides. Watch your audience hang onto your every word.Use these PowerPoint slides for presentations relating to chart, graph, pie, 3d, diagram, graphic, icon, control, business, data, profit, market, sales, display, corporate, concept, render, success, presentation, finance, report, marketing, accounting, management, piece, strategy, money, growth, company, competition, progress, account, sheet, part, information, investment, improvement, banking, index, financial, reflect, results, performance, exchange. The prominent colors used in the PowerPoint template are Blue, Black, Gray. Exult in the comfort of our Eight Stages Of Pie Chart Data Interpretation Detailed Business Plan PowerPoint Templates. Experience the convenience they deliver.
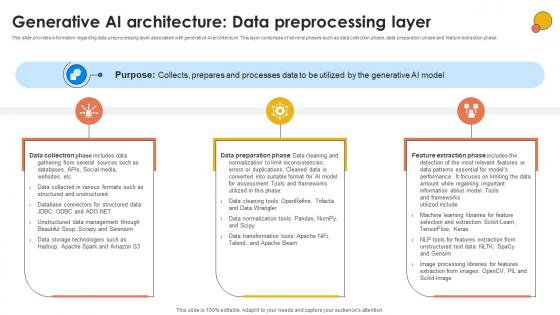
Generative AI Architecture Data Generative AI For Better Productivity AI SS V
This slide provides information regarding data preprocessing layer associated with generative AI architecture. This layer comprises of several phases such as data collection phase, data preparation phase and feature extraction phase. Crafting an eye-catching presentation has never been more straightforward. Let your presentation shine with this tasteful yet straightforward Generative AI Architecture Data Generative AI For Better Productivity AI SS V template. It offers a minimalistic and classy look that is great for making a statement. The colors have been employed intelligently to add a bit of playfulness while still remaining professional. Construct the ideal Generative AI Architecture Data Generative AI For Better Productivity AI SS V that effortlessly grabs the attention of your audience Begin now and be certain to wow your customers This slide provides information regarding data preprocessing layer associated with generative AI architecture. This layer comprises of several phases such as data collection phase, data preparation phase and feature extraction phase.
Data Maturity Framework Assessment Icon Ppt PowerPoint Presentation Icon Infographic Template PDF
Presenting Data Maturity Framework Assessment Icon Ppt PowerPoint Presentation Icon Infographic Template PDF to dispense important information. This template comprises one stages. It also presents valuable insights into the topics including Data Maturity Framework, Assessment Icon. This is a completely customizable PowerPoint theme that can be put to use immediately. So, download it and address the topic impactfully.
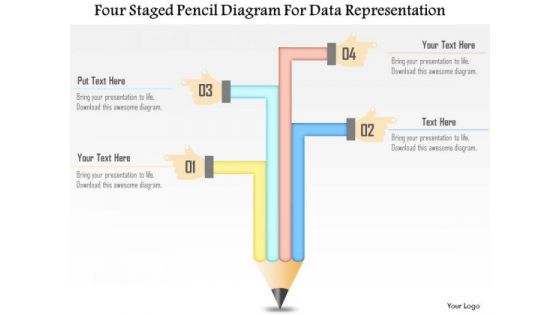
Business Diagram Four Staged Pencil Diagram For Data Representation Presentation Template
This business diagram has been designed with four staged pencil chart. This slide suitable for data representation. You can also use this slide to present four steps of any business process. Use this diagram to present your views in a wonderful manner.

Information Science RACI Matrix For Data Science Ppt PowerPoint Presentation Slides Model PDF
This slide represents the RACI matrix for data science and tasks performed by data analysts, data engineers, data scientists, data architects, and business analysts.Deliver an awe inspiring pitch with this creative Information Science RACI Matrix For Data Science Ppt PowerPoint Presentation Slides Model PDF bundle. Topics like Data Collection, Data Cleaning, Exploratory Analysis can be discussed with this completely editable template. It is available for immediate download depending on the needs and requirements of the user.

External And API Data Collection In Aspect Decoding User Emotions In Depth Exploration AI SS V
This slide provides information regarding external and API data collection in aspect-based sentiment analysis in terms of web scrapping tools, visual web scrapping tools, web scrapping frameworks, and APIs. Make sure to capture your audiences attention in your business displays with our gratis customizable External And API Data Collection In Aspect Decoding User Emotions In Depth Exploration AI SS V. These are great for business strategies, office conferences, capital raising or task suggestions. If you desire to acquire more customers for your tech business and ensure they stay satisfied, create your own sales presentation with these plain slides. This slide provides information regarding external and API data collection in aspect-based sentiment analysis in terms of web scrapping tools, visual web scrapping tools, web scrapping frameworks, and APIs.
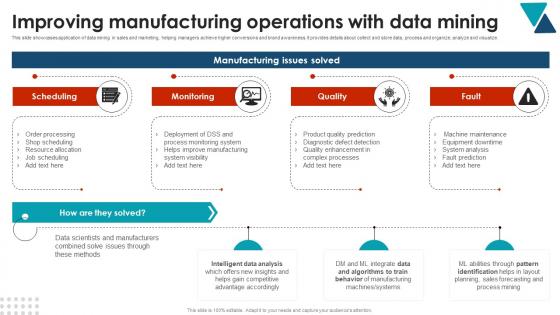
Improving Manufacturing Operations With Using Data Mining Tools To Optimize Processes AI SS V
This slide showcases application of data mining in sales and marketing, helping managers achieve higher conversions and brand awareness. It provides details about collect and store data, process and organize, analyze and visualize. Welcome to our selection of the Improving Manufacturing Operations With Using Data Mining Tools To Optimize Processes AI SS V. These are designed to help you showcase your creativity and bring your sphere to life. Planning and Innovation are essential for any business that is just starting out. This collection contains the designs that you need for your everyday presentations. All of our PowerPoints are 100Percent editable, so you can customize them to suit your needs. This multi-purpose template can be used in various situations. Grab these presentation templates today. This slide showcases application of data mining in sales and marketing, helping managers achieve higher conversions and brand awareness. It provides details about collect and store data, process and organize, analyze and visualize.
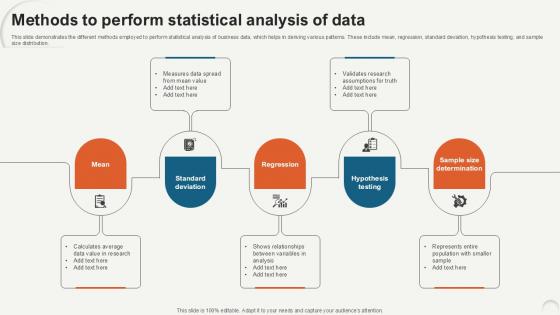
Methods To Perform Statistical Data Analytics For Informed Decision Ppt Presentation
This slide demonstrates the different methods employed to perform statistical analysis of business data, which helps in deriving various patterns. These include mean, regression, standard deviation, hypothesis testing, and sample size distribution. The best PPT templates are a great way to save time, energy, and resources. Slidegeeks have 100 percent editable powerpoint slides making them incredibly versatile. With these quality presentation templates, you can create a captivating and memorable presentation by combining visually appealing slides and effectively communicating your message. Download Methods To Perform Statistical Data Analytics For Informed Decision Ppt Presentation from Slidegeeks and deliver a wonderful presentation. This slide demonstrates the different methods employed to perform statistical analysis of business data, which helps in deriving various patterns. These include mean, regression, standard deviation, hypothesis testing, and sample size distribution.
Data Transform Machine Learning Introduction Exploring Machine Learning Operations Icons Pdf
This slide highlights the importance of data transform. The purpose of this slide is to explain how data transform is improving the accuracy and effectiveness of machine learning models. Want to ace your presentation in front of a live audience Our Data Transform Machine Learning Introduction Exploring Machine Learning Operations Icons Pdf can help you do that by engaging all the users towards you. Slidegeeks experts have put their efforts and expertise into creating these impeccable powerpoint presentations so that you can communicate your ideas clearly. Moreover, all the templates are customizable, and easy to edit and downloadable. Use these for both personal and commercial use. This slide highlights the importance of data transform. The purpose of this slide is to explain how data transform is improving the accuracy and effectiveness of machine learning models.

ChatGPT For Educators Best Practices Data Usage Applications Of ChatGPT In Education ChatGPT SS V
This slide represents details related to best practices for using AI technology designed to understand and generate human-like texts based on received inputs, by educators for teaching purposes. It includes detailed related to use of ChatGPT for effective data usage. If your project calls for a presentation, then Slidegeeks is your go-to partner because we have professionally designed, easy-to-edit templates that are perfect for any presentation. After downloading, you can easily edit ChatGPT For Educators Best Practices Data Usage Applications Of ChatGPT In Education ChatGPT SS V and make the changes accordingly. You can rearrange slides or fill them with different images. Check out all the handy templates This slide represents details related to best practices for using AI technology designed to understand and generate human-like texts based on received inputs, by educators for teaching purposes. It includes detailed related to use of ChatGPT for effective data usage.
Icons Slide For Using Data Mining Tools To Optimize Processes AI SS V
Download our innovative and attention grabbing Icons Slide For Using Data Mining Tools To Optimize Processes AI SS V template. The set of slides exhibit completely customizable icons. These icons can be incorporated into any business presentation. So download it immediately to clearly communicate with your clientele. Our Icons Slide For Using Data Mining Tools To Optimize Processes AI SS V are topically designed to provide an attractive backdrop to any subject. Use them to look like a presentation pro.

Introduction To Machine Learning Description And Features Data Analytics SS V
This slide provides an introduction to machine learning aimed ta helping businesses derive patterns and connections in the data. It covers description and features of machine learning.Do you have to make sure that everyone on your team knows about any specific topic I yes, then you should give Introduction To Machine Learning Description And Features Data Analytics SS V a try. Our experts have put a lot of knowledge and effort into creating this impeccable Introduction To Machine Learning Description And Features Data Analytics SS V. You can use this template for your upcoming presentations, as the slides are perfect to represent even the tiniest detail. You can download these templates from the Slidegeeks website and these are easy to edit. So grab these today This slide provides an introduction to machine learning aimed ta helping businesses derive patterns and connections in the data. It covers description and features of machine learning.
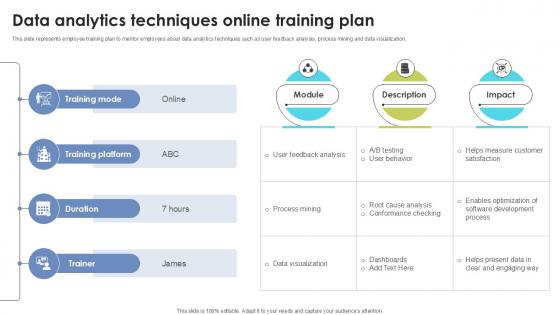
Data Analytics Techniques Online Skill Building Plan For Application PPT Example DTE SS V
This slide represents employee training plan to mentor employees about data analytics techniques such as user feedback analysis, process mining and data visualization. Do you have to make sure that everyone on your team knows about any specific topic I yes, then you should give Data Analytics Techniques Online Skill Building Plan For Application PPT Example DTE SS V a try. Our experts have put a lot of knowledge and effort into creating this impeccable Data Analytics Techniques Online Skill Building Plan For Application PPT Example DTE SS V. You can use this template for your upcoming presentations, as the slides are perfect to represent even the tiniest detail. You can download these templates from the Slidegeeks website and these are easy to edit. So grab these today This slide represents employee training plan to mentor employees about data analytics techniques such as user feedback analysis, process mining and data visualization.

Data Management With Augmented Technologies Workflows Using Artificial Intelligence Information Pdf
The following slide highlights workflow of augmented data management utilizing artificial intelligence responding to real time changes in markets. It includes components such as preparing augmented data, share operational findings and identify patterns in data and building models. Pitch your topic with ease and precision using this Data Management With Augmented Technologies Workflows Using Artificial Intelligence Information Pdf. This layout presents information on Preparing Augmented Data, Share Operational Findings, Identify Patterns. It is also available for immediate download and adjustment. So, changes can be made in the color, design, graphics or any other component to create a unique layout. The following slide highlights workflow of augmented data management utilizing artificial intelligence responding to real time changes in markets. It includes components such as preparing augmented data, share operational findings and identify patterns in data and building models.
Icons Slide For Predictive Analytics For Empowering Data Driven Decision Making Designs Pdf
Download our innovative and attention grabbing Icons Slide For Predictive Analytics For Empowering Data Driven Decision Making Designs Pdf template. The set of slides exhibit completely customizable icons. These icons can be incorporated into any business presentation. So download it immediately to clearly communicate with your clientele. Our Icons Slide For Predictive Analytics For Empowering Data Driven Decision Making Designs Pdf are topically designed to provide an attractive backdrop to any subject. Use them to look like a presentation pro.

Empowering The Future Key Benefits Of Data Management In Smart Metering IoT SS V
This slide highlights data management in smart metering in order to enhance the overall efficiency of energy transmission and distribution.it covers key aspects such as data collection, data recording, data storing, data transmission, and data display. Want to ace your presentation in front of a live audience Our Empowering The Future Key Benefits Of Data Management In Smart Metering IoT SS V can help you do that by engaging all the users towards you. Slidegeeks experts have put their efforts and expertise into creating these impeccable powerpoint presentations so that you can communicate your ideas clearly. Moreover, all the templates are customizable, and easy-to-edit and downloadable. Use these for both personal and commercial use. This slide highlights data management in smart metering in order to enhance the overall efficiency of energy transmission and distribution.it covers key aspects such as data collection, data recording, data storing, data transmission, and data display.

Detailed Analysis Of Red Ocean Vs Blue Ocean Approach Summary Of The Blue Ocean Strategy Sample PDF
This template covers summary of blue ocean strategy for company. It depicts that blue ocean is founded on data rather than unproven theories, blue ocean strategy indicates that the objective is not to exceed the competitors or be the best in the industry and low cost can be achieved if company can identify what consumers value and then rethink how to provide that value it is called value innovation. This Detailed Analysis Of Red Ocean Vs Blue Ocean Approach Summary Of The Blue Ocean Strategy Sample PDF from Slidegeeks makes it easy to present information on your topic with precision. It provides customization options, so you can make changes to the colors, design, graphics, or any other component to create a unique layout. It is also available for immediate download, so you can begin using it right away. Slidegeeks has done good research to ensure that you have everything you need to make your presentation stand out. Make a name out there for a brilliant performance.

Future Opportunities And Technologies In Using Data Mining Tools To Optimize Processes AI SS V
This slide showcases future opportunities relating to data mining which can help associated players to improvise their current offerings. It provides details machine learning, AI, internet of things, cloud tools, etc. Presenting this PowerPoint presentation, titled Future Opportunities And Technologies In Using Data Mining Tools To Optimize Processes AI SS V, with topics curated by our researchers after extensive research. This editable presentation is available for immediate download and provides attractive features when used. Download now and captivate your audience. Presenting this Future Opportunities And Technologies In Using Data Mining Tools To Optimize Processes AI SS V. Our researchers have carefully researched and created these slides with all aspects taken into consideration. This is a completely customizable Future Opportunities And Technologies In Using Data Mining Tools To Optimize Processes AI SS V that is available for immediate downloading. Download now and make an impact on your audience. Highlight the attractive features available with our PPTs. This slide showcases future opportunities relating to data mining which can help associated players to improvise their current offerings. It provides details machine learning, AI, internet of things, cloud tools, etc.
Data Mining In Patient Care For Better Customer Relationship Icon Portrait Pdf
Pitch your topic with ease and precision using this Data Mining In Patient Care For Better Customer Relationship Icon Portrait Pdf. This layout presents information on Data Mining Patient Care, Better Customer, Relationship Icon. It is also available for immediate download and adjustment. So, changes can be made in the color, design, graphics or any other component to create a unique layout. Our Data Mining In Patient Care For Better Customer Relationship Icon Portrait Pdf are topically designed to provide an attractive backdrop to any subject. Use them to look like a presentation pro.
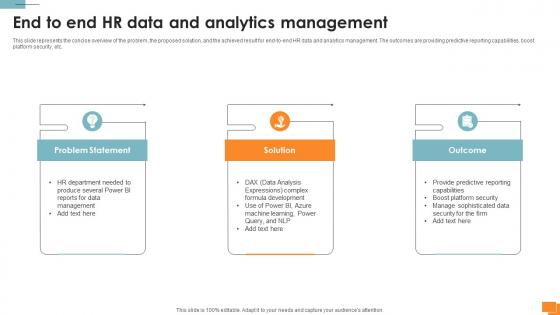
Statistical Tools For Evidence End To End HR Data And Analytics Management
This slide represents the concise overview of the problem, the proposed solution, and the achieved result for end-to-end HR data and analytics management. The outcomes are providing predictive reporting capabilities, boost platform security, etc. Coming up with a presentation necessitates that the majority of the effort goes into the content and the message you intend to convey. The visuals of a PowerPoint presentation can only be effective if it supplements and supports the story that is being told. Keeping this in mind our experts created Statistical Tools For Evidence End To End HR Data And Analytics Management to reduce the time that goes into designing the presentation. This way, you can concentrate on the message while our designers take care of providing you with the right template for the situation. This slide represents the concise overview of the problem, the proposed solution, and the achieved result for end-to-end HR data and analytics management. The outcomes are providing predictive reporting capabilities, boost platform security, etc.
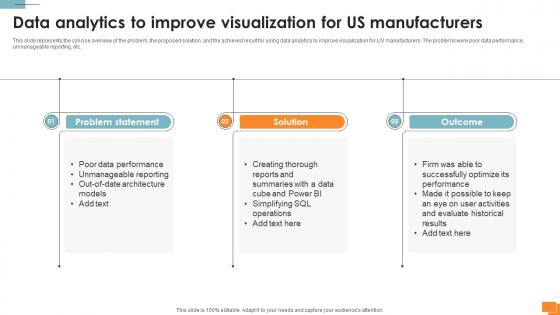
Statistical Tools For Evidence Data Analytics To Improve Visualization For Us Manufacturers
This slide represents the concise overview of the problem, the proposed solution, and the achieved result for using data analytics to improve visualization for US manufacturers. The problems were poor data performance, unmanageable reporting, etc. Crafting an eye-catching presentation has never been more straightforward. Let your presentation shine with this tasteful yet straightforward Statistical Tools For Evidence Data Analytics To Improve Visualization For Us Manufacturers template. It offers a minimalistic and classy look that is great for making a statement. The colors have been employed intelligently to add a bit of playfulness while still remaining professional. Construct the ideal Statistical Tools For Evidence Data Analytics To Improve Visualization For Us Manufacturers that effortlessly grabs the attention of your audience Begin now and be certain to wow your customers This slide represents the concise overview of the problem, the proposed solution, and the achieved result for using data analytics to improve visualization for US manufacturers. The problems were poor data performance, unmanageable reporting, etc.
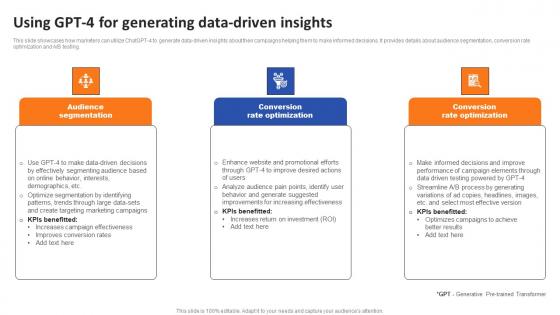
Using GPT 4 For Generating Data Driven Insights Ppt Infographic Template Slide Portrait Pdf
This slide showcases how marketers can utilize ChatGPT-4 to generate data-driven insights about their campaigns helping them to make informed decisions. It provides details about audience segmentation, conversion rate optimization and A OR B testing. Boost your pitch with our creative Using GPT 4 For Generating Data Driven Insights Ppt Infographic Template Slide Portrait Pdf. Deliver an awe-inspiring pitch that will mesmerize everyone. Using these presentation templates you will surely catch everyones attention. You can browse the ppts collection on our website. We have researchers who are experts at creating the right content for the templates. So you do not have to invest time in any additional work. Just grab the template now and use them. This slide showcases how marketers can utilize ChatGPT-4 to generate data-driven insights about their campaigns helping them to make informed decisions. It provides details about audience segmentation, conversion rate optimization and A OR B testing.
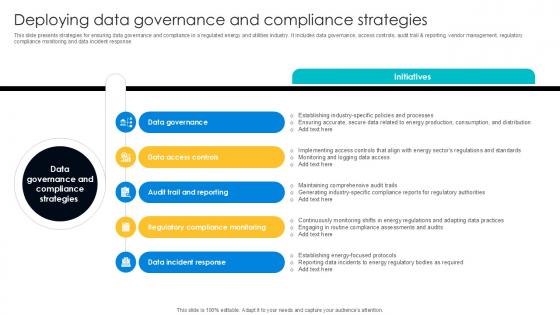
Deploying Data Governance Digital Transformation Journey PPT PowerPoint DT SS V
This slide presents strategies for ensuring data governance and compliance in a regulated energy and utilities industry. It includes data governance, access controls, audit trail and reporting, vendor management, regulatory compliance monitoring and data incident response. This modern and well-arranged Deploying Data Governance Digital Transformation Journey PPT PowerPoint DT SS V provides lots of creative possibilities. It is very simple to customize and edit with the Powerpoint Software. Just drag and drop your pictures into the shapes. All facets of this template can be edited with Powerpoint, no extra software is necessary. Add your own material, put your images in the places assigned for them, adjust the colors, and then you can show your slides to the world, with an animated slide included. This slide presents strategies for ensuring data governance and compliance in a regulated energy and utilities industry. It includes data governance, access controls, audit trail and reporting, vendor management, regulatory compliance monitoring and data incident response.
Icons Slide For Global Data Security Industry Report IR SS V
Introducing our well designed Icons Slide For Global Data Security Industry Report IR SS V set of slides. The slide displays editable icons to enhance your visual presentation. The icons can be edited easily. So customize according to your business to achieve a creative edge. Download and share it with your audience. Our Icons Slide For Global Data Security Industry Report IR SS V are topically designed to provide an attractive backdrop to any subject. Use them to look like a presentation pro.
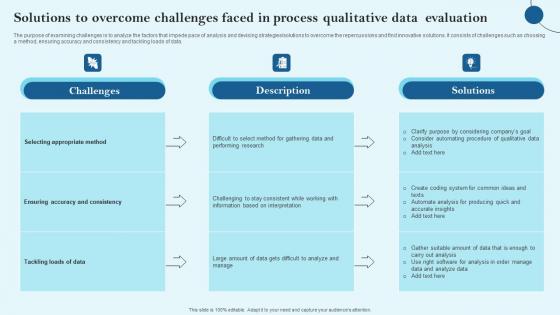
Solutions To Overcome Challenges Faced In Process Qualitative Data Evaluation Pictures Pdf
The purpose of examining challenges is to analyze the factors that impede pace of analysis and devising strategies solutions to overcome the repercussions and find innovative solutions. It consists of challenges such as choosing a method, ensuring accuracy and consistency and tackling loads of data. Showcasing this set of slides titled Solutions To Overcome Challenges Faced In Process Qualitative Data Evaluation Pictures Pdf The topics addressed in these templates are Selecting Appropriate, Tackling Loads Of Data, Data Evaluation All the content presented in this PPT design is completely editable. Download it and make adjustments in color, background, font etc. as per your unique business setting. The purpose of examining challenges is to analyze the factors that impede pace of analysis and devising strategies solutions to overcome the repercussions and find innovative solutions. It consists of challenges such as choosing a method, ensuring accuracy and consistency and tackling loads of data.
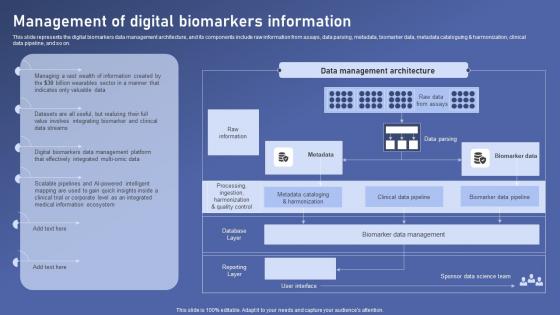
Management Digital Biomarkers Biomedical Data Science And Health Informatics Themes Pdf
This slide represents the digital biomarkers data management architecture, and its components include raw information from assays, data parsing, metadata, biomarker data, metadata cataloguing and harmonization, clinical data pipeline, and so on. Do you know about Slidesgeeks Management Digital Biomarkers Biomedical Data Science And Health Informatics Themes Pdf These are perfect for delivering any kind od presentation. Using it, create PowerPoint presentations that communicate your ideas and engage audiences. Save time and effort by using our pre designed presentation templates that are perfect for a wide range of topic. Our vast selection of designs covers a range of styles, from creative to business, and are all highly customizable and easy to edit. Download as a PowerPoint template or use them as Google Slides themes. This slide represents the digital biomarkers data management architecture, and its components include raw information from assays, data parsing, metadata, biomarker data, metadata cataloguing and harmonization, clinical data pipeline, and so on.


 Continue with Email

 Home
Home


