Big Data Infographics
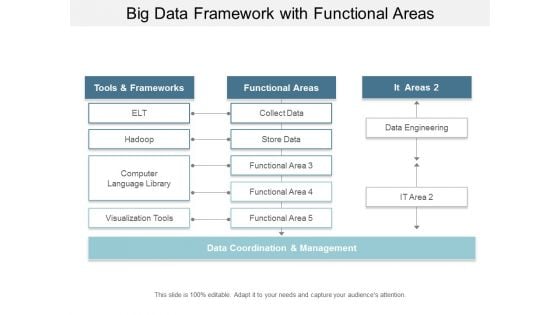
Big Data Framework With Functional Areas Ppt Powerpoint Presentation Infographic Template Infographics
This is a big data framework with functional areas ppt powerpoint presentation infographic template infographics. This is a three stage process. The stages in this process are functional architecture, functional planning, functional designing.
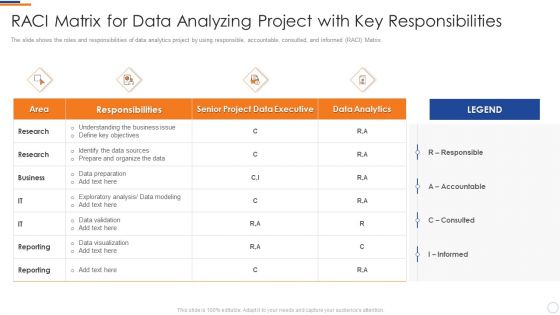
Business Intelligence And Big RACI Matrix For Data Analyzing Project With Key Infographics PDF
The slide shows the roles and responsibilities of data analytics project by using responsible, accountable, consulted, and informed RACI Matrix. Deliver an awe inspiring pitch with this creative business intelligence and big raci matrix for data analyzing project with key infographics pdf bundle. Topics like responsibilities, data analytics, research can be discussed with this completely editable template. It is available for immediate download depending on the needs and requirements of the user.
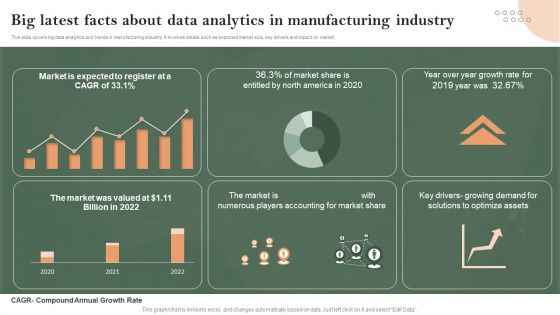
Big Latest Facts About Data Analytics In Manufacturing Industry Infographics PDF
This slide covers big data analytics and trends in manufacturing industry. It involves details such as expected market size, key drivers and impact on market. Pitch your topic with ease and precision using this Big Latest Facts About Data Analytics In Manufacturing Industry Infographics PDF. This layout presents information on Big Latest Facts, About Data Analytics, Manufacturing Industry. It is also available for immediate download and adjustment. So, changes can be made in the color, design, graphics or any other component to create a unique layout.
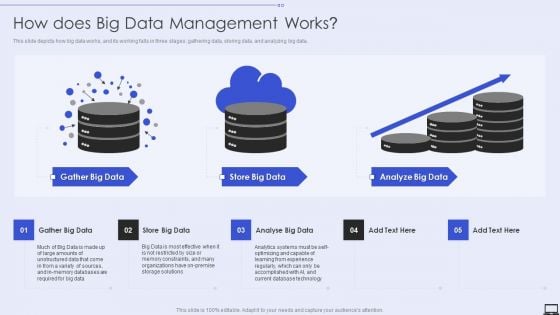
How Does Big Data Management Works Ppt PowerPoint Presentation File Infographic Template PDF
Deliver an awe inspiring pitch with this creative How Does Big Data Management Works Ppt PowerPoint Presentation File Infographic Template PDF bundle. Topics like Store Big Data, Analyze Big Data, Gather Big Data can be discussed with this completely editable template. It is available for immediate download depending on the needs and requirements of the user.
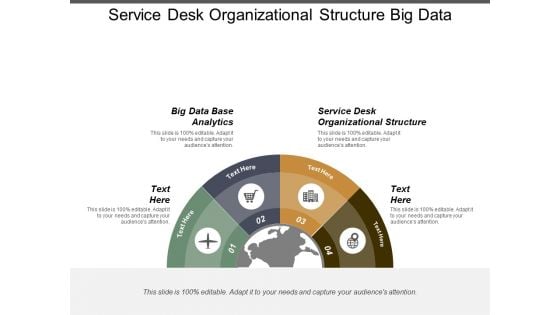
Service Desk Organizational Structure Big Data Base Analytics Ppt PowerPoint Presentation Outline Infographic Template
This is a service desk organizational structure big data base analytics ppt powerpoint presentation outline infographic template. This is a four stage process. The stages in this process are service desk organizational structure, big data base analytics.
Transforming Big Data Analytics To Knowledge Icons Slide Ppt Infographic Template Tips PDF
Introducing our well designed transforming big data analytics to knowledge icons slide ppt infographic template tips pdf set of slides. The slide displays editable icons to enhance your visual presentation. The icons can be edited easily. So customize according to your business to achieve a creative edge. Download and share it with your audience.
Big Data Vs Business Intelligence Ppt PowerPoint Presentation Infographic Template Maker Cpb
Presenting this set of slides with name big data vs business intelligence ppt powerpoint presentation infographic template maker cpb. This is an editable Powerpoint five stages graphic that deals with topics like big data vs business intelligence to help convey your message better graphically. This product is a premium product available for immediate download and is 100 percent editable in Powerpoint. Download this now and use it in your presentations to impress your audience.
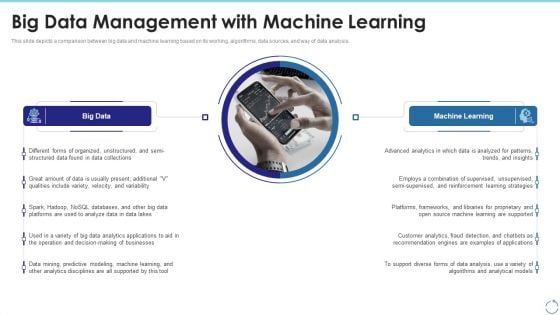
Big Data Management With Machine Learning Ppt Pictures Infographic Template PDF
This slide depicts a comparison between big data and machine learning based on its working, algorithms, data sources, and way of data analysis. This is a big data management with machine learning ppt pictures infographic template pdf template with various stages. Focus and dispense information on two stages using this creative set, that comes with editable features. It contains large content boxes to add your information on topics like data, analyze, customer, source. You can also showcase facts, figures, and other relevant content using this PPT layout. Grab it now.
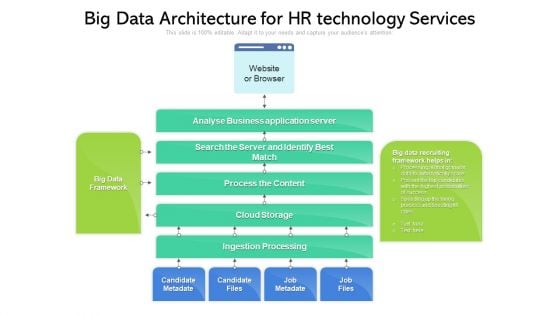
Big Data Architecture For HR Technology Services Ppt PowerPoint Presentation Infographics Professional PDF
Showcasing this set of slides titled big data architecture for hr technology services ppt powerpoint presentation infographics professional pdf. The topics addressed in these templates are candidate metadate, candidate files, job metadate. All the content presented in this PPT design is completely editable. Download it and make adjustments in color, background, font etc. as per your unique business setting.
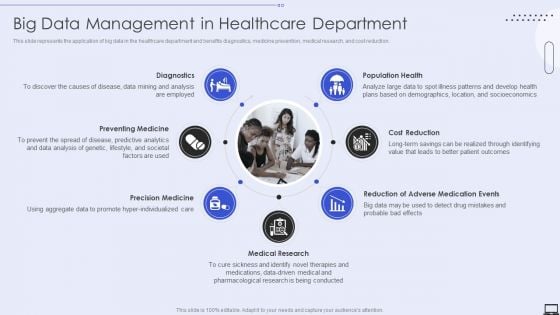
Big Data Management In Healthcare Department Ppt PowerPoint Presentation File Infographics PDF
Presenting Big Data Management In Healthcare Department Ppt PowerPoint Presentation File Infographics PDF to provide visual cues and insights. Share and navigate important information on seven stages that need your due attention. This template can be used to pitch topics like Cost Reduction, Medical Research, Precision Medicine. In addtion, this PPT design contains high resolution images, graphics, etc, that are easily editable and available for immediate download.
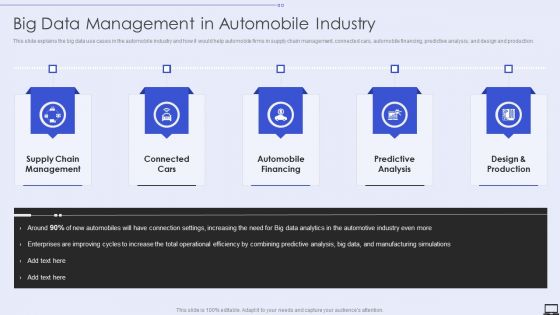
Big Data Management In Automobile Industry Ppt PowerPoint Presentation File Infographics PDF
Presenting Big Data Management In Automobile Industry Ppt PowerPoint Presentation File Infographics PDF to provide visual cues and insights. Share and navigate important information on five stages that need your due attention. This template can be used to pitch topics like Automobile Financing, Predictive Analysis, Supply Chain Management. In addtion, this PPT design contains high resolution images, graphics, etc, that are easily editable and available for immediate download.
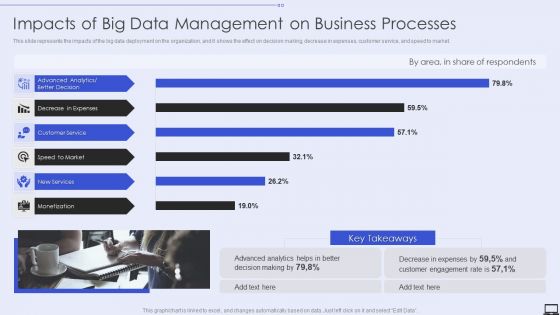
Impacts Of Big Data Management On Business Processes Ppt PowerPoint Presentation File Infographics PDF
This slide represents the impacts of the big data deployment on the organization, and it shows the effect on decision making, decrease in expenses, customer service, and speed to market. Deliver and pitch your topic in the best possible manner with this Impacts Of Big Data Management On Business Processes Ppt PowerPoint Presentation File Infographics PDF. Use them to share invaluable insights on Decision Making, Expenses, Customer Engagement Rate and impress your audience. This template can be altered and modified as per your expectations. So, grab it now.
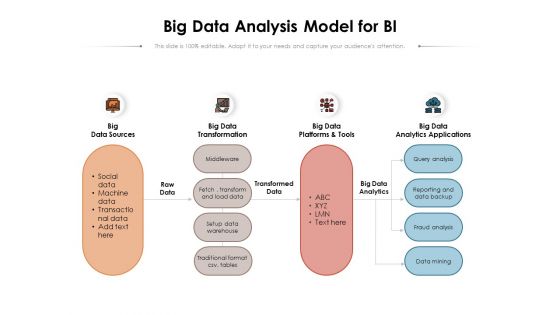
Big Data Analysis Model For BI Ppt PowerPoint Presentation Infographic Template Portfolio PDF
Presenting this set of slides with name big data analysis model for bi ppt powerpoint presentation infographic template portfolio pdf. This is a four stage process. The stages in this process are big data sources, big data transformation, big data platforms and tools, big data analytics applications. This is a completely editable PowerPoint presentation and is available for immediate download. Download now and impress your audience.
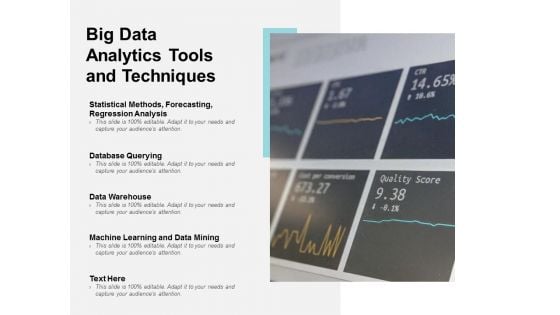
Big Data Analytics Tools And Techniques Ppt PowerPoint Presentation Infographic Template Good
Presenting this set of slides with name big data analytics tools and techniques ppt powerpoint presentation infographic template good. This is a one stage process. The stages in this process are big data analysis, data management, technologies segmentation. This is a completely editable PowerPoint presentation and is available for immediate download. Download now and impress your audience.
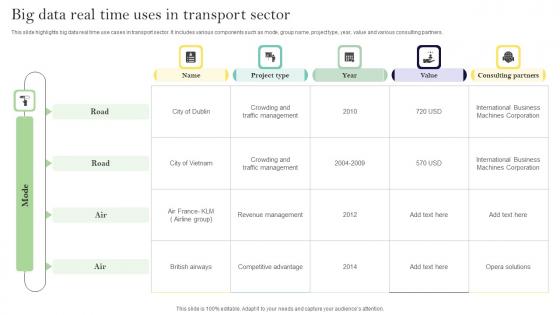
Big Data Real Time Uses In Transport Sector Ppt Infographic Template Designs Pdf
This slide highlights big data real time use cases in transport sector. It includes various components such as mode, group name, project type, year, value and various consulting partners. Showcasing this set of slides titled Big Data Real Time Uses In Transport Sector Ppt Infographic Template Designs Pdf. The topics addressed in these templates are Road, Air, Project Type. All the content presented in this PPT design is completely editable. Download it and make adjustments in color, background, font etc. as per your unique business setting. This slide highlights big data real time use cases in transport sector. It includes various components such as mode, group name, project type, year, value and various consulting partners.
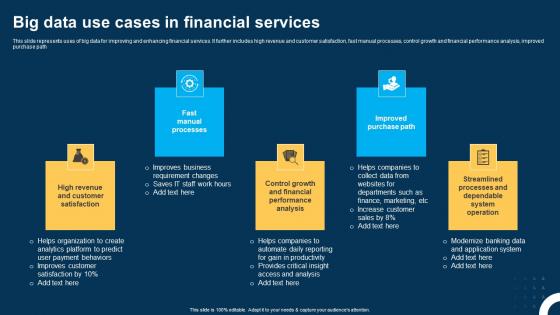
Big Data Use Cases In Financial Services Ppt Layouts Infographic Template pdf
This slide represents uses of big data for improving and enhancing financial services. It further includes high revenue and customer satisfaction, fast manual processes, control growth and financial performance analysis, improved purchase path. Showcasing this set of slides titled Big Data Use Cases In Financial Services Ppt Layouts Infographic Template pdf. The topics addressed in these templates are Fast Manual Processes, Improved Purchase Path, High Revenue. All the content presented in this PPT design is completely editable. Download it and make adjustments in color, background, font etc. as per your unique business setting. This slide represents uses of big data for improving and enhancing financial services. It further includes high revenue and customer satisfaction, fast manual processes, control growth and financial performance analysis, improved purchase path.
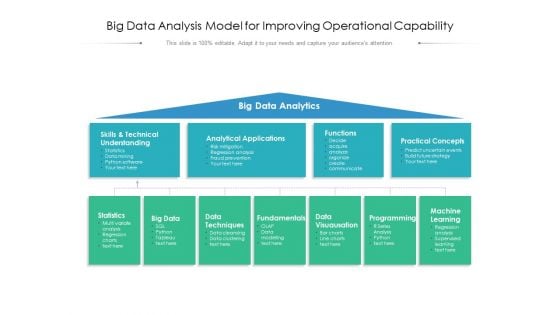
Big Data Analysis Model For Improving Operational Capability Ppt PowerPoint Presentation Infographics Visuals PDF
Presenting this set of slides with name big data analysis model for improving operational capability ppt powerpoint presentation infographics visuals pdf. This is a one stage process. The stages in this process are big data analytics, skills and technical understanding, analytical applications, functions, practical concepts, statistics, big data, data techniques, fundamentals, data visuausation, programming, machine learning. This is a completely editable PowerPoint presentation and is available for immediate download. Download now and impress your audience.
Big Data Management Model With Proactive Monitoring Ppt PowerPoint Presentation Icon Infographics PDF
Presenting big data management model with proactive monitoring ppt powerpoint presentation icon infographics pdf to dispense important information. This template comprises four stages. It also presents valuable insights into the topics including monitor, data governance, business. This is a completely customizable PowerPoint theme that can be put to use immediately. So, download it and address the topic impactfully.
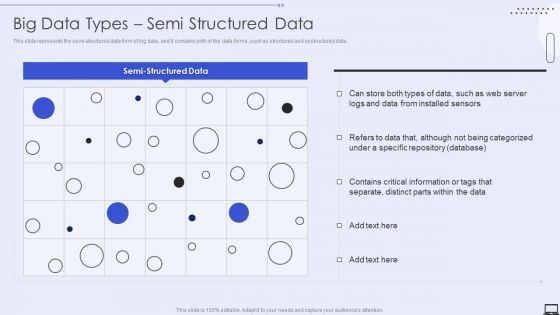
Big Data Types Semi Structured Data Ppt PowerPoint Presentation File Infographic Template PDF
This slide represents the semi structured data form of big data, and it contains both of the data forms, such as structured and unstructured data. Deliver and pitch your topic in the best possible manner with this Big Data Types Semi Structured Data Ppt PowerPoint Presentation File Infographic Template PDF. Use them to share invaluable insights on Database, Information and impress your audience. This template can be altered and modified as per your expectations. So, grab it now.
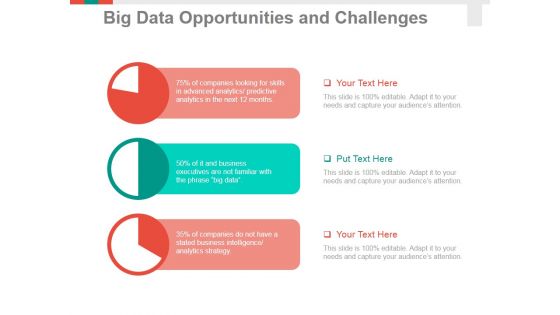
Big Data Opportunities And Challenges Template 1 Ppt PowerPoint Presentation Infographic Template Summary
This is a big data opportunities and challenges template 1 ppt powerpoint presentation infographic template summary. This is a three stage process. The stages in this process are business, pie chart, finance, marketing, analysis, strategy.
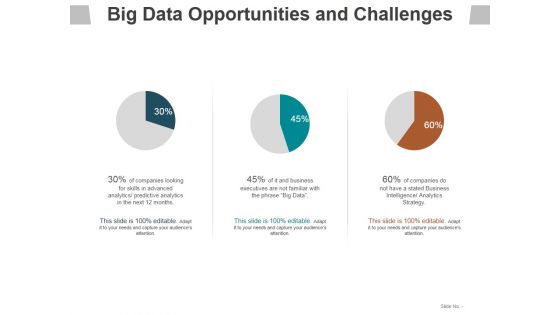
Big Data Opportunities And Challenges Template 2 Ppt PowerPoint Presentation Infographic Template Slides
This is a big data opportunities and challenges template 2 ppt powerpoint presentation infographic template slides. This is a three stage process. The stages in this process are business, management, marketing, process, success.
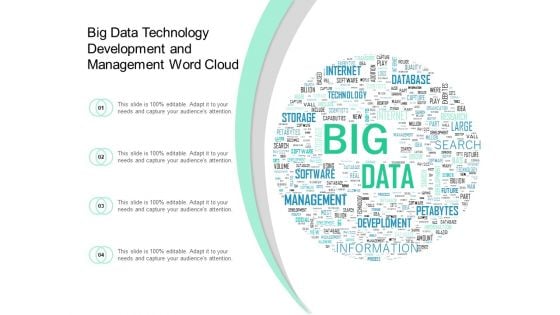
Big Data Technology Development And Management Word Cloud Ppt Powerpoint Presentation Pictures Infographic Template
This is a big data technology development and management word cloud ppt powerpoint presentation pictures infographic template. This is a four stage process. The stages in this process are success, business, motivation, management, always, objectives, item, organizational, money, taking.
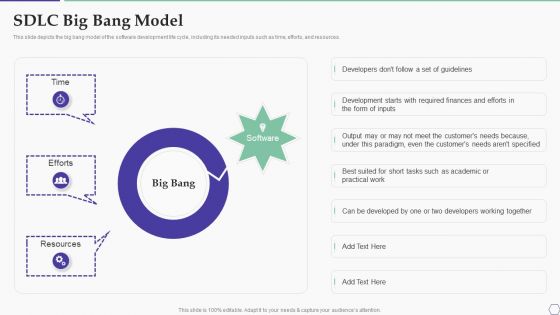
Solution Development Process SDLC Big Bang Model Infographics PDF
This slide depicts the big bang model of the software development life cycle, including its needed inputs such as time, efforts, and resources.Deliver an awe inspiring pitch with this creative Solution Development Process SDLC Big Bang Model Infographics PDF bundle. Topics like Required Finances, Developers Working, Even Customers can be discussed with this completely editable template. It is available for immediate download depending on the needs and requirements of the user.
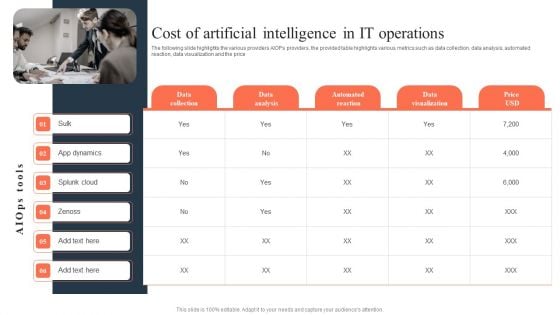
Ml And Big Data In Information Technology Processes Cost Of Artificial Intelligence In IT Operations Infographics PDF
The following slide highlights the various providers AIOPs providers, the provided table highlights various metrics such as data collection, data analysis, automated reaction, data visualization and the price Do you have to make sure that everyone on your team knows about any specific topic I yes, then you should give Ml And Big Data In Information Technology Processes Cost Of Artificial Intelligence In IT Operations Infographics PDF a try. Our experts have put a lot of knowledge and effort into creating this impeccable Ml And Big Data In Information Technology Processes Cost Of Artificial Intelligence In IT Operations Infographics PDF. You can use this template for your upcoming presentations, as the slides are perfect to represent even the tiniest detail. You can download these templates from the Slidegeeks website and these are easy to edit. So grab these today.
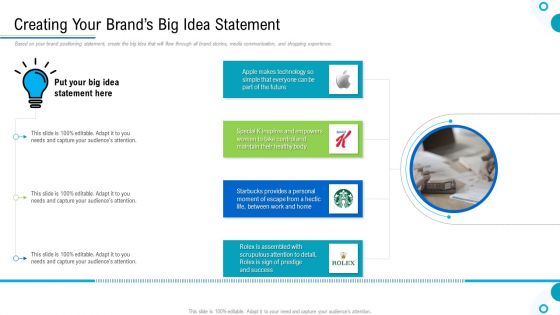
Brand Promotion And Management Plan Creating Your Brands Big Idea Statement Infographics PDF
Based on your brand positioning statement, create the big idea that will flow through all brand stories, media communication, and shopping experience. This is a brand promotion and management plan creating your brands big idea statement infographics pdf template with various stages. Focus and dispense information on four stages using this creative set, that comes with editable features. It contains large content boxes to add your information on topics like success, technology, maintain. You can also showcase facts, figures, and other relevant content using this PPT layout. Grab it now.
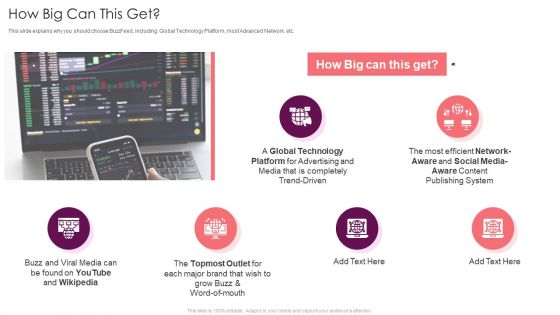
Buzzfeed Investment Financing Elevator How Big Can This Get Ppt Infographics Example Topics PDF
This slide explains why you should choose BuzzFeed, including Global Technology Platform, most Advanced Network, etc. Presenting buzzfeed investment financing elevator how big can this get ppt infographics example topics pdf to provide visual cues and insights. Share and navigate important information on six stages that need your due attention. This template can be used to pitch topics like global technology, social media aware, brand. In addtion, this PPT design contains high resolution images, graphics, etc, that are easily editable and available for immediate download.
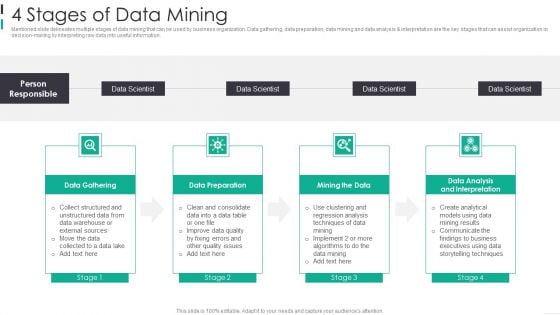
4 Stages Of Data Mining Infographics PDF
Mentioned slide delineates multiple stages of data mining that can be used by business organization. Data gathering, data preparation, data mining and data analysis and interpretation are the key stages that can assist organization in decision-making by interpreting raw data into useful information. Presenting 4 Stages Of Data Mining Infographics PDF to dispense important information. This template comprises four stages. It also presents valuable insights into the topics including Data Gathering, Data Preparation, Mining The Data This is a completely customizable PowerPoint theme that can be put to use immediately. So, download it and address the topic impactfully.
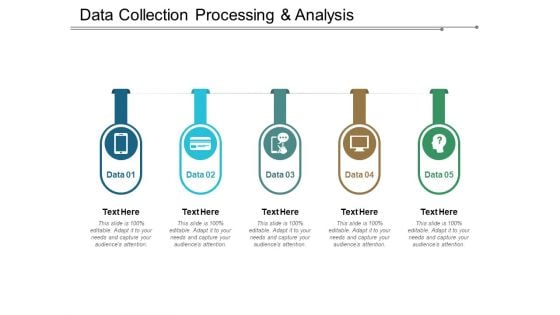
Data Collection Processing And Analysis Ppt PowerPoint Presentation Pictures Infographics
This is a data collection processing and analysis ppt powerpoint presentation pictures infographics. This is a five stage process. The stages in this process are data flow, data management, big data.
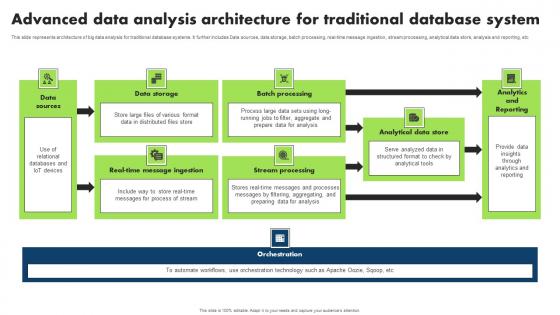
Advanced Data Analysis Architecture For Traditional Database System Infographics Pdf
This slide represents architecture of big data analysis for traditional database systems. It further includes Data sources, data storage, batch processing, real time message ingestion, stream processing, analytical data store, analysis and reporting, etc Showcasing this set of slides titled Advanced Data Analysis Architecture For Traditional Database System Infographics Pdf. The topics addressed in these templates are Data Storage, Batch Processing, Stream Processing. All the content presented in this PPT design is completely editable. Download it and make adjustments in color, background, font etc. as per your unique business setting. This slide represents architecture of big data analysis for traditional database systems. It further includes Data sources, data storage, batch processing, real time message ingestion, stream processing, analytical data store, analysis and reporting, etc
Internal And External Data Sources Icon Infographics PDF
Persuade your audience using this Internal And External Data Sources Icon Infographics PDF . This PPT design covers Four stages, thus making it a great tool to use. It also caters to a variety of topics including Internal And External, Data Sources. Download this PPT design now to present a convincing pitch that not only emphasizes the topic but also showcases your presentation skills.
Predictive Data Analytics Ppt Powerpoint Presentation Infographics Master Slide Cpb
This is a predictive data analytics ppt powerpoint presentation infographics master slide cpb. This is a five stage process. The stages in this process are predictive data analytics.
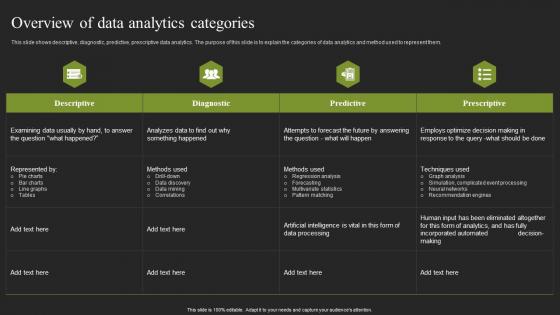
Overview Of Data Analytics Categories Cybernetic Systems Infographics Pdf
This slide shows descriptive, diagnostic, predictive, prescriptive data analytics. The purpose of this slide is to explain the categories of data analytics and method used to represent them. Create an editable Overview Of Data Analytics Categories Cybernetic Systems Infographics Pdf that communicates your idea and engages your audience. Whether you are presenting a business or an educational presentation, pre designed presentation templates help save time. Overview Of Data Analytics Categories Cybernetic Systems Infographics Pdf is highly customizable and very easy to edit, covering many different styles from creative to business presentations. Slidegeeks has creative team members who have crafted amazing templates. So, go and get them without any delay. This slide shows descriptive, diagnostic, predictive, prescriptive data analytics. The purpose of this slide is to explain the categories of data analytics and method used to represent them.
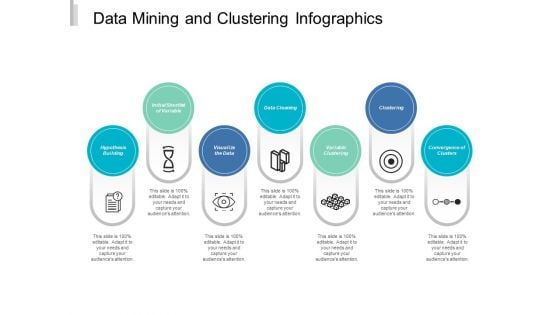
Data Mining And Clustering Infographics Ppt PowerPoint Presentation Portfolio Elements
This is a data mining and clustering infographics ppt powerpoint presentation portfolio elements. This is a seven stage process. The stages in this process are cluster analysis, cluster examination, cluster investigation.
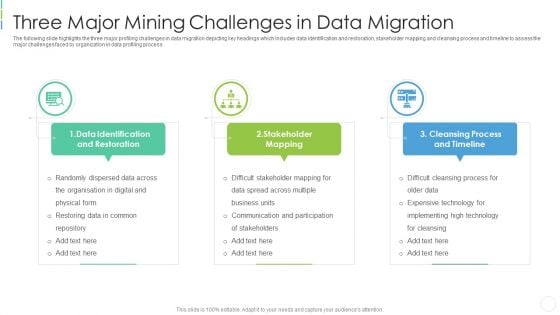
Three Major Mining Challenges In Data Migration Infographics PDF
The following slide highlights the three major profiling challenges in data migration depicting key headings which includes data identification and restoration, stakeholder mapping and cleansing process and timeline to assess the major challenges faced by organization in data profiling process Persuade your audience using this three major mining challenges in data migration infographics pdf . This PPT design covers three stages, thus making it a great tool to use. It also caters to a variety of topics including data identification and restoration, stakeholder mapping, cleansing process and timeline . Download this PPT design now to present a convincing pitch that not only emphasizes the topic but also showcases your presentation skills.
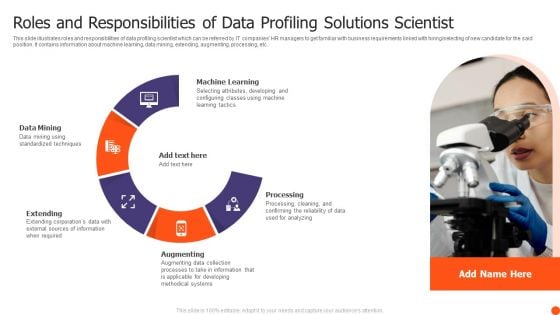
Roles And Responsibilities Of Data Profiling Solutions Scientist Infographics PDF
This slide illustrates roles and responsibilities of data profiling scientist which can be referred by IT companies HR managers to get familiar with business requirements linked with hiring or selecting of new candidate for the said position. It contains information about machine learning, data mining, extending, augmenting, processing, etc. Presenting Roles And Responsibilities Of Data Profiling Solutions Scientist Infographics PDF to dispense important information. This template comprises five stages. It also presents valuable insights into the topics including Data Mining, Machine Learning, Processing, Augmenting. This is a completely customizable PowerPoint theme that can be put to use immediately. So, download it and address the topic impactfully.
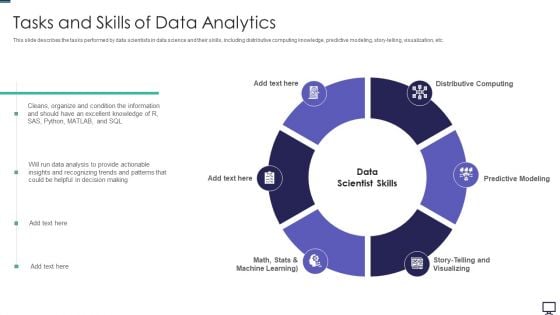
Tasks And Skills Of Data Analytics Ppt Infographics Summary PDF
This slide describes the tasks performed by data scientists in data science and their skills, including distributive computing knowledge, predictive modeling, story-telling, visualization, etc. Presenting tasks and skills of data analytics ppt infographics summary pdf to provide visual cues and insights. Share and navigate important information on six stages that need your due attention. This template can be used to pitch topics like data analysis, information, predictive modeling, distributive computing. In addtion, this PPT design contains high resolution images, graphics, etc, that are easily editable and available for immediate download.
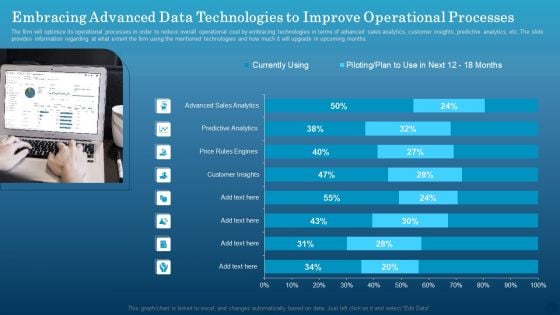
Embracing Advanced Data Technologies To Improve Operational Processes Infographics PDF
The firm will optimize its operational processes in order to reduce overall operational cost by embracing technologies in terms of advanced sales analytics, customer insights, predictive analytics, etc. The slide provides information regarding at what extent the firm using the mentioned technologies and how much it will upgrade in upcoming months. Formulating a presentation can take up a lot of effort and time, so the content and message should always be the primary focus. The visuals of the PowerPoint can enhance the presenters message, so our Embracing Advanced Data Technologies To Improve Operational Processes Infographics PDF was created to help save time. Instead of worrying about the design, the presenter can concentrate on the message while our designers work on creating the ideal templates for whatever situation is needed. Slidegeeks has experts for everything from amazing designs to valuable content, we have put everything into Embracing Advanced Data Technologies To Improve Operational Processes Infographics PDF.
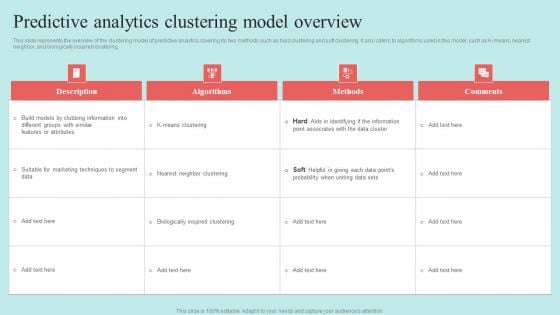
Predictive Data Model Predictive Analytics Clustering Model Overview Infographics PDF
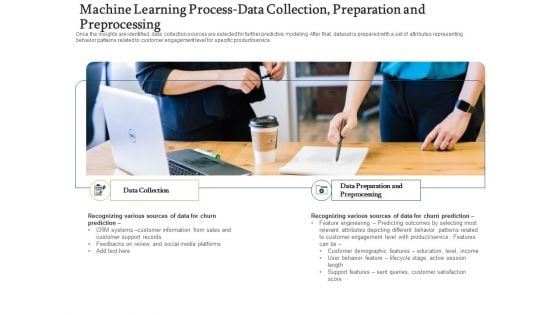
Machine Learning Process Data Collection Preparation And Preprocessing Infographics PDF
Presenting forecasting managing consumer attrition business advantage acquisition strategy churned customer sample pdf to provide visual cues and insights. Share and navigate important information on two stages that need your due attention. This template can be used to pitch topics like recognizing various sources of data for churn prediction, recognizing various sources of data for churn prediction, data preparation and preprocessing. In addtion, this PPT design contains high resolution images, graphics, etc, that are easily editable and available for immediate download.
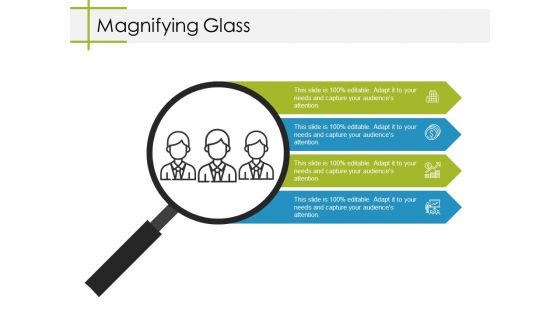
Magnifying Glass Ppt PowerPoint Presentation Infographics Infographics
This is a magnifying glass ppt powerpoint presentation infographics infographics. This is a four stage process. The stages in this process are business, marketing, magnifying glass, icons, strategy.
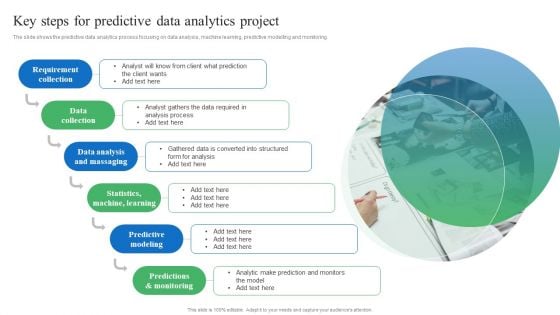
Toolkit For Data Science And Analytics Transition Key Steps For Predictive Data Analytics Project Infographics PDF
The slide shows the predictive data analytics process focusing on data analysis, machine learning, predictive modelling and monitoring. Formulating a presentation can take up a lot of effort and time, so the content and message should always be the primary focus. The visuals of the PowerPoint can enhance the presenters message, so our Toolkit For Data Science And Analytics Transition Key Steps For Predictive Data Analytics Project Infographics PDF was created to help save time. Instead of worrying about the design, the presenter can concentrate on the message while our designers work on creating the ideal templates for whatever situation is needed. Slidegeeks has experts for everything from amazing designs to valuable content, we have put everything into Toolkit For Data Science And Analytics Transition Key Steps For Predictive Data Analytics Project Infographics PDF.
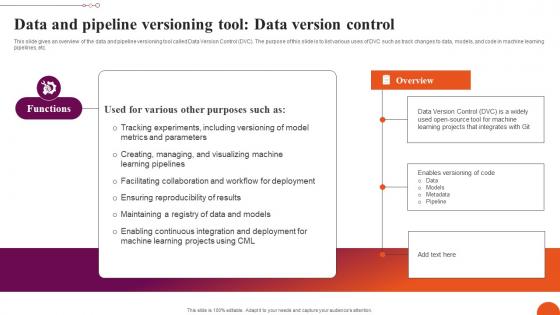
Data And Pipeline Versioning Tool Data Version Exploring Machine Learning Operations Infographics Pdf
This slide gives an overview of the data and pipeline versioning tool called Data Version Control DVC. The purpose of this slide is to list various uses of DVC such as track changes to data, models, and code in machine learning pipelines, etc. Slidegeeks is one of the best resources for PowerPoint templates. You can download easily and regulate Data And Pipeline Versioning Tool Data Version Exploring Machine Learning Operations Infographics Pdf for your personal presentations from our wonderful collection. A few clicks is all it takes to discover and get the most relevant and appropriate templates. Use our Templates to add a unique zing and appeal to your presentation and meetings. All the slides are easy to edit and you can use them even for advertisement purposes. This slide gives an overview of the data and pipeline versioning tool called Data Version Control DVC. The purpose of this slide is to list various uses of DVC such as track changes to data, models, and code in machine learning pipelines, etc.
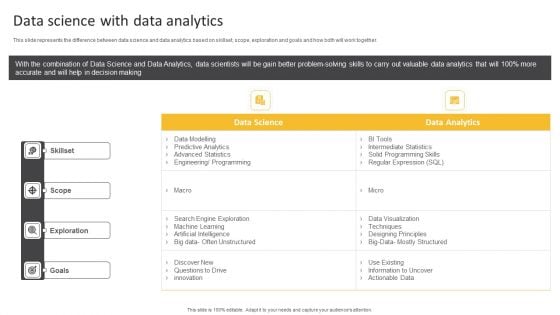
Information Science Data Science With Data Analytics Ppt PowerPoint Presentation Infographics Show PDF
This slide represents the difference between data science and data analytics based on skillset, scope, exploration and goals and how both will work together.Deliver and pitch your topic in the best possible manner with this Information Science Data Science With Data Analytics Ppt PowerPoint Presentation Infographics Show PDF. Use them to share invaluable insights on Engine Exploration, Machine Learning, Often Unstructured and impress your audience. This template can be altered and modified as per your expectations. So, grab it now.
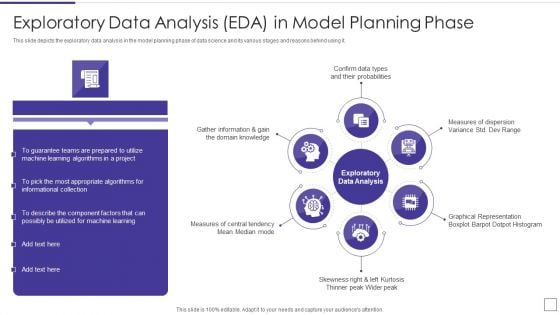
Data Mining Implementation Exploratory Data Analysis EDA In Model Planning Phase Infographics PDF
This slide depicts the exploratory data analysis in the model planning phase of data science and its various stages and reasons behind using it.This is a data mining implementation exploratory data analysis eda in model planning phase infographics pdf template with various stages. Focus and dispense information on six stages using this creative set, that comes with editable features. It contains large content boxes to add your information on topics like confirm data types and their probabilities, domain knowledge, measures of central tendency You can also showcase facts, figures, and other relevant content using this PPT layout. Grab it now.
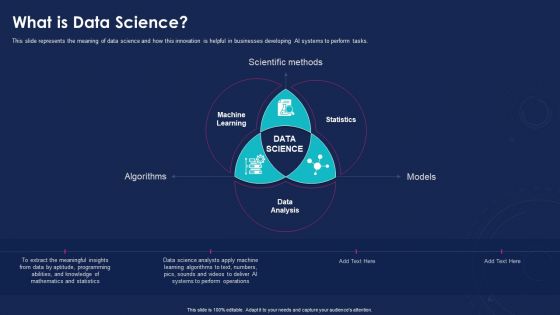
Data Analytics IT What Is Data Science Ppt Infographics Design Templates PDF
This slide represents the meaning of data science and how this innovation is helpful in businesses developing AI systems to perform tasks. This is a data analytics it what is data science ppt infographics design templates pdf template with various stages. Focus and dispense information on three stages using this creative set, that comes with editable features. It contains large content boxes to add your information on topics like algorithms, models, scientific methods. You can also showcase facts, figures, and other relevant content using this PPT layout. Grab it now.

Picture Showing Technician Welding Big Machine In Plant Ppt PowerPoint Presentation Infographic Template Influencers PDF
Pitch your topic with ease and precision using this picture showing technician welding big machine in plant ppt powerpoint presentation infographic template influencers pdf. This layout presents information on picture showing technician welding big machine in plant. It is also available for immediate download and adjustment. So, changes can be made in the color, design, graphics or any other component to create a unique layout.
Data Science Server Network Vector Icon Ppt Powerpoint Presentation Model Infographics
This is a data science server network vector icon ppt powerpoint presentation model infographics. The topics discussed in this diagram are data management icon, big data icon. This is a completely editable PowerPoint presentation, and is available for immediate download.
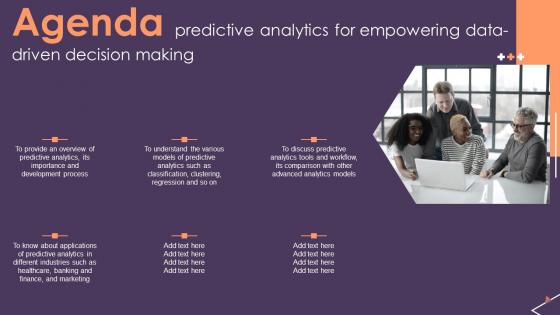
Agenda Predictive Analytics For Empowering Data Driven Decision Making Infographics Pdf
Make sure to capture your audiences attention in your business displays with our gratis customizable Agenda Predictive Analytics For Empowering Data Driven Decision Making Infographics Pdf These are great for business strategies, office conferences, capital raising or task suggestions. If you desire to acquire more customers for your tech business and ensure they stay satisfied, create your own sales presentation with these plain slides. Our Agenda Predictive Analytics For Empowering Data Driven Decision Making Infographics Pdf are topically designed to provide an attractive backdrop to any subject. Use them to look like a presentation pro.
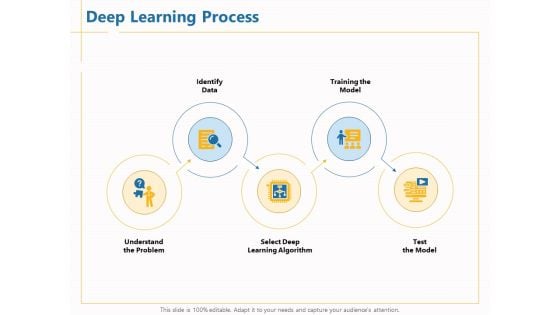
Boosting Machine Learning Deep Learning Process Data Ppt PowerPoint Presentation Infographics Template PDF
Presenting this set of slides with name boosting machine learning deep learning process data ppt powerpoint presentation infographics template pdf. This is a five stage process. The stages in this process are identify data, understand problem, select deep learning algorithm, training model, test model. This is a completely editable PowerPoint presentation and is available for immediate download. Download now and impress your audience.
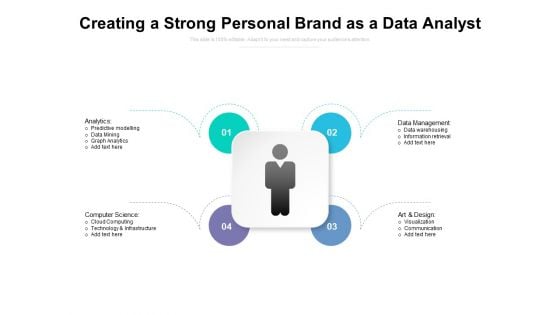
Creating A Strong Personal Brand As A Data Analyst Ppt PowerPoint Presentation Infographics Structure PDF
Presenting this set of slides with name creating a strong personal brand as a data analyst ppt powerpoint presentation infographics structure pdf. This is a four stage process. The stages in this process are analytics, data management, computer science, art and design, predictive modelling, data mining, graph analytics, cloud computing, technology and infrastructure, data warehousing, information retrieval, visualization, communication. This is a completely editable PowerPoint presentation and is available for immediate download. Download now and impress your audience.

Data Mining Business Intelligence Ppt PowerPoint Presentation Infographics Skills Cpb Pdf
Presenting this set of slides with name data mining business intelligence ppt powerpoint presentation infographics skills cpb pdf. This is an editable Powerpoint two stages graphic that deals with topics like data mining business intelligence to help convey your message better graphically. This product is a premium product available for immediate download and is 100 percent editable in Powerpoint. Download this now and use it in your presentations to impress your audience.
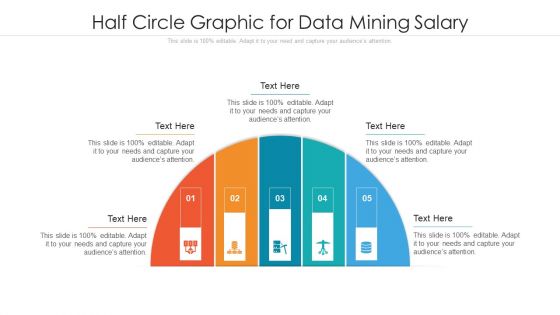
Half Circle Graphic For Data Mining Salary Ppt PowerPoint Presentation Infographics Samples PDF
Persuade your audience using this half circle graphic for data mining salary ppt powerpoint presentation infographics samples pdf. This PPT design covers five stages, thus making it a great tool to use. It also caters to a variety of topics including half circle graphic for data mining salary. Download this PPT design now to present a convincing pitch that not only emphasizes the topic but also showcases your presentation skills.
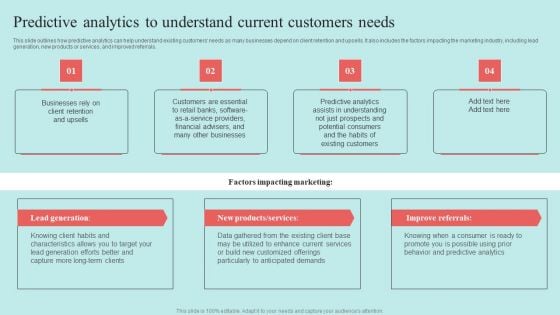
Predictive Data Model Predictive Analytics To Understand Current Customers Needs Infographics PDF
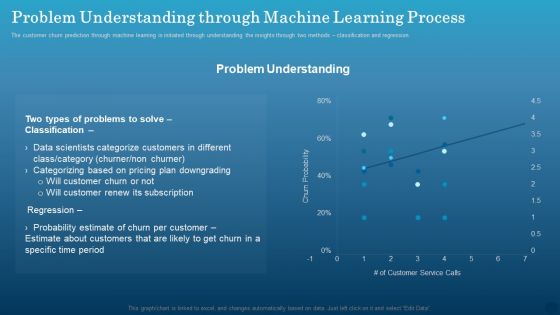
Data Monetization Approach To Drive Business Growth Problem Understanding Through Machine Learning Process Infographics PDF
The customer churn prediction through machine learning is initiated through understanding the insights through two methods classification and regression. Crafting an eye catching presentation has never been more straightforward. Let your presentation shine with this tasteful yet straightforward Data Monetization Approach To Drive Business Growth Problem Understanding Through Machine Learning Process Infographics PDF template. It offers a minimalistic and classy look that is great for making a statement. The colors have been employed intelligently to add a bit of playfulness while still remaining professional. Construct the ideal Data Monetization Approach To Drive Business Growth Problem Understanding Through Machine Learning Process Infographics PDF that effortlessly grabs the attention of your audience. Begin now and be certain to wow your customers.

Transformation Toolkit Competitive Intelligence Information Analysis Value Stream Information Data Analytics Structure Infographics PDF
The slides shows the stages of data analytics with reactive and proactive approach. In includes four steps collection, analysis, predictive and actions. Present like a pro with Transformation Toolkit Competitive Intelligence Information Analysis Value Stream Information Data Analytics Structure Infographics PDF Create beautiful presentations together with your team, using our easy to use presentation slides. Share your ideas in real time and make changes on the fly by downloading our templates. So whether you are in the office, on the go, or in a remote location, you can stay in sync with your team and present your ideas with confidence. With Slidegeeks presentation got a whole lot easier. Grab these presentations today.
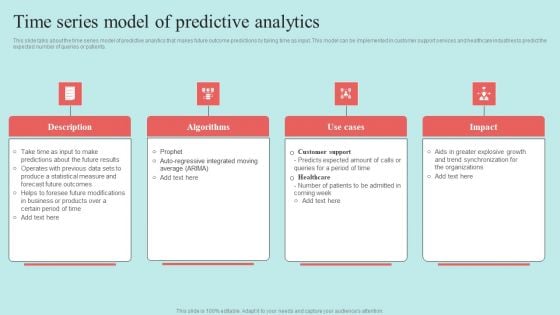
Predictive Data Model Time Series Model Of Predictive Analytics Infographics PDF
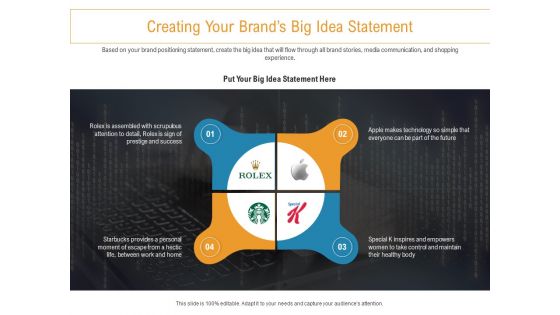
Developing New Trade Name Idea Creating Your Brands Big Idea Statement Ppt Infographic Template Graphics Template PDF
Based on your brand positioning statement, create the big idea that will flow through all brand stories, media communication, and shopping experience. This is a developing new trade name idea creating your brands big idea statement ppt infographic template graphics template pdf template with various stages. Focus and dispense information on four stages using this creative set, that comes with editable features. It contains large content boxes to add your information on topics like creating your brands big idea statement. You can also showcase facts, figures, and other relevant content using this PPT layout. Grab it now.

Customer Focus Ppt PowerPoint Presentation Infographics Samples
This is a customer focus ppt powerpoint presentation infographics samples. This is a one stage process. The stages in this process are customer focus, business, marketing, management, technology.
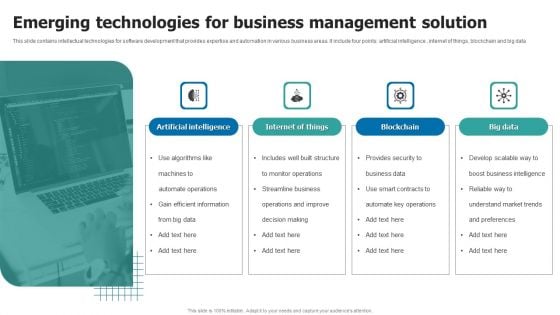
Emerging Technologies For Business Management Solution Infographics PDF
This slide contains intellectual technologies for software development that provides expertise and automation in various business areas. It include four points artificial intelligence , internet of things, blockchain and big data. Presenting Emerging Technologies For Business Management Solution Infographics PDF to dispense important information. This template comprises Four stages. It also presents valuable insights into the topics including Artificial Intelligence, Internet Of Things, Blockchain. This is a completely customizable PowerPoint theme that can be put to use immediately. So, download it and address the topic impactfully.
Magnifying Glass Ppt PowerPoint Presentation Infographics Sample
This is a magnifying glass ppt powerpoint presentation infographics sample. This is a four stage process. The stages in this process are magnifier glass, research, business, marketing, focus.


 Continue with Email

 Home
Home


