Big Data Technology
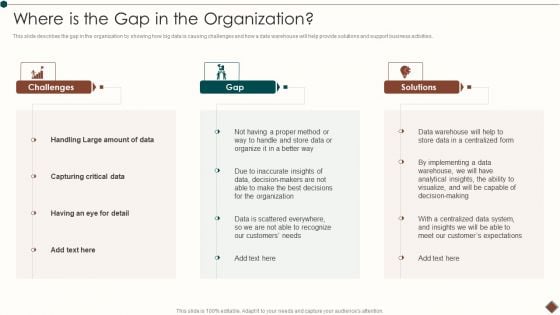
Data Warehouse Implementation Where Is The Gap In The Organization Information PDF
This slide describes the gap in the organization by showing how big data is causing challenges and how a data warehouse will help provide solutions and support business activities.Deliver an awe inspiring pitch with this creative Data Warehouse Implementation Where Is The Gap In The Organization Information PDF bundle. Topics like Capturing Critical, Data Handling Large, Data Centralized can be discussed with this completely editable template. It is available for immediate download depending on the needs and requirements of the user.
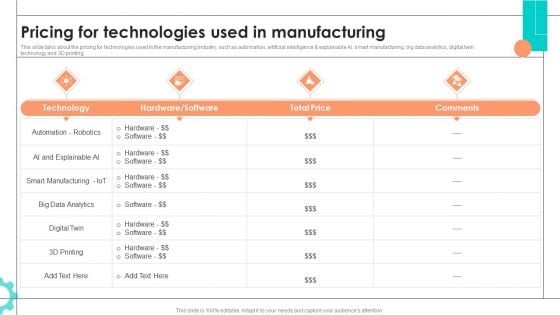
Intelligent Manufacturing Pricing For Technologies Used In Manufacturing Demonstration PDF
This slide talks about the pricing for technologies used in the manufacturing industry, such as automation, artificial intelligence and explainable AI, smart manufacturing, big data analytics, digital twin technology and 3D printing. Crafting an eye catching presentation has never been more straightforward. Let your presentation shine with this tasteful yet straightforward Intelligent Manufacturing Pricing For Technologies Used In Manufacturing Demonstration PDF template. It offers a minimalistic and classy look that is great for making a statement. The colors have been employed intelligently to add a bit of playfulness while still remaining professional. Construct the ideal Intelligent Manufacturing Pricing For Technologies Used In Manufacturing Demonstration PDF that effortlessly grabs the attention of your audience. Begin now and be certain to wow your customers.
Identifying Technologies To Invest In For Efficient Performance Icons PDF
Following slide provides information on the trending technologies like AI, blockchain and big data in which firm can invest for efficient business performance. This is a Identifying Technologies To Invest In For Efficient Performance Icons PDF template with various stages. Focus and dispense information on three stages using this creative set, that comes with editable features. It contains large content boxes to add your information on topics like Artificial Intelligence, Blockchain, Big Data. You can also showcase facts, figures, and other relevant content using this PPT layout. Grab it now.
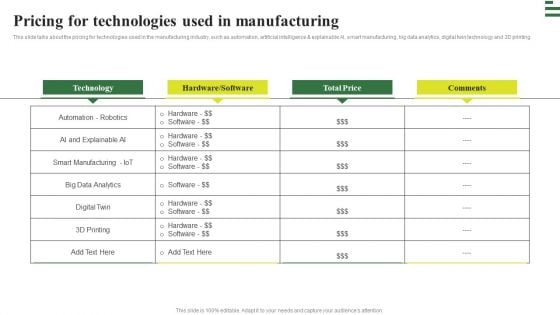
Transforming Manufacturing With Automation Pricing For Technologies Used Sample PDF
This slide talks about the pricing for technologies used in the manufacturing industry, such as automation, artificial intelligence and explainable AI, smart manufacturing, big data analytics, digital twin technology and 3D printing. Welcome to our selection of the Transforming Manufacturing With Automation Pricing For Technologies Used Sample PDF. These are designed to help you showcase your creativity and bring your sphere to life. Planning and Innovation are essential for any business that is just starting out. This collection contains the designs that you need for your everyday presentations. All of our PowerPoints are 100 percent editable, so you can customize them to suit your needs. This multi purpose template can be used in various situations. Grab these presentation templates today.
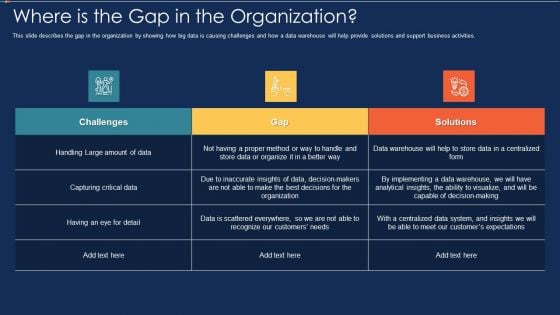
Data Warehousing IT Where Is The Gap In The Organization Ppt Shapes PDF
This slide describes the gap in the organization by showing how big data is causing challenges and how a data warehouse will help provide solutions and support business activities. Deliver and pitch your topic in the best possible manner with this data warehousing it where is the gap in the organization ppt shapes pdf. Use them to share invaluable insights on challenges, gap, solutions and impress your audience. This template can be altered and modified as per your expectations. So, grab it now.
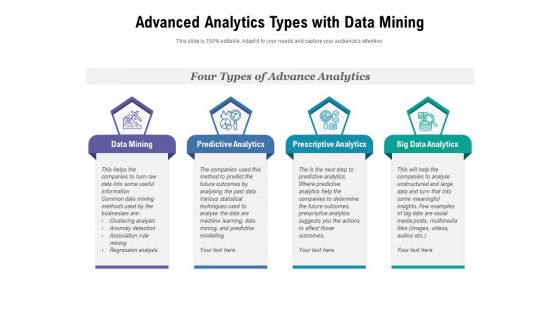
Advanced Analytics Types With Data Mining Ppt PowerPoint Presentation Slides Skills PDF
Persuade your audience using this advanced analytics types with data mining ppt powerpoint presentation slides skills pdf. This PPT design covers four stages, thus making it a great tool to use. It also caters to a variety of topics including data mining, predictive analytics, prescriptive analytics, big data analytics. Download this PPT design now to present a convincing pitch that not only emphasizes the topic but also showcases your presentation skills.
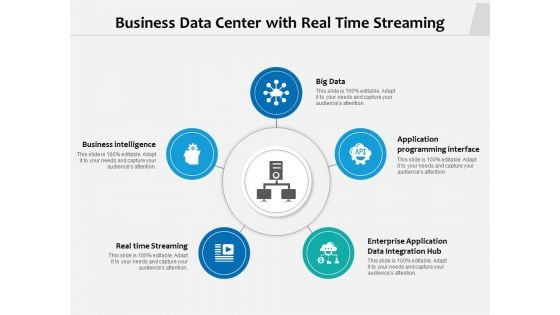
Business Data Center With Real Time Streaming Ppt PowerPoint Presentation Summary Tips PDF
Presenting business data center with real time streaming ppt powerpoint presentation summary tips pdf to dispense important information. This template comprises five stages. It also presents valuable insights into the topics including business intelligence, real time streaming, enterprise application data integration hub, application, big data. This is a completely customizable PowerPoint theme that can be put to use immediately. So, download it and address the topic impactfully.
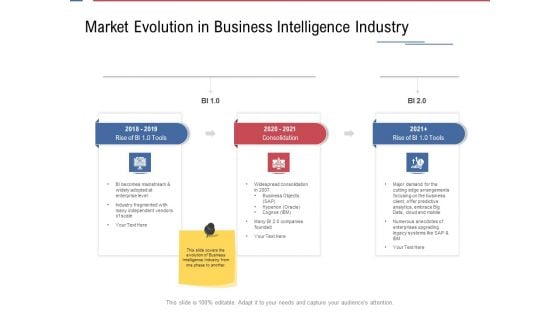
Data Assimilation Market Evolution In Business Intelligence Industry Ppt Gallery Files PDF
This is a data assimilation market evolution in business intelligence industry ppt gallery files pdf template with various stages. Focus and dispense information on three stages using this creative set, that comes with editable features. It contains large content boxes to add your information on topics like industry, business, objectives, legacy, big data. You can also showcase facts, figures, and other relevant content using this PPT layout. Grab it now.
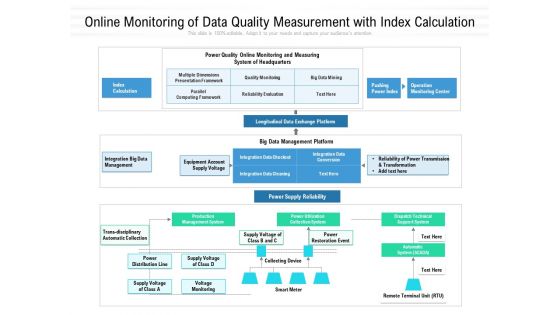
Online Monitoring Of Data Quality Measurement With Index Calculation Ppt PowerPoint Presentation Inspiration Graphics Template PDF
Presenting online monitoring of data quality measurement with index calculation ppt powerpoint presentation inspiration graphics template pdf to dispense important information. This template comprises one stages. It also presents valuable insights into the topics including quality monitoring, reliability evaluation, big data mining, pushing power index, index calculation, multiple dimensions presentation framework. This is a completely customizable PowerPoint theme that can be put to use immediately. So, download it and address the topic impactfully.
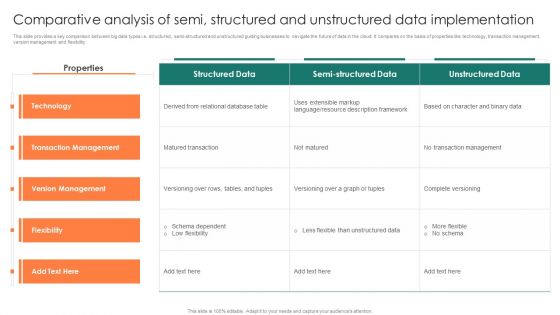
Comparative Analysis Of Semi Structured And Unstructured Data Implementation Professional PDF
This slide provides a key comparison between big data types i.e. structured, semi-structured and unstructured guiding businesses to navigate the future of data in the cloud. It compares on the basis of properties like technology, transaction management, version management and flexibility. Showcasing this set of slides titled Comparative Analysis Of Semi Structured And Unstructured Data Implementation Professional PDF. The topics addressed in these templates are Technology, Transaction Management, Version Management, Flexibility. All the content presented in this PPT design is completely editable. Download it and make adjustments in color, background, font etc. as per your unique business setting.

High Level Informational Architecture Including Structured Data Implementation Lake Ideas PDF
This slide represents a high-level informational architecture for the data analyst driven organizations that help support numerous data analysis patterns. It covers three principles,SQL as analytics, big query structured data lake and data consuming layer. Pitch your topic with ease and precision using this High Level Informational Architecture Including Structured Data Implementation Lake Ideas PDF. This layout presents information on Data Mart Layer, Integrated Data Layer, Data Consuming Layer. It is also available for immediate download and adjustment. So, changes can be made in the color, design, graphics or any other component to create a unique layout.
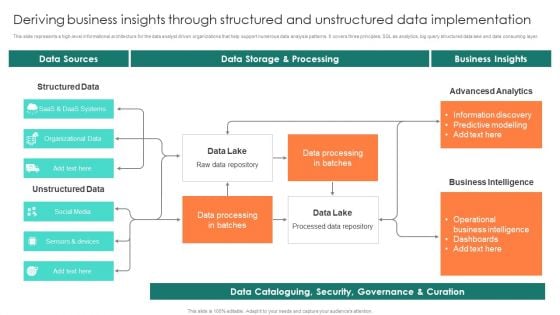
Deriving Business Insights Through Structured And Unstructured Data Implementation Summary PDF
This slide represents a high-level informational architecture for the data analyst driven organizations that help support numerous data analysis patterns. It covers three principles, SQL as analytics, big query structured data lake and data consuming layer. Showcasing this set of slides titled Deriving Business Insights Through Structured And Unstructured Data Implementation Summary PDF. The topics addressed in these templates are Saas And Daas Systems, Organizational Data, Social Media, Sensors And Devices. All the content presented in this PPT design is completely editable. Download it and make adjustments in color, background, font etc. as per your unique business setting.
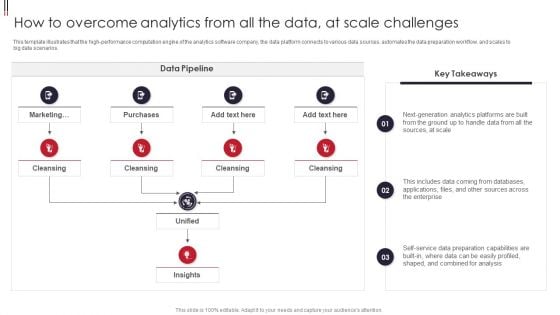
Information Visualizations Playbook How To Overcome Analytics From All The Data At Scale Challenges Mockup PDF
This template illustrates that the high performance computation engine of the analytics software company, the data platform connects to various data sources, automates the data preparation workflow, and scales to big data scenarios. Deliver an awe inspiring pitch with this creative Information Visualizations Playbook How To Overcome Analytics From All The Data At Scale Challenges Mockup PDF bundle. Topics like Purchases, Marketing, Data Pipeline can be discussed with this completely editable template. It is available for immediate download depending on the needs and requirements of the user.
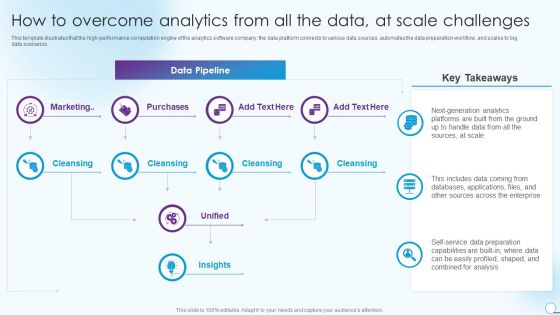
How To Overcome Analytics From All The Data At Scale Challenges Topics PDF
This template illustrates that the high performance computation engine of the analytics software company, the data platform connects to various data sources, automates the data preparation workflow, and scales to big data scenarios. Deliver and pitch your topic in the best possible manner with this How To Overcome Analytics From All The Data At Scale Challenges Topics PDF. Use them to share invaluable insights on Purchases, Marketing, Data Pipeline and impress your audience. This template can be altered and modified as per your expectations. So, grab it now.
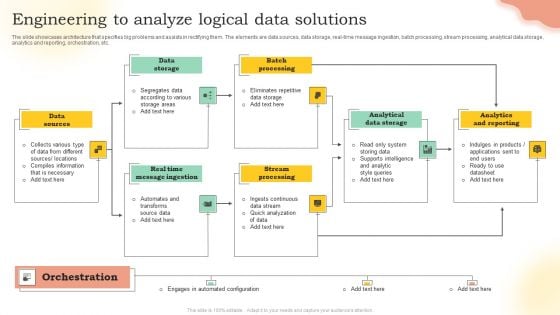
Engineering To Analyze Logical Data Solutions Ppt PowerPoint Presentation Gallery Design Inspiration PDF
The slide showcases architecture that specifies big problems and assists in rectifying them. The elements are data sources, data storage, real-time message ingestion, batch processing, stream processing, analytical data storage, analytics and reporting, orchestration, etc. Presenting Engineering To Analyze Logical Data Solutions Ppt PowerPoint Presentation Gallery Design Inspiration PDF to dispense important information. This template comprises seven stages. It also presents valuable insights into the topics including Data Storage, Batch Processing, Analytical Data Storage, Analytics And Reporting. This is a completely customizable PowerPoint theme that can be put to use immediately. So, download it and address the topic impactfully.
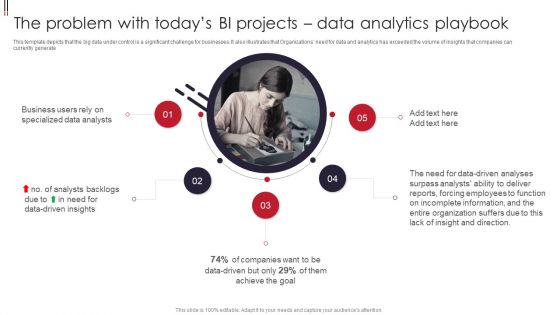
Information Visualizations Playbook The Problem With Todays BI Projects Data Analytics Playbook Portrait PDF
This template depicts that the big data under control is a significant challenge for businesses. It also illustrates that Organizations need for data and analytics has exceeded the volume of insights that companies can currently generate. Presenting Information Visualizations Playbook The Problem With Todays BI Projects Data Analytics Playbook Portrait PDF to provide visual cues and insights. Share and navigate important information on five stages that need your due attention. This template can be used to pitch topics like Business Users, Specialized Data Analysts, Data Driven Insights. In addtion, this PPT design contains high resolution images, graphics, etc, that are easily editable and available for immediate download.
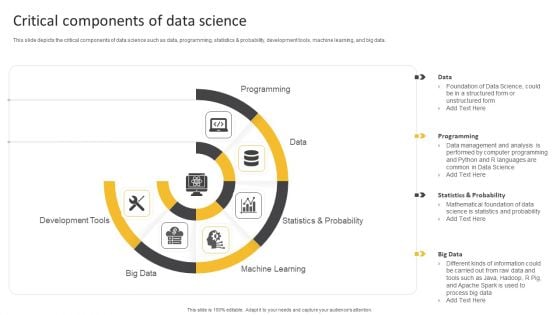
Information Science Critical Components Of Data Science Ppt PowerPoint Presentation Gallery Objects PDF
This slide depicts the critical components of data science such as data, programming, statistics probability, development tools, machine learning, and big data.Presenting Information Science Critical Components Of Data Science Ppt PowerPoint Presentation Gallery Objects PDF to provide visual cues and insights. Share and navigate important information on six stages that need your due attention. This template can be used to pitch topics like Programming, Development Tools, Machine Learning. In addtion, this PPT design contains high resolution images, graphics, etc, that are easily editable and available for immediate download.
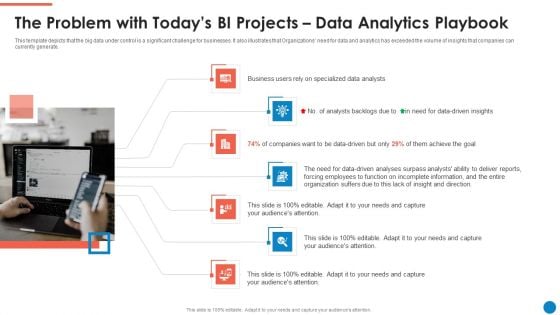
The Problem With Todays Bi Projects Data Analytics Playbook Ideas PDF
This template depicts that the big data under control is a significant challenge for businesses. It also illustrates that Organizations need for data and analytics has exceeded the volume of insights that companies can currently generate. This is a The Problem With Todays Bi Projects Data Analytics Playbook Ideas PDF template with various stages. Focus and dispense information on seven stages using this creative set, that comes with editable features. It contains large content boxes to add your information on topics like Business Users, Data Analysts, Analysts Backlogs, Employees. You can also showcase facts, figures, and other relevant content using this PPT layout. Grab it now.
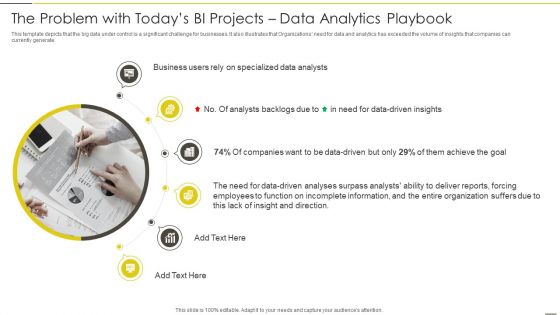
Administered Data And Analytic Quality Playbook The Problem With Todays Bi Projects Formats PDF
This template depicts that the big data under control is a significant challenge for businesses. It also illustrates that Organizations need for data and analytics has exceeded the volume of insights that companies can currently generate.Presenting Administered Data And Analytic Quality Playbook The Problem With Todays Bi Projects Formats PDF to provide visual cues and insights. Share and navigate important information on six stages that need your due attention. This template can be used to pitch topics like Specialized Analysts, Analysts Backlogs, Function Incomplete In addtion, this PPT design contains high resolution images, graphics, etc, that are easily editable and available for immediate download.
Data Analysis Reports Under Magnifying Glass Ppt PowerPoint Presentation Icon Graphic Tips
Presenting this set of slides with name data analysis reports under magnifying glass ppt powerpoint presentation icon graphic tips. This is a three stage process. The stages in this process are data visualization icon, research analysis, business focus. This is a completely editable PowerPoint presentation and is available for immediate download. Download now and impress your audience.
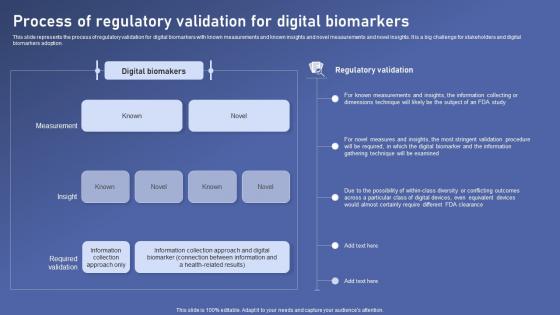
Process Of Regulatory Validation Biomedical Data Science And Health Informatics Ideas Pdf
This slide represents the process of regulatory validation for digital biomarkers with known measurements and known insights and novel measurements and novel insights. It is a big challenge for stakeholders and digital biomarkers adoption. Do you have to make sure that everyone on your team knows about any specific topic I yes, then you should give Process Of Regulatory Validation Biomedical Data Science And Health Informatics Ideas Pdf a try. Our experts have put a lot of knowledge and effort into creating this impeccable Process Of Regulatory Validation Biomedical Data Science And Health Informatics Ideas Pdf. You can use this template for your upcoming presentations, as the slides are perfect to represent even the tiniest detail. You can download these templates from the Slidegeeks website and these are easy to edit. So grab these today This slide represents the process of regulatory validation for digital biomarkers with known measurements and known insights and novel measurements and novel insights. It is a big challenge for stakeholders and digital biomarkers adoption.
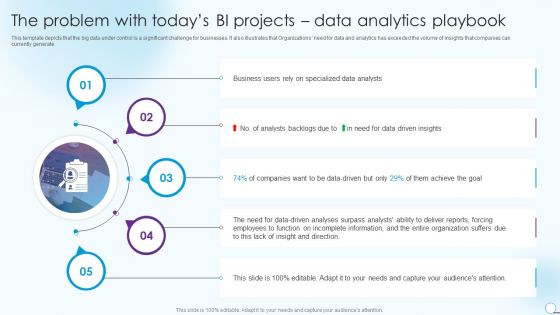
Information Analytics And Ml Strategy Playbook The Problem With Todays BI Projects Data Analytics Playbook Rules PDF
This template depicts that the big data under control is a significant challenge for businesses. It also illustrates that Organizations need for data and analytics has exceeded the volume of insights that companies can currently generate. This is a Information Analytics And Ml Strategy Playbook The Problem With Todays BI Projects Data Analytics Playbook Rules PDF template with various stages. Focus and dispense information on five stages using this creative set, that comes with editable features. It contains large content boxes to add your information on topics like Specialized Data Analysts, Business Users, Entire Organization. You can also showcase facts, figures, and other relevant content using this PPT layout. Grab it now.
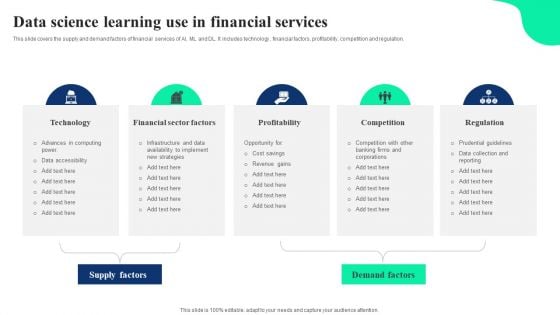
Data Science Learning Use In Financial Services Ppt Infographic Template Graphics PDF
This slide covers the supply and demand factors of financial services of AI, ML and DL. It includes technology , financial factors, profitability, competition and regulation. Presenting Data Science Learning Use In Financial Services Ppt Infographic Template Graphics PDF to dispense important information. This template comprises five stages. It also presents valuable insights into the topics including Technology, Financial Sector Factors, Profitability, Competition, Regulation. This is a completely customizable PowerPoint theme that can be put to use immediately. So, download it and address the topic impactfully.

Information Analysis And BI Playbook The Problem With Todays BI Projects Data Analytics Playbook Portrait PDF
This template depicts that the big data under control is a significant challenge for businesses. It also illustrates that Organizations need for data and analytics has exceeded the volume of insights that companies can currently generate. Do you have an important presentation coming up Are you looking for something that will make your presentation stand out from the rest Look no further than Information Analysis And BI Playbook The Problem With Todays BI Projects Data Analytics Playbook Portrait PDF. With our professional designs, you can trust that your presentation will pop and make delivering it a smooth process. And with Slidegeeks, you can trust that your presentation will be unique and memorable. So why wait Grab Information Analysis And BI Playbook The Problem With Todays BI Projects Data Analytics Playbook Portrait PDF today and make your presentation stand out from the rest.

ChatGPT For Educators Best Practices Data Usage Applications Of ChatGPT In Education ChatGPT SS V
This slide represents details related to best practices for using AI technology designed to understand and generate human-like texts based on received inputs, by educators for teaching purposes. It includes detailed related to use of ChatGPT for effective data usage. If your project calls for a presentation, then Slidegeeks is your go-to partner because we have professionally designed, easy-to-edit templates that are perfect for any presentation. After downloading, you can easily edit ChatGPT For Educators Best Practices Data Usage Applications Of ChatGPT In Education ChatGPT SS V and make the changes accordingly. You can rearrange slides or fill them with different images. Check out all the handy templates This slide represents details related to best practices for using AI technology designed to understand and generate human-like texts based on received inputs, by educators for teaching purposes. It includes detailed related to use of ChatGPT for effective data usage.
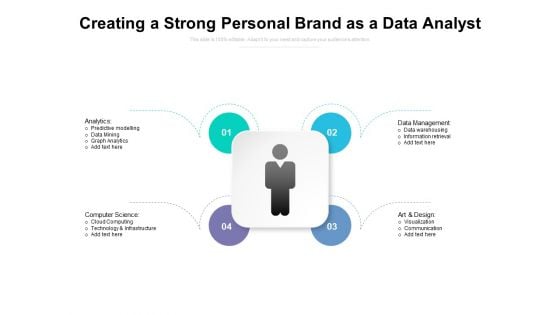
Creating A Strong Personal Brand As A Data Analyst Ppt PowerPoint Presentation Infographics Structure PDF
Presenting this set of slides with name creating a strong personal brand as a data analyst ppt powerpoint presentation infographics structure pdf. This is a four stage process. The stages in this process are analytics, data management, computer science, art and design, predictive modelling, data mining, graph analytics, cloud computing, technology and infrastructure, data warehousing, information retrieval, visualization, communication. This is a completely editable PowerPoint presentation and is available for immediate download. Download now and impress your audience.
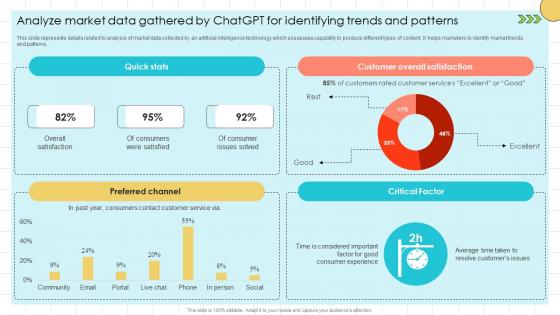
Chat GPT Prompts For Market Analyze Market Data Gathered By ChatGPT SS V
This slide represents details related to analysis of market data collected by an artificial intelligence technology which possesses capability to produce different types of content. It helps marketers to identify market trends and patterns. Do you have to make sure that everyone on your team knows about any specific topic I yes, then you should give Chat GPT Prompts For Market Analyze Market Data Gathered By ChatGPT SS V a try. Our experts have put a lot of knowledge and effort into creating this impeccable Chat GPT Prompts For Market Analyze Market Data Gathered By ChatGPT SS V. You can use this template for your upcoming presentations, as the slides are perfect to represent even the tiniest detail. You can download these templates from the Slidegeeks website and these are easy to edit. So grab these today This slide represents details related to analysis of market data collected by an artificial intelligence technology which possesses capability to produce different types of content. It helps marketers to identify market trends and patterns.
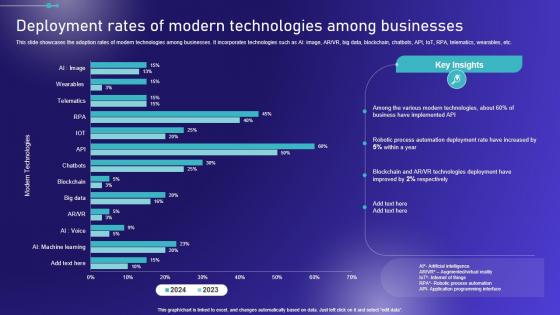
Deployment Rates Of Modern Technologies Embracing Robotic Process Diagrams PDF
This slide showcases the adoption rates of modern technologies among businesses. It incorporates technologies such as AI image, AR VR, big data, blockchain, chatbots, API, IoT, RPA, telematics, wearables, etc. Make sure to capture your audiences attention in your business displays with our gratis customizable Deployment Rates Of Modern Technologies Embracing Robotic Process Diagrams PDF. These are great for business strategies, office conferences, capital raising or task suggestions. If you desire to acquire more customers for your tech business and ensure they stay satisfied, create your own sales presentation with these plain slides. This slide showcases the adoption rates of modern technologies among businesses. It incorporates technologies such as AI image, AR VR, big data, blockchain, chatbots, API, IoT, RPA, telematics, wearables, etc.

First 100 Days Roadmap For Improving HR Management Brochure PDF
This slide presents 100 day plan for effective human resources management helpful for organizations to align workplace policies with necessary proactive measures. It includes tasks spread over 4 phases of 25 days each like going global, bringing more technology, using big data and improving healthcare. Presenting First 100 Days Roadmap For Improving HR Management Brochure PDF to dispense important information. This template comprises four stages. It also presents valuable insights into the topics including Big Data, Technology, Improved Work Culture. This is a completely customizable PowerPoint theme that can be put to use immediately. So, download it and address the topic impactfully.
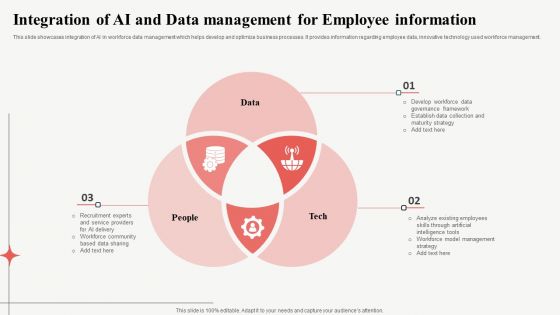
Integration Of Ai And Data Management For Employee Information Microsoft PDF
This slide showcases integration of AI in workforce data management which helps develop and optimize business processes. It provides information regarding employee data, innovative technology used workforce management. Persuade your audience using this Integration Of Ai And Data Management For Employee Information Microsoft PDF. This PPT design covers three stages, thus making it a great tool to use. It also caters to a variety of topics including Data, People, Tech. Download this PPT design now to present a convincing pitch that not only emphasizes the topic but also showcases your presentation skills.
Data Analysis Reports Under Magnifying Glass Ppt Powerpoint Presentation Summary Slideshow
This is a data analysis reports under magnifying glass ppt powerpoint presentation summary slideshow. This is a three stage process. The stages in this process are data visualization icon, data management icon.
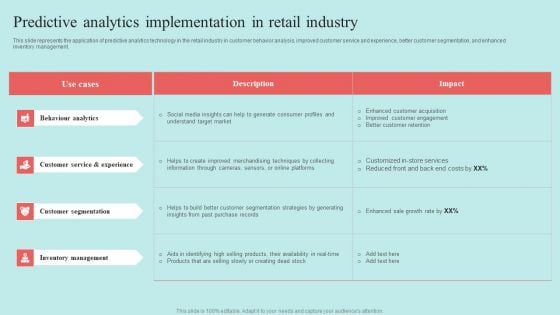
Predictive Data Model Predictive Analytics Implementation In Retail Industry Topics PDF
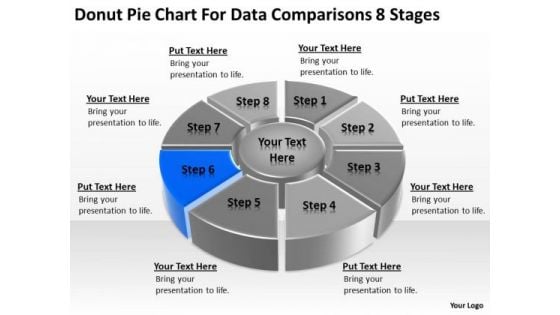
Donut Pie Chart For Data Comparisons 8 Stages Business Plan Examples PowerPoint Templates
We present our donut pie chart for data comparisons 8 stages business plan examples PowerPoint templates.Download and present our Success PowerPoint Templates because You can Stir your ideas in the cauldron of our PowerPoint Templates and Slides. Cast a magic spell on your audience. Download and present our Finance PowerPoint Templates because You should Kick up a storm with our PowerPoint Templates and Slides. The heads of your listeners will swirl with your ideas. Use our Arrows PowerPoint Templates because You should Ascend the ladder of success with ease. Our PowerPoint Templates and Slides will provide strong and sturdy steps. Download and present our Circle Charts PowerPoint Templates because Your ideas provide food for thought. Our PowerPoint Templates and Slides will help you create a dish to tickle the most discerning palate. Use our Business PowerPoint Templates because Our PowerPoint Templates and Slides are conceived by a dedicated team. Use them and give form to your wondrous ideas.Use these PowerPoint slides for presentations relating to Chart, wheel, pie, graph, vector, process, marketing, diagram, business, catalog, website, network, statistics, model, document, junction, plan, presentation, template, circle, brochure, data, stock, management, box, options, direction, design, company, navigation, financial, structure, button, goals, results. The prominent colors used in the PowerPoint template are Blue, Gray, Black. Bake the cake with our Donut Pie Chart For Data Comparisons 8 Stages Business Plan Examples PowerPoint Templates. Give them all a big slab of it.
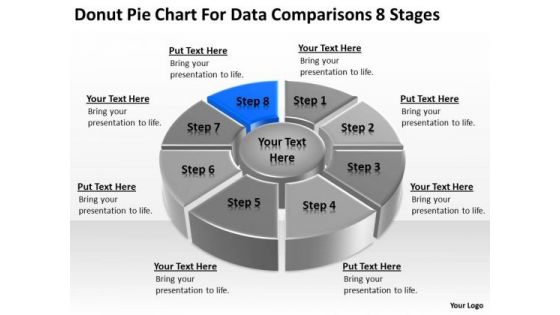
Chart For Data Comparisons 8 Stages Ppt Sample Business Plan Restaurant PowerPoint Templates
We present our chart for data comparisons 8 stages ppt sample business plan restaurant PowerPoint templates.Use our Competition PowerPoint Templates because Our PowerPoint Templates and Slides will let you Clearly mark the path for others to follow. Use our Marketing PowerPoint Templates because Our PowerPoint Templates and Slides have the Brilliant backdrops. Guaranteed to illuminate the minds of your audience. Download and present our Business PowerPoint Templates because Our PowerPoint Templates and Slides will help you be quick off the draw. Just enter your specific text and see your points hit home. Download our Circle Charts PowerPoint Templates because Our PowerPoint Templates and Slides will provide the perfect balance. Your weighty ideas will get the ideal impetus. Download and present our Shapes PowerPoint Templates because You can Give birth to your ideas with our PowerPoint Templates and Slides. See them grow big and strong in record time.Use these PowerPoint slides for presentations relating to Chart, wheel, pie, graph, vector, process, marketing, diagram, business, catalog, website, network, statistics, model, document, junction, plan, presentation, template, circle, brochure, data, stock, management, box, options, direction, design, company, navigation, financial, structure, button, goals, results. The prominent colors used in the PowerPoint template are Blue, Black, Gray. Our Chart For Data Comparisons 8 Stages Ppt Sample Business Plan Restaurant PowerPoint Templates put in an earnest attempt. They put in hard hours to assist you.
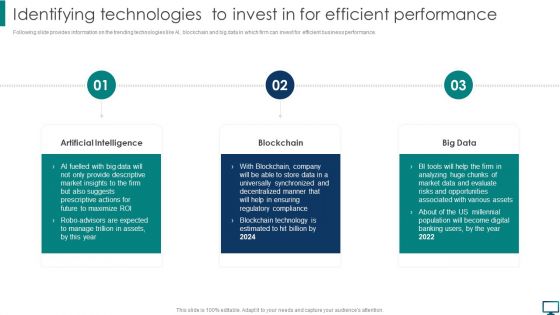
Identifying Technologies To Invest In For Efficient Performance Guidelines PDF
Following slide provides information on the trending technologies like AI, blockchain and big data in which firm can invest for efficient business performance. Create an editable Identifying Technologies To Invest In For Efficient Performance Guidelines PDF that communicates your idea and engages your audience. Whether you are presenting a business or an educational presentation, pre designed presentation templates help save time. Identifying Technologies To Invest In For Efficient Performance Guidelines PDF is highly customizable and very easy to edit, covering many different styles from creative to business presentations. Slidegeeks has creative team members who have crafted amazing templates. So, go and get them without any delay.
Business Analysis Data Monitoring Vector Icon Ppt Powerpoint Presentation Ideas Design Ideas
This is a business analysis data monitoring vector icon ppt powerpoint presentation ideas design ideas. This is a one stage process. The stages in this process are feedback loop icon, evaluation icon, assessment icon.
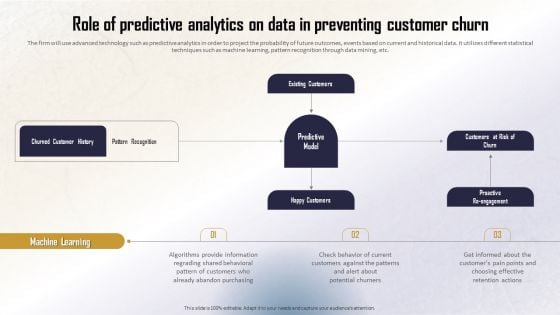
Identifying Direct And Indirect Role Of Predictive Analytics On Data In Preventing Summary PDF
The firm will use advanced technology such as predictive analytics in order to project the probability of future outcomes, events based on current and historical data. It utilizes different statistical techniques such as machine learning, pattern recognition through data mining, etc. Are you searching for a Identifying Direct And Indirect Role Of Predictive Analytics On Data In Preventing Summary PDF that is uncluttered, straightforward, and original Its easy to edit, and you can change the colors to suit your personal or business branding. For a presentation that expresses how much effort youve put in, this template is ideal With all of its features, including tables, diagrams, statistics, and lists, its perfect for a business plan presentation. Make your ideas more appealing with these professional slides. Download Identifying Direct And Indirect Role Of Predictive Analytics On Data In Preventing Summary PDF from Slidegeeks today.
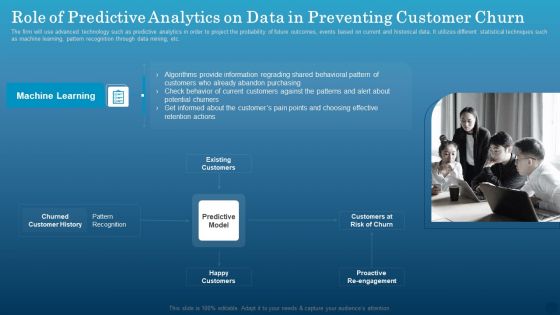
Role Of Predictive Analytics On Data In Preventing Customer Churn Formats PDF
The firm will use advanced technology such as predictive analytics in order to project the probability of future outcomes, events based on current and historical data. It utilizes different statistical techniques such as machine learning, pattern recognition through data mining, etc. Get a simple yet stunning designed Role Of Predictive Analytics On Data In Preventing Customer Churn Formats PDF. It is the best one to establish the tone in your meetings. It is an excellent way to make your presentations highly effective. So, download this PPT today from Slidegeeks and see the positive impacts. Our easy to edit Role Of Predictive Analytics On Data In Preventing Customer Churn Formats PDF can be your go-to option for all upcoming conferences and meetings. So, what are you waiting for Grab this template today.
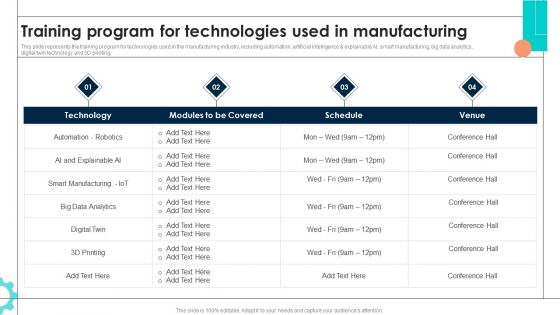
Intelligent Manufacturing Training Program For Technologies Used In Manufacturing Guidelines PDF
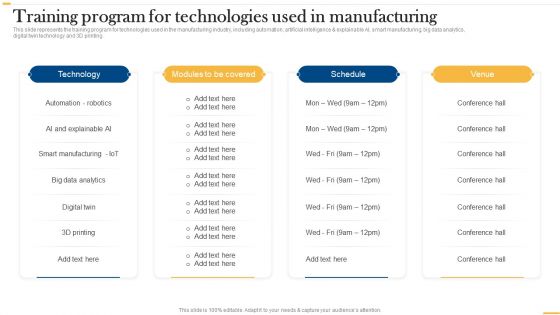
This slide represents the training program for technologies used in the manufacturing industry, including automation, artificial intelligence and explainable AI, smart manufacturing, big data analytics, digital twin technology and 3D printing. Want to ace your presentation in front of a live audience Our Intelligent Manufacturing Training Program For Technologies Used In Manufacturing Guidelines PDF can help you do that by engaging all the users towards you. Slidegeeks experts have put their efforts and expertise into creating these impeccable powerpoint presentations so that you can communicate your ideas clearly. Moreover, all the templates are customizable, and easy to edit and downloadable. Use these for both personal and commercial use.
Deploying AI To Enhance Training Program For Technologies Used In Manufacturing Demonstration PDF
This slide represents the training program for technologies used in the manufacturing industry, including automation, artificial intelligence and explainable AI, smart manufacturing, big data analytics, digital twin technology and 3D printing. Find a pre-designed and impeccable Deploying AI To Enhance Training Program For Technologies Used In Manufacturing Demonstration PDF. The templates can ace your presentation without additional effort. You can download these easy-to-edit presentation templates to make your presentation stand out from others. So, what are you waiting for Download the template from Slidegeeks today and give a unique touch to your presentation.
Data Analysis Bar Chart With Magnifying Glass Icon Ppt PowerPoint Presentation Icon Layouts PDF
Presenting this set of slides with name data analysis bar chart with magnifying glass icon ppt powerpoint presentation icon layouts pdf. This is a three stage process. The stages in this process are data analysis bar chart with magnifying glass icon. This is a completely editable PowerPoint presentation and is available for immediate download. Download now and impress your audience.
Data Analysis With Bar Chart In Magnifying Glass Vector Icon Ppt PowerPoint Presentation File Model PDF
Presenting this set of slides with name data analysis with bar chart in magnifying glass vector icon ppt powerpoint presentation file model pdf. This is a one stage process. The stages in this process is data analysis with bar chart in magnifying glass vector icon. This is a completely editable PowerPoint presentation and is available for immediate download. Download now and impress your audience.
Data Management Vector Icon Ppt PowerPoint Presentation File Visual Aids PDF
Presenting this set of slides with name data management vector icon ppt powerpoint presentation file visual aids pdf. This is a three stage process. The stages in this process are data management vector icon. This is a completely editable PowerPoint presentation and is available for immediate download. Download now and impress your audience.
Audit Officer Icon For Performing Data Quality Investigation Ppt PowerPoint Presentation File Templates PDF
Presenting this set of slides with name audit officer icon for performing data quality investigation ppt powerpoint presentation file templates pdf. This is a three stage process. The stages in this process are audit officer icon for performing data quality investigation. This is a completely editable PowerPoint presentation and is available for immediate download. Download now and impress your audience.
7 Sections Pie Chart For Data Comparison Ppt PowerPoint Presentation File Graphics Template
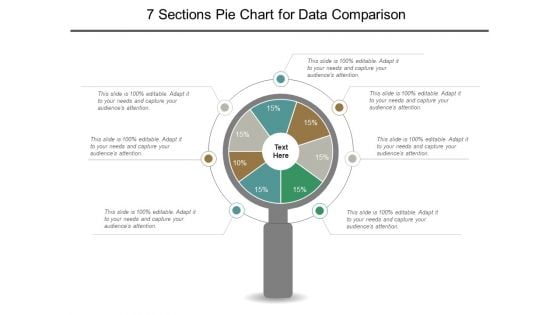
This is a 7 sections pie chart for data comparison ppt powerpoint presentation file graphics template. This is a seven stage process. The stages in this process are 6 piece pie chart, 6 segment pie chart, 6 parts pie chart.
8 Sections Pie Chart For Data Comparison Ppt PowerPoint Presentation Show Slideshow
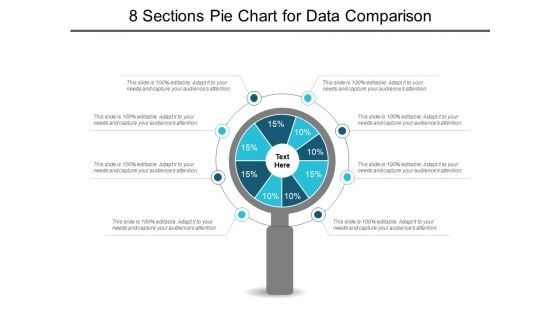
This is a 8 sections pie chart for data comparison ppt powerpoint presentation show slideshow. This is a eight stage process. The stages in this process are 6 piece pie chart, 6 segment pie chart, 6 parts pie chart.
Six Sections Pie Chart For Data Comparison Ppt PowerPoint Presentation Styles Graphics Example
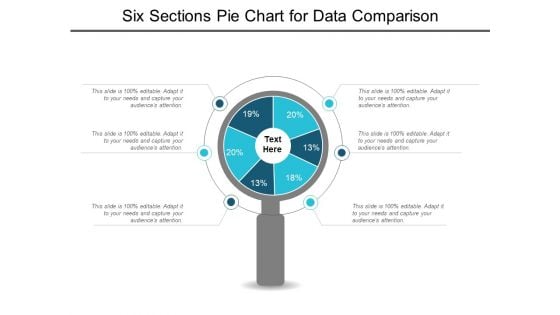
This is a six sections pie chart for data comparison ppt powerpoint presentation styles graphics example. This is a six stage process. The stages in this process are 6 piece pie chart, 6 segment pie chart, 6 parts pie chart.

Financial Data Analysis For Risk Management Ppt PowerPoint Presentation Slides Picture
Presenting this set of slides with name financial data analysis for risk management ppt powerpoint presentation slides picture. This is a one stage process. The stages in this process are risk framework, risk management, planning process. This is a completely editable PowerPoint presentation and is available for immediate download. Download now and impress your audience.
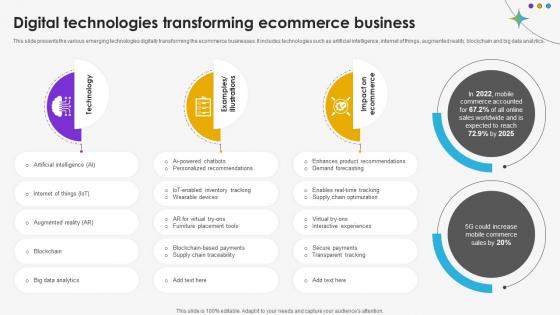
Digital Technologies Transforming Ecommerce Business DT SS V
This slide presents the various emerging technologies digitally transforming the ecommerce businesses. It includes technologies such as artificial intelligence, internet of things, augmented reality, blockchain and big data analytics.Presenting this PowerPoint presentation, titled Digital Technologies Transforming Ecommerce Business DT SS V, with topics curated by our researchers after extensive research. This editable presentation is available for immediate download and provides attractive features when used. Download now and captivate your audience. Presenting this Digital Technologies Transforming Ecommerce Business DT SS V. Our researchers have carefully researched and created these slides with all aspects taken into consideration. This is a completely customizable Digital Technologies Transforming Ecommerce Business DT SS V that is available for immediate downloading. Download now and make an impact on your audience. Highlight the attractive features available with our PPTs. This slide presents the various emerging technologies digitally transforming the ecommerce businesses. It includes technologies such as artificial intelligence, internet of things, augmented reality, blockchain and big data analytics.

Various Stages Data Extraction Process Flow Chart Ppt PowerPoint Presentation Pictures Show PDF
Persuade your audience using this various stages data extraction process flow chart ppt powerpoint presentation pictures show pdf. This PPT design covers five stages, thus making it a great tool to use. It also caters to a variety of topics including interpretation evaluation, data mining, transformation, preprocessing, selection, target data, preprocessed data, transformed data, patterns, knowledge. Download this PPT design now to present a convincing pitch that not only emphasizes the topic but also showcases your presentation skills.
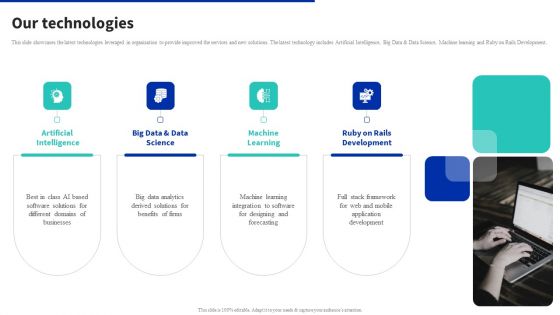
Digital Products Company Outline Our Technologies Rules PDF
This slide showcases the latest technologies leveraged in organisation to provide improved the services and new solutions. The latest technology includes Artificial Intelligence, Big Data and Data Science, Machine learning and Ruby on Rails Development. Slidegeeks is here to make your presentations a breeze with Digital Products Company Outline Our Technologies Rules PDF With our easy to use and customizable templates, you can focus on delivering your ideas rather than worrying about formatting. With a variety of designs to choose from, you are sure to find one that suits your needs. And with animations and unique photos, illustrations, and fonts, you can make your presentation pop. So whether you are giving a sales pitch or presenting to the board, make sure to check out Slidegeeks first.
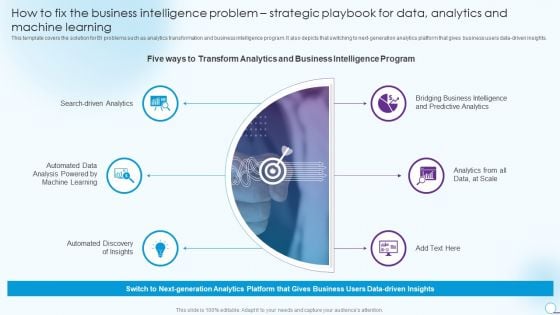
How To Fix The Business Intelligence Problem Strategic Playbook For Data Analytics And Machine Learning Designs PDF
This template covers the solution for BI problems such as analytics transformation and business intelligence program. It also depicts that switching to next generation analytics platform that gives business users data driven insights. This is a How To Fix The Business Intelligence Problem Strategic Playbook For Data Analytics And Machine Learning Designs PDF template with various stages. Focus and dispense information on six stages using this creative set, that comes with editable features. It contains large content boxes to add your information on topics like Automated Data Analysis, Search Driven Analytics, Predictive Analytics. You can also showcase facts, figures, and other relevant content using this PPT layout. Grab it now.
Data Search With Various Charts To Recognize Market Trends Icon Ppt PowerPoint Presentation Infographic Template Clipart PDF
Persuade your audience using this data search with various charts to recognize market trends icon ppt powerpoint presentation infographic template clipart pdf. This PPT design covers three stages, thus making it a great tool to use. It also caters to a variety of topics including data search with various charts to recognize market trends icon. Download this PPT design now to present a convincing pitch that not only emphasizes the topic but also showcases your presentation skills.
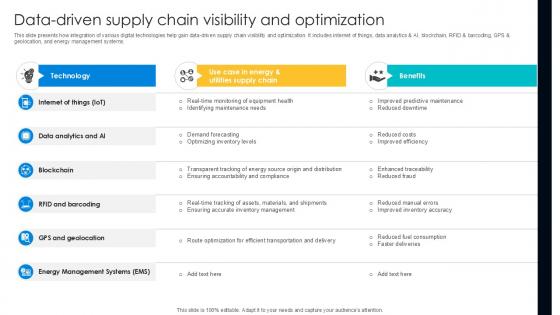
Data Driven Supply Chain Visibility Digital Transformation Journey PPT Presentation DT SS V
This slide presents how integration of various digital technologies help gain data-driven supply chain visibility and optimization. It includes internet of things, data analytics and AI, blockchain, RFID and barcoding, GPS and geolocation, and energy management systems. Coming up with a presentation necessitates that the majority of the effort goes into the content and the message you intend to convey. The visuals of a PowerPoint presentation can only be effective if it supplements and supports the story that is being told. Keeping this in mind our experts created Data Driven Supply Chain Visibility Digital Transformation Journey PPT Presentation DT SS V to reduce the time that goes into designing the presentation. This way, you can concentrate on the message while our designers take care of providing you with the right template for the situation. This slide presents how integration of various digital technologies help gain data-driven supply chain visibility and optimization. It includes internet of things, data analytics and AI, blockchain, RFID and barcoding, GPS and geolocation, and energy management systems.
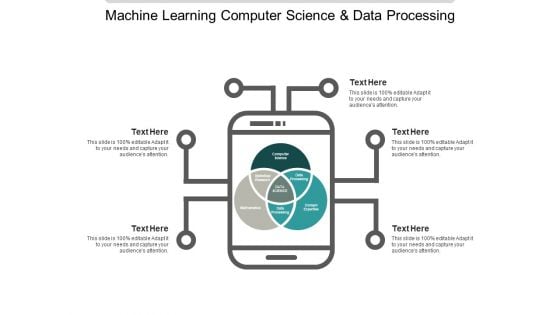
Machine Learning Computer Science And Data Processing Ppt PowerPoint Presentation Show Slideshow
This is a machine learning computer science and data processing ppt powerpoint presentation show slideshow. This is a three stage process. The stages in this process are data, analysis, data science, information science.
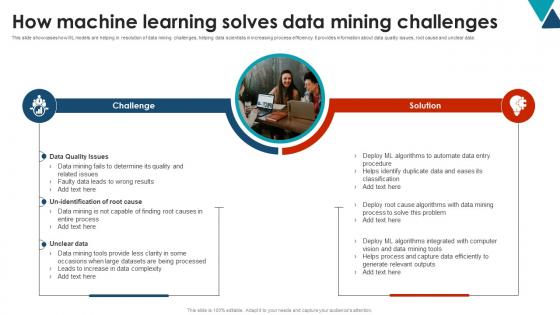
How Machine Learning Solves Using Data Mining Tools To Optimize Processes AI SS V
This slide showcases how ML models are helping in resolution of data mining challenges, helping data scientists in increasing process efficiency. It provides information about data quality issues, root cause and unclear data. Do you know about Slidesgeeks How Machine Learning Solves Using Data Mining Tools To Optimize Processes AI SS V These are perfect for delivering any kind od presentation. Using it, create PowerPoint presentations that communicate your ideas and engage audiences. Save time and effort by using our pre-designed presentation templates that are perfect for a wide range of topic. Our vast selection of designs covers a range of styles, from creative to business, and are all highly customizable and easy to edit. Download as a PowerPoint template or use them as Google Slides themes. This slide showcases how ML models are helping in resolution of data mining challenges, helping data scientists in increasing process efficiency. It provides information about data quality issues, root cause and unclear data.
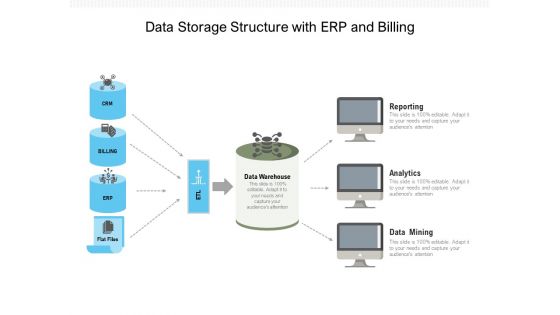
Data Storage Structure With ERP And Billing Ppt PowerPoint Presentation Gallery Outline PDF
Presenting data storage structure with erp and billing ppt powerpoint presentation gallery outline pdf to dispense important information. This template comprises four stages. It also presents valuable insights into the topics including reporting, analytics, data mining. This is a completely customizable PowerPoint theme that can be put to use immediately. So, download it and address the topic impactfully.
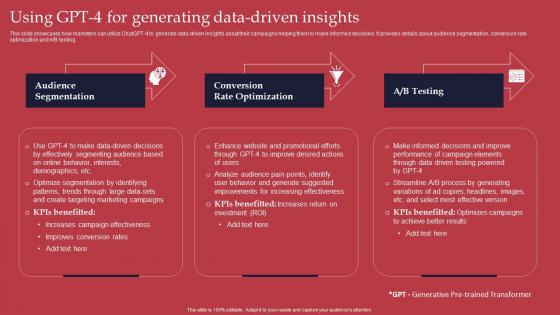
Using GPT 4 For Generating Data GPT 4 Revolutionary Generative AI Innovation Formats Pdf
This slide showcases how marketers can utilize ChatGPT 4 to generate data driven insights about their campaigns helping them to make informed decisions. It provides details about audience segmentation, conversion rate optimization and A B testing. Slidegeeks has constructed Using GPT 4 For Generating Data GPT 4 Revolutionary Generative AI Innovation Formats Pdf after conducting extensive research and examination. These presentation templates are constantly being generated and modified based on user preferences and critiques from editors. Here, you will find the most attractive templates for a range of purposes while taking into account ratings and remarks from users regarding the content. This is an excellent jumping off point to explore our content and will give new users an insight into our top notch PowerPoint Templates. This slide showcases how marketers can utilize ChatGPT 4 to generate data driven insights about their campaigns helping them to make informed decisions. It provides details about audience segmentation, conversion rate optimization and A B testing.
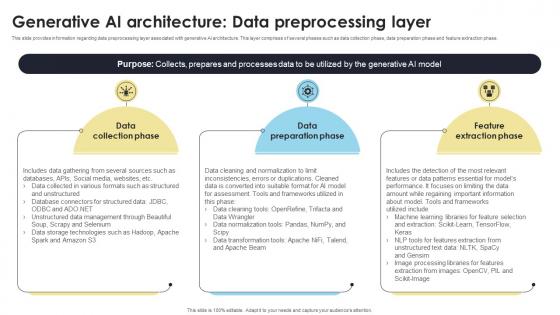
Generative AI Architecture Data Preprocessing Layer How Generative AI Tools Work AI SS V
This slide provides information regarding data preprocessing layer associated with generative AI architecture. This layer comprises of several phases such as data collection phase, data preparation phase and feature extraction phase. This Generative AI Architecture Data Preprocessing Layer How Generative AI Tools Work AI SS V is perfect for any presentation, be it in front of clients or colleagues. It is a versatile and stylish solution for organizing your meetings. The Generative AI Architecture Data Preprocessing Layer How Generative AI Tools Work AI SS V features a modern design for your presentation meetings. The adjustable and customizable slides provide unlimited possibilities for acing up your presentation. Slidegeeks has done all the homework before launching the product for you. So, do not wait, grab the presentation templates today This slide provides information regarding data preprocessing layer associated with generative AI architecture. This layer comprises of several phases such as data collection phase, data preparation phase and feature extraction phase.
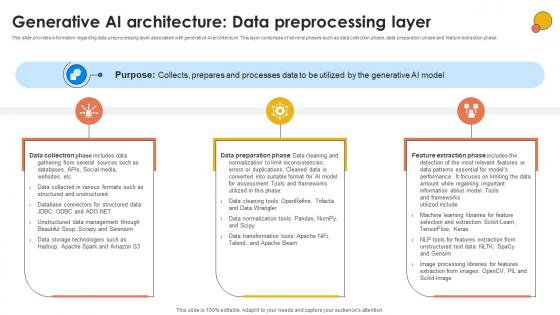
Generative AI Architecture Data Generative AI For Better Productivity AI SS V
This slide provides information regarding data preprocessing layer associated with generative AI architecture. This layer comprises of several phases such as data collection phase, data preparation phase and feature extraction phase. Crafting an eye-catching presentation has never been more straightforward. Let your presentation shine with this tasteful yet straightforward Generative AI Architecture Data Generative AI For Better Productivity AI SS V template. It offers a minimalistic and classy look that is great for making a statement. The colors have been employed intelligently to add a bit of playfulness while still remaining professional. Construct the ideal Generative AI Architecture Data Generative AI For Better Productivity AI SS V that effortlessly grabs the attention of your audience Begin now and be certain to wow your customers This slide provides information regarding data preprocessing layer associated with generative AI architecture. This layer comprises of several phases such as data collection phase, data preparation phase and feature extraction phase.


 Continue with Email

 Home
Home


