Block Diagram
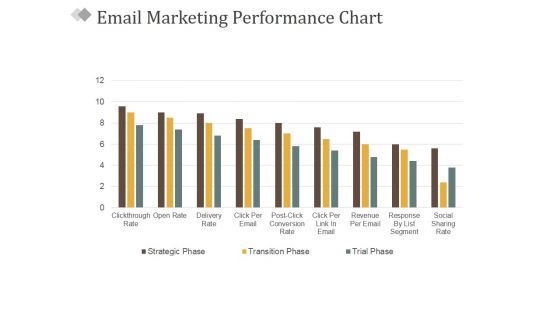
Email Marketing Performance Chart Ppt PowerPoint Presentation Gallery Elements
This is a email marketing performance chart ppt powerpoint presentation gallery elements. This is a nine stage process. The stages in this process are business, marketing, success, management, bar graph.
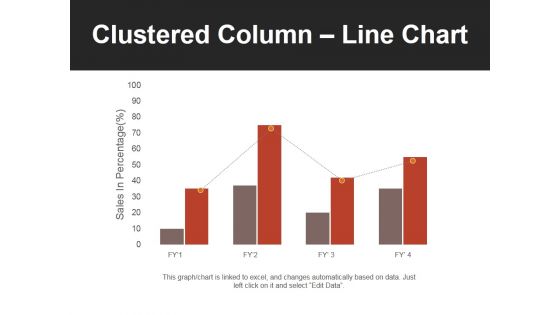
Clustered Column Line Chart Ppt PowerPoint Presentation Professional Slides
This is a clustered column line chart ppt powerpoint presentation professional slides. This is a four stage process. The stages in this process are bar, finance, business, marketing, growth.
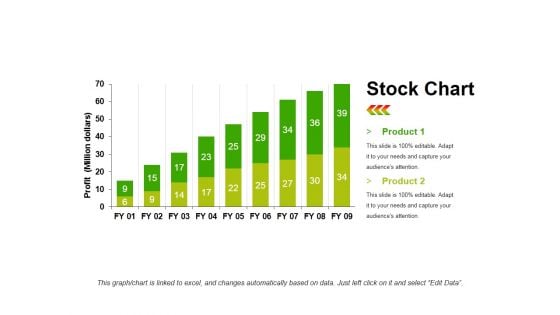
Stock Chart Template 1 Ppt PowerPoint Presentation Infographic Template Objects
This is a stock chart template 1 ppt powerpoint presentation infographic template objects. This is a two stage process. The stages in this process are product, profit, bar graph, growth, success.
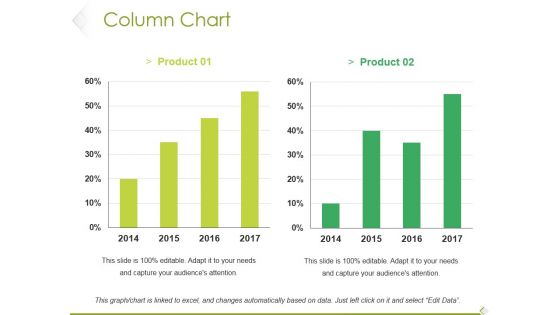
Column Chart Ppt PowerPoint Presentation Model Clipart Images
This is a column chart ppt powerpoint presentation model clipart images. This is a two stage process. The stages in this process are product, bar graph, growth, success, business.
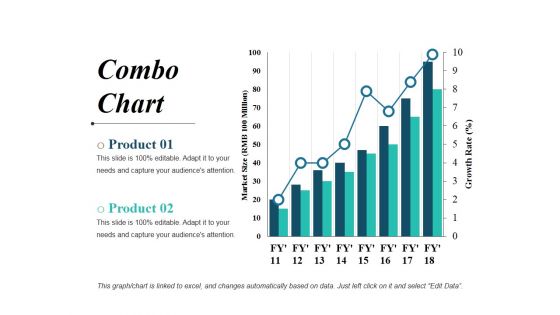
Combo Chart Ppt PowerPoint Presentation File Visual Aids
This is a combo chart ppt powerpoint presentation file visual aids. This is a two stage process. The stages in this process are bar graph, business, marketing, finance, planning.
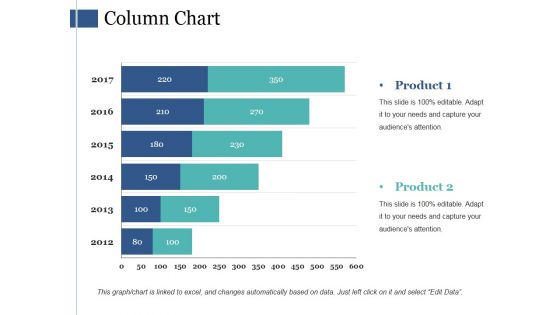
Column Chart Ppt PowerPoint Presentation Model Background Images
This is a column chart ppt powerpoint presentation model background images. This is a six stage process. The stages in this process are bar graph, marketing, finance, strategy, planning.
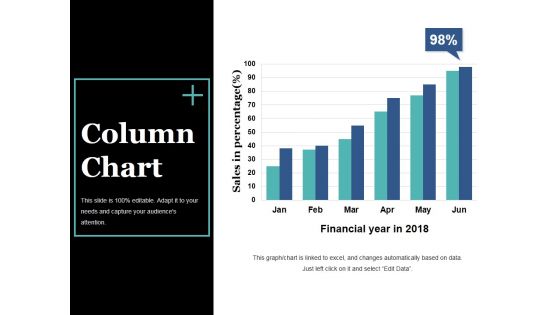
Column Chart Ppt PowerPoint Presentation Slides Visual Aids
This is a column chart ppt powerpoint presentation slides visual aids. This is a six stage process. The stages in this process are bar graph, growth, success, sales in percentage, financial year.
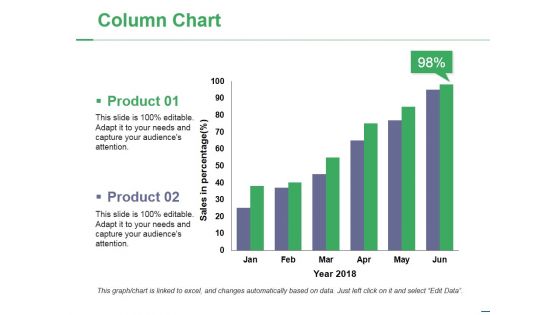
Column Chart Ppt PowerPoint Presentation Portfolio Slide Download
This is a column chart ppt powerpoint presentation portfolio slide download. This is a two stage process. The stages in this process are product, year, bar graph, success, business.
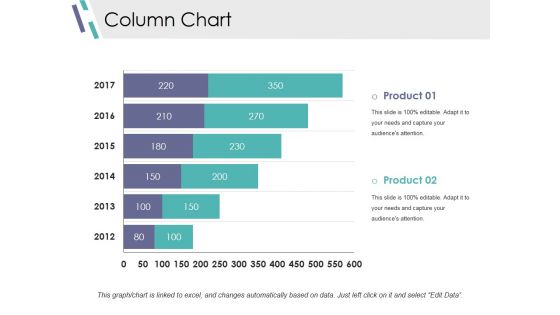
Column Chart Ppt PowerPoint Presentation Infographics Design Inspiration
This is a column chart ppt powerpoint presentation infographics design inspiration. This is a two stage process. The stages in this process are slide bar, marketing, strategy, finance, planning.
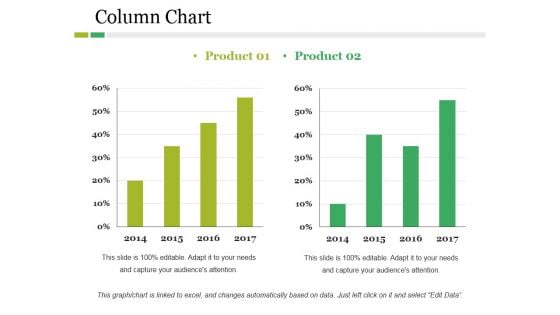
Column Chart Ppt PowerPoint Presentation Layouts Graphics Example
This is a column chart ppt powerpoint presentation layouts graphics example. This is a two stage process. The stages in this process are product, year, bar graph, business, finance.
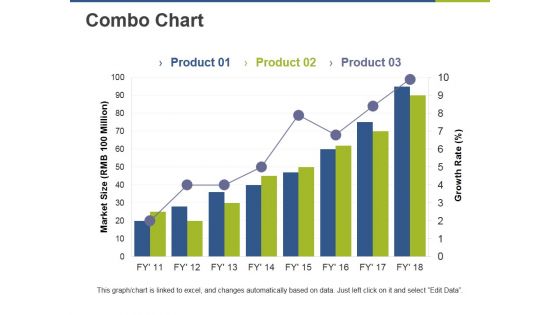
Combo Chart Ppt PowerPoint Presentation Pictures Graphic Images
This is a combo chart ppt powerpoint presentation pictures graphic images. This is a three stage process. The stages in this process are bar graph, growth, market size, growth rate, success.
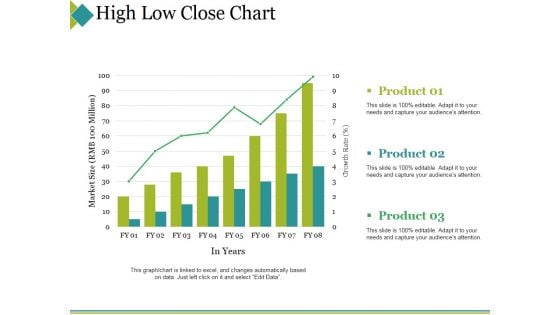
High Low Close Chart Ppt PowerPoint Presentation Portfolio Topics
This is a high low close chart ppt powerpoint presentation portfolio topics. This is a three stage process. The stages in this process are product, market size, in years, success, bar graph.

Column Chart Ppt PowerPoint Presentation Pictures Graphic Images
This is a column chart ppt powerpoint presentation pictures graphic images. This is a two stage process. The stages in this process are product, years, growth, success, bar graph.
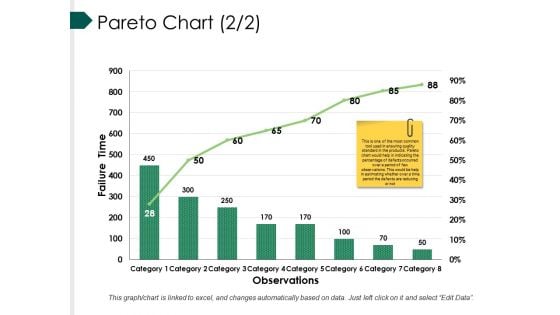
Pareto Chart Template Ppt PowerPoint Presentation Summary Graphic Images
This is a pareto chart template ppt powerpoint presentation summary graphic images. This is a eight stage process. The stages in this process are bar, marketing, strategy, finance, teamwork.
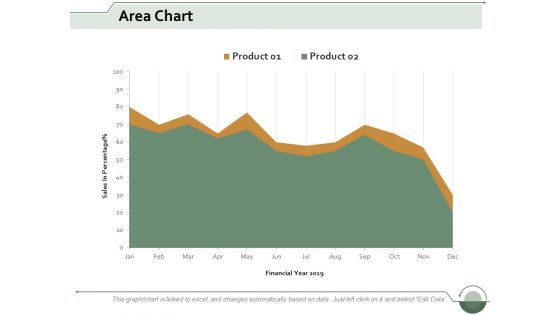
Area Chart Finance Ppt Powerpoint Presentation Infographic Template Clipart Images
This is a area chart finance ppt powerpoint presentation infographic template clipart images. This is a two stage process. The stages in this process are area bar, finance, marketing, management, analysis.
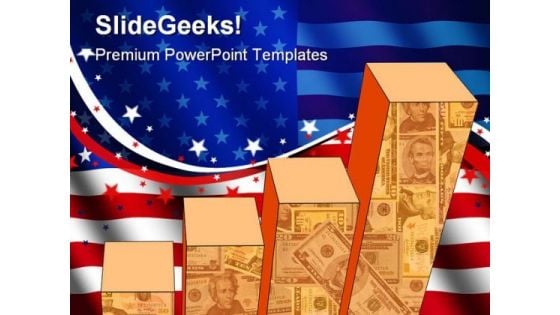
Graph With America Flag Americana PowerPoint Themes And PowerPoint Slides 0711
Microsoft PowerPoint Theme and Slide with bar chart and rippled american flag with currency Your ideas deserve the best accessories. Our Graph With America Flag Americana PowerPoint Themes And PowerPoint Slides 0711 are a shining example.
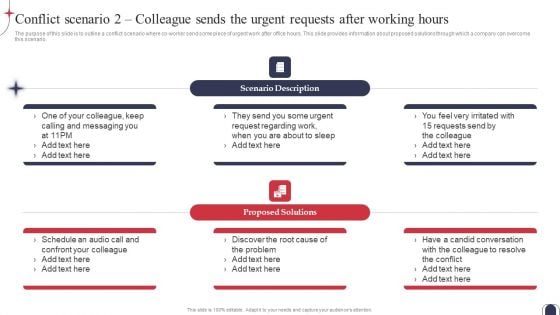
Workplace Conflict Resolution Conflict Scenario 2 Colleague Sends The Urgent Portrait PDF
The purpose of this slide is to outline a conflict scenario where co-worker send some piece of urgent work after office hours. This slide provides information about proposed solutions through which a company can overcome this scenario. If your project calls for a presentation, then Slidegeeks is your go-to partner because we have professionally designed, easy-to-edit templates that are perfect for any presentation. After downloading, you can easily edit Workplace Conflict Resolution Conflict Scenario 2 Colleague Sends The Urgent Portrait PDF and make the changes accordingly. You can rearrange slides or fill them with different images. Check out all the handy templates.
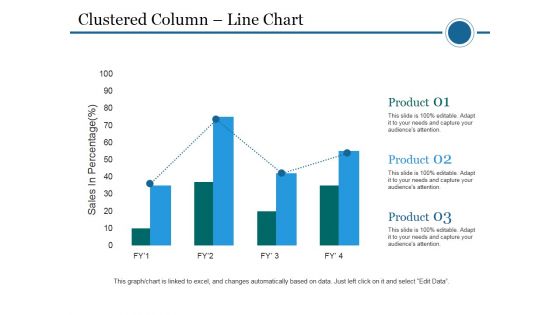
Clustered Column Line Chart Ppt PowerPoint Presentation File Pictures
This is a clustered column line chart ppt powerpoint presentation file pictures. This is a four stage process. The stages in this process are clustered bar, product, planning, business, sales in percentage.

Human Gearhead Industrial PowerPoint Themes And PowerPoint Slides 0511
Microsoft PowerPoint Theme and Slide with human gearhead Set an example with your views. Place the bar with our Human Gearhead Industrial PowerPoint Themes And PowerPoint Slides 0511.

Growing Plants On Stack Of Coins For Money Growth Ppt Powerpoint Presentation Outline Display
This is a growing plants on stack of coins for money growth ppt powerpoint presentation outline display. This is a four stage process. The stages in this process are stacked bar, pile bar, heap bar.

Man Standing With Stack Of Us Currency Notes Bundles Ppt Powerpoint Presentation File Slides
This is a man standing with stack of us currency notes bundles ppt powerpoint presentation file slides. This is a three stage process. The stages in this process are stacked bar, pile bar, heap bar.
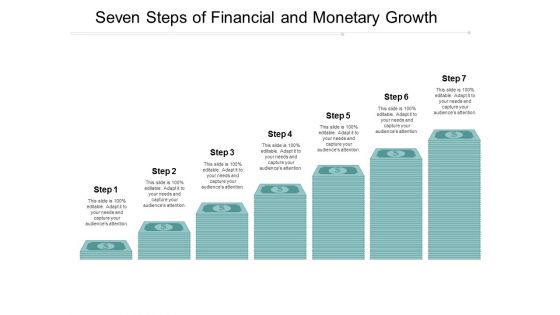
Seven Steps Of Financial And Monetary Growth Ppt Powerpoint Presentation Inspiration Backgrounds
This is a seven steps of financial and monetary growth ppt powerpoint presentation inspiration backgrounds. This is a seven stage process. The stages in this process are stacked bar, pile bar, heap bar.

Stack Of Dollar Currency Banknotes For Financial Success Ppt Powerpoint Presentation Slides Background
This is a stack of dollar currency banknotes for financial success ppt powerpoint presentation slides background. This is a five stage process. The stages in this process are stacked bar, pile bar, heap bar.
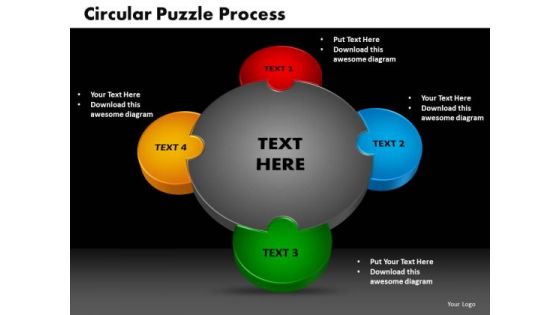
PowerPoint Themes Circular Puzzle Business Ppt Designs
PowerPoint Themes Circular Puzzle Business PPT Designs-It is all there in bits and pieces. Individual components well researched and understood in their place.Now youneed to get it all together to form the complete picture and reach the goal. You have the ideas and plans on how to go about it.Use this template to illustrate your method, piece by piece, and interlock the whole process in the minds of your audience-PowerPoint Themes Circular Puzzle Business PPT Designs-This ppt can be used for presentations relating to-3d, Business, Circle, Circular, Clockwork, Cogs, Cogwheel, Colorful, Colors, Community, Component, Concept, Cooperate, Cooperation, Cycle, Cyclical, Different, Diverse, Diversity, Gear, Geometric, Hi-Tech, Idea, Industrial, Industry, Machine, Machinery, Mechanical, Mechanics, Round, Process, Progress Our PowerPoint Themes Circular Puzzle Business Ppt Designs will help you save time. Just enter your specific text and see your points hit home.
Balance02 PowerPoint Icon F
Balance a necessary thing in life nowadays Raise the bar with our Balance02 PowerPoint Icon F. You will come out on top.
Decrease PowerPoint Icon C
Decrease burning graph bar on white background Complete your projects on time with our Decrease PowerPoint Icon C. Dont pass up this opportunity to shine.
Decrease PowerPoint Icon S
Decrease burning graph bar on white background Exercise your mind with our Decrease PowerPoint Icon S. Pump the cells and generate ideas.
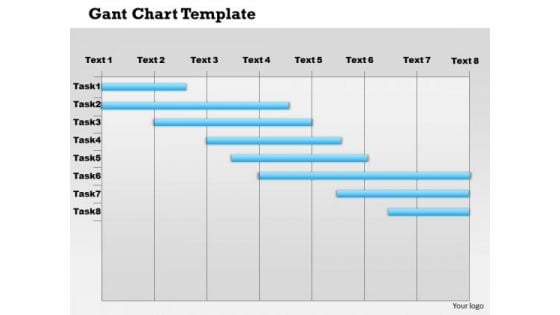
Business Framework Gantt Chart PowerPoint Presentation
A Gantt chart is a type of bar chart, that illustrates a project schedule. Gantt charts illustrate the start and finish dates of the terminal elements and summary elements of a project. Terminal elements and summary elements comprise the work breakdown structure of the project. Use this image slide to depict project management in your presentations.

Growth Chart Business PowerPoint Templates And PowerPoint Backgrounds 0411
Microsoft PowerPoint Template and Background with growth chart green bars and red arrow pointing upwards Exhibit your plan with our Growth Chart Business PowerPoint Templates And PowerPoint Backgrounds 0411. Display the clarity of your ideas.
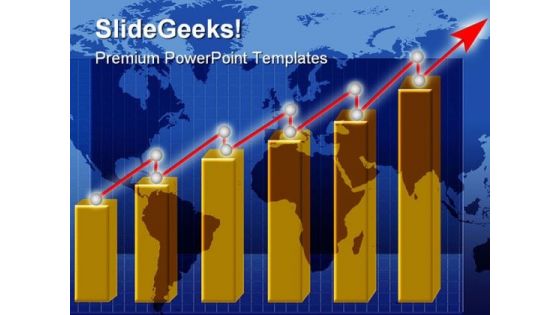
Growth Chart Business PowerPoint Templates And PowerPoint Backgrounds 0611
Microsoft PowerPoint Template and Background with composed by bar chart and a world map Enact plans with our Growth Chart Business PowerPoint Templates And PowerPoint Backgrounds 0611. Download without worries with our money back guaranteee.

Raising Charts Business PowerPoint Templates And PowerPoint Backgrounds 0611
Microsoft PowerPoint Template and Background with growing bar chart from golden coins with red arrow Our Raising Charts Business PowerPoint Templates And PowerPoint Backgrounds 0611 will fill the bill. They allow you to cover for it all.
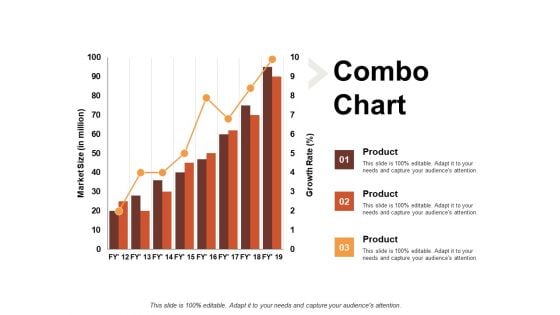
Combo Chart Finance Ppt PowerPoint Presentation Outline Example
This is a combo chart finance ppt powerpoint presentation outline example. This is a three stage process. The stages in this process are bar chart, finance, marketing, business, analysis.
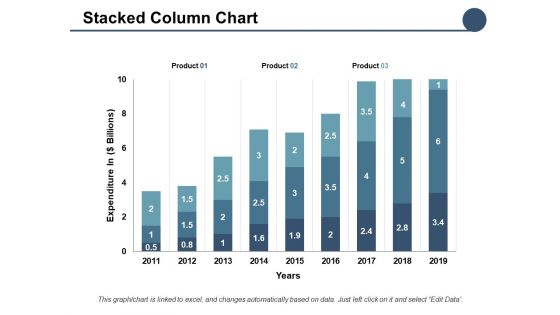
Stacked Column Chart Ppt PowerPoint Presentation Professional Aids
This is a stacked column chart ppt powerpoint presentation professional aids. This is a three stage process. The stages in this process are bar chart, finance, marketing, business, analysis.
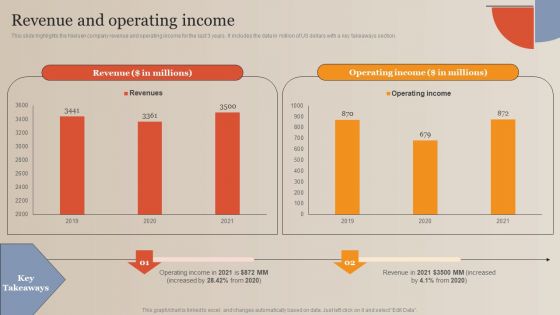
Market Study Company Outline Revenue And Operating Income Themes PDF
This slide highlights the Nielsen company revenue and operating income for the last 3 years. It includes the data in million of US dollars with a key takeaways section. Slidegeeks is here to make your presentations a breeze with Market Study Company Outline Revenue And Operating Income Themes PDF With our easy to use and customizable templates, you can focus on delivering your ideas rather than worrying about formatting. With a variety of designs to choose from, you are sure to find one that suits your needs. And with animations and unique photos, illustrations, and fonts, you can make your presentation pop. So whether you are giving a sales pitch or presenting to the board, make sure to check out Slidegeeks first.
Declining Sales PowerPoint Icons with Down Arrow
3d decay graph bar Brighten up the day with our Down Arrow Icon Cc. Dispal any darkness around.
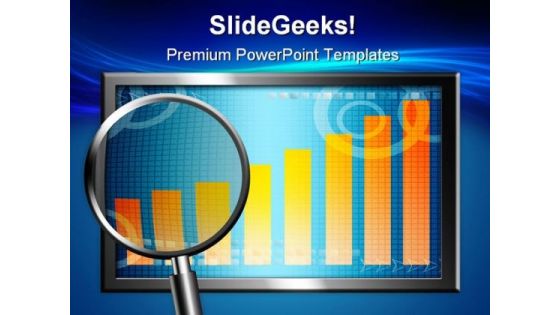
Chart Business PowerPoint Templates And PowerPoint Backgrounds 0511
Microsoft PowerPoint Template and Background with orange bar on screen business conceptual illustration Enhance your charisma with our Chart Business PowerPoint Templates And PowerPoint Backgrounds 0511. Allow your aura to flow around.
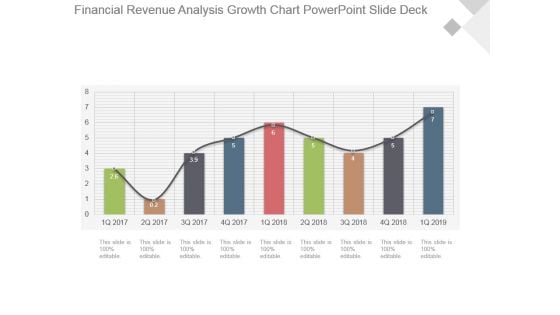
Financial Revenue Analysis Growth Chart Powerpoint Slide Deck
This is a financial revenue analysis growth chart powerpoint slide deck. This is a nine stage process. The stages in this process are growth, success, business, marketing, bar graph.
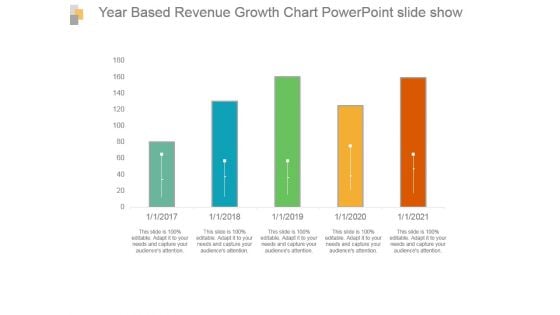
Year Based Revenue Growth Chart Powerpoint Slide Show
This is a year based revenue growth chart powerpoint slide show. This is a five stage process. The stages in this process are bar graph, growth, revenue, year, success.

Column Chart Ppt PowerPoint Presentation Styles Graphic Tips
This is a column chart ppt powerpoint presentation styles graphic tips. This is a six stage process. The stages in this process are slide bar, business, marketing, strategy, finance.
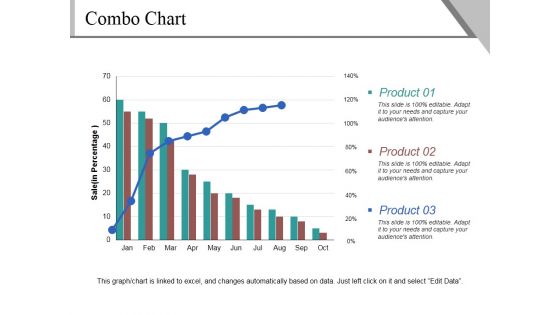
Combo Chart Ppt PowerPoint Presentation Ideas Visual Aids
This is a combo chart ppt powerpoint presentation ideas visual aids. This is a three stage process. The stages in this process are product, sales, bar graph, business, marketing.
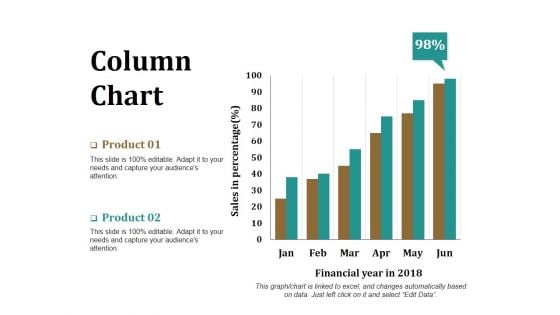
Column Chart Ppt PowerPoint Presentation Model Graphics Download
This is a column chart ppt powerpoint presentation model graphics download. This is a two stage process. The stages in this process are product, financial year, sales in percentage, bar graph, success.
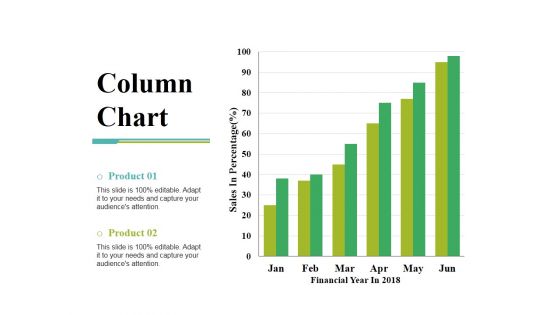
Column Chart Ppt PowerPoint Presentation Gallery Slide Portrait
This is a column chart ppt powerpoint presentation gallery slide portrait. This is a two stage process. The stages in this process are sales in percentage, financial year, product, bar graph, growth.
Organization Chart And Corporate Model Transformation Controls And Reporting After Icons PDF
Here we are covering effective controls a hierarchy of measures, so that the ones at operational level tie in with those that monitor policy and financial performance. This is a organization chart and corporate model transformation controls and reporting after icons pdf template with various stages. Focus and dispense information on four stages using this creative set, that comes with editable features. It contains large content boxes to add your information on topics like directors and senior executives, senior managers, sectional and departmental heads, first line team leaders and supervisors, operational clerical staff. You can also showcase facts, figures, and other relevant content using this PPT layout. Grab it now.
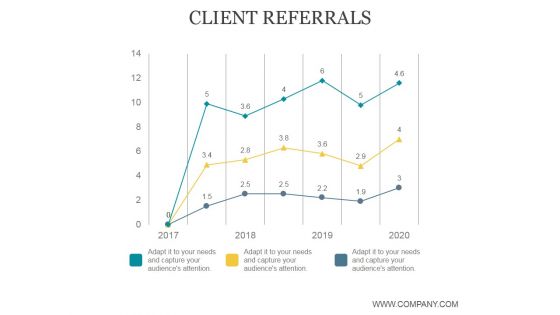
Client Referrals Ppt PowerPoint Presentation Tips
This is a client referrals ppt powerpoint presentation tips. This is a three stage process. The stages in this process are business, marketing, management, bar graph, line bar.
6 Segments Pie Chart For Data Representation Ppt PowerPoint Presentation Icon Graphics
This is a 6 segments pie chart for data representation ppt powerpoint presentation icon graphics. This is a six stage process. The stages in this process are 6 piece pie chart, 6 segment pie chart, 6 parts pie chart.
Adjusting The Data PowerPoint Icon C
3d illustration of a simple wrench turning/adjusting the elements on a multi-colored bar chart Eliminate doubts with our Adjusting The Data PowerPoint Icon C. Download without worries with our money back guaranteee.
Adjusting The Data PowerPoint Icon Cc
3d illustration of a simple wrench turning/adjusting the elements on a multi-colored bar chart Change the world with our Adjusting The Data PowerPoint Icon Cc. You will come out on top.
Adjusting The Data PowerPoint Icon F
3d illustration of a simple wrench turning/adjusting the elements on a multi-colored bar chart Confident and committed define you well. Add to your dynamism with our Adjusting The Data PowerPoint Icon F.
Adjusting The Data PowerPoint Icon R
3d illustration of a simple wrench turning/adjusting the elements on a multi-colored bar chart Recapture your dream with our Adjusting The Data PowerPoint Icon R. Download without worries with our money back guaranteee.
Adjusting The Data PowerPoint Icon S
3d illustration of a simple wrench turning/adjusting the elements on a multi-colored bar chart Analyze growth with our Adjusting The Data PowerPoint Icon S. Download without worries with our money back guaranteee.
Analyzing The Data PowerPoint Icon C
3d illustration of a magnifying glass hovering over a three-dimensional multi-colored bar chart Our Analyzing The Data PowerPoint Icon C will get you all animated. You will become eager to assert your views.
Analyzing The Data PowerPoint Icon Cc
3d illustration of a magnifying glass hovering over a three-dimensional multi-colored bar chart Entertain dreams with our Analyzing The Data PowerPoint Icon Cc. Let your imagination run to places unknown.
Analyzing The Data PowerPoint Icon F
3d illustration of a magnifying glass hovering over a three-dimensional multi-colored bar chart Our Analyzing The Data PowerPoint Icon F are generous to an excess. They will give their all most willingly.
Analyzing The Data PowerPoint Icon R
3d illustration of a magnifying glass hovering over a three-dimensional multi-colored bar chart You are a renowned exponent of your trade. Ply your line with our Analyzing The Data PowerPoint Icon R.
Analyzing The Data PowerPoint Icon S
3d illustration of a magnifying glass hovering over a three-dimensional multi-colored bar chart Our Analyzing The Data PowerPoint Icon S are a great equaliser. They take everybody to the same level.
Business Data Graph PowerPoint Icon C
Increasing Bar Chart - Business Data Graph With World Map Our Business Data Graph PowerPoint Icon C will be your best buy. The value of your thoughts will definitely appreciate.
Business Graph Adjust PowerPoint Icon C
Microsoft powerpoint template and Background with a multi colored bar chart inside the center opening of a large gear Our Business Graph Adjust PowerPoint Icon C ensure an admirable address. The audience won't be able to fault your ideas.
Business Graph Adjust PowerPoint Icon Cc
Microsoft powerpoint template and Background with a multi colored bar chart inside the center opening of a large gear Keep them driven with our Business Graph Adjust PowerPoint Icon Cc. You will come out on top.
Business Graph Adjust PowerPoint Icon F
Microsoft powerpoint template and Background with a multi colored bar chart inside the center opening of a large gear Collect all the evidence on our Business Graph Adjust PowerPoint Icon F. Connect the clues and come to conclusions with ease.
Business Graph Adjust PowerPoint Icon R
Microsoft powerpoint template and Background with a multi colored bar chart inside the center opening of a large gear Our Business Graph Adjust PowerPoint Icon R are good for any contest. They enjoy every challenge put to them.


 Continue with Email

 Home
Home


