Board Of Director Chart
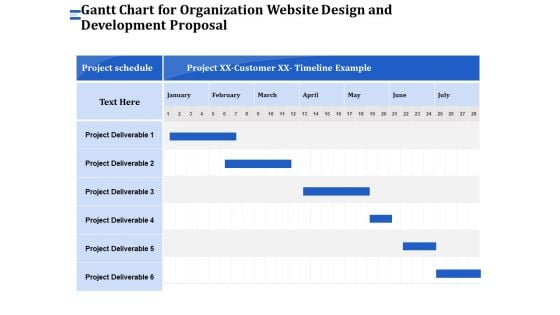
Firm Webpage Builder And Design Gantt Chart For Organization Website Design And Development Proposal Designs PDF
Manage your complex projects and organize them simultaneously with this detailed Gantt Chart PowerPoint Template. Track your milestones, tasks, phases, activities, subtasks amongst other constituents that will give you an updated visual of your project. Reflect your planning horizon and capture your release plan in one view with this Gantt Chart PowerPoint presentation template. You can plot various dependencies directly on this Timeline PowerPoint Presentation Layout to see which tasks are still in the pipeline and how the delays in them are impacting the schedules and deadlines of the project. Apart from this, you can also share this updated visual with your team members and stakeholders, thus making it a resourceful tool to be incorporated in your business structure. Not only this but also the editable layout of this slide helps you to add your data and statistics at your convenience.
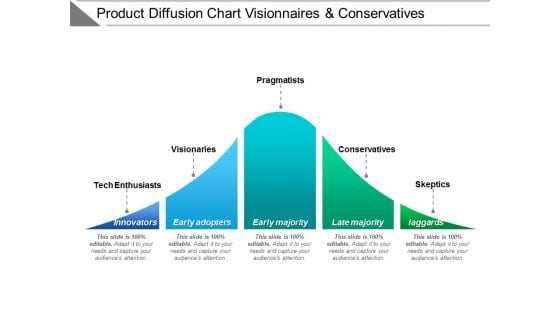
Product Diffusion Chart Visionaries And Conservatives Ppt PowerPoint Presentation Model Clipart
This is a product diffusion chart visionaries and conservatives ppt powerpoint presentation model clipart. This is a five stage process. The stages in this process are adoption curve, crossing the chasm, hype cycle.
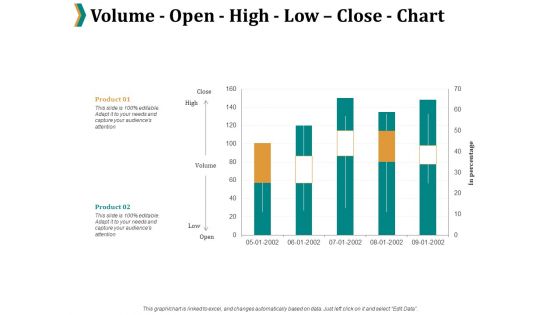
Volume Open High Low Close Chart Ppt PowerPoint Presentation Professional Maker
This is a volume open high low close chart ppt powerpoint presentation professional maker. This is a two stage process. The stages in this process are percentage, product, marketing.
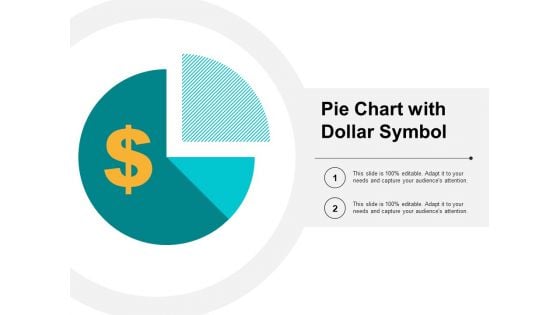
Pie Chart With Dollar Symbol Ppt PowerPoint Presentation Infographic Template Graphics Design
This is a pie chart with dollar symbol ppt powerpoint presentation infographic template graphics design. This is a two stage process. The stages in this process are sectioned circle, segmented circle, partitioned circle.
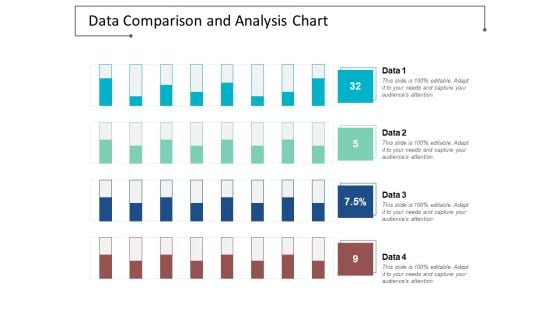
Data Comparison And Analysis Chart Ppt Powerpoint Presentation File Background Images
This is a data comparison and analysis chart ppt powerpoint presentation file background images. This is a four stage process. The stages in this process are data presentation, content presentation, information presentation.
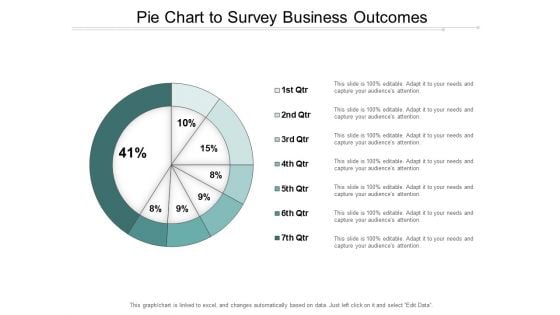
Pie Chart To Survey Business Outcomes Ppt Powerpoint Presentation Infographic Template Gridlines
This is a pie chart to survey business outcomes ppt powerpoint presentation infographic template gridlines. This is a seven stage process. The stages in this process are business outcomes, business results, business output.
Human Head With Flow Chart Symbol Ppt Powerpoint Presentation Ideas Design Templates
This is a human head with flow chart symbol ppt powerpoint presentation ideas design templates. This is a one stage process. The stages in this process are brainstorming, thinking man, innovative man.
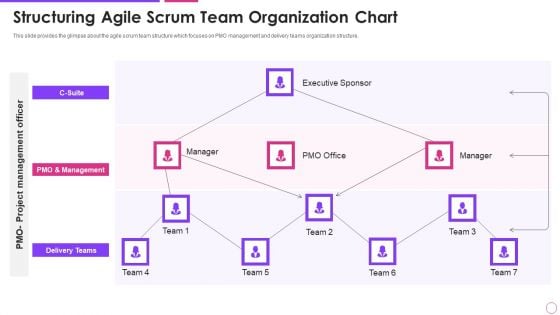
Structuring Agile Scrum Team Organization Chart Agile Project Management Framework Background PDF
Deliver an awe inspiring pitch with this creative structuring agile scrum team organization chart agile project management framework background pdf bundle. Topics like executive sponsor, delivery teams, management can be discussed with this completely editable template. It is available for immediate download depending on the needs and requirements of the user.
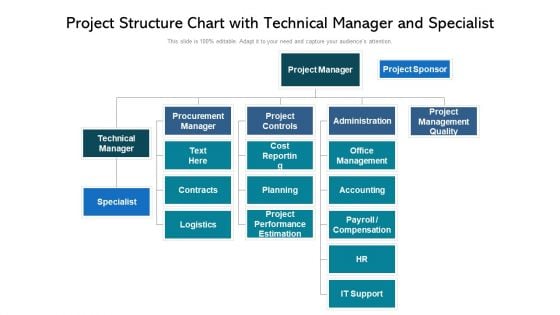
Project Structure Chart With Technical Manager And Specialist Ppt PowerPoint Presentation Gallery Guide PDF
Presenting project structure chart with technical manager and specialist ppt powerpoint presentation gallery guide pdf to dispense important information. This template comprises five stages. It also presents valuable insights into the topics including procurement manager, project controls, administration. This is a completely customizable PowerPoint theme that can be put to use immediately. So, download it and address the topic impactfully.
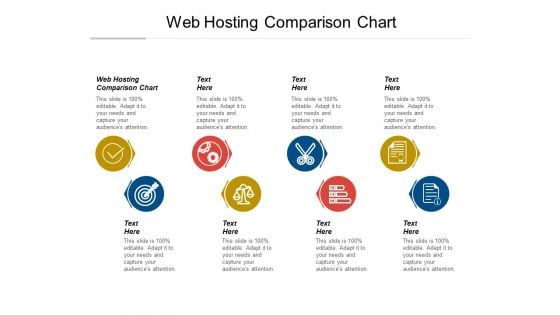
Web Hosting Comparison Chart Ppt PowerPoint Presentation Gallery Themes Cpb Pdf
Presenting this set of slides with name web hosting comparison chart ppt powerpoint presentation gallery themes cpb pdf. This is an editable Powerpoint eight stages graphic that deals with topics like web hosting comparison chart to help convey your message better graphically. This product is a premium product available for immediate download and is 100 percent editable in Powerpoint. Download this now and use it in your presentations to impress your audience.
Data Chart With Up And Down Arrow Vector Icon Ppt PowerPoint Presentation Layouts Pictures PDF
Presenting data chart with up and down arrow vector icon ppt powerpoint presentation layouts pictures pdf to dispense important information. This template comprises three stages. It also presents valuable insights into the topics including data chart with up and down arrow vector icon. This is a completely customizable PowerPoint theme that can be put to use immediately. So, download it and address the topic impactfully.
Mind Thinking Workflow Chart Vector Icon Ppt PowerPoint Presentation Infographics Graphics Design PDF
Persuade your audience using this mind thinking workflow chart vector icon ppt powerpoint presentation infographics graphics design pdf. This PPT design covers two stages, thus making it a great tool to use. It also caters to a variety of topics including mind thinking workflow chart vector icon. Download this PPT design now to present a convincing pitch that not only emphasizes the topic but also showcases your presentation skills.
Purchase Order Process Flow Chart Ppt PowerPoint Presentation Gallery Icons Cpb Pdf
Presenting this set of slides with name purchase order process flow chart ppt powerpoint presentation gallery icons cpb pdf. This is an editable Powerpoint five stages graphic that deals with topics like purchase order process flow chart to help convey your message better graphically. This product is a premium product available for immediate download and is 100 percent editable in Powerpoint. Download this now and use it in your presentations to impress your audience.
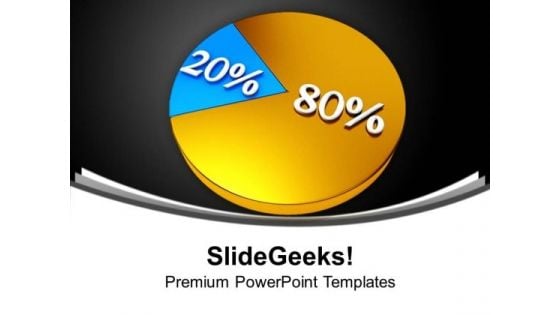
Pie Chart 80 20 Percent Business PowerPoint Templates And PowerPoint Themes 1112
Pie Chart 80 20 Percent Business PowerPoint Templates And PowerPoint Themes 1112-The above template contains an image of pie chart with eighty and twenty percent. Use this template for Business and Marketing presentations. It imitates finance, profit, savings and statistics. Present your views using our innovative slides and be assured of leaving a lasting impression. Our PPT images are so ideally designed that it reveals the very basis of our PPT template are an effective tool to make your clients understand.-Pie Chart 80 20 Percent Business PowerPoint Templates And PowerPoint Themes 1112-This PowerPoint template can be used for presentations relating to-Pie Chart 80 - 20 Percent, Signs, Symbol, Business, Marketing, Finance Be a proactive manager with our Pie Chart 80 20 Percent Business PowerPoint Templates And PowerPoint Themes 1112. They will make you look good.
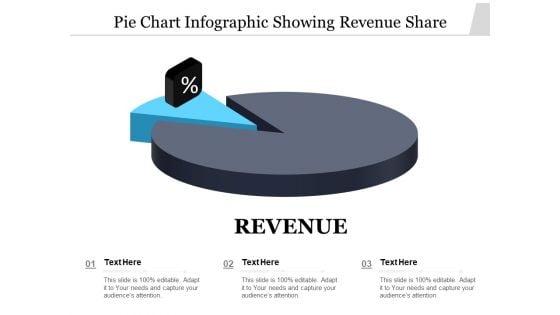
Pie Chart Infographic Showing Revenue Share Ppt Styles Graphics Pictures PDF
Persuade your audience using this pie chart infographic showing revenue share ppt styles graphics pictures pdf. This PPT design covers three stages, thus making it a great tool to use. It also caters to a variety of topics including pie chart infographic showing revenue share. Download this PPT design now to present a convincing pitch that not only emphasizes the topic but also showcases your presentation skills.
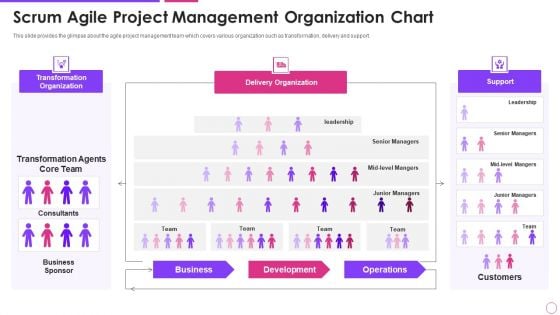
Scrum Agile Project Management Organization Chart Agile Project Management Framework Themes PDF
This slide provides the glimpse about the agile project management team which covers various organization such as transformation, delivery and support. Deliver and pitch your topic in the best possible manner with this scrum agile project management organization chart agile project management framework themes pdf. Use them to share invaluable insights on delivery organization, development, operations, business and impress your audience. This template can be altered and modified as per your expectations. So, grab it now.
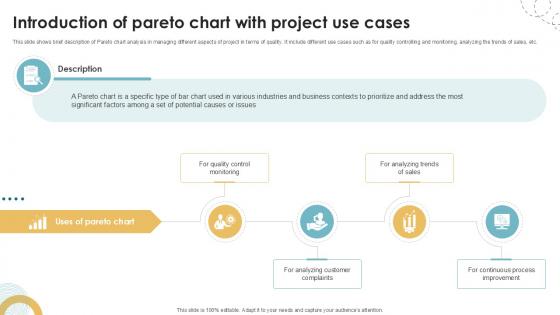
Introduction Of Pareto Chart With Project Use Cases Executing Quality Ppt Slides PM SS V
This slide shows brief description of Pareto chart analysis in managing different aspects of project in terms of quality. It include different use cases such as for quality controlling and monitoring, analyzing the trends of sales, etc. The best PPT templates are a great way to save time, energy, and resources. Slidegeeks have 100 percent editable powerpoint slides making them incredibly versatile. With these quality presentation templates, you can create a captivating and memorable presentation by combining visually appealing slides and effectively communicating your message. Download Introduction Of Pareto Chart With Project Use Cases Executing Quality Ppt Slides PM SS V from Slidegeeks and deliver a wonderful presentation. This slide shows brief description of Pareto chart analysis in managing different aspects of project in terms of quality. It include different use cases such as for quality controlling and monitoring, analyzing the trends of sales, etc.
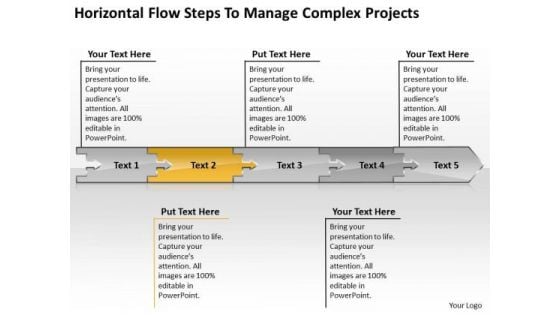
Flow Steps To Manage Complex Projects Chart Electrical Schematic PowerPoint Free Slides
We present our flow steps to manage complex projects chart electrical schematic PowerPoint free Slides.Use our Arrows PowerPoint Templates because you have the product you are very confident of and are very sure it will prove immensely popular with clients all over your target areas. Download and present our Shapes PowerPoint Templates because our creative template will lay down your views. Use our Business PowerPoint Templates because you are ready to flap your wings and launch off. All poised are you to touch the sky with glory. Present our Signs PowerPoint Templates because we provide the means to project your views. Download our Process and Flows PowerPoint Templates because you should Emphasise the process of your business or corporate growth.Use these PowerPoint slides for presentations relating to abstract, arrow, blank, business, chart, circular, circulation, concept, conceptual, design, diagram, executive, flow, horizontal, icon, idea, illustration, management, model, numbers, organization, process, progression, resource, sequence, stages, steps, strategy. The prominent colors used in the PowerPoint template are Yellow, Gray, Black. The feedback we get is that our flow steps to manage complex projects chart electrical schematic PowerPoint free Slides are Elegant. PowerPoint presentation experts tell us our circular PowerPoint templates and PPT Slides are Nostalgic. People tell us our flow steps to manage complex projects chart electrical schematic PowerPoint free Slides are Radiant. Professionals tell us our concept PowerPoint templates and PPT Slides are Pleasant. You can be sure our flow steps to manage complex projects chart electrical schematic PowerPoint free Slides are One-of-a-kind. We assure you our chart PowerPoint templates and PPT Slides are Royal. Give your thoughts a fair complexion. Brighten it up with our the colors of our Flow Steps To Manage Complex Projects Chart Electrical Schematic PowerPoint Free Slides.
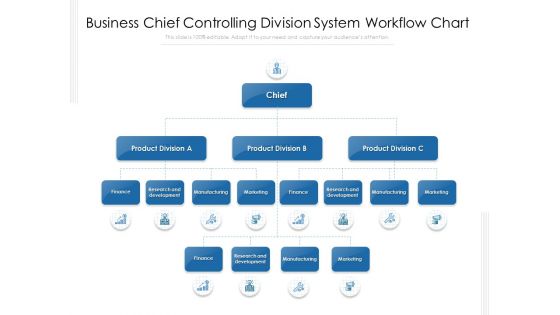
Business Chief Controlling Division System Workflow Chart Ppt PowerPoint Presentation Gallery Examples PDF
Presenting business chief controlling division system workflow chart ppt powerpoint presentation gallery examples pdf to dispense important information. This template comprises three stages. It also presents valuable insights into the topics including manufacturing, finance, marketing. This is a completely customizable PowerPoint theme that can be put to use immediately. So, download it and address the topic impactfully.
Clustered Bar Chart Yearly Operating Plan Ppt PowerPoint Presentation Styles Icon
This is a clustered bar chart yearly operating plan ppt powerpoint presentation styles icon. This is a four stage process. The stages in this process are business, management, strategy, analysis, marketing.
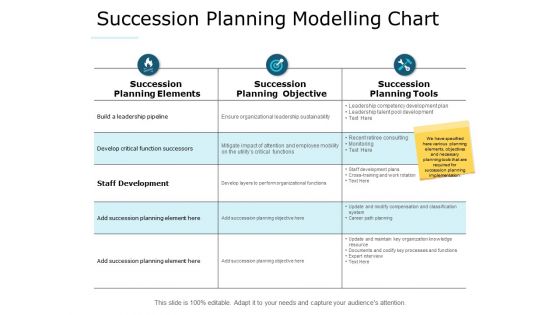
Succession Planning Modelling Chart Ppt PowerPoint Presentation Visual Aids Background Images
This is a succession planning modelling chart ppt powerpoint presentation visual aids background images. This is a three stage process. The stages in this process are compare, marketing, business, management, planning.
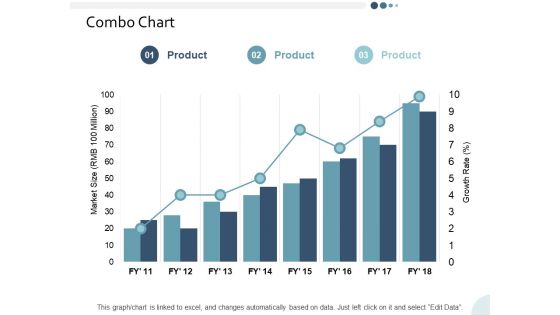
Combo Chart Yearly Operating Plan Ppt PowerPoint Presentation Infographic Template Skills
This is a combo chart yearly operating plan ppt powerpoint presentation infographic template skills. This is a three stage process. The stages in this process are business, management, strategy, analysis, marketing.
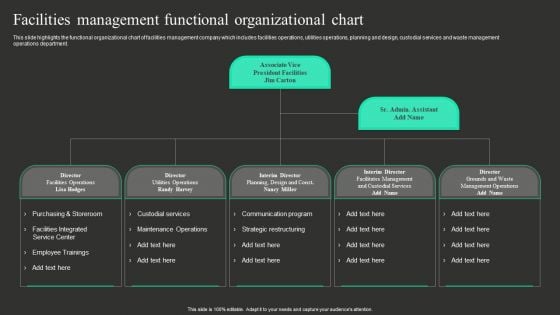
Workplace Facility Management Services Company Facilities Management Functional Organizational Chart Graphics PDF
This slide highlights the functional organizational chart of facilities management company which includes facilities operations, utilities operations, planning and design, custodial services and waste management operations department. From laying roadmaps to briefing everything in detail, our templates are perfect for you. You can set the stage with your presentation slides. All you have to do is download these easy to edit and customizable templates. Workplace Facility Management Services Company Facilities Management Functional Organizational Chart Graphics PDF will help you deliver an outstanding performance that everyone would remember and praise you for. Do download this presentation today.
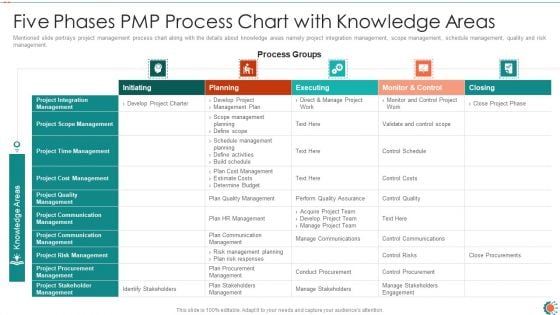
Five Phases PMP Process Chart With Knowledge Areas Ppt Ideas Infographic Template PDF
Mentioned slide portrays project management process chart along with the details about knowledge areas namely project integration management, scope management, schedule management, quality and risk management. Deliver an awe inspiring pitch with this creative five phases pmp process chart with knowledge areas ppt ideas infographic template pdf bundle. Topics like management, planning, scope can be discussed with this completely editable template. It is available for immediate download depending on the needs and requirements of the user.
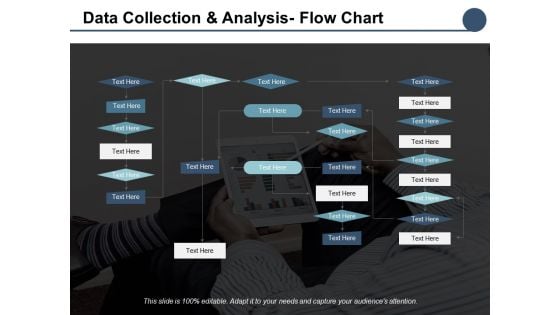
Data Collection And Analysis Flow Chart Ppt PowerPoint Presentation Outline Graphics
This is a data collection and analysis flow chart ppt powerpoint presentation outline graphics. This is a five stage process. The stages in this process are business, management, planning, strategy, marketing.
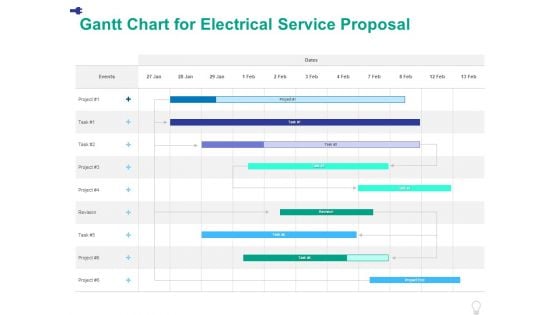
Gantt Chart For Electrical Service Proposal Ppt PowerPoint Presentation Styles Layouts
Our Gantt Chart PowerPoint Template is a modern and professional layout designed to create some of the vital components that help you to create timelines, roadmaps, project plans, etc. Communicate your project activity durations, milestones, tasks, subtasks, dependencies and other attributes with this content-ready PowerPoint template. Further, showcase precedence against time by employing this fully editable PowerPoint chart into your business tasks. With a single glance at this resourceful PPT layout, the audiences can get a complete overview of the tasks, duration, resources employed, and overlapping of the activities in a particular project, making it an ideal choice for project managers and leaders. Not only this, but the color scheme of this template is also such that it is sure to impress your audience, no matter which niche they belong to. Thus steer your project meetings, meetups, and conferences with this Gantt Chart PPT slide.
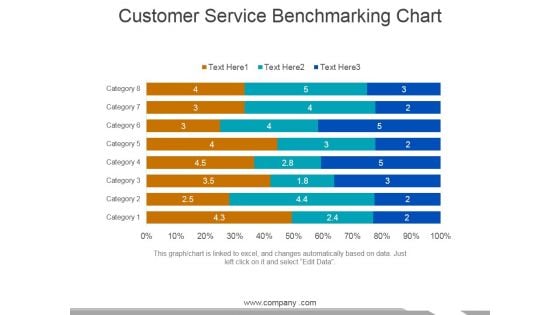
Customer Service Benchmarking Chart Ppt PowerPoint Presentation Infographic Template Graphics Tutorials
This is a customer service benchmarking chart ppt powerpoint presentation infographic template graphics tutorials. This is a eight stage process. The stages in this process are category, business, marketing, management.
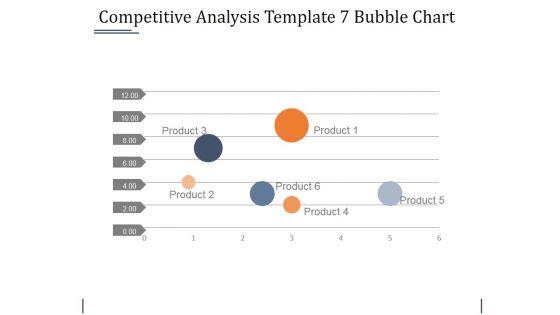
Competitive Analysis Template 7 Bubble Chart Ppt PowerPoint Presentation Summary Guidelines
This is a competitive analysis template 7 bubble chart ppt powerpoint presentation summary guidelines. This is a six stage process. The stages in this process are business, bubble, management, strategy, marketing.
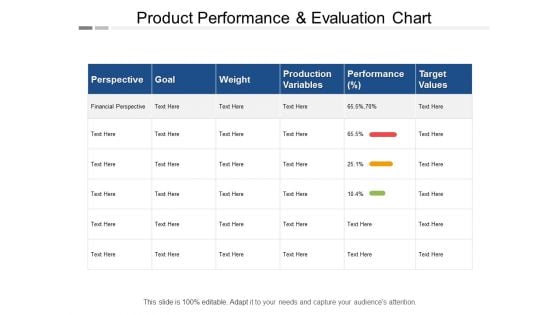
Product Performance And Evaluation Chart Ppt PowerPoint Presentation Pictures Slide Download
This is a product performance and evaluation chart ppt powerpoint presentation pictures slide download. This is a sex stage process. The stages in this process are production management, production performance, production improvement.
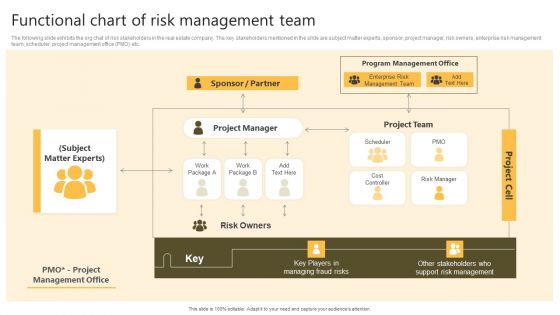
Successful Risk Administration Functional Chart Of Risk Management Team Template PDF
The following slide exhibits the org chat of risk stakeholders in the real estate company. The key stakeholders mentioned in the slide are subject matter experts, sponsor, project manager, risk owners, enterprise risk management team, scheduler, project management office PMO etc. Present like a pro with Successful Risk Administration Functional Chart Of Risk Management Team Template PDF Create beautiful presentations together with your team, using our easy-to-use presentation slides. Share your ideas in real-time and make changes on the fly by downloading our templates. So whether you are in the office, on the go, or in a remote location, you can stay in sync with your team and present your ideas with confidence. With Slidegeeks presentation got a whole lot easier. Grab these presentations today.
PMP Process Chart With Knowledge Area Ppt Icon Layout Ideas PDF
Following slide displays project management process chart along with the details about knowledge areas namely project integration management, scope management, schedule management, quality and risk management. Deliver and pitch your topic in the best possible manner with this pmp procedure chart it poste it notes ppt portfolio guidelines pdf. Use them to share invaluable insights on management, integration, schedule and impress your audience. This template can be altered and modified as per your expectations. So, grab it now.
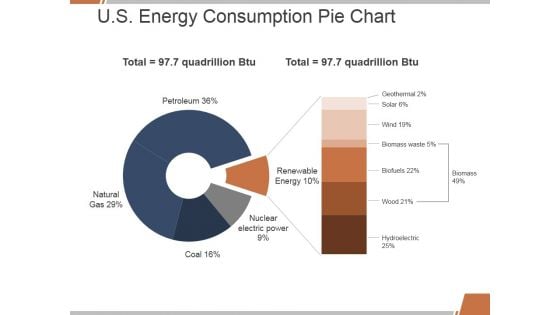
U S Energy Consumption Pie Chart Ppt PowerPoint Presentation File Background Designs
This is a u s energy consumption pie chart ppt powerpoint presentation file background designs. This is a five stage process. The stages in this process are petroleum, natural, renewable energy, nuclear electric power, coal.
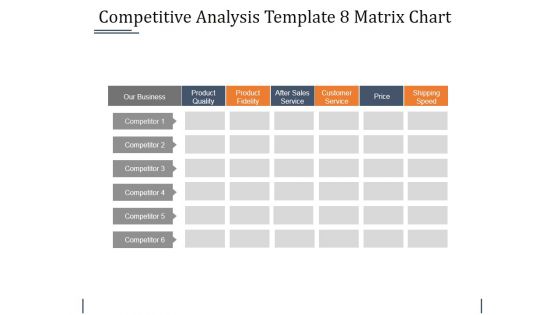
Competitive Analysis Template 8 Matrix Chart Ppt PowerPoint Presentation Show Outfit
This is a competitive analysis template 8 matrix chart ppt powerpoint presentation show outfit. This is a six stage process. The stages in this process are product quality, product fidelity, after sales service, customer service, price, shipping speed.
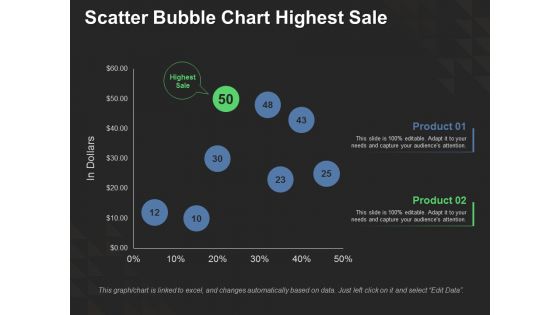
Scatter Bubble Chart Highest Sale Ppt PowerPoint Presentation Show Slide Download
This is a scatter bubble chart highest sale ppt powerpoint presentation show slide download. This is a two stage process. The stages in this process are finance, investment, analysis, business, marketing.
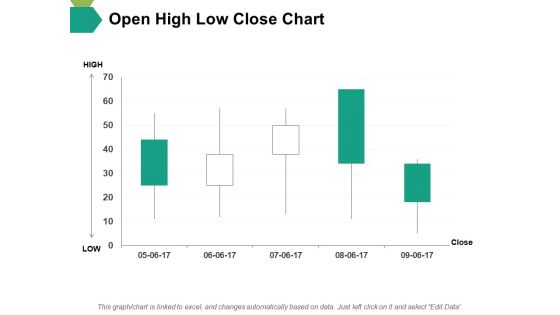
Open High Low Close Chart Ppt PowerPoint Presentation Slides File Formats
This is a open high low close chart ppt powerpoint presentation slides file formats. This is a five stage process. The stages in this process are open, high, low, close, finance.
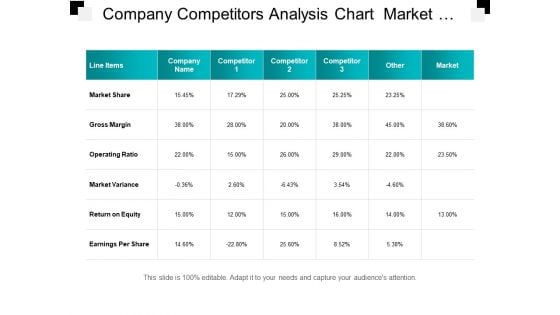
Company Competitors Analysis Chart Market Share And Return On Equity Ppt PowerPoint Presentation Picture
This is a company competitors analysis chart market share and return on equity ppt powerpoint presentation picture. This is a seven stage process. The stages in this process are competitive analysis, benchmark competition, competition landscape.

Thank You Consumer Service Process Flow Chart Ppt Powerpoint Presentation Gallery Outfit
This is a thank you consumer service process flow chart ppt powerpoint presentation gallery outfit. This is a one stage process. The stages in this process are thank you.
Thank You Customer Service Process Flow Chart Ppt PowerPoint Presentation Slides Ideas
This is a thank you customer service process flow chart ppt powerpoint presentation slides ideas. This is a one stage process. The stages in this process are thank you, greeting, word.
Statistical Analysis Icon With Pie Chart Ppt PowerPoint Presentation Diagram Templates PDF
Persuade your audience using this statistical analysis icon with pie chart ppt powerpoint presentation diagram templates pdf. This PPT design covers three stages, thus making it a great tool to use. It also caters to a variety of topics including statistical analysis icon with pie chart. Download this PPT design now to present a convincing pitch that not only emphasizes the topic but also showcases your presentation skills.
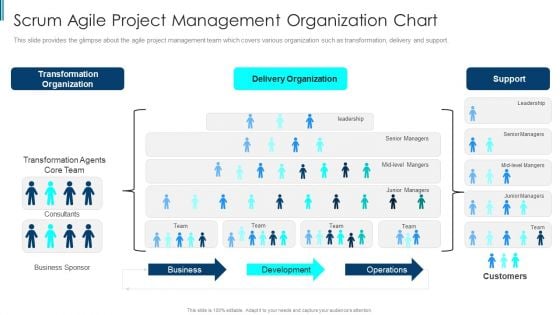
Scrum Staff Organization Map IT Scrum Agile Project Management Organization Chart Pictures PDF
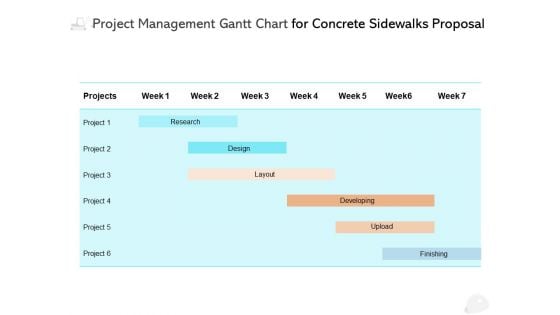
Project Management Gantt Chart For Concrete Sidewalks Proposal Ppt PowerPoint Presentation Slide Download
Our Gantt Chart PowerPoint Template is a modern and professional layout designed to create some of the vital components that help you to create timelines, roadmaps, project plans, etc. Communicate your project activity durations, milestones, tasks, subtasks, dependencies and other attributes with this content-ready PowerPoint template. Further, showcase precedence against time by employing this fully editable PowerPoint chart into your business tasks. With a single glance at this resourceful PPT layout, the audiences can get a complete overview of the tasks, duration, resources employed, and overlapping of the activities in a particular project, making it an ideal choice for project managers and leaders. Not only this, but the color scheme of this template is also such that it is sure to impress your audience, no matter which niche they belong to. Thus steer your project meetings, meetups, and conferences with this Gantt Chart PPT slide.
Three Stages Linear Process Flow Chart Vector Icon Ppt PowerPoint Presentation Icon Portfolio PDF
Persuade your audience using this three stages linear process flow chart vector icon ppt powerpoint presentation icon portfolio pdf. This PPT design covers three stages, thus making it a great tool to use. It also caters to a variety of topics including three stages linear process flow chart vector icon. Download this PPT design now to present a convincing pitch that not only emphasizes the topic but also showcases your presentation skills.
New Idea Analysis Bulb With Flow Chart Vector Icon Ppt PowerPoint Presentation Icon Layouts PDF
Persuade your audience using this new idea analysis bulb with flow chart vector icon ppt powerpoint presentation icon layouts pdf. This PPT design covers three stages, thus making it a great tool to use. It also caters to a variety of topics including new idea analysis bulb with flow chart vector icon. Download this PPT design now to present a convincing pitch that not only emphasizes the topic but also showcases your presentation skills.
Statistical Analysis Icon With Chart And Gear On Computer Screen Ppt PowerPoint Presentation File Grid PDF
Presenting statistical analysis icon with chart and gear on computer screen ppt powerpoint presentation file grid pdf to dispense important information. This template comprises three stages. It also presents valuable insights into the topics including statistical analysis icon with chart and gear on computer screen. This is a completely customizable PowerPoint theme that can be put to use immediately. So, download it and address the topic impactfully.
Cost Structure Assessment Chart With Down Flow Vector Icon Ppt PowerPoint Presentation File Demonstration PDF
Presenting cost structure assessment chart with down flow vector icon ppt powerpoint presentation file demonstration pdf to dispense important information. This template comprises one stages. It also presents valuable insights into the topics including cost structure assessment chart with down flow vector icon. This is a completely customizable PowerPoint theme that can be put to use immediately. So, download it and address the topic impactfully.
Chart Icon With Magnifying Glass Depicting Decline In Sales Ppt PowerPoint Presentation Gallery Layout PDF
Presenting chart icon with magnifying glass depicting decline in sales ppt powerpoint presentation gallery layout pdf to dispense important information. This template comprises three stages. It also presents valuable insights into the topics including chart icon with magnifying glass depicting decline in sales. This is a completely customizable PowerPoint theme that can be put to use immediately. So, download it and address the topic impactfully.

Order Cash Process Flow Chart Ppt PowerPoint Presentation Show Design Inspiration Cpb
Presenting this set of slides with name order cash process flow chart ppt powerpoint presentation show design inspiration cpb. This is an editable Powerpoint four stages graphic that deals with topics like order cash process flow chart to help convey your message better graphically. This product is a premium product available for immediate download and is 100 percent editable in Powerpoint. Download this now and use it in your presentations to impress your audience.
Pie Chart In Human Brain Vector Icon Ppt PowerPoint Presentation Gallery Sample PDF
Persuade your audience using this pie chart in human brain vector icon ppt powerpoint presentation gallery sample pdf. This PPT design covers three stages, thus making it a great tool to use. It also caters to a variety of topics including pie chart in human brain vector icon. Download this PPT design now to present a convincing pitch that not only emphasizes the topic but also showcases your presentation skills.
Business Growth Trends Vector Icon With Rising Chart Ppt PowerPoint Presentation Gallery Designs PDF
Persuade your audience using this business growth trends vector icon with rising chart ppt powerpoint presentation gallery designs pdf. This PPT design covers three stages, thus making it a great tool to use. It also caters to a variety of topics including business growth trends vector icon with rising chart. Download this PPT design now to present a convincing pitch that not only emphasizes the topic but also showcases your presentation skills.
Entity Relationship Flow Chart Vector Icon Ppt PowerPoint Presentation Slides Portfolio PDF
Persuade your audience using this entity relationship flow chart vector icon ppt powerpoint presentation slides portfolio pdf. This PPT design covers three stages, thus making it a great tool to use. It also caters to a variety of topics including entity relationship flow chart vector icon. Download this PPT design now to present a convincing pitch that not only emphasizes the topic but also showcases your presentation skills.
Entity Relationship Workflow Chart Vector Icon Ppt PowerPoint Presentation Layouts Inspiration PDF
Persuade your audience using this entity relationship workflow chart vector icon ppt powerpoint presentation layouts inspiration pdf. This PPT design covers three stages, thus making it a great tool to use. It also caters to a variety of topics including entity relationship workflow chart vector icon. Download this PPT design now to present a convincing pitch that not only emphasizes the topic but also showcases your presentation skills.
Downfall Chart For Productivity Loss Vector Icon Ppt PowerPoint Presentation File Clipart PDF
Persuade your audience using this downfall chart for productivity loss vector icon ppt powerpoint presentation file clipart pdf. This PPT design covers three stages, thus making it a great tool to use. It also caters to a variety of topics including downfall chart for productivity loss vector icon. Download this PPT design now to present a convincing pitch that not only emphasizes the topic but also showcases your presentation skills.
Ecology Growth Chart For Sustainable Development Ppt PowerPoint Presentation Icon Example File PDF
Persuade your audience using this ecology growth chart for sustainable development ppt powerpoint presentation icon example file pdf. This PPT design covers four stages, thus making it a great tool to use. It also caters to a variety of topics including ecology growth chart for sustainable development. Download this PPT design now to present a convincing pitch that not only emphasizes the topic but also showcases your presentation skills.
Sections Of Circle With Eight Pieces Of Pie Chart Ppt PowerPoint Presentation Icon Display PDF
Persuade your audience using this sections of circle with eight pieces of pie chart ppt powerpoint presentation icon display pdf. This PPT design covers eight stages, thus making it a great tool to use. It also caters to a variety of topics including sections of circle with eight pieces of pie chart. Download this PPT design now to present a convincing pitch that not only emphasizes the topic but also showcases your presentation skills.
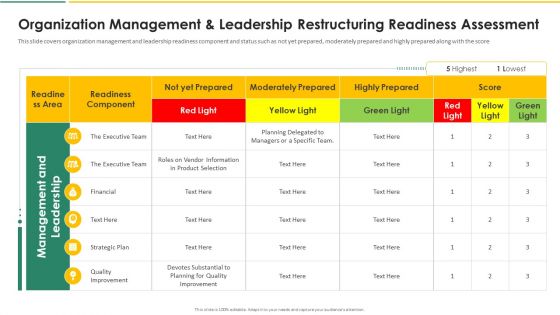
Organization Chart And Corporate Model Transformation Organization Management And Leadership Graphics PDF
This slide covers organization management and leadership readiness component and status such as not yet prepared, moderately prepared and highly prepared along with the score. Deliver an awe inspiring pitch with this creative organization chart and corporate model transformation organization management and leadership graphics pdf bundle. Topics like executive team, financial, strategic plan, quality improvement can be discussed with this completely editable template. It is available for immediate download depending on the needs and requirements of the user.
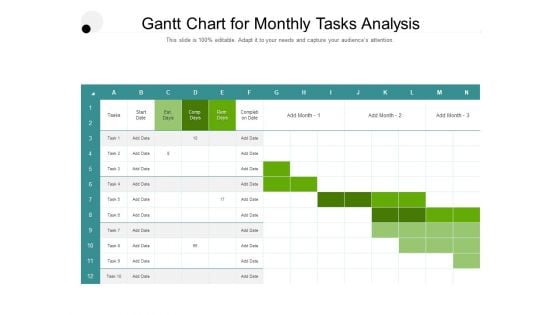
Gantt Chart For Monthly Tasks Analysis Ppt PowerPoint Presentation Pictures Format PDF
Our Gantt Chart PowerPoint Template is a modern and professional layout designed to create some of the vital components that help you to create timelines, roadmaps, project plans, etc. Communicate your project activity durations, milestones, tasks, subtasks, dependencies and other attributes with this content-ready PowerPoint template. Further, showcase precedence against time by employing this fully editable PowerPoint chart into your business tasks. With a single glance at this resourceful PPT layout, the audiences can get a complete overview of the tasks, duration, resources employed, and overlapping of the activities in a particular project, making it an ideal choice for project managers and leaders. Not only this, but the color scheme of this template is also such that it is sure to impress your audience, no matter which niche they belong to. Thus steer your project meetings, meetups, and conferences with this Gantt Chart PPT slide.
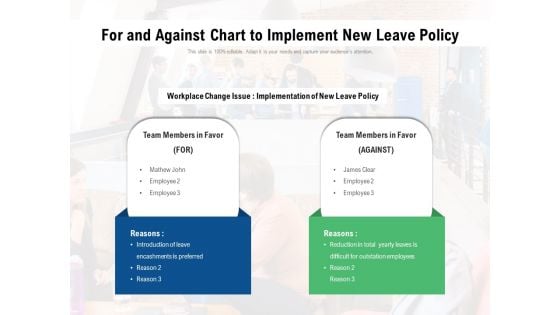
For And Against Chart To Implement New Leave Policy Ppt PowerPoint Presentation File Templates PDF
Presenting for and against chart to implement new leave policy ppt powerpoint presentation file templates pdf to dispense important information. This template comprises two stages. It also presents valuable insights into the topics including for and against chart to implement new leave policy. This is a completely customizable PowerPoint theme that can be put to use immediately. So, download it and address the topic impactfully.
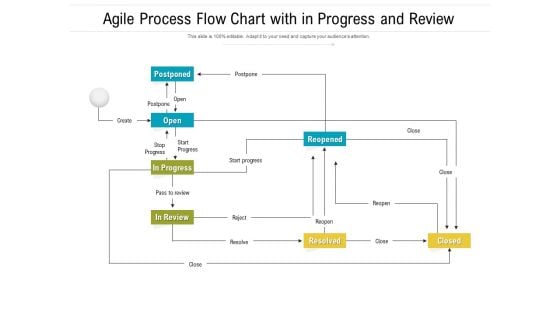
Agile Process Flow Chart With In Progress And Review Ppt PowerPoint Presentation File Demonstration PDF
Presenting agile process flow chart with in progress and review ppt powerpoint presentation file demonstration pdf to dispense important information. This template comprises one stages. It also presents valuable insights into the topics including agile process flow chart with in progress and review. This is a completely customizable PowerPoint theme that can be put to use immediately. So, download it and address the topic impactfully.
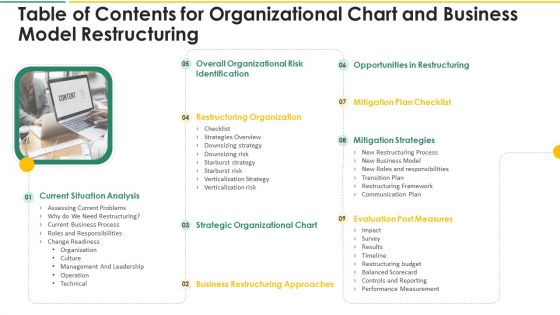
Table Of Contents For Organizational Chart And Business Model Restructuring Designs PDF
This is atable of contents for organizational chart and business model restructuring designs pdf template with various stages. Focus and dispense information on nine stages using this creative set, that comes with editable features. It contains large content boxes to add your information on topics like strategic organizational chart, business restructuring approaches, evaluation post measures, mitigation strategies, mitigation plan checklist. You can also showcase facts, figures, and other relevant content using this PPT layout. Grab it now.
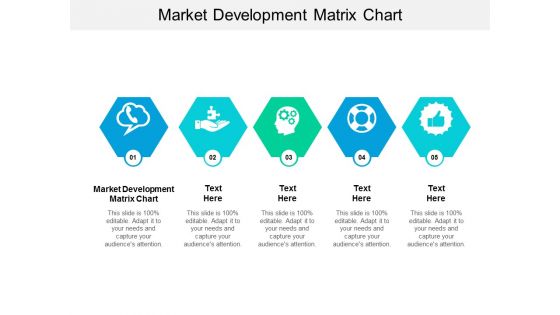
Market Development Matrix Chart Ppt PowerPoint Presentation Styles Example Introduction Cpb
Presenting this set of slides with name market development matrix chart ppt powerpoint presentation styles example introduction cpb. This is an editable Powerpoint five stages graphic that deals with topics like market development matrix chart to help convey your message better graphically. This product is a premium product available for immediate download and is 100 percent editable in Powerpoint. Download this now and use it in your presentations to impress your audience.


 Continue with Email

 Home
Home


