Brain Icons
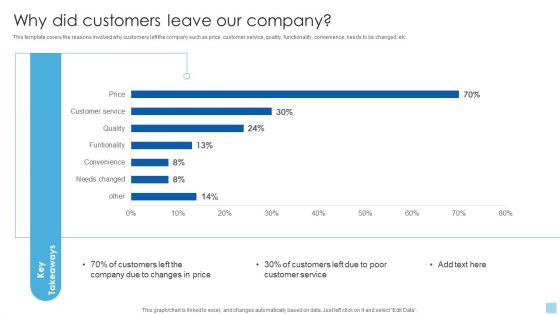
Strategies To Select Effective Why Did Customers Leave Our Company Graphics PDF
This template covers the reasons involved why customers left the company such as price, customer service, quality, functionality, convenience, needs to be changed, etc. Coming up with a presentation necessitates that the majority of the effort goes into the content and the message you intend to convey. The visuals of a PowerPoint presentation can only be effective if it supplements and supports the story that is being told. Keeping this in mind our experts created Strategies To Select Effective Why Did Customers Leave Our Company Graphics PDF to reduce the time that goes into designing the presentation. This way, you can concentrate on the message while our designers take care of providing you with the right template for the situation.
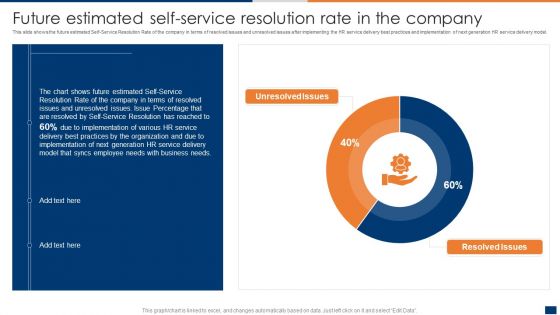
Future Estimated Self Service Resolution Rate In The Company Ppt PowerPoint Presentation File Show PDF
This slide shows the future estimated Self-Service Resolution Rate of the company in terms of resolved issues and unresolved issues after implementing the HR service delivery best practices and implementation of next generation HR service delivery model. Coming up with a presentation necessitates that the majority of the effort goes into the content and the message you intend to convey. The visuals of a PowerPoint presentation can only be effective if it supplements and supports the story that is being told. Keeping this in mind our experts created Future Estimated Self Service Resolution Rate In The Company Ppt PowerPoint Presentation File Show PDF to reduce the time that goes into designing the presentation. This way, you can concentrate on the message while our designers take care of providing you with the right template for the situation.
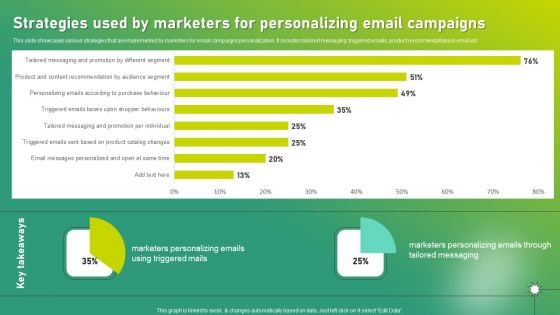
Targeted Marketing Strategic Plan For Audience Engagement Strategies Used By Marketers For Personalizing Email Campaigns Template PDF
This slide showcases various strategies that are implemented by marketers for email campaigns personalization. It includes tailored messaging, triggered emails, product recommendations in email etc. Coming up with a presentation necessitates that the majority of the effort goes into the content and the message you intend to convey. The visuals of a PowerPoint presentation can only be effective if it supplements and supports the story that is being told. Keeping this in mind our experts created Targeted Marketing Strategic Plan For Audience Engagement Strategies Used By Marketers For Personalizing Email Campaigns Template PDF to reduce the time that goes into designing the presentation. This way, you can concentrate on the message while our designers take care of providing you with the right template for the situation.
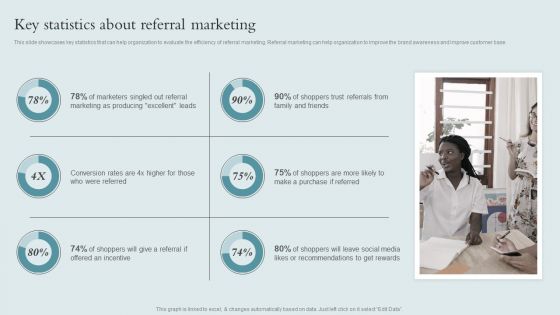
Brand Awareness Strategy Key Statistics About Referral Marketing Summary PDF
This slide showcases key statistics that can help organization to evaluate the efficiency of referral marketing. Referral marketing can help organization to improve the brand awareness and improve customer base. Coming up with a presentation necessitates that the majority of the effort goes into the content and the message you intend to convey. The visuals of a PowerPoint presentation can only be effective if it supplements and supports the story that is being told. Keeping this in mind our experts created Brand Awareness Strategy Key Statistics About Referral Marketing Summary PDF to reduce the time that goes into designing the presentation. This way, you can concentrate on the message while our designers take care of providing you with the right template for the situation.
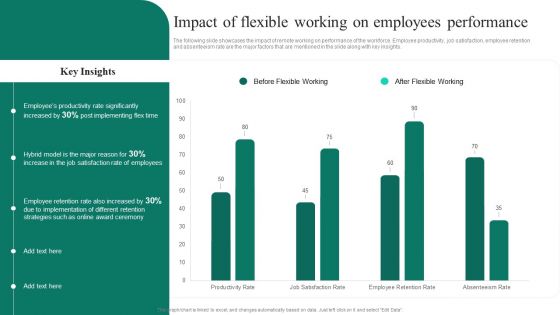
Adopting Flexible Work Policy Impact Of Flexible Working On Employees Performance Ideas PDF
The following slide showcases the impact of remote working on performance of the workforce. Employee productivity, job satisfaction, employee retention and absenteeism rate are the major factors that are mentioned in the slide along with key insights. Coming up with a presentation necessitates that the majority of the effort goes into the content and the message you intend to convey. The visuals of a PowerPoint presentation can only be effective if it supplements and supports the story that is being told. Keeping this in mind our experts created Adopting Flexible Work Policy Impact Of Flexible Working On Employees Performance Ideas PDF to reduce the time that goes into designing the presentation. This way, you can concentrate on the message while our designers take care of providing you with the right template for the situation.
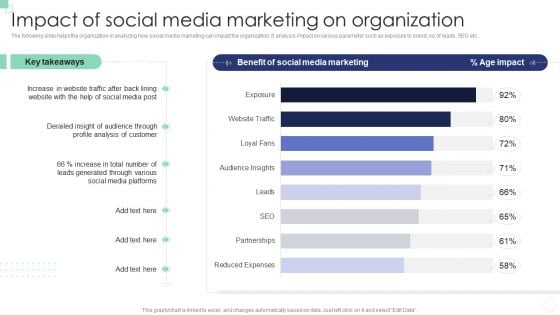
Implementing B2B And B2C Marketing Impact Of Social Media Marketing On Organization Background PDF
The following slide helps the organization in analyzing how social media marketing can impact the organization. It analysis impact on various parameter such as exposure to brand, no of leads, SEO etc. Coming up with a presentation necessitates that the majority of the effort goes into the content and the message you intend to convey. The visuals of a PowerPoint presentation can only be effective if it supplements and supports the story that is being told. Keeping this in mind our experts created Implementing B2B And B2C Marketing Impact Of Social Media Marketing On Organization Background PDF to reduce the time that goes into designing the presentation. This way, you can concentrate on the message while our designers take care of providing you with the right template for the situation.
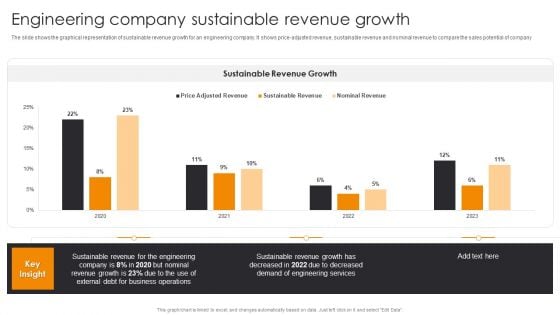
Engineering Company Sustainable Revenue Growth Engineering Company Financial Analysis Report Clipart PDF
The slide shows the graphical representation of sustainable revenue growth for an engineering company. It shows price-adjusted revenue, sustainable revenue and nominal revenue to compare the sales potential of company. Coming up with a presentation necessitates that the majority of the effort goes into the content and the message you intend to convey. The visuals of a PowerPoint presentation can only be effective if it supplements and supports the story that is being told. Keeping this in mind our experts created Engineering Company Sustainable Revenue Growth Engineering Company Financial Analysis Report Clipart PDF to reduce the time that goes into designing the presentation. This way, you can concentrate on the message while our designers take care of providing you with the right template for the situation.
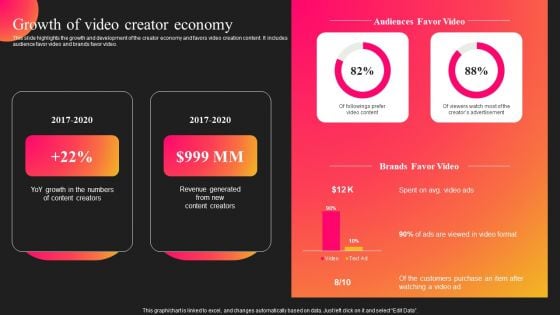
Curastory Editing Platform Pitch Deck Growth Of Video Creator Economy Template PDF
This slide highlights the growth and development of the creator economy and favors video creation content. It includes audience favor video and brands favor video. Coming up with a presentation necessitates that the majority of the effort goes into the content and the message you intend to convey. The visuals of a PowerPoint presentation can only be effective if it supplements and supports the story that is being told. Keeping this in mind our experts created Curastory Editing Platform Pitch Deck Growth Of Video Creator Economy Template PDF to reduce the time that goes into designing the presentation. This way, you can concentrate on the message while our designers take care of providing you with the right template for the situation.
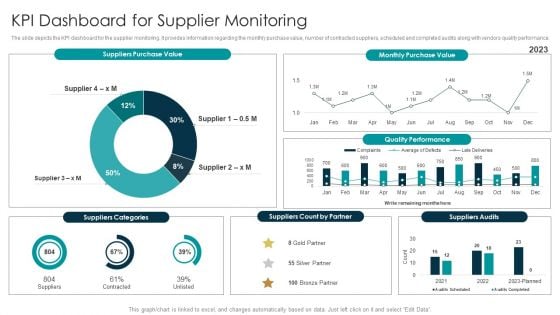
Tactical Approach For Vendor Reskilling KPI Dashboard For Supplier Monitoring Slides PDF
The slide depicts the KPI dashboard for the supplier monitoring. It provides information regarding the monthly purchase value, number of contracted suppliers, scheduled and completed audits along with vendors quality performance. Coming up with a presentation necessitates that the majority of the effort goes into the content and the message you intend to convey. The visuals of a PowerPoint presentation can only be effective if it supplements and supports the story that is being told. Keeping this in mind our experts created Tactical Approach For Vendor Reskilling KPI Dashboard For Supplier Monitoring Slides PDF to reduce the time that goes into designing the presentation. This way, you can concentrate on the message while our designers take care of providing you with the right template for the situation.
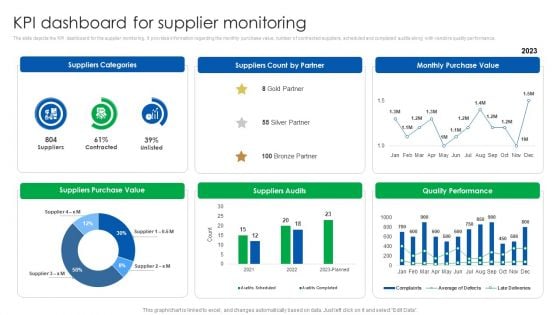
Vendor Relationship Management Strategic Plan KPI Dashboard For Supplier Monitoring Infographics PDF
The slide depicts the KPI dashboard for the supplier monitoring. It provides information regarding the monthly purchase value, number of contracted suppliers, scheduled and completed audits along with vendors quality performance. Coming up with a presentation necessitates that the majority of the effort goes into the content and the message you intend to convey. The visuals of a PowerPoint presentation can only be effective if it supplements and supports the story that is being told. Keeping this in mind our experts created Vendor Relationship Management Strategic Plan KPI Dashboard For Supplier Monitoring Infographics PDF to reduce the time that goes into designing the presentation. This way, you can concentrate on the message while our designers take care of providing you with the right template for the situation.

Competitor Assessment To Determine Companys Share Competitor Analysis Based On Companys Market Share Formats PDF
This slide covers the graphical representation of competitors market share. It also includes key takeaways such as market share of top competitors which is almost double of most others. Coming up with a presentation necessitates that the majority of the effort goes into the content and the message you intend to convey. The visuals of a PowerPoint presentation can only be effective if it supplements and supports the story that is being told. Keeping this in mind our experts created Competitor Assessment To Determine Companys Share Competitor Analysis Based On Companys Market Share Formats PDF to reduce the time that goes into designing the presentation. This way, you can concentrate on the message while our designers take care of providing you with the right template for the situation.
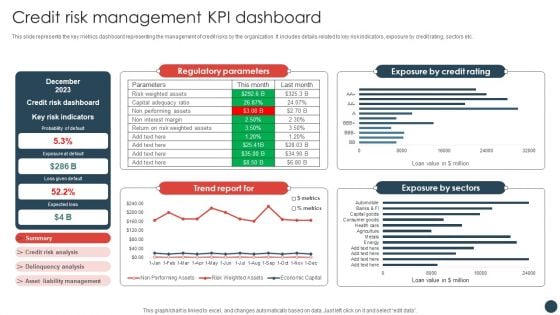
Strategic Risk Management Plan Credit Risk Management KPI Dashboard Information PDF
This slide represents the key metrics dashboard representing the management of credit risks by the organization. It includes details related to key risk indicators, exposure by credit rating, sectors etc.Coming up with a presentation necessitates that the majority of the effort goes into the content and the message you intend to convey. The visuals of a PowerPoint presentation can only be effective if it supplements and supports the story that is being told. Keeping this in mind our experts created Strategic Risk Management Plan Credit Risk Management KPI Dashboard Information PDF to reduce the time that goes into designing the presentation. This way, you can concentrate on the message while our designers take care of providing you with the right template for the situation.
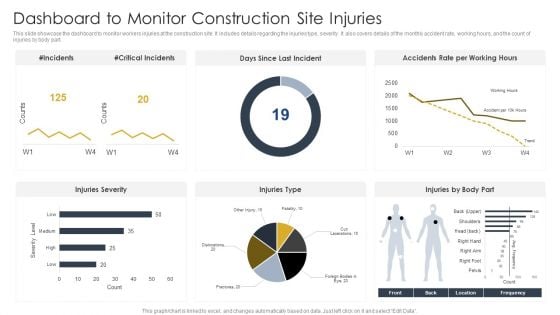
Dashboard To Monitor Construction Site Injuries Construction Site Safety Plan Elements PDF
This slide showcase the dashboard to monitor workers injuries at the construction site. It includes details regarding the injuries type, severity. It also covers details of the monthly accident rate, working hours, and the count of injuries by body part. Coming up with a presentation necessitates that the majority of the effort goes into the content and the message you intend to convey. The visuals of a PowerPoint presentation can only be effective if it supplements and supports the story that is being told. Keeping this in mind our experts created Dashboard To Monitor Construction Site Injuries Construction Site Safety Plan Elements PDF to reduce the time that goes into designing the presentation. This way, you can concentrate on the message while our designers take care of providing you with the right template for the situation.
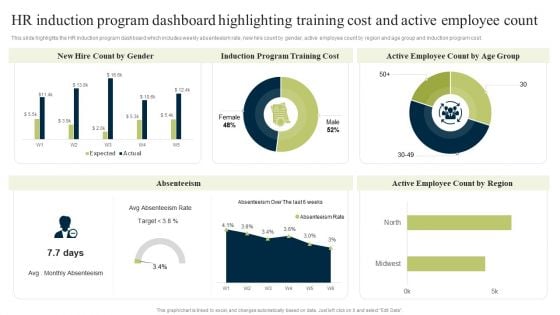
New Staff Onboarding Program HR Induction Program Dashboard Highlighting Training Cost And Active Employee Count Graphics PDF
This slide highlights the HR induction program dashboard which includes weekly absenteeism rate, new hire count by gender, active employee count by region and age group and induction program cost. Coming up with a presentation necessitates that the majority of the effort goes into the content and the message you intend to convey. The visuals of a PowerPoint presentation can only be effective if it supplements and supports the story that is being told. Keeping this in mind our experts created New Staff Onboarding Program HR Induction Program Dashboard Highlighting Training Cost And Active Employee Count Graphics PDF to reduce the time that goes into designing the presentation. This way, you can concentrate on the message while our designers take care of providing you with the right template for the situation.
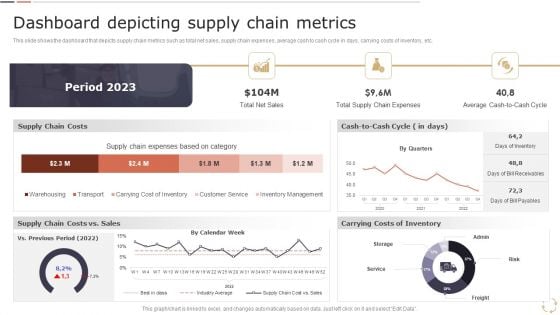
Optimizing Logistics Models To Enhance Supply Chain Management Dashboard Depicting Supply Chain Metrics Download PDF
This slide shows the dashboard that depicts supply chain metrics such as total net sales, supply chain expenses, average cash to cash cycle in days, carrying costs of inventory, etc. Coming up with a presentation necessitates that the majority of the effort goes into the content and the message you intend to convey. The visuals of a PowerPoint presentation can only be effective if it supplements and supports the story that is being told. Keeping this in mind our experts created Optimizing Logistics Models To Enhance Supply Chain Management Dashboard Depicting Supply Chain Metrics Download PDF to reduce the time that goes into designing the presentation. This way, you can concentrate on the message while our designers take care of providing you with the right template for the situation.
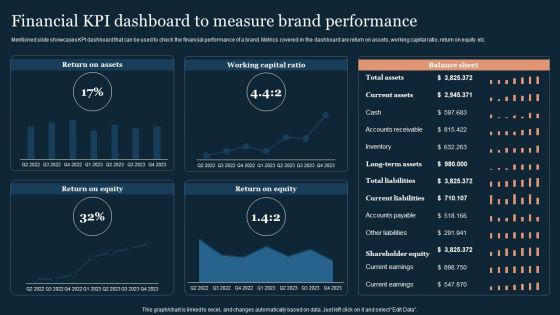
Guide To Develop And Estimate Brand Value Financial KPI Dashboard To Measure Brand Performance Formats PDF
Mentioned slide showcases KPI dashboard that can be used to check the financial performance of a brand. Metrics covered in the dashboard are return on assets, working capital ratio, return on equity etc.Coming up with a presentation necessitates that the majority of the effort goes into the content and the message you intend to convey. The visuals of a PowerPoint presentation can only be effective if it supplements and supports the story that is being told. Keeping this in mind our experts created Guide To Develop And Estimate Brand Value Financial KPI Dashboard To Measure Brand Performance Formats PDF to reduce the time that goes into designing the presentation. This way, you can concentrate on the message while our designers take care of providing you with the right template for the situation.
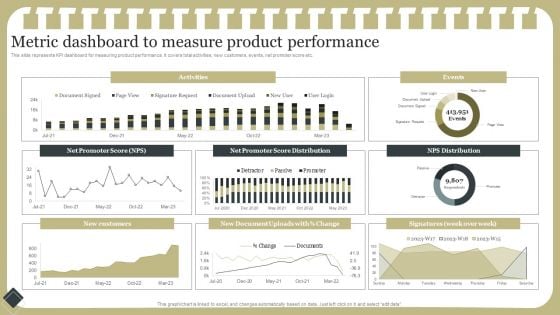
Effective Product Development Strategy Metric Dashboard To Measure Product Performance Information PDF
This slide represents KPI dashboard for measuring product performance. It covers total activities, new customers, events, net promoter score etc.Coming up with a presentation necessitates that the majority of the effort goes into the content and the message you intend to convey. The visuals of a PowerPoint presentation can only be effective if it supplements and supports the story that is being told. Keeping this in mind our experts created Effective Product Development Strategy Metric Dashboard To Measure Product Performance Information PDF to reduce the time that goes into designing the presentation. This way, you can concentrate on the message while our designers take care of providing you with the right template for the situation.
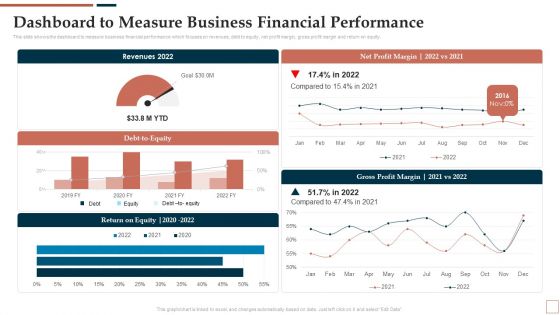
BPR To Develop Operational Effectiveness Dashboard To Measure Business Financial Performance Elements PDF
This slide shows the dashboard to measure business financial performance which focuses on revenues, debt to equity, net profit margin, gross profit margin and return on equity. Coming up with a presentation necessitates that the majority of the effort goes into the content and the message you intend to convey. The visuals of a PowerPoint presentation can only be effective if it supplements and supports the story that is being told. Keeping this in mind our experts created BPR To Develop Operational Effectiveness Dashboard To Measure Business Financial Performance Elements PDF to reduce the time that goes into designing the presentation. This way, you can concentrate on the message while our designers take care of providing you with the right template for the situation.
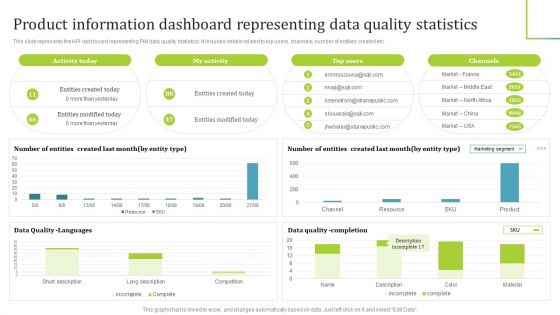
PIM Software Deployment To Enhance Conversion Rates Product Information Dashboard Representing Data Quality Statistics Download PDF
This slide represents the KPI dashboard representing PIM data quality statistics. It includes details related to top users, channels, number of entities created etc. Coming up with a presentation necessitates that the majority of the effort goes into the content and the message you intend to convey. The visuals of a PowerPoint presentation can only be effective if it supplements and supports the story that is being told. Keeping this in mind our experts created PIM Software Deployment To Enhance Conversion Rates Product Information Dashboard Representing Data Quality Statistics Download PDF to reduce the time that goes into designing the presentation. This way, you can concentrate on the message while our designers take care of providing you with the right template for the situation.
Elastic NLB Network Load Balancers Performance Tracker Dashboard Background PDF
This slide shows the dashboard for tracking the network load balancers performance by covering details of balancer status, balancer session, balancer throughput, etc. Coming up with a presentation necessitates that the majority of the effort goes into the content and the message you intend to convey. The visuals of a PowerPoint presentation can only be effective if it supplements and supports the story that is being told. Keeping this in mind our experts created Elastic NLB Network Load Balancers Performance Tracker Dashboard Background PDF to reduce the time that goes into designing the presentation. This way, you can concentrate on the message while our designers take care of providing you with the right template for the situation.
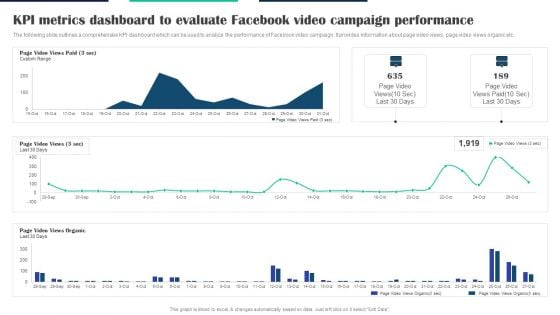
Executing Video Promotional KPI Metrics Dashboard To Evaluate Facebook Video Campaign Summary PDF
The following slide outlines a comprehensive KPI dashboard which can be used to analyze the performance of Facebook video campaign. It provides information about page video views, page video views organic etc. Coming up with a presentation necessitates that the majority of the effort goes into the content and the message you intend to convey. The visuals of a PowerPoint presentation can only be effective if it supplements and supports the story that is being told. Keeping this in mind our experts created Executing Video Promotional KPI Metrics Dashboard To Evaluate Facebook Video Campaign Summary PDF to reduce the time that goes into designing the presentation. This way, you can concentrate on the message while our designers take care of providing you with the right template for the situation.
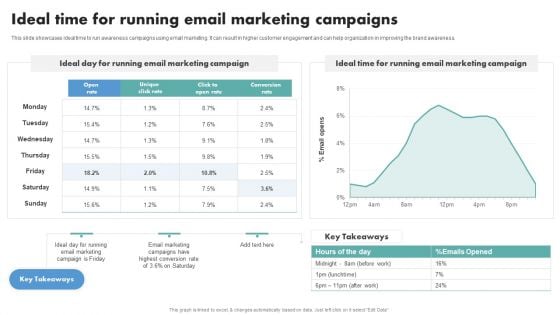
Techniques To Boost Brand Awareness Ideal Time For Running Email Marketing Campaigns Ideas PDF
This slide showcases ideal time to run awareness campaigns using email marketing. It can result in higher customer engagement and can help organization in improving the brand awareness. Coming up with a presentation necessitates that the majority of the effort goes into the content and the message you intend to convey. The visuals of a PowerPoint presentation can only be effective if it supplements and supports the story that is being told. Keeping this in mind our experts created Techniques To Boost Brand Awareness Ideal Time For Running Email Marketing Campaigns Ideas PDF to reduce the time that goes into designing the presentation. This way, you can concentrate on the message while our designers take care of providing you with the right template for the situation.
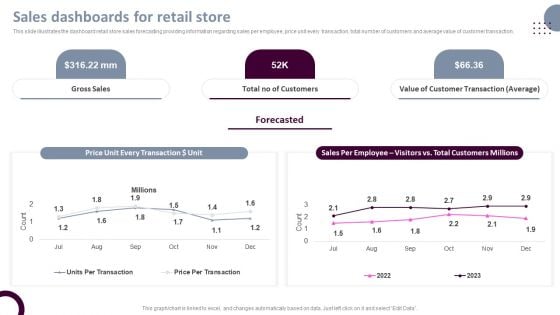
Retail Store Operations Sales Dashboards For Retail Store Structure PDF
This slide illustrates the dashboard retail store sales forecasting providing information regarding sales per employee, price unit every transaction, total number of customers and average value of customer transaction. Coming up with a presentation necessitates that the majority of the effort goes into the content and the message you intend to convey. The visuals of a PowerPoint presentation can only be effective if it supplements and supports the story that is being told. Keeping this in mind our experts created Retail Store Operations Sales Dashboards For Retail Store Structure PDF to reduce the time that goes into designing the presentation. This way, you can concentrate on the message while our designers take care of providing you with the right template for the situation.
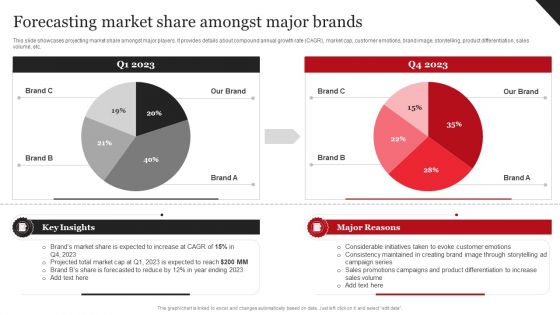
Coca Cola Emotional Marketing Strategy Forecasting Market Share Amongst Major Brands Pictures PDF
This slide showcases projecting market share amongst major players. It provides details about compound annual growth rate CAGR, market cap, customer emotions, brand image, storytelling, product differentiation, sales volume, etc. Coming up with a presentation necessitates that the majority of the effort goes into the content and the message you intend to convey. The visuals of a PowerPoint presentation can only be effective if it supplements and supports the story that is being told. Keeping this in mind our experts created Coca Cola Emotional Marketing Strategy Forecasting Market Share Amongst Major Brands Pictures PDF to reduce the time that goes into designing the presentation. This way, you can concentrate on the message while our designers take care of providing you with the right template for the situation.
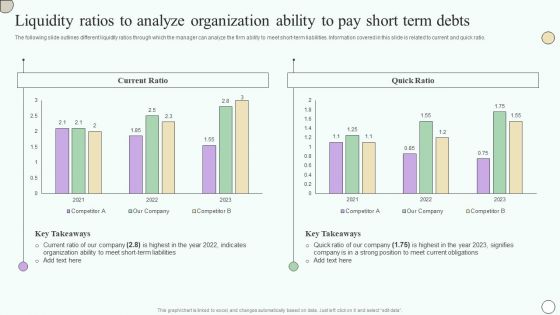
Estimating Business Overall Liquidity Ratios To Analyze Organization Ability To Pay Short Introduction PDF
The following slide outlines different liquidity ratios through which the manager can analyze the firm ability to meet short-term liabilities. Information covered in this slide is related to current and quick ratio. Coming up with a presentation necessitates that the majority of the effort goes into the content and the message you intend to convey. The visuals of a PowerPoint presentation can only be effective if it supplements and supports the story that is being told. Keeping this in mind our experts created Estimating Business Overall Liquidity Ratios To Analyze Organization Ability To Pay Short Introduction PDF to reduce the time that goes into designing the presentation. This way, you can concentrate on the message while our designers take care of providing you with the right template for the situation.
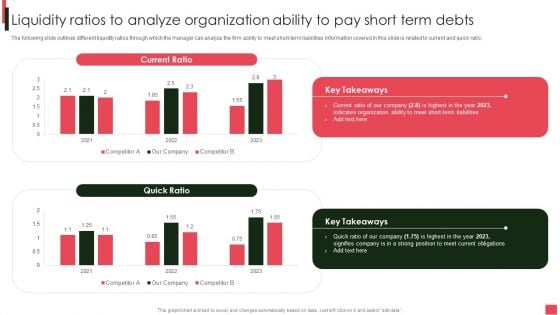
Overview Of Organizational Liquidity Ratios To Analyze Organization Ability To Pay Short Summary PDF
The following slide outlines different liquidity ratios through which the manager can analyze the firm ability to meet short-term liabilities. Information covered in this slide is related to current and quick ratio. Coming up with a presentation necessitates that the majority of the effort goes into the content and the message you intend to convey. The visuals of a PowerPoint presentation can only be effective if it supplements and supports the story that is being told. Keeping this in mind our experts created Overview Of Organizational Liquidity Ratios To Analyze Organization Ability To Pay Short Summary PDF to reduce the time that goes into designing the presentation. This way, you can concentrate on the message while our designers take care of providing you with the right template for the situation.
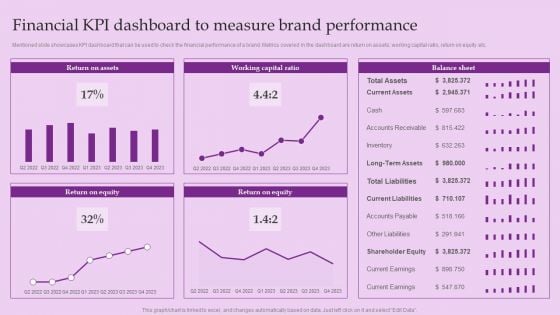
Financial KPI Dashboard To Measure Brand Performance Brand And Equity Evaluation Techniques Elements PDF
Mentioned slide showcases KPI dashboard that can be used to check the financial performance of a brand. Metrics covered in the dashboard are return on assets, working capital ratio, return on equity etc.Coming up with a presentation necessitates that the majority of the effort goes into the content and the message you intend to convey. The visuals of a PowerPoint presentation can only be effective if it supplements and supports the story that is being told. Keeping this in mind our experts created Financial KPI Dashboard To Measure Brand Performance Brand And Equity Evaluation Techniques Elements PDF to reduce the time that goes into designing the presentation. This way, you can concentrate on the message while our designers take care of providing you with the right template for the situation.
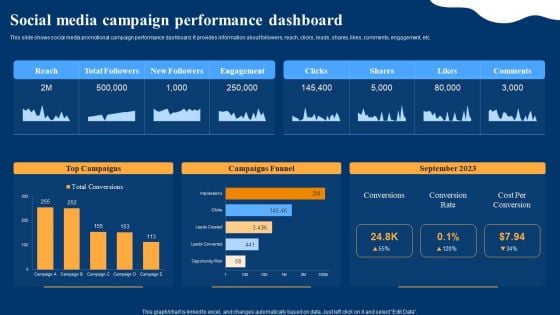
Optimizing Social Networks Social Media Campaign Performance Dashboard Guidelines PDF
This slide shows social media promotional campaign performance dashboard. It provides information about followers, reach, clicks, leads, shares, likes, comments, engagement, etc. Coming up with a presentation necessitates that the majority of the effort goes into the content and the message you intend to convey. The visuals of a PowerPoint presentation can only be effective if it supplements and supports the story that is being told. Keeping this in mind our experts created Optimizing Social Networks Social Media Campaign Performance Dashboard Guidelines PDF to reduce the time that goes into designing the presentation. This way, you can concentrate on the message while our designers take care of providing you with the right template for the situation.
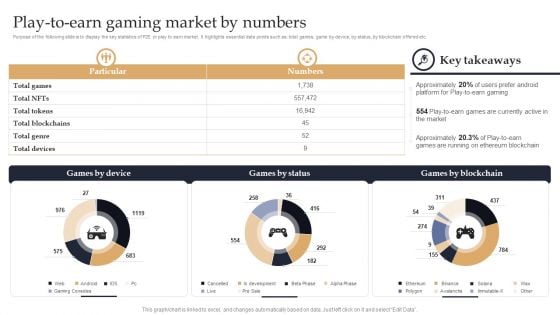
Web 3 0 Blockchain Based P2E Mobile Game Sector Report Promotional Plan Play To Earn Gaming Market By Numbers Summary PDF
Purpose of the following slide is to display the key statistics of P2E or play to earn market. It highlights essential data points such as total games, game by device, by status, by blockchain offered etc. Coming up with a presentation necessitates that the majority of the effort goes into the content and the message you intend to convey. The visuals of a PowerPoint presentation can only be effective if it supplements and supports the story that is being told. Keeping this in mind our experts created Web 3 0 Blockchain Based P2E Mobile Game Sector Report Promotional Plan Play To Earn Gaming Market By Numbers Summary PDF to reduce the time that goes into designing the presentation. This way, you can concentrate on the message while our designers take care of providing you with the right template for the situation.
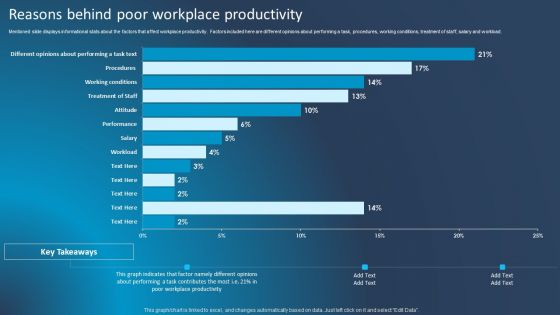
Improving Corporate Performance Reasons Behind Poor Workplace Productivity Designs PDF
Mentioned slide displays informational stats about the factors that affect workplace productivity. Factors included here are different opinions about performing a task, procedures, working conditions, treatment of staff, salary and workload. Coming up with a presentation necessitates that the majority of the effort goes into the content and the message you intend to convey. The visuals of a PowerPoint presentation can only be effective if it supplements and supports the story that is being told. Keeping this in mind our experts created Improving Corporate Performance Reasons Behind Poor Workplace Productivity Designs PDF to reduce the time that goes into designing the presentation. This way, you can concentrate on the message while our designers take care of providing you with the right template for the situation.
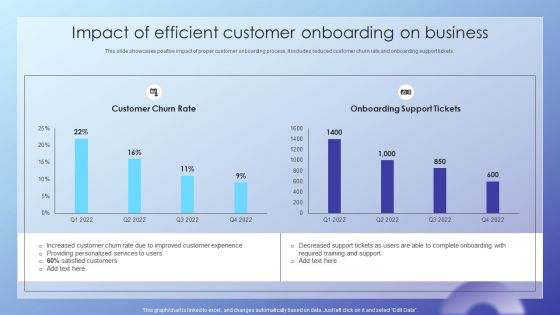
Client Acquisition Journey Plan Impact Of Efficient Customer Onboarding Template PDF
This slide showcases positive impact of proper customer onboarding process. It includes reduced customer churn rate and onboarding support tickets. Coming up with a presentation necessitates that the majority of the effort goes into the content and the message you intend to convey. The visuals of a PowerPoint presentation can only be effective if it supplements and supports the story that is being told. Keeping this in mind our experts created Client Acquisition Journey Plan Impact Of Efficient Customer Onboarding Template PDF to reduce the time that goes into designing the presentation. This way, you can concentrate on the message while our designers take care of providing you with the right template for the situation.
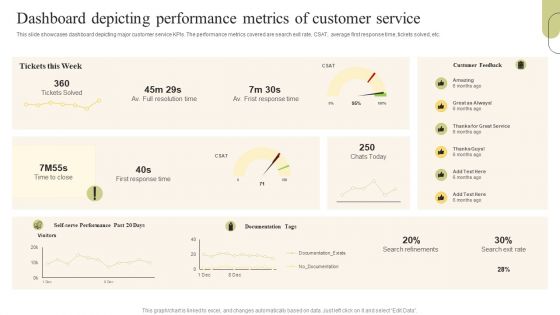
Customer Support Services Dashboard Depicting Performance Metrics Of Customer Designs PDF
This slide showcases dashboard depicting major customer service KPIs. The performance metrics covered are search exit rate, CSAT, average first response time, tickets solved, etc. Coming up with a presentation necessitates that the majority of the effort goes into the content and the message you intend to convey. The visuals of a PowerPoint presentation can only be effective if it supplements and supports the story that is being told. Keeping this in mind our experts created Customer Support Services Dashboard Depicting Performance Metrics Of Customer Designs PDF to reduce the time that goes into designing the presentation. This way, you can concentrate on the message while our designers take care of providing you with the right template for the situation.
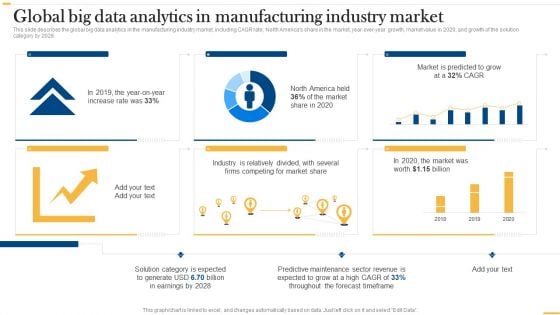
Deploying AI To Enhance Global Big Data Analytics In Manufacturing Industry Market Professional PDF
This slide describes the global big data analytics in the manufacturing industry market, including CAGR rate, North Americas share in the market, year-over-year growth, market value in 2020, and growth of the solution category by 2028. Coming up with a presentation necessitates that the majority of the effort goes into the content and the message you intend to convey. The visuals of a PowerPoint presentation can only be effective if it supplements and supports the story that is being told. Keeping this in mind our experts created Deploying AI To Enhance Global Big Data Analytics In Manufacturing Industry Market Professional PDF to reduce the time that goes into designing the presentation. This way, you can concentrate on the message while our designers take care of providing you with the right template for the situation.
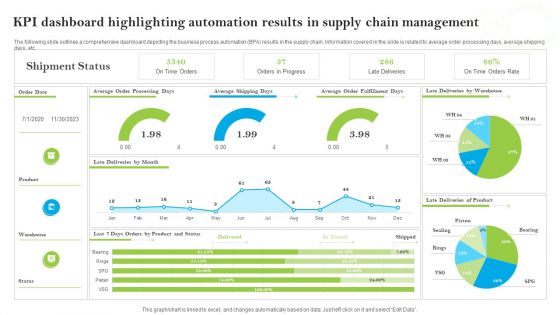
Introducing AI Tools KPI Dashboard Highlighting Automation Results In Supply Chain Portrait PDF
The following slide outlines a comprehensive dashboard depicting the business process automation BPA results in the supply chain. Information covered in the slide is related to average order processing days, average shipping days, etc. Coming up with a presentation necessitates that the majority of the effort goes into the content and the message you intend to convey. The visuals of a PowerPoint presentation can only be effective if it supplements and supports the story that is being told. Keeping this in mind our experts created Introducing AI Tools KPI Dashboard Highlighting Automation Results In Supply Chain Portrait PDF to reduce the time that goes into designing the presentation. This way, you can concentrate on the message while our designers take care of providing you with the right template for the situation.
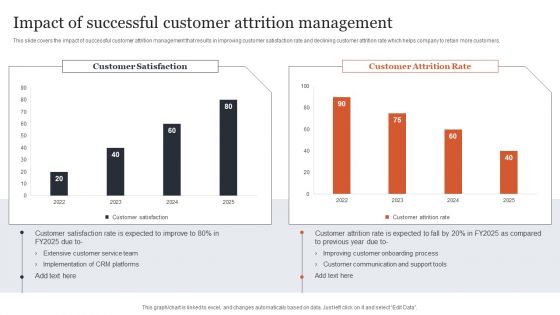
CRM Administration To Reduce Churn Rate Impact Of Successful Customer Attrition Management Sample PDF
This slide covers the impact of successful customer attrition management that results in improving customer satisfaction rate and declining customer attrition rate which helps company to retain more customers. Coming up with a presentation necessitates that the majority of the effort goes into the content and the message you intend to convey. The visuals of a PowerPoint presentation can only be effective if it supplements and supports the story that is being told. Keeping this in mind our experts created CRM Administration To Reduce Churn Rate Impact Of Successful Customer Attrition Management Sample PDF to reduce the time that goes into designing the presentation. This way, you can concentrate on the message while our designers take care of providing you with the right template for the situation.
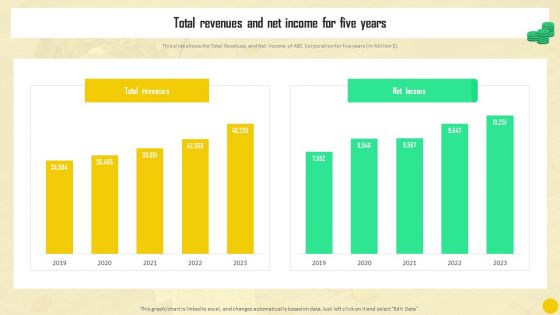
Financial Reporting To Analyze Total Revenues And Net Income For Five Years Guidelines PDF
This slide shows the Total Revenues and Net Income of ABC Corporation for five years in Million dollar Coming up with a presentation necessitates that the majority of the effort goes into the content and the message you intend to convey. The visuals of a PowerPoint presentation can only be effective if it supplements and supports the story that is being told. Keeping this in mind our experts created Financial Reporting To Analyze Total Revenues And Net Income For Five Years Guidelines PDF to reduce the time that goes into designing the presentation. This way, you can concentrate on the message while our designers take care of providing you with the right template for the situation.
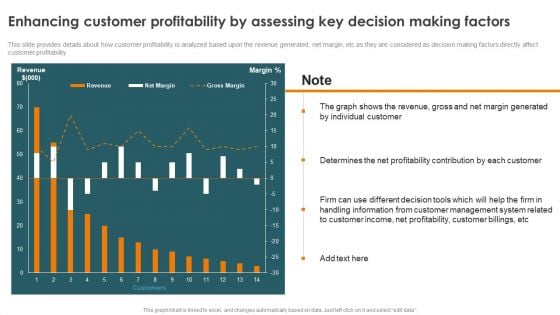
Profitability Modelling Framework Enhancing Customer Profitability By Assessing Key Sample PDF
This slide provides details about how customer profitability is analyzed based upon the revenue generated, net margin, etc as they are considered as decision making factors directly affect customer profitability. Coming up with a presentation necessitates that the majority of the effort goes into the content and the message you intend to convey. The visuals of a PowerPoint presentation can only be effective if it supplements and supports the story that is being told. Keeping this in mind our experts created Profitability Modelling Framework Enhancing Customer Profitability By Assessing Key Sample PDF to reduce the time that goes into designing the presentation. This way, you can concentrate on the message while our designers take care of providing you with the right template for the situation.
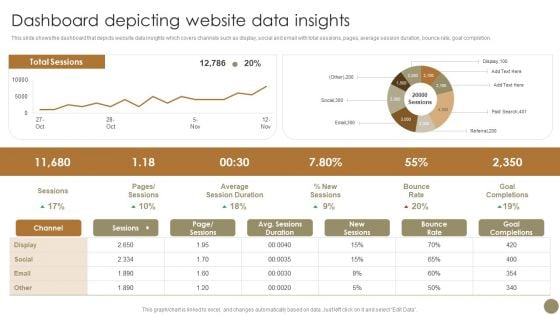
Echniques To Enhance Brand Dashboard Depicting Website Data Insights Clipart PDF
This slide shows the dashboard that depicts website data insights which covers channels such as display, social and email with total sessions, pages, average session duration, bounce rate, goal completion. Coming up with a presentation necessitates that the majority of the effort goes into the content and the message you intend to convey. The visuals of a PowerPoint presentation can only be effective if it supplements and supports the story that is being told. Keeping this in mind our experts created Echniques To Enhance Brand Dashboard Depicting Website Data Insights Clipart PDF to reduce the time that goes into designing the presentation. This way, you can concentrate on the message while our designers take care of providing you with the right template for the situation.
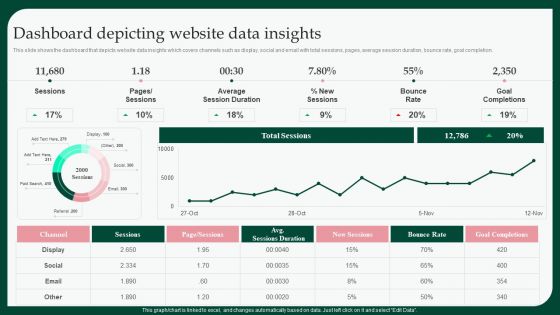
Boosting Product Sales Through Branding Dashboard Depicting Website Data Brochure PDF
This slide shows the dashboard that depicts website data insights which covers channels such as display, social and email with total sessions, pages, average session duration, bounce rate, goal completion. Coming up with a presentation necessitates that the majority of the effort goes into the content and the message you intend to convey. The visuals of a PowerPoint presentation can only be effective if it supplements and supports the story that is being told. Keeping this in mind our experts created Boosting Product Sales Through Branding Dashboard Depicting Website Data Brochure PDF to reduce the time that goes into designing the presentation. This way, you can concentrate on the message while our designers take care of providing you with the right template for the situation.
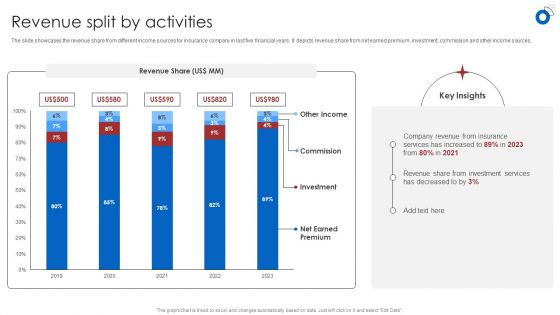
Insurance Business Financial Analysis Revenue Split By Activities Ppt Infographic Template Design Inspiration PDF
The slide showcases the revenue share from different income sources for insurance company in last five financial years. It depicts revenue share from net earned premium, investment, commission and other income sources. Coming up with a presentation necessitates that the majority of the effort goes into the content and the message you intend to convey. The visuals of a PowerPoint presentation can only be effective if it supplements and supports the story that is being told. Keeping this in mind our experts created Insurance Business Financial Analysis Revenue Split By Activities Ppt Infographic Template Design Inspiration PDF to reduce the time that goes into designing the presentation. This way, you can concentrate on the message while our designers take care of providing you with the right template for the situation.
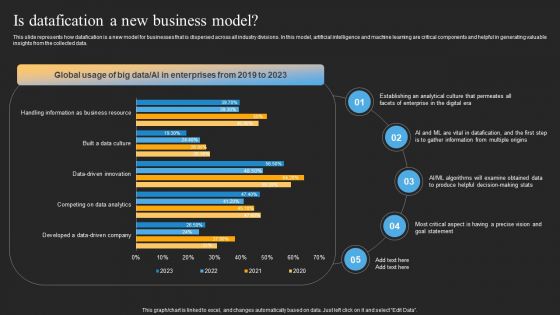
Datafy Is Datafication A New Business Model Rules PDF
This slide represents how datafication is a new model for businesses that is dispersed across all industry divisions. In this model, artificial intelligence and machine learning are critical components and helpful in generating valuable insights from the collected data. Coming up with a presentation necessitates that the majority of the effort goes into the content and the message you intend to convey. The visuals of a PowerPoint presentation can only be effective if it supplements and supports the story that is being told. Keeping this in mind our experts created Datafy Is Datafication A New Business Model Rules PDF to reduce the time that goes into designing the presentation. This way, you can concentrate on the message while our designers take care of providing you with the right template for the situation.
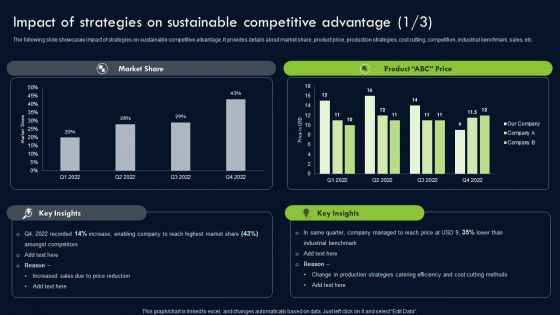
Transforming Sustainability Into Competitive Impact Of Strategies On Sustainable Slides PDF
The following slide showcases impact of strategies on sustainable competitive advantage. It provides details about market share, product price, production strategies, cost cutting, competition, industrial benchmark, sales, etc. Coming up with a presentation necessitates that the majority of the effort goes into the content and the message you intend to convey. The visuals of a PowerPoint presentation can only be effective if it supplements and supports the story that is being told. Keeping this in mind our experts created Transforming Sustainability Into Competitive Impact Of Strategies On Sustainable Slides PDF to reduce the time that goes into designing the presentation. This way, you can concentrate on the message while our designers take care of providing you with the right template for the situation.
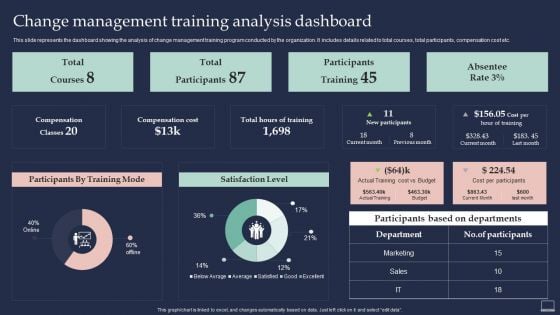
Training Program For Implementing Change Management Training Analysis Dashboard Information PDF
This slide represents the dashboard showing the analysis of change management training program conducted by the organization. It includes details related to total courses, total participants, compensation cost etc. Coming up with a presentation necessitates that the majority of the effort goes into the content and the message you intend to convey. The visuals of a PowerPoint presentation can only be effective if it supplements and supports the story that is being told. Keeping this in mind our experts created Training Program For Implementing Change Management Training Analysis Dashboard Information PDF to reduce the time that goes into designing the presentation. This way, you can concentrate on the message while our designers take care of providing you with the right template for the situation.
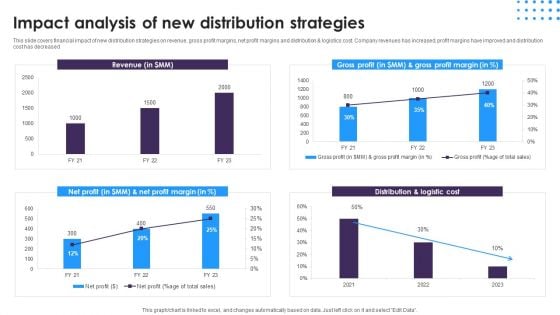
Omnichannel Distribution System To Satisfy Customer Needs Impact Analysis Of New Distribution Strategies Ideas PDF
This slide covers financial impact of new distribution strategies on revenue, gross profit margins, net profit margins and distribution and logistics cost. Company revenues has increased, profit margins have improved and distribution cost has decreased. Coming up with a presentation necessitates that the majority of the effort goes into the content and the message you intend to convey. The visuals of a PowerPoint presentation can only be effective if it supplements and supports the story that is being told. Keeping this in mind our experts created Omnichannel Distribution System To Satisfy Customer Needs Impact Analysis Of New Distribution Strategies Ideas PDF to reduce the time that goes into designing the presentation. This way, you can concentrate on the message while our designers take care of providing you with the right template for the situation.
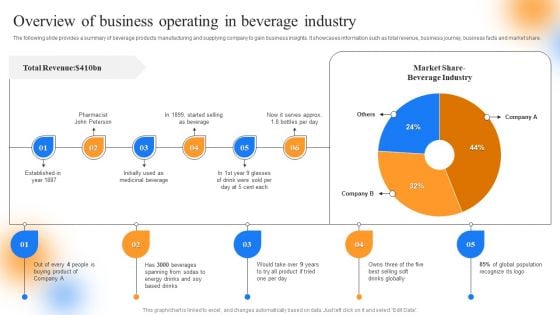
Strategic Guide To Perform Marketing Overview Of Business Operating In Beverage Industry Designs PDF
The following slide provides a summary of beverage products manufacturing and supplying company to gain business insights. It showcases information such as total revenue, business journey, business facts and market share. Coming up with a presentation necessitates that the majority of the effort goes into the content and the message you intend to convey. The visuals of a PowerPoint presentation can only be effective if it supplements and supports the story that is being told. Keeping this in mind our experts created Strategic Guide To Perform Marketing Overview Of Business Operating In Beverage Industry Designs PDF to reduce the time that goes into designing the presentation. This way, you can concentrate on the message while our designers take care of providing you with the right template for the situation.
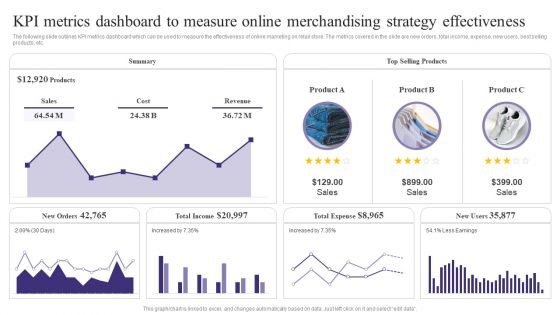
KPI Metrics Dashboard To Measure Online Merchandising Strategy Effectiveness Sample PDF
The following slide outlines KPI metrics dashboard which can be used to measure the effectiveness of online marketing on retail store. The metrics covered in the slide are new orders, total income, expense, new users, best selling products, etc. Coming up with a presentation necessitates that the majority of the effort goes into the content and the message you intend to convey. The visuals of a PowerPoint presentation can only be effective if it supplements and supports the story that is being told. Keeping this in mind our experts created KPI Metrics Dashboard To Measure Online Merchandising Strategy Effectiveness Sample PDF to reduce the time that goes into designing the presentation. This way, you can concentrate on the message while our designers take care of providing you with the right template for the situation.
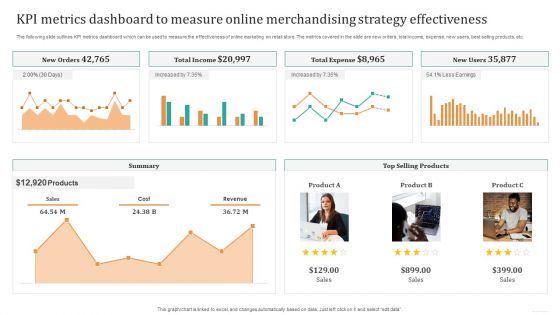
KPI Metrics Dashboard To Measure Online Merchandising Strategy Effectiveness Pictures PDF
The following slide outlines KPI metrics dashboard which can be used to measure the effectiveness of online marketing on retail store. The metrics covered in the slide are new orders, total income, expense, new users, best selling products, etc. Coming up with a presentation necessitates that the majority of the effort goes into the content and the message you intend to convey. The visuals of a PowerPoint presentation can only be effective if it supplements and supports the story that is being told. Keeping this in mind our experts created KPI Metrics Dashboard To Measure Online Merchandising Strategy Effectiveness Pictures PDF to reduce the time that goes into designing the presentation. This way, you can concentrate on the message while our designers take care of providing you with the right template for the situation.
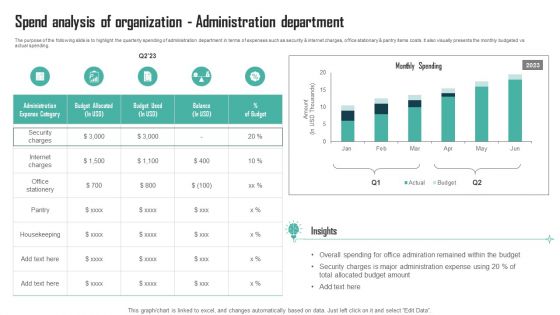
Expenses Management Plan Spend Analysis Of Organization Administration Department Professional PDF
The purpose of the following slide is to highlight the quarterly spending of administration department in terms of expenses such as security and internet charges, office stationary and pantry items costs. It also visually presents the monthly budgeted vs actual spending. Coming up with a presentation necessitates that the majority of the effort goes into the content and the message you intend to convey. The visuals of a PowerPoint presentation can only be effective if it supplements and supports the story that is being told. Keeping this in mind our experts created Expenses Management Plan Spend Analysis Of Organization Administration Department Professional PDF to reduce the time that goes into designing the presentation. This way, you can concentrate on the message while our designers take care of providing you with the right template for the situation.
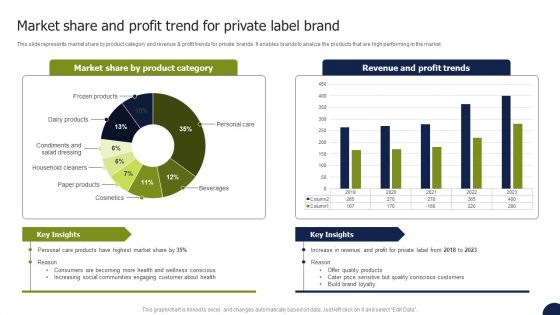
Private Labelling Strategies To Gain Market Share And Profit Trend For Private Label Brand Sample PDF
This slide represents market share by product category and revenue and profit trends for private brands. It enables brands to analyze the products that are high performing in the market. Coming up with a presentation necessitates that the majority of the effort goes into the content and the message you intend to convey. The visuals of a PowerPoint presentation can only be effective if it supplements and supports the story that is being told. Keeping this in mind our experts created Private Labelling Strategies To Gain Market Share And Profit Trend For Private Label Brand Sample PDF to reduce the time that goes into designing the presentation. This way, you can concentrate on the message while our designers take care of providing you with the right template for the situation.
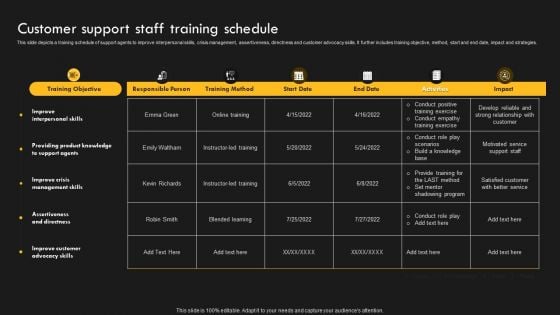
Service Improvement Techniques For Client Retention Customer Support Staff Training Schedule Clipart PDF
This slide showcases dashboard depicting major customer service KPIs. The performance metrics covered are search exit rate, CSAT, average first response time, tickets solved, etc. Coming up with a presentation necessitates that the majority of the effort goes into the content and the message you intend to convey. The visuals of a PowerPoint presentation can only be effective if it supplements and supports the story that is being told. Keeping this in mind our experts created Service Improvement Techniques For Client Retention Customer Support Staff Training Schedule Clipart PDF to reduce the time that goes into designing the presentation. This way, you can concentrate on the message while our designers take care of providing you with the right template for the situation.
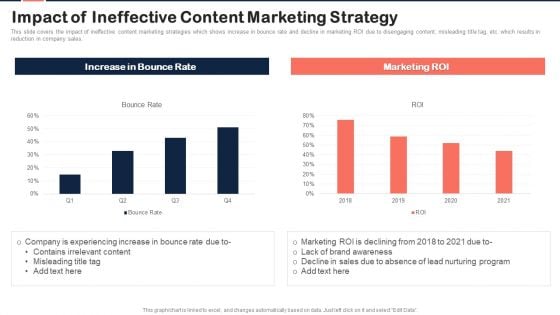
Implementing Content Marketing Plan To Nurture Leads Impact Of Ineffective Content Marketing Demonstration PDF
This slide covers the impact of ineffective content marketing strategies which shows increase in bounce rate and decline in marketing ROI due to disengaging content, misleading title tag, etc. which results in reduction in company sales. Coming up with a presentation necessitates that the majority of the effort goes into the content and the message you intend to convey. The visuals of a PowerPoint presentation can only be effective if it supplements and supports the story that is being told. Keeping this in mind our experts created Implementing Content Marketing Plan To Nurture Leads Impact Of Ineffective Content Marketing Demonstration PDF to reduce the time that goes into designing the presentation. This way, you can concentrate on the message while our designers take care of providing you with the right template for the situation.
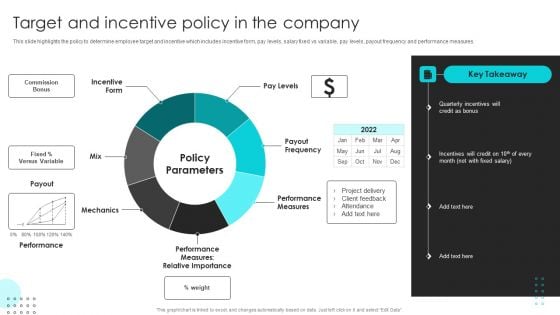
Company Rules And Regulations Manual Target And Incentive Policy In The Company Download PDF
This slide highlights the policy to determine employee target and incentive which includes incentive form, pay levels, salary fixed vs variable, pay levels, payout frequency and performance measures. Coming up with a presentation necessitates that the majority of the effort goes into the content and the message you intend to convey. The visuals of a PowerPoint presentation can only be effective if it supplements and supports the story that is being told. Keeping this in mind our experts created Company Rules And Regulations Manual Target And Incentive Policy In The Company Download PDF to reduce the time that goes into designing the presentation. This way, you can concentrate on the message while our designers take care of providing you with the right template for the situation.
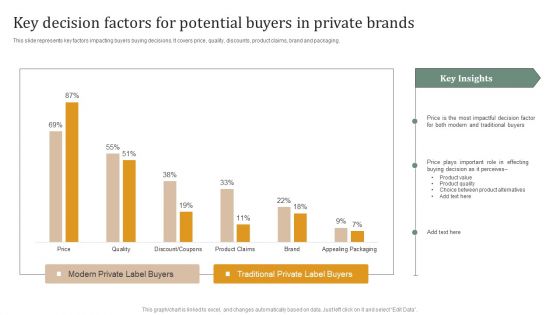
Executing Private Label Key Decision Factors For Potential Buyers In Private Brands Brochure PDF
This slide represents key factors impacting buyers buying decisions. It covers price, quality, discounts, product claims, brand and packaging. Coming up with a presentation necessitates that the majority of the effort goes into the content and the message you intend to convey. The visuals of a PowerPoint presentation can only be effective if it supplements and supports the story that is being told. Keeping this in mind our experts created Executing Private Label Key Decision Factors For Potential Buyers In Private Brands Brochure PDF to reduce the time that goes into designing the presentation. This way, you can concentrate on the message while our designers take care of providing you with the right template for the situation.
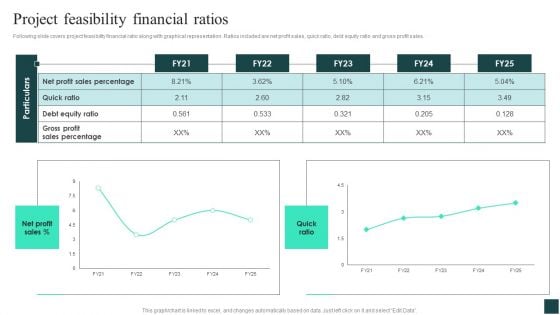
Project Feasibility Financial Ratios Credibility Assessment Summary For Construction Project Rules PDF
Following slide covers project feasibility financial ratio along with graphical representation. Ratios included are net profit sales, quick ratio, debt equity ratio and gross profit sales. Coming up with a presentation necessitates that the majority of the effort goes into the content and the message you intend to convey. The visuals of a PowerPoint presentation can only be effective if it supplements and supports the story that is being told. Keeping this in mind our experts created Project Feasibility Financial Ratios Credibility Assessment Summary For Construction Project Rules PDF to reduce the time that goes into designing the presentation. This way, you can concentrate on the message while our designers take care of providing you with the right template for the situation.
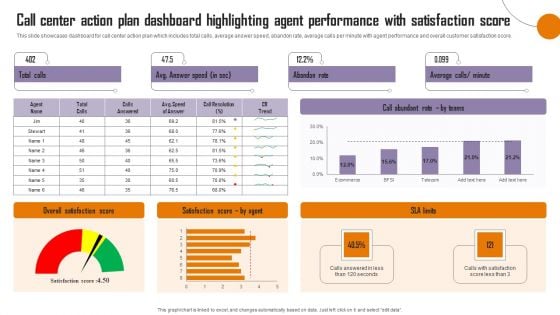
Call Center Action Plan Dashboard Strategies To Enhance Call Center Management Brochure PDF
This slide showcases dashboard for call center action plan which includes total calls, average answer speed, abandon rate, average calls per minute with agent performance and overall customer satisfaction score. Coming up with a presentation necessitates that the majority of the effort goes into the content and the message you intend to convey. The visuals of a PowerPoint presentation can only be effective if it supplements and supports the story that is being told. Keeping this in mind our experts created Call Center Action Plan Dashboard Strategies To Enhance Call Center Management Brochure PDF to reduce the time that goes into designing the presentation. This way, you can concentrate on the message while our designers take care of providing you with the right template for the situation.
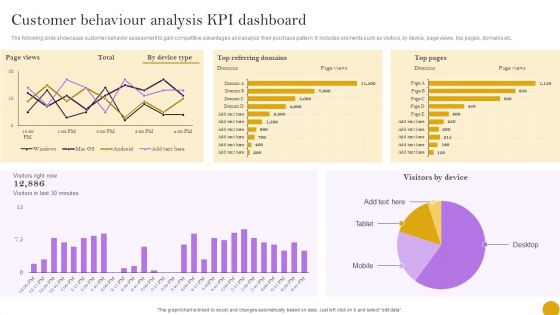
Comprehensive Customer Data Platform Guide Optimizing Promotional Initiatives Customer Behaviour Analysis KPI Brochure PDF
The following slide showcases customer behavior assessment to gain competitive advantages and analyze their purchase pattern. It includes elements such as visitors, by device, page views, top pages, domains etc. Coming up with a presentation necessitates that the majority of the effort goes into the content and the message you intend to convey. The visuals of a PowerPoint presentation can only be effective if it supplements and supports the story that is being told. Keeping this in mind our experts created Comprehensive Customer Data Platform Guide Optimizing Promotional Initiatives Customer Behaviour Analysis KPI Brochure PDF to reduce the time that goes into designing the presentation. This way, you can concentrate on the message while our designers take care of providing you with the right template for the situation.
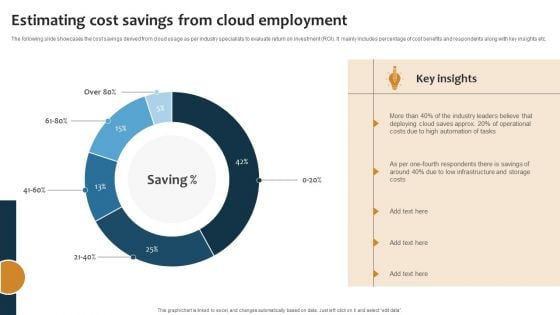
Improving Business Procedures Enterprise Resource Planning System Estimating Cost Savings From Cloud Formats PDF
The following slide showcases the cost savings derived from cloud usage as per industry specialists to evaluate return on investment ROI. It mainly includes percentage of cost benefits and respondents along with key insights etc. Coming up with a presentation necessitates that the majority of the effort goes into the content and the message you intend to convey. The visuals of a PowerPoint presentation can only be effective if it supplements and supports the story that is being told. Keeping this in mind our experts created Improving Business Procedures Enterprise Resource Planning System Estimating Cost Savings From Cloud Formats PDF to reduce the time that goes into designing the presentation. This way, you can concentrate on the message while our designers take care of providing you with the right template for the situation.
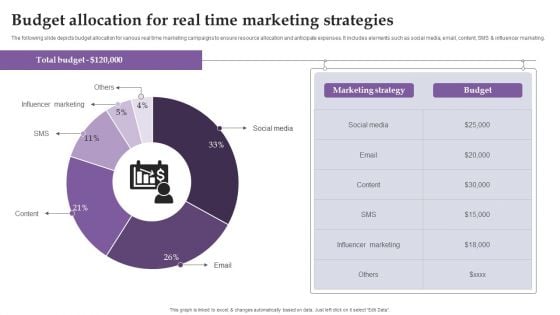
Budget Allocation For Real Time Marketing Strategies Ppt Pictures Graphics Template PDF
The following slide depicts budget allocation for various real time marketing campaigns to ensure resource allocation and anticipate expenses. It includes elements such as social media, email, content, SMS AND influencer marketing. Coming up with a presentation necessitates that the majority of the effort goes into the content and the message you intend to convey. The visuals of a PowerPoint presentation can only be effective if it supplements and supports the story that is being told. Keeping this in mind our experts created Budget Allocation For Real Time Marketing Strategies Ppt Pictures Graphics Template PDF to reduce the time that goes into designing the presentation. This way, you can concentrate on the message while our designers take care of providing you with the right template for the situation.
Marketers Guide To Data Analysis Optimization Dashboard For Tracking Business Blog Kpis Infographics PDF
This slide covers the dashboard for analyzing blogging KPIs such as performance, published posts, views, new blog subscribers, top blog posts by pageviews, top blog posts by CTR, etc. Coming up with a presentation necessitates that the majority of the effort goes into the content and the message you intend to convey. The visuals of a PowerPoint presentation can only be effective if it supplements and supports the story that is being told. Keeping this in mind our experts created Marketers Guide To Data Analysis Optimization Dashboard For Tracking Business Blog Kpis Infographics PDF to reduce the time that goes into designing the presentation. This way, you can concentrate on the message while our designers take care of providing you with the right template for the situation.
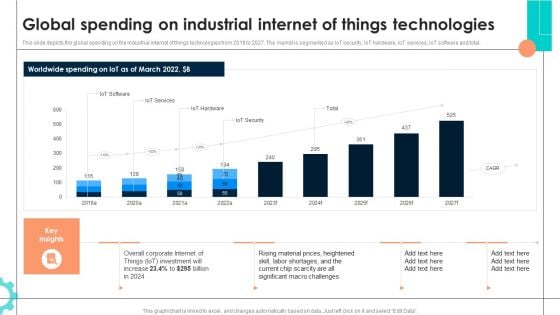
Intelligent Manufacturing Global Spending On Industrial Internet Of Things Technologies Infographics PDF
This slide depicts the global spending on the industrial internet of things technologies from 2019 to 2027. The market is segmented as IoT security, IoT hardware, IoT services, IoT software and total. Coming up with a presentation necessitates that the majority of the effort goes into the content and the message you intend to convey. The visuals of a PowerPoint presentation can only be effective if it supplements and supports the story that is being told. Keeping this in mind our experts created Intelligent Manufacturing Global Spending On Industrial Internet Of Things Technologies Infographics PDF to reduce the time that goes into designing the presentation. This way, you can concentrate on the message while our designers take care of providing you with the right template for the situation.

 Home
Home