Brand Analysis
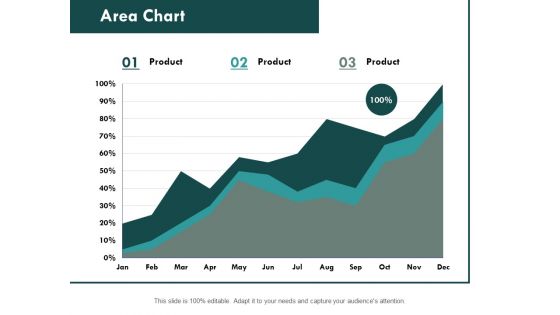
Area Chart Graph Ppt PowerPoint Presentation Professional Format Ideas
This is a column chart graph ppt powerpoint presentation slides file formats. This is a stage three process. The stages in this process are finance, marketing, analysis, investment, million.
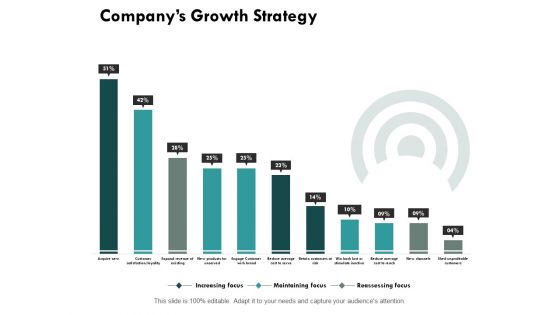
Company Growth Strategy Ppt PowerPoint Presentation Professional Slides
This is a consumer lifecycle icon slide business ppt powerpoint presentation model. This is a three stage process. The stages in this process are finance, marketing, analysis, investment, million.
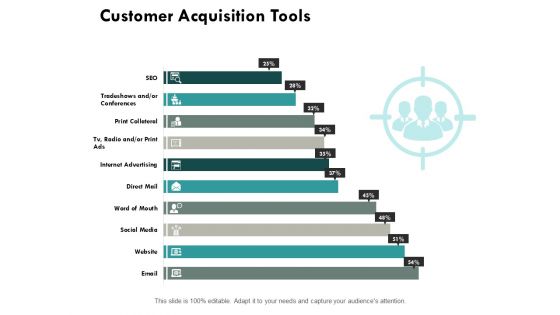
Customer Acquisition Tools Slide Strategy Ppt PowerPoint Presentation Layouts Gallery
This is a customer acquisition tools slide strategy ppt powerpoint presentation layouts gallery. This is a three stage process. The stages in this process are finance, marketing, analysis, investment, million.
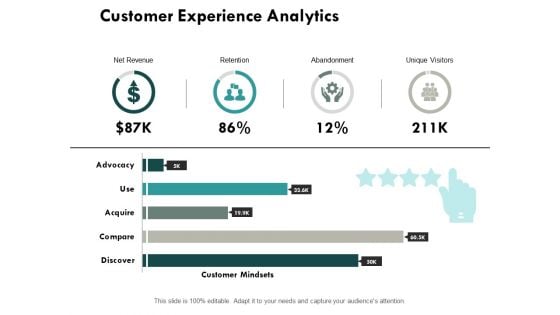
Customer Experience Analytics Ppt PowerPoint Presentation File Infographic Template
This is a customer experience analytics ppt powerpoint presentation file infographic template. This is a four stage process. The stages in this process are finance, marketing, analysis, investment, million.
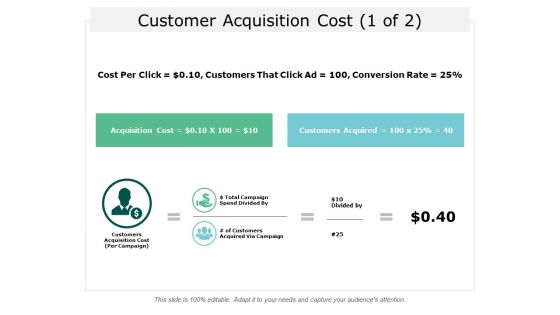
Customer Acquisition Cost Business Ppt Powerpoint Presentation Professional Topics
This is a customer acquisition cost business ppt powerpoint presentation professional topics. This is a two stage process. The stages in this process are financial, marketing, analysis, investment, business.
Customer Acquisition Cost Ppt Powerpoint Presentation Icon Design Templates
This is a customer acquisition cost ppt powerpoint presentation icon design templates. This is a one stage process. The stages in this process are financial, marketing, analysis, investment, business.

Loyalty Program Performance Dashboard Ppt Powerpoint Presentation Gallery Inspiration
This is a loyalty program performance dashboard ppt powerpoint presentation gallery inspiration. This is a six stage process. The stages in this process are finance, marketing, analysis, investment, strategy.
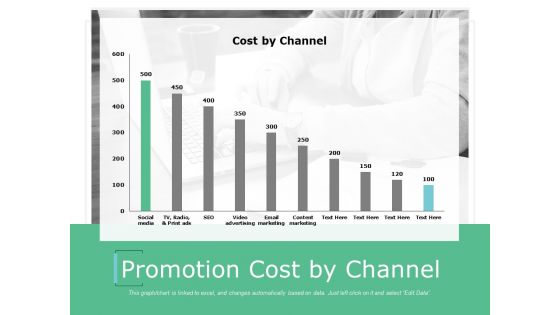
Promotion Cost By Channel Ppt Powerpoint Presentation Outline Smartart
This is a promotion cost by channel ppt powerpoint presentation outline smartart. This is a six stage process. The stages in this process are finance, marketing, analysis, investment, strategy.
Social Media And Word Of Mouth Metrics Ppt Powerpoint Presentation Icon Portfolio
This is a social media and word of mouth metrics ppt powerpoint presentation icon portfolio. This is a ten stage process. The stages in this process are financial, marketing, analysis, investment, business.
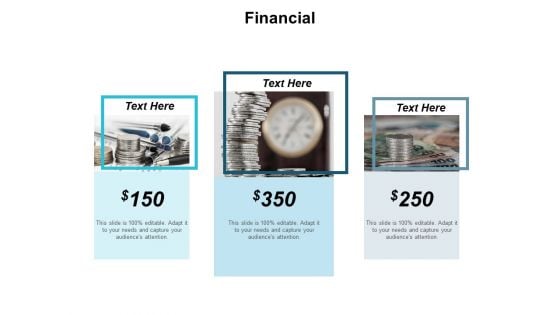
Financial Investment Planning Ppt PowerPoint Presentation Infographic Template Objects
This is a financial investment planning ppt powerpoint presentation infographic template objects. This is a three stage process. The stages in this process are finance, analysis, business, investment, marketing.
Clustered Bar Chart Finance Ppt Powerpoint Presentation Icon Graphics Template
This is a clustered bar chart finance ppt powerpoint presentation icon graphics template. This is a four stage process. The stages in this process are finance, marketing, management, investment, analysis.
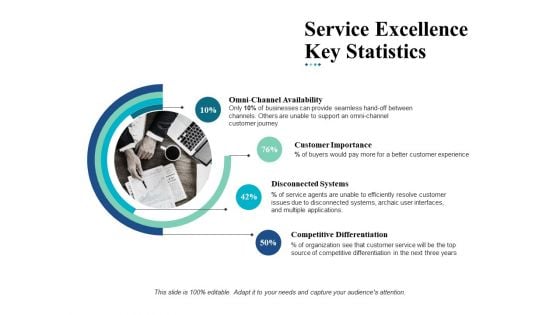
Service Excellence Key Statistics Ppt Powerpoint Presentation Ideas Picture
This is a service excellence key statistics ppt powerpoint presentation ideas picture. This is a four stage process. The stages in this process are finance, marketing, management, investment, analysis.
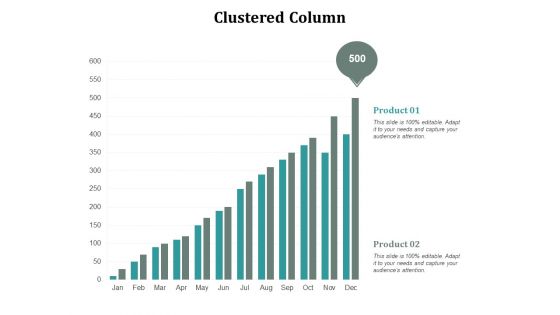
Clustered Column Finance Ppt Powerpoint Presentation Gallery Templates Cpb
This is a clustered column finance ppt powerpoint presentation gallery templates cpb. This is a two stage process. The stages in this process are finance, marketing, management, investment, analysis.
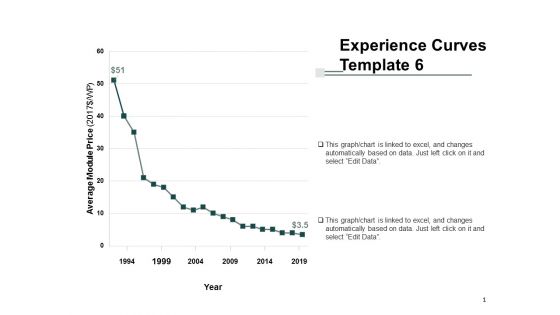
Experience Curves Template Finance Ppt Powerpoint Presentation Gallery Inspiration
This is a experience curves template finance ppt powerpoint presentation gallery inspiration. This is a two stage process. The stages in this process are finance, marketing, management, investment, analysis.
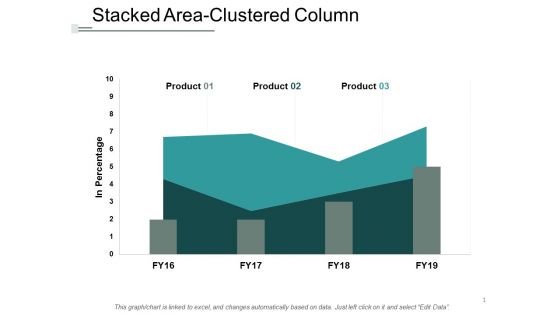
Stacked Area Clustered Column Ppt Powerpoint Presentation Portfolio Graphics Template
This is a stacked area clustered column ppt powerpoint presentation portfolio graphics template. This is a three stage process. The stages in this process are finance, marketing, management, investment, analysis.
Set And Evaluate Goals Ppt PowerPoint Presentation Infographic Template Vector
This is a set and evaluate goals ppt powerpoint presentation infographic template vector. This is a two stage process. The stages in this process are finance, marketing, management, investment, analysis.
Future Trends In Multi Channel Retailing Ppt Powerpoint Presentation Styles Icon
This is a future trends in multi channel retailing ppt powerpoint presentation styles icon. This is a four stage process. The stages in this process are finance, marketing, management, investment, analysis.
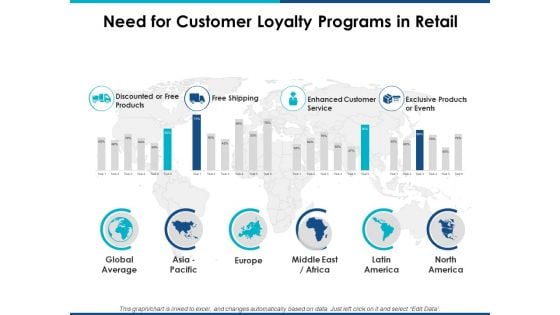
Need For Customer Loyalty Programs In Retail Ppt Powerpoint Presentation Portfolio Grid
This is a need for customer loyalty programs in retail ppt powerpoint presentation portfolio grid. This is a ten stage process. The stages in this process are finance, marketing, management, investment, analysis.
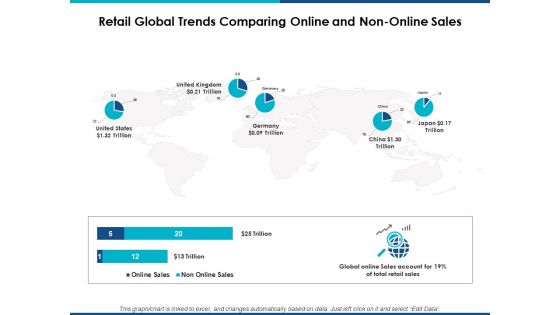
Retail Global Trends Comparing Online And Non Online Sales Ppt Powerpoint Presentation Tips
This is a retail global trends comparing online and non online sales ppt powerpoint presentation tips. This is a five stage process. The stages in this process are finance, marketing, management, investment, analysis.
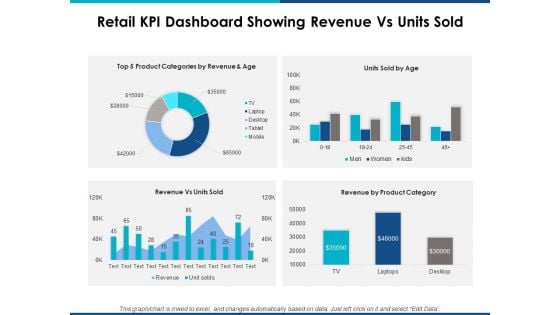
Retail Kpi Dashboard Showing Revenue Vs Units Sold Ppt Powerpoint Presentation Layouts Show
This is a retail kpi dashboard showing revenue vs units sold ppt powerpoint presentation layouts show. This is a four stage process. The stages in this process are finance, marketing, management, investment, analysis.
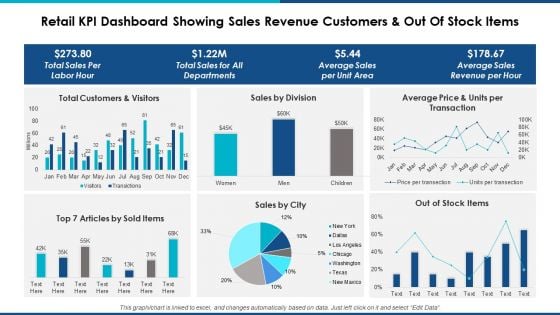
Retail Kpi Dashboard Showing Sales Revenue Customers And Out Of Stock Items Ppt Powerpoint Presentation Professional Background Designs
This is a retail kpi dashboard showing sales revenue customers and out of stock items ppt powerpoint presentation professional background designs. This is a six stage process. The stages in this process are finance, marketing, management, investment, analysis.
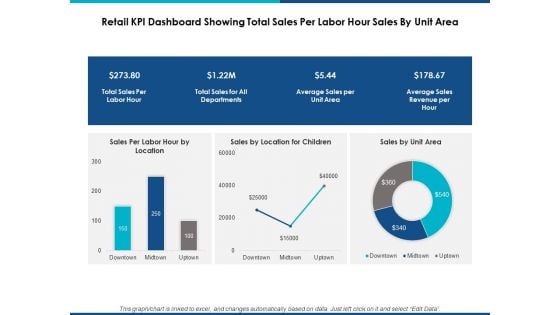
Retail Kpi Dashboard Showing Total Sales Per Labor Hour Sales By Unit Area Ppt Powerpoint Presentation Show Graphic Tips
This is a retail kpi dashboard showing total sales per labor hour sales by unit area ppt powerpoint presentation show graphic tips. This is a three stage process. The stages in this process are finance, marketing, management, investment, analysis.
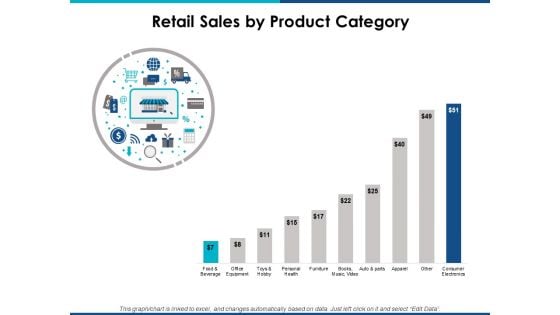
Retail Sales By Product Category Ppt Powerpoint Presentation Layouts Graphics Download
This is a retail sales by product category ppt powerpoint presentation layouts graphics download. This is a ten stage process. The stages in this process are finance, marketing, management, investment, analysis.
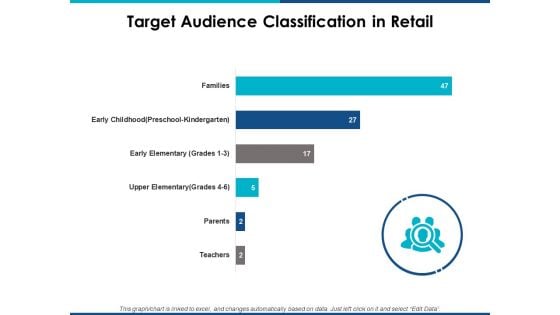
Target Audience Classification In Retail Ppt Powerpoint Presentation Professional Guide
This is a target audience classification in retail ppt powerpoint presentation professional guide. This is a six stage process. The stages in this process are finance, marketing, management, investment, analysis.
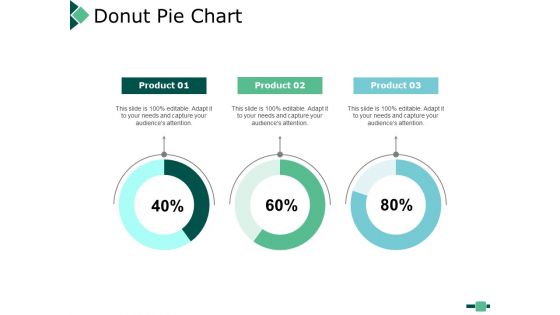
Donut Pie Chart Finance Ppt PowerPoint Presentation Styles Summary
This is a donut pie chart finance ppt powerpoint presentation styles summary. This is a three stage process. The stages in this process are finance, marketing, management, investment, analysis.
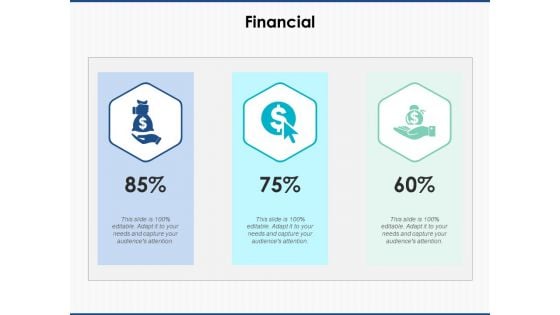
Financial Business Strategy Ppt PowerPoint Presentation File Graphics Design
This is a financial business strategy ppt powerpoint presentation file graphics design. This is a three stage process. The stages in this process are finance, marketing, management, investment, analysis.
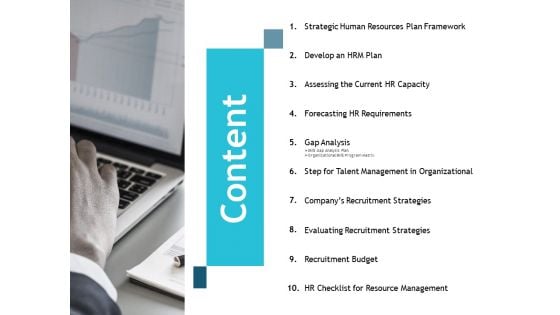
Content Business Ppt PowerPoint Presentation Professional Graphics Pictures
This is a content business ppt powerpoint presentation professional graphics pictures. This is a ten stage process. The stages in this process are gap analysis, recruitment budget, planning, marketing, strategy.
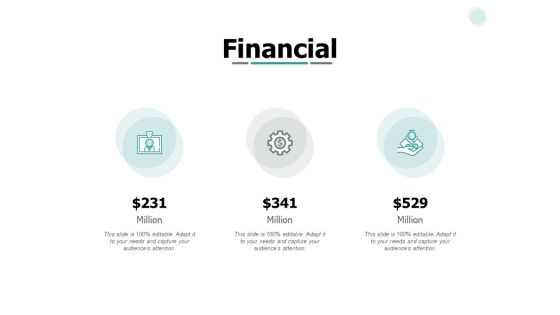
Financial Business Management Ppt PowerPoint Presentation File Background Image
This is a financial business management ppt powerpoint presentation file background image. This is a three stage process. The stages in this process are finance, marketing, management, investment, analysis.
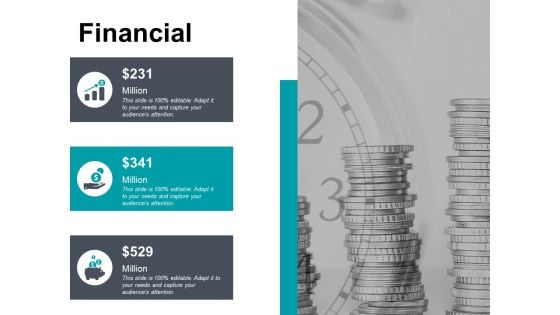
Financial Business Planning Ppt PowerPoint Presentation Styles Graphics Tutorials
This is a financial business planning ppt powerpoint presentation styles graphics tutorials. This is a three stage process. The stages in this process are finance, marketing, management, investment, analysis.
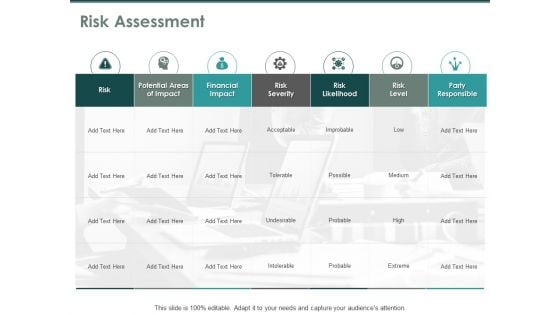
Risk Assessment Financial Impact Ppt PowerPoint Presentation Model Guidelines
Presenting this set of slides with name risk assessment financial impact ppt powerpoint presentation model guidelines. The topics discussed in these slides are risk assessment, financial, risk severity, business, management. This is a completely editable PowerPoint presentation and is available for immediate download. Download now and impress your audience.
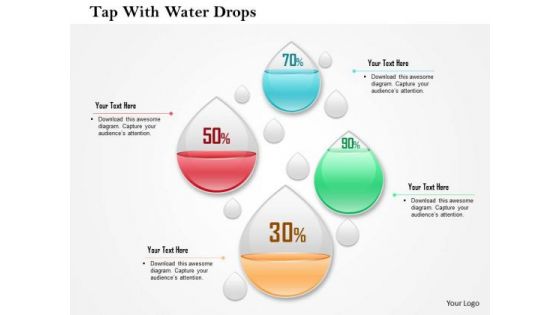
Business Diagram Four Water Drops With Percentage Values Presentation Template
This business diagram has been designed with graphic of four water drops and percentage values. This slide may be used to display percentage values for business analysis. Use this editable diagram for finance and business related presentations.
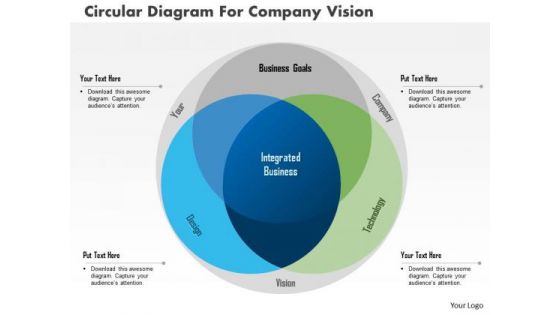
Business Diagram Circular Diagram For Company Vision Presentation Template
This power point template diagram has been crafted with three staged Venn diagram. This PPT contains the concept of future vision and analysis. Use this PPT for your business presentations.
Business Diagram Business Man With Puzzles Icon Presentation Template
Graphic of business man with puzzles icons has been used to design this power point template. This diagram slide helps to portray concept like business strategy and analysis. Use this diagram to organize your thoughts and ideas.
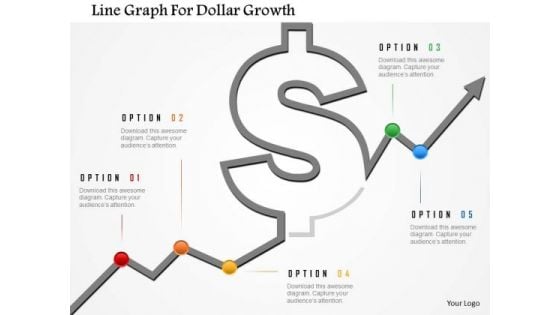
Business Diagram Line Graph For Dollar Growth Presentation Template
Graphic of dollar symbol and growth arrow has been used to design this power point template. This diagram contains the concept of financial result analysis. Use this business diagram for finance related presentations
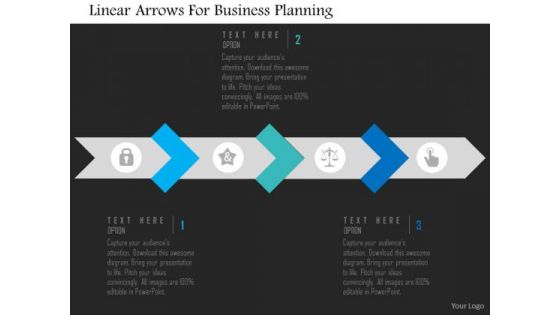
Business Diagram Linear Arrows For Business Planning Presentation Template
This slide illustrates diagram of linear arrows. You may use it to for business planning and analysis. This diagram is suitable to display business information and also helps to keep your audience interested till the end of your presentation.
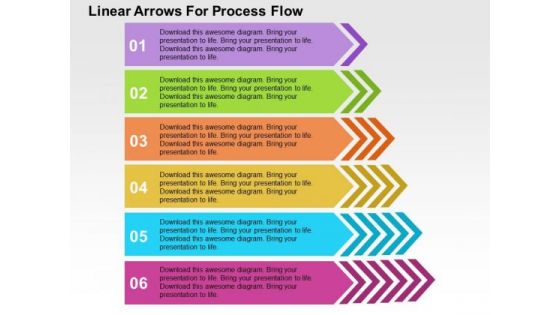
Linear Arrows For Process Flow PowerPoint Template
Graphic of arrows in linear flow has been used to design this business diagram. This diagram slide may be used to depict business steps in linear flow. Download this diagram for business research and analysis.
Five Options Bar Graph With Icons Powerpoint Template
This PowerPoint slide has been designed with five options bar graph and icons. This slide of bar graph is suitable for statistical analysis. This professional slide helps in making an instant impact on viewers.
Thumbs Up Text Tags With Finance Icons Powerpoint Template
Emphatically define your message with our above template containing thumbs up text tags with icons. This slide signifies business planning and analysis. Adjust the above diagram into your Presentations to visually support your contents.
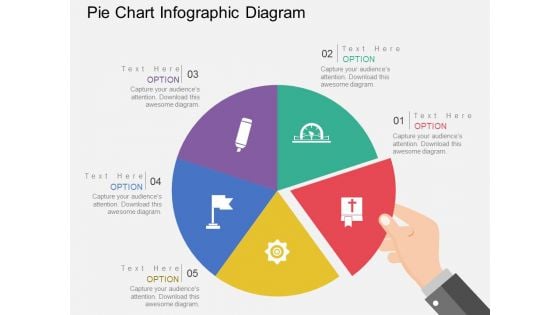
Pie Chart Infographic Diagram Powerpoint Templates
This Power Point template has been designed with pie chart infographic. This business slide is useful to present financial ratio analysis. Use this diagram to make business presentation. Illustrate these thoughts with this slide.
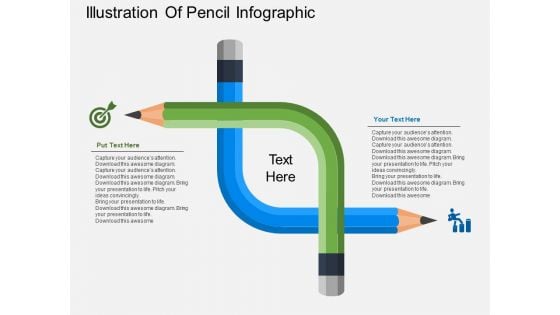
Illustration Of Pencil Infographic Powerpoint Templates
The above PowerPoint template displays a pencil Infographic diagram. This PPT slide may be used to display target planning and analysis. Grab center stage with this slide and capture the attention of your audience.
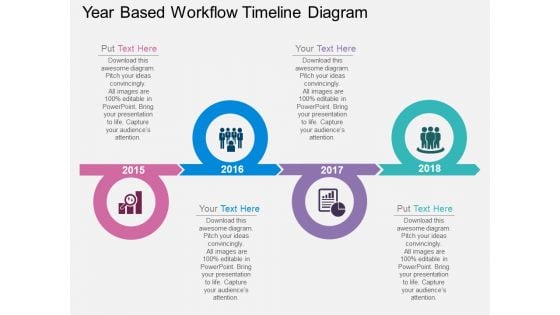
Year Based Workflow Timeline Diagram Powerpoint Template
Four Staged Text Box And Icons Powerpoint Template
Our above PPT slide displays graphics of four text boxes with icons. This diagram may be used for concepts like business planning and analysis. Download this template to leave permanent impression on your audience.
Five Hexagons With Business Icons Powerpoint Templates
This PowerPoint template contains graphics of hexagons with business icons. This layout helps you to portray concepts teamwork, idea sharing and business analysis. Streamline the flow of information across the board using this diagram.
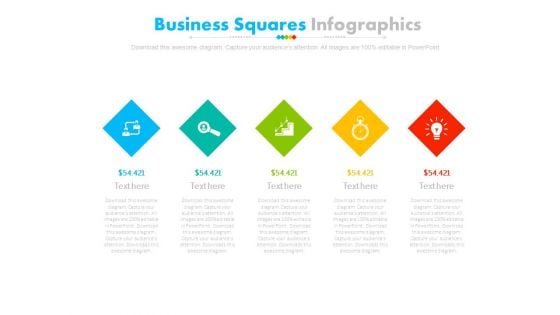
Five Steps Diamond Infographic Diagram Powerpoint Slides
This PowerPoint template has been designed with alphabet steps with icons. This PPT slide may be used to display financial strategy analysis. Make outstanding business presentation with this template.

Three Square Tags With Dollars Value Powerpoint Slides
This PowerPoint template contains three square tags with dollar value. You may download this PPT slide design to display financial analysis. You can easily customize this template to make it more unique as per your need.
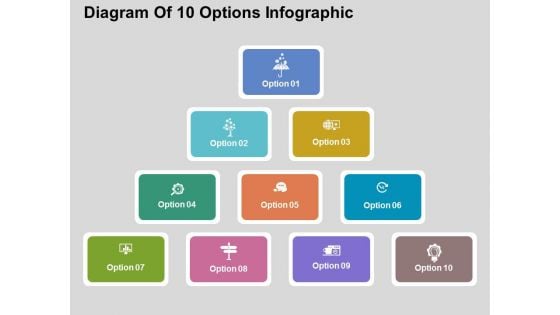
Diagram Of 10 Options Infographic Powerpoint Templates
Flowchart of 10 business options has been displayed in this business slide. This business diagram helps to exhibit concepts of strategy, planning, communication, management and analysis. Use this diagram to build an exclusive presentation.
Hexagons With Seven Business Icons Powerpoint Templates
Hexagonal layout with business icons has been displayed in this business slide. This business diagram helps to exhibit concepts of strategy, planning, communication, management and analysis. Use this diagram to build an exclusive presentation.
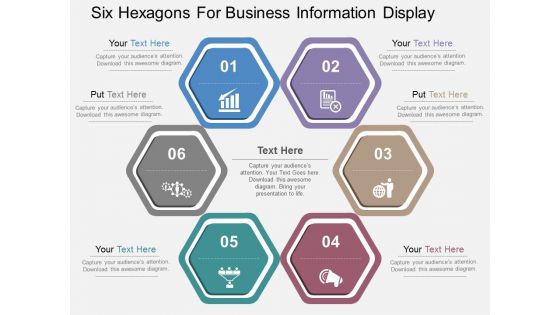
Six Hexagons For Business Information Display Powerpoint Templates
Hexagonal layout with business icons has been displayed in this business slide. This business diagram helps to exhibit concepts of strategy, planning, communication, management and analysis. Use this diagram to build an exclusive presentation.
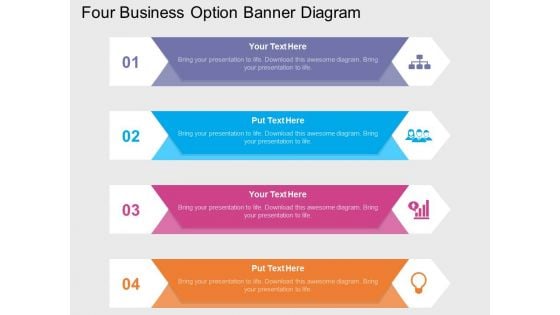
Four Business Option Banner Diagram Powerpoint Template
This business slide contains four option banners with business icons. This PPT diagram is suitable to present concept of profit growth value analysis. Visual effect of this diagram provides more clarity to the subject.
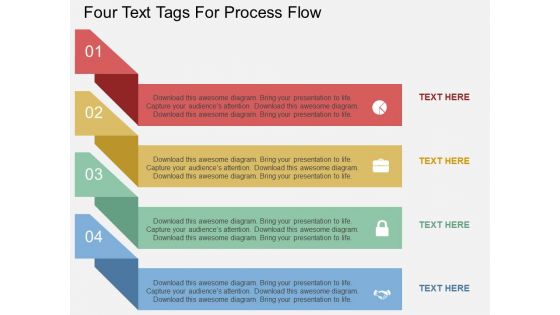
Four Text Tags For Process Flow Powerpoint Template
This PPT slide contains four text tags with business icons. This PPT diagram is suitable to present concept of profit growth value analysis. Enlighten others on the process with this innovative PowerPoint template.

Three Steps Ribbon Diagram For Financial Measurement Powerpoint Slides
This PowerPoint template has been designed with three steps ribbon diagram. This PPT slide may be used to display financial strategy and analysis. Make outstanding business presentation with this template.
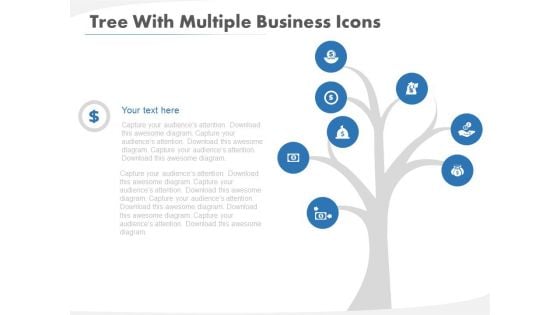
Tree Diagram For Strategic Planning Methods Powerpoint Template
This PowerPoint template has been designed with tree diagram and icons. This diagram slide may be used to depict strategic planning methods. Download this diagram for business research and analysis.
Pie Chart With Seven Business Icons Powerpoint Templates
Our compelling template consists with a design of pie chart with seven business icons. This slide has been professionally designed to exhibit financial ratio analysis. This template offers an excellent background to build impressive presentation.
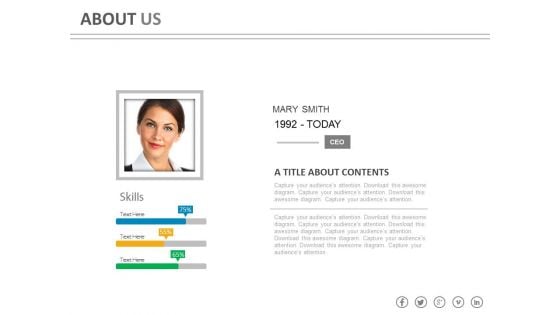
About Company Ceo Skills Profile Powerpoint Slides
This PowerPoint template contains picture of company CEO with performance analysis. You may use this as introduction slide for your presentation. Download this creative template to catch the attention of the people.
Five Pointers Timeline Diagram With Icons Powerpoint Slides
This PowerPoint template has been designed with five pointers timeline diagram with icons. This PPT slide may be helpful to display business growth and analysis. Download this PowerPoint timeline template to make impressive presentations.
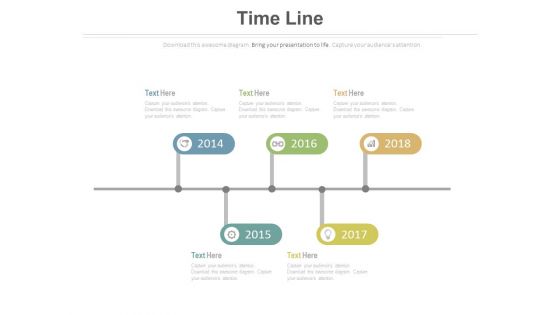
Year Based Timeline For Sales Planning Powerpoint Slides
This PowerPoint timeline slide design can be used to display progress steps. It contains sequential timeline tags. This timeline template can be used in presentations where you need to display sales planning and analysis.
Year Tags Sequential Timeline With Icons Powerpoint Slides
This PowerPoint timeline slide design can be used to display progress steps. It contains sequential timeline tags. This timeline template can be used in presentations where you need to display sales planning and analysis.
Four Circles With Percentage Values And Icons Powerpoint Slides
This PowerPoint template displays info graphic diagram of linear circles. This diagram may be used to exhibit financial growth and analysis. Grab center stage with this slide and capture the attention of your audience.
Four Circles With Icons Timeline Design Powerpoint Slides
This PowerPoint timeline template can be used for multiple purposes including vision planning, new milestones and tasks. This PPT slide may be helpful to display timeline steps and year based analysis. Download this PowerPoint timeline template to make impressive presentations.
Five Circles Sequential Chart With Icons Powerpoint Slides
This PowerPoint template contains sequential chart of five circles with icons. You may download this PPT slide to depict corporate vision, mission and strategy analysis. Add this slide to your presentation and impress your superiors.


 Continue with Email

 Home
Home


