Brand Value

Scatter Bubble Chart Ppt PowerPoint Presentation Professional Model
This is a scatter bubble chart ppt powerpoint presentation professional model. This is a six stage process. The stages in this process are sales in profit, financial year, growth, business, marketing, strategy.
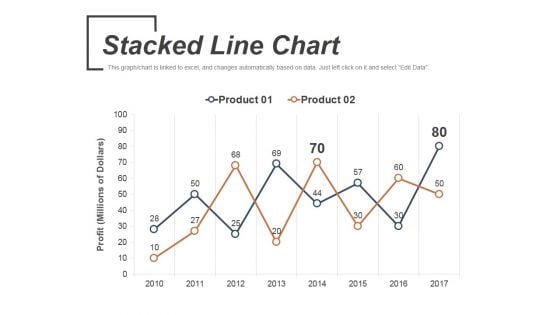
Stacked Line Chart Ppt PowerPoint Presentation Outline Examples
This is a stacked line chart ppt powerpoint presentation outline examples. This is a two stage process. The stages in this process are product, stacked line chart, business, marketing, profit.
Stacked Line With Marker Ppt PowerPoint Presentation Icon Format
This is a stacked line with marker ppt powerpoint presentation icon format. This is a twelve stage process. The stages in this process are business, strategy, marketing, success, profit million dollars, stacked column.
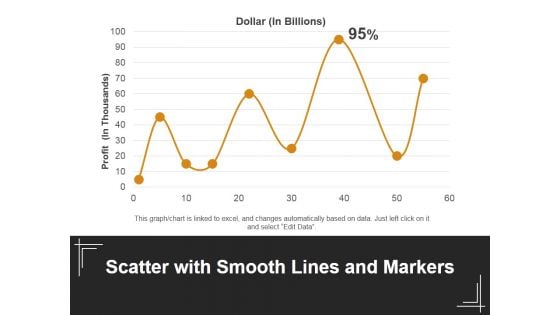
Scatter With Smooth Lines And Markers Ppt PowerPoint Presentation Outline Design Ideas
This is a scatter with smooth lines and markers ppt powerpoint presentation outline design ideas. This is a one stage process. The stages in this process are dollar, profit, line chart, business, marketing.
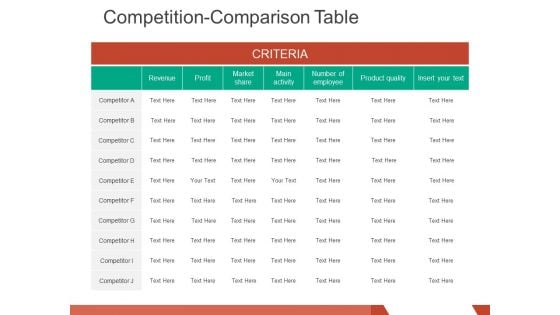
competition comparison table ppt powerpoint presentation infographics design inspiration
This is a competition comparison table ppt powerpoint presentation infographics design inspiration. This is a seven stage process. The stages in this process are revenue, profit, market share, main activity, number of employee.
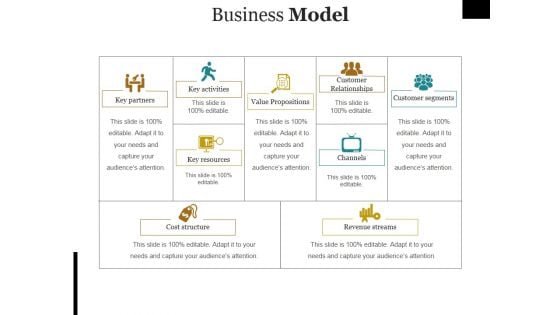
Business Model Template Ppt PowerPoint Presentation Infographic Template Graphics Design
This is a business model template ppt powerpoint presentation infographic template graphics design. This is a four stage process. The stages in this process are offering, monetization, sustainability, market attractiveness, profit model.
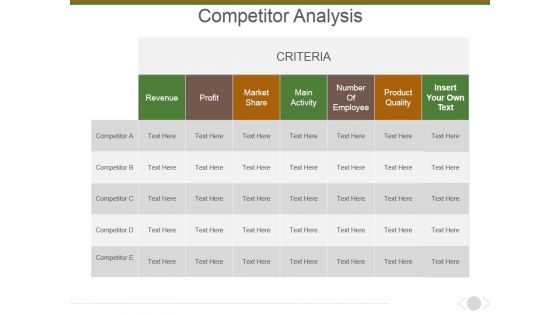
Competitor Analysis Ppt PowerPoint Presentation Layouts Background Image
This is a competitor analysis ppt powerpoint presentation layouts background image. This is a five stage process. The stages in this process are profit, revenue, market share, main activity, number of employee, product quality.
Competitor Analysis Ppt PowerPoint Presentation Ideas Icons
This is a competitor analysis ppt powerpoint presentation ideas icons. This is a seven stage process. The stages in this process are revenue, profit, market share, main activity, number of employee.
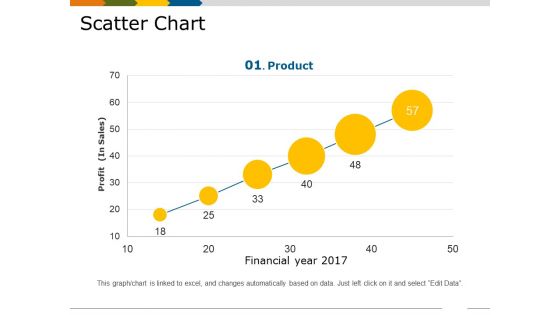
Scatter Chart Template 1 Ppt PowerPoint Presentation Show Slides
This is a scatter chart template 1 ppt powerpoint presentation show slides. This is a six stage process. The stages in this process are financial year, profit in sales, growth, business, marketing, product.
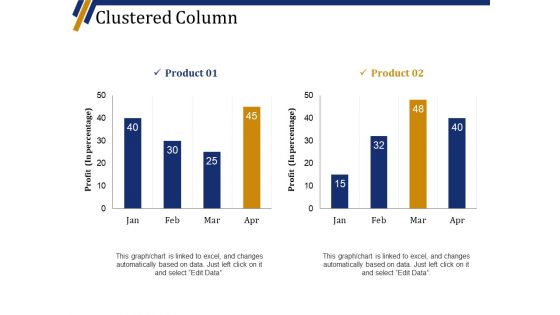
Clustered Column Ppt PowerPoint Presentation Professional Graphic Tips
This is a clustered column ppt powerpoint presentation professional graphic tips. This is a two stage process. The stages in this process are product, profit in percentage, graph, business, marketing.
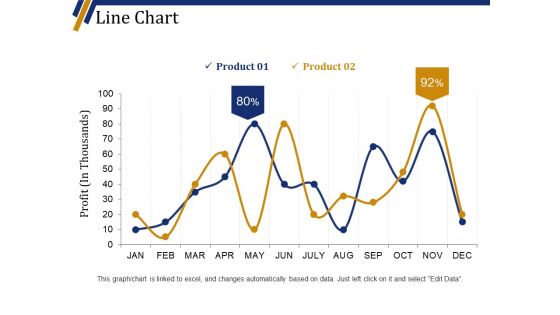
Line Chart Ppt PowerPoint Presentation Portfolio Background Designs
This is a line chart ppt powerpoint presentation portfolio background designs. This is a two stage process. The stages in this process are product, business, finance, marketing, profit in thousands.
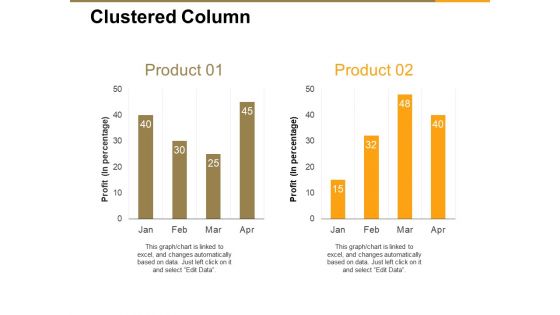
Clustered Column Ppt PowerPoint Presentation Inspiration Shapes
This is a clustered column ppt powerpoint presentation inspiration shapes. This is a two stage process. The stages in this process are profit in percentage, business, marketing, graph, finance.
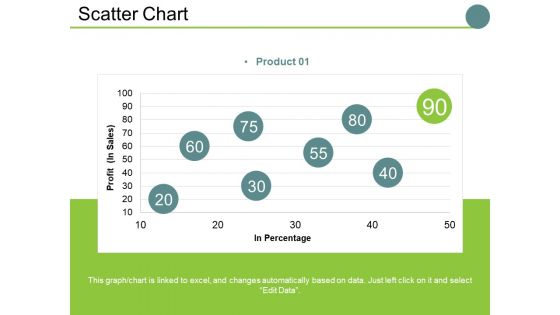
Scatter Chart Ppt PowerPoint Presentation Slides Examples
This is a scatter chart ppt powerpoint presentation slides examples. This is a one stage process. The stages in this process are profit , in percentage, business, marketing, finance, graph.
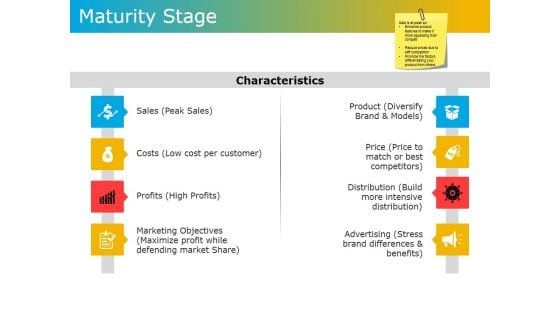
Maturity Stage Ppt PowerPoint Presentation Gallery Inspiration
This is a maturity stage ppt powerpoint presentation gallery inspiration. This is a eight stage process. The stages in this process are sales, costs, profits, marketing objectives, product, price.
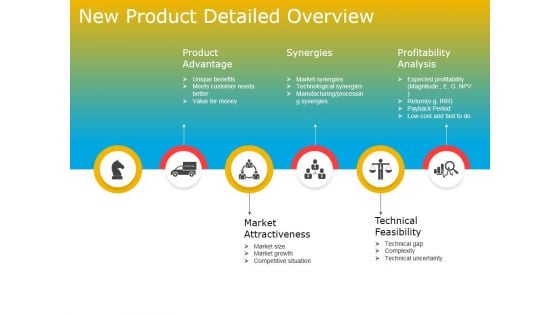
New Product Detailed Overview Ppt PowerPoint Presentation Inspiration Layouts
This is a new product detailed overview ppt powerpoint presentation inspiration layouts. This is a six stage process. The stages in this process are product advantage, synergies, profitability analysis, market attractiveness, technical feasibility.
Comparison Based On Criteria Ppt PowerPoint Presentation Show Icon
This is a comparison based on criteria ppt powerpoint presentation show icon. This is a six stage process. The stages in this process are revenue, profit, market share, main activity, number of employee.
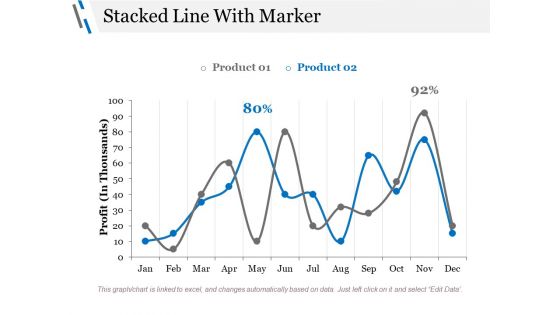
Stacked Line With Marker Ppt PowerPoint Presentation Styles Graphics Design
This is a stacked line with marker ppt powerpoint presentation styles graphics design. This is a three stage process. The stages in this process are profit, business, marketing, finance, percentage.
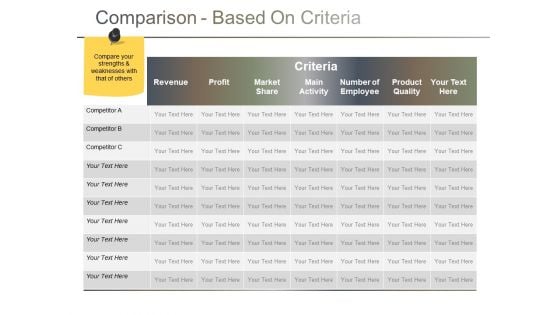
Comparison Based On Criteria Ppt PowerPoint Presentation Gallery Themes
This is a comparison based on criteria ppt powerpoint presentation gallery themes. This is a seven stage process. The stages in this process are revenue, profit, market share, main activity, product quality.

Comparison Based On Criteria Ppt PowerPoint Presentation Gallery Sample
This is a comparison based on criteria ppt powerpoint presentation gallery sample. This is a six stage process. The stages in this process are revenue, profit, market share, main activity, number of employee.

Comparison Based On Criteria Ppt PowerPoint Presentation Show File Formats
This is a comparison based on criteria ppt powerpoint presentation show file formats. This is a six stage process. The stages in this process are revenue, profit, market share, main activity, number of employee.
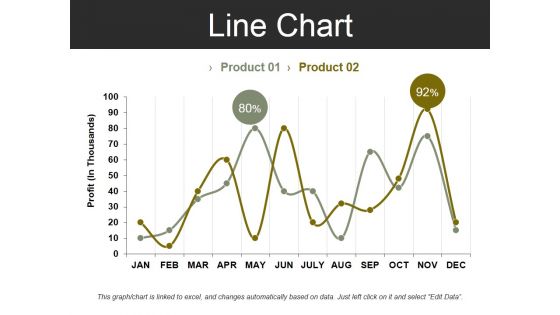
Line Chart Template 2 Ppt PowerPoint Presentation Summary Design Inspiration
This is a line chart template 2 ppt powerpoint presentation summary design inspiration. This is a two stage process. The stages in this process are profit, business, marketing, finance, chart.
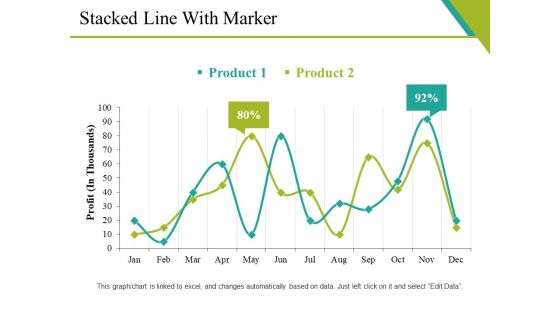
Stacked Line With Marker Ppt PowerPoint Presentation Gallery Diagrams
This is a stacked line with marker ppt powerpoint presentation gallery diagrams. This is a two stage process. The stages in this process are graph, business, marketing, strategy, profit.
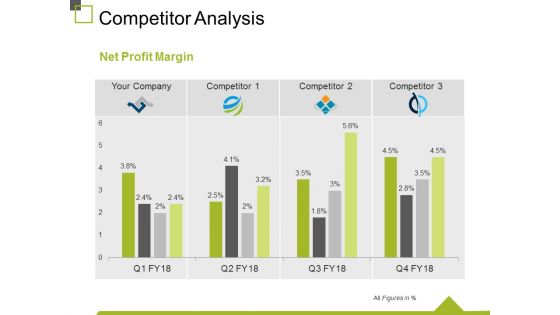
Competitor Analysis Template 4 Ppt PowerPoint Presentation Gallery Design Templates
This is a competitor analysis template 4 ppt powerpoint presentation gallery design templates. This is a four stage process. The stages in this process are business, marketing, analysis, graph, net profit margin.
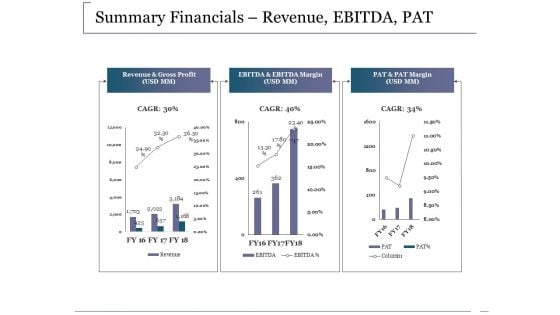
Summary Financials Revenue Ebitda Pat Ppt PowerPoint Presentation Outline Infographics
This is a summary financials revenue ebitda pat ppt powerpoint presentation outline infographics. This is a three stage process. The stages in this process are revenue and gross profit, ebitda and ebitda margin, pat and pat margin, business, marketing.
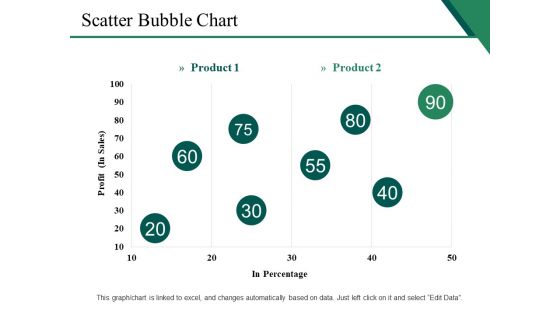
Scatter Bubble Chart Ppt PowerPoint Presentation Gallery Show
This is a scatter bubble chart ppt powerpoint presentation gallery show. This is a two stage process. The stages in this process are profit, in percentage, finance, marketing, business.
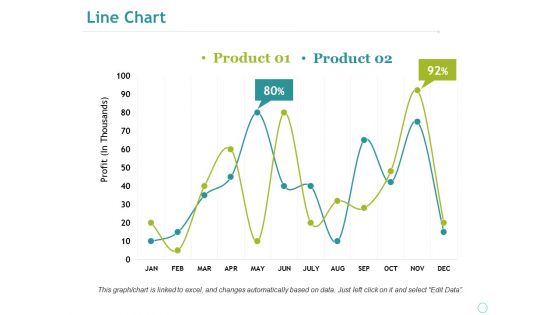
Line Chart Ppt PowerPoint Presentation Professional Portfolio
This is a line chart ppt powerpoint presentation professional portfolio. This is a two stage process. The stages in this process are business, marketing, profit, percentage, graph, strategy, finance.
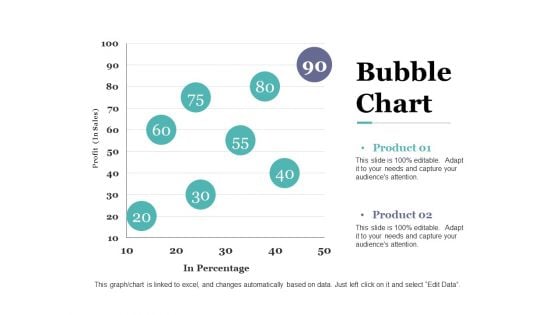
Bubble Chart Ppt PowerPoint Presentation Outline Deck
This is a bubble chart ppt powerpoint presentation outline deck. This is a two stage process. The stages in this process are in percentage, profit, bubble chart, business, marketing.
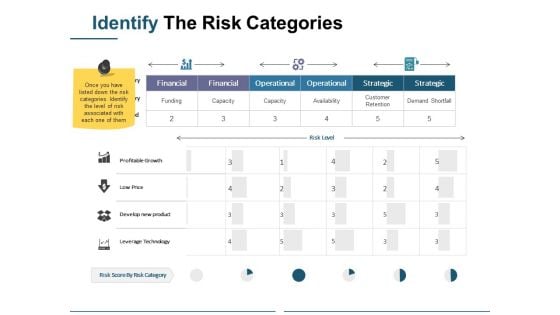
Identify The Risk Categories Ppt PowerPoint Presentation Professional Infographics
This is a identify the risk categories ppt powerpoint presentation professional infographics. This is a three stage process. The stages in this process are business, marketing, financial, operational, strategic, profitable growth.
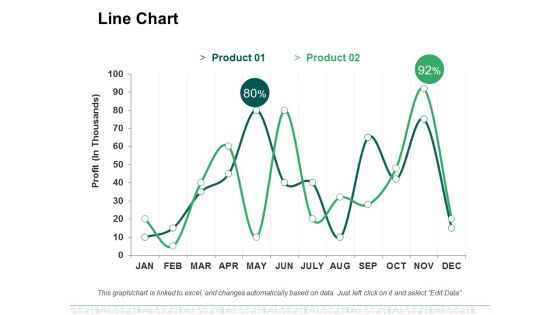
Line Chart Ppt PowerPoint Presentation File Designs Download
This is a line chart ppt powerpoint presentation file designs download. This is a two stage process. The stages in this process are business, marketing, profit, line chart, percentage.
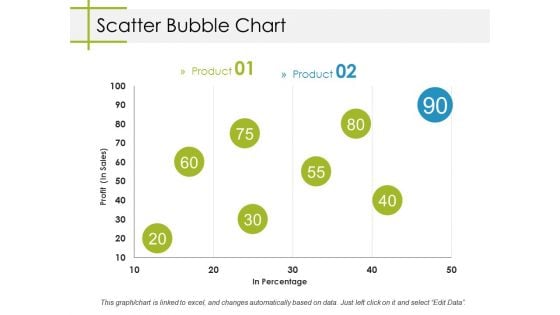
Scatter Bubble Chart Ppt PowerPoint Presentation Model Designs
This is a scatter bubble chart ppt powerpoint presentation model designs. This is a two stage process. The stages in this process are business, profit, in percentage, bubble chart, marketing.
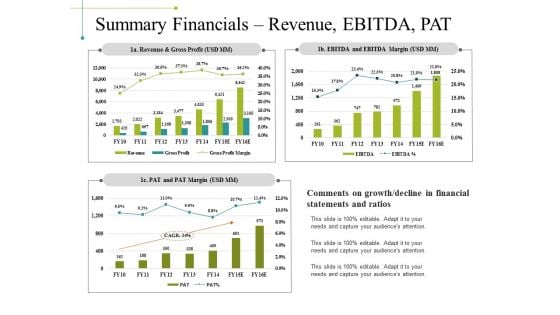
Summary Financials Revenue Ebitda Pat Ppt PowerPoint Presentation Inspiration Templates
This is a summary financials revenue ebitda pat ppt powerpoint presentation inspiration templates. This is a three stage process. The stages in this process are revenue and gross profit, pat and pat margin, ebitda and ebitda margin, business, marketing.
Stacked Line Chart Ppt PowerPoint Presentation Show Icon
This is a stacked line chart ppt powerpoint presentation show icon. This is a two stage process. The stages in this process are profit, chart, years, business, marketing, years.
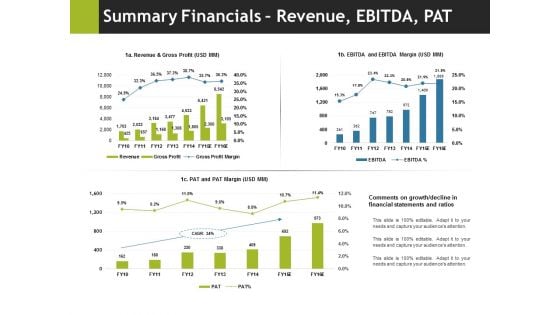
Summary Financials Revenue Ebitda Pat Ppt PowerPoint Presentation Pictures Outline
This is a summary financials revenue ebitda pat ppt powerpoint presentation pictures outline. This is a three stage process. The stages in this process are business, marketing, pat and pat margin, ebitda and ebitda margin, revenue and gross profit.
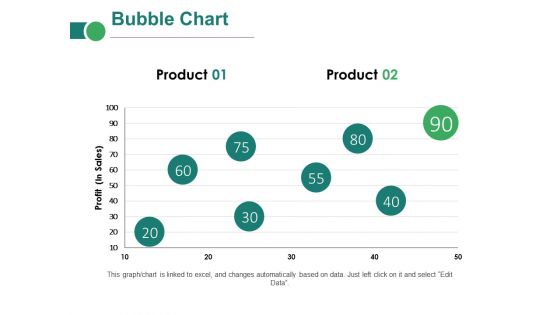
Bubble Chart Ppt PowerPoint Presentation Layouts Clipart Images
This is a bubble chart ppt powerpoint presentation layouts clipart images. This is a two stage process. The stages in this process are business, marketing, profit, innovation, technology, idea bulb.
Clustered Bar Ppt PowerPoint Presentation Icon Professional
This is a clustered bar ppt powerpoint presentation icon professional. This is a two stage process. The stages in this process are business, marketing, profit, clustered bar, finance, strategy.
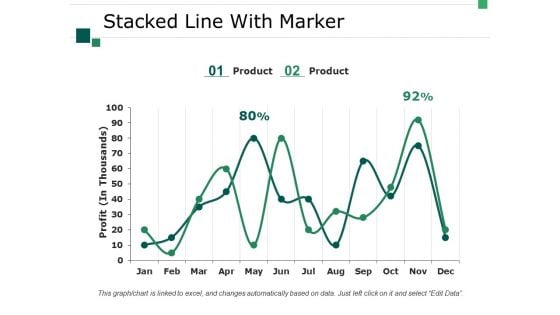
Stacked Line With Marker Ppt PowerPoint Presentation Professional Designs Download
This is a stacked line with marker ppt powerpoint presentation professional designs download. This is a two stage process. The stages in this process are business, marketing, strategy, graph, profit.
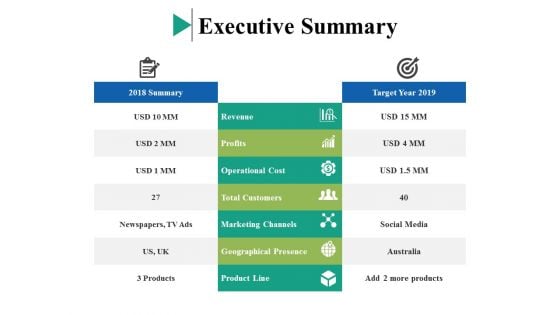
Executive Summary Ppt PowerPoint Presentation Layouts Clipart
This is a executive summary ppt powerpoint presentation layouts clipart. This is a seven stage process. The stages in this process are revenue, profits, operational cost, total customers, marketing channels.
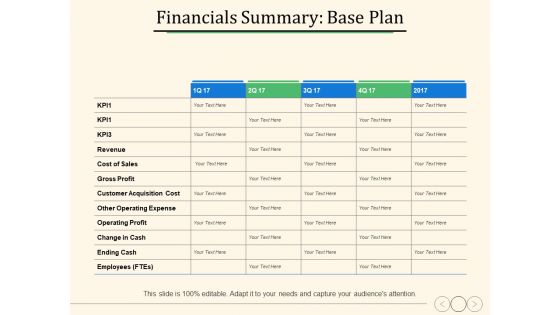
Financials Summary Base Plan Ppt PowerPoint Presentation Ideas Professional
This is a financials summary base plan ppt powerpoint presentation ideas professional. This is a five stage process. The stages in this process are operating profit, customer acquisition cost, business, marketing.
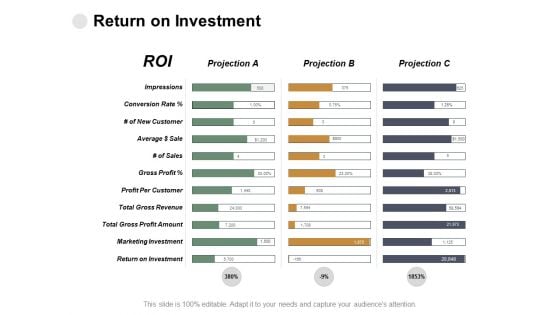
Return On Investment Impressions Ppt PowerPoint Presentation Infographics Background
This is a return on investment impressions ppt powerpoint presentation infographics background. This is a three stage process. The stages in this process are gross profit, marketing investment, impressions, returns on investment.
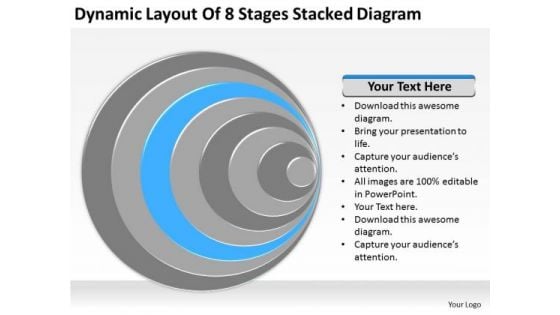
Dynamic Layout Of 8 Stages Stacked Diagram Business Plan Draft PowerPoint Templates
We present our dynamic layout of 8 stages stacked diagram business plan draft PowerPoint templates.Use our Marketing PowerPoint Templates because You can safely bank on our PowerPoint Templates and Slides. They will provide a growth factor to your valuable thoughts. Download and present our Festival PowerPoint Templates because Our PowerPoint Templates and Slides are like the strings of a tennis racquet. Well strung to help you serve aces. Download our Circle Charts PowerPoint Templates because You are an avid believer in ethical practices. Highlight the benefits that accrue with our PowerPoint Templates and Slides. Present our Layers PowerPoint Templates because You are an avid believer in ethical practices. Highlight the benefits that accrue with our PowerPoint Templates and Slides. Present our Business PowerPoint Templates because It will let you Set new benchmarks with our PowerPoint Templates and Slides. They will keep your prospects well above par.Use these PowerPoint slides for presentations relating to Design, layout, cover, page, shape, graphic, distressed, motion, background, black, modern, white, corporate, contemporary, brochure, dynamic, clean, element, marketing, distract, label, geometric, round, backdrop, typographic, publishing, artistic, pattern, displaced. The prominent colors used in the PowerPoint template are Blue, Gray, Black. Our Dynamic Layout Of 8 Stages Stacked Diagram Business Plan Draft PowerPoint Templates are more than just a facelift. They actually add to the depth of your views.
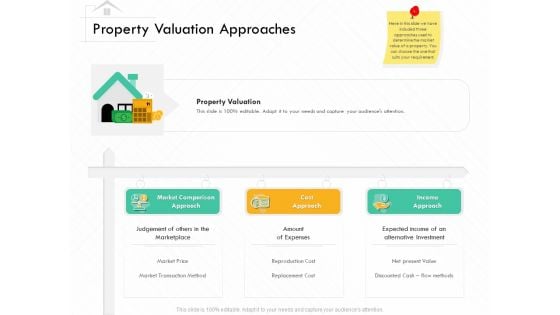
Selling Home Property Property Valuation Approaches Ppt Infographic Template PDF
This is a selling home property property valuation approaches ppt infographic template pdf template with various stages. Focus and dispense information on three stages using this creative set, that comes with editable features. It contains large content boxes to add your information on topics like market comparison approach, cost approach, income approach. You can also showcase facts, figures, and other relevant content using this PPT layout. Grab it now.
Market Segmentation 3 Stages Ppt Business Plans PowerPoint Templates
We present our market segmentation 3 stages ppt business plans PowerPoint templates.Present our Marketing PowerPoint Templates because They will Put your wonderful verbal artistry on display. Our PowerPoint Templates and Slides will provide you the necessary glam and glitter. Download our Shapes PowerPoint Templates because Our PowerPoint Templates and Slides will provide you a launch platform. Give a lift off to your ideas and send them into orbit. Present our Finance PowerPoint Templates because It will mark the footprints of your journey. Illustrate how they will lead you to your desired destination. Download and present our Business PowerPoint Templates because You have a driving passion to excel in your field. Our PowerPoint Templates and Slides will prove ideal vehicles for your ideas. Download our Curves and Lines PowerPoint Templates because You are an avid believer in ethical practices. Highlight the benefits that accrue with our PowerPoint Templates and Slides.Use these PowerPoint slides for presentations relating to advertisement, way, isolated, locator, mark, map, tag, urban, sign, traffic, symbol, location, summer, service, yacht, marketing, pointer, gps, vehicle, rekreation, train, label, illustration, icon, flyer, transport, gas, bus, place, airplane, needle, marker, terminal, blue, tram, station, plane, information, car, airport, water, promotion, bubble, auto, museum, communicate, button, road, communication, 3d. The prominent colors used in the PowerPoint template are Gray, White, Blue. With our Market Segmentation 3 Stages Ppt Business Plans PowerPoint Templates you will surely fare well. They take your address to a higher level.

Business Graph Finance PowerPoint Presentation Slides Cc
Microsoft Powerpoint Slides and Backgrounds with graph with arrow showing profits and gains Your thoughts and our Business Graph Finance PowerPoint Presentation Slides Cc will get along famously. They will create an acclaimed team.
Business Graph Finance PowerPoint Presentation Slides F
Microsoft Powerpoint Slides and Backgrounds with graph with arrow showing profits and gains Our Business Graph Finance PowerPoint Presentation Slides F are maintenance free. All they require is a dash of your thoughts.

Business Graph Finance PowerPoint Presentation Slides R
Microsoft Powerpoint Slides and Backgrounds with graph with arrow showing profits and gains Improve the apprearance of your slides with our Business Graph Finance PowerPoint Presentation Slides R. Dont waste time struggling with PowerPoint. Let us do it for you.
Business Graph Finance PowerPoint Presentation Slides S
Microsoft Powerpoint Slides and Backgrounds with graph with arrow showing profits and gains Create a business with our Business Graph Finance PowerPoint Presentation Slides S. Just download, type and present.

Business Planning Strategy 3d Man Stops With Hands Basic Concepts
Rake In The Dough With Your Ideas. Profits Will Rise With Our Business Planning Strategy 3d Man Stops With Hands Basic Concepts Powerpoint Templates. Dowse The Flames With Our People Powerpoint Templates. Put Out The Fire Before It Starts.
Business Management Strategy 3d Person Give Sympathy To His Friend Character
Rake In The Dough With Your Ideas. Profits Will Rise With Our Business Management Strategy 3d Person Give Sympathy To His Friend Character Powerpoint Templates. Dowse The Flames With Our people Powerpoint Templates. Put Out The Fire Before It Starts.
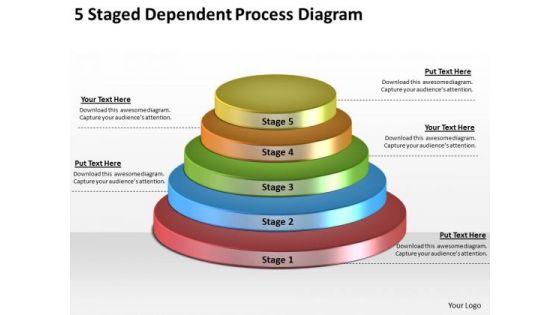
Timeline Ppt Template 5 Staged Dependent Process Diagram
Rake In The Dough With Your Ideas. Profits Will Rise With Our Timeline Ppt Template 5 Staged Dependent Process Diagram Powerpoint Templates. Dowse The Flames With Our Business Powerpoint Templates. Put Out The Fire Before It Starts.
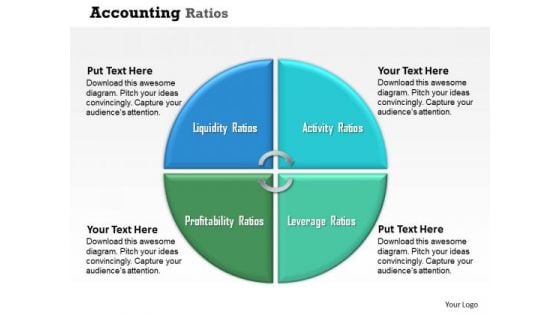
Business Framework Accounting Ratios PowerPoint Presentation
This professional diagram displays four segments with accounting ratios. This circular diagram shows liquidity ratio, activity ratio, leverage ratios and profitability ratios. Use this diagram to display accounting procedure in graphical way.
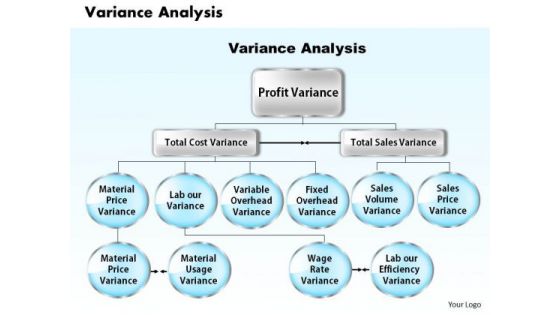
Business Framework Variance Analysis PowerPoint Presentation
This diagram shows framework of variance analysis. It contains flow diagram of profit variance, total cost variance and total sales variance. Download this diagram as a tool for business presentations.
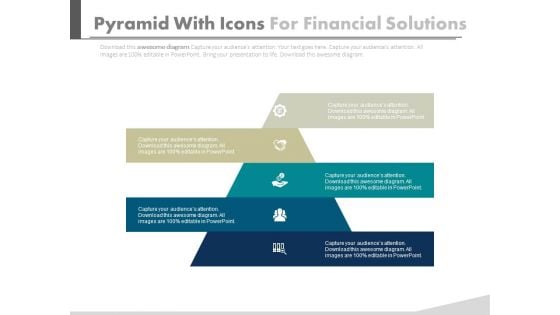
Pyramid For Financial Accounting Information Powerpoint Slides
This PowerPoint template has been designed with graphics of pyramid chart. This PPT slide can be used to prepare presentations for profit growth report and also for financial data analysis. You can download finance PowerPoint template to prepare awesome presentations.
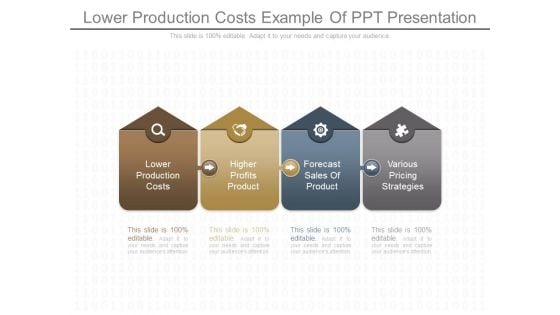
Lower Production Costs Example Of Ppt Presentation
This is a lower production costs example of ppt presentation. This is a four stage process. The stages in this process are lower production costs, higher profits product, forecast sales of product, various pricing strategies.
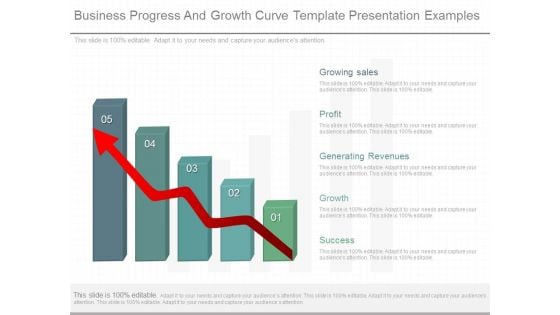
Business Progress And Growth Curve Template Presentation Examples
This is a business progress and growth curve template presentation examples. This is a five stage process. The stages in this process are growing sales, profit, generating revenues, growth, success.
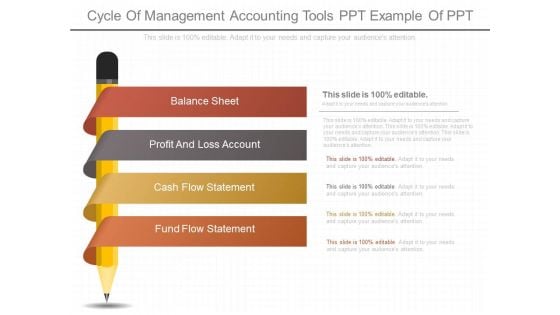
Cycle Of Management Accounting Tools Ppt Example Of Ppt
This is a cycle of management accounting tools ppt example of ppt. This is a four stage process. The stages in this process are balance sheet, profit and loss account, cash flow statement, fund flow statement.\n\n\n\n\n\n\n\n\n\n\n\n\n\n\n\n\n\n
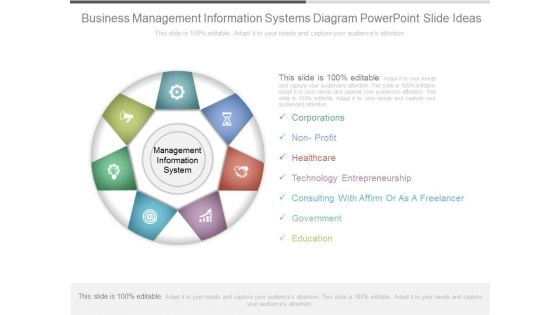
Business Management Information Systems Diagram Powerpoint Slide Ideas
This is a business management information systems diagram powerpoint slide ideas. This is a seven stage process. The stages in this process are corporations, non profit, healthcare, technology entrepreneurship, consulting with affirm or as a freelancer, government, education.
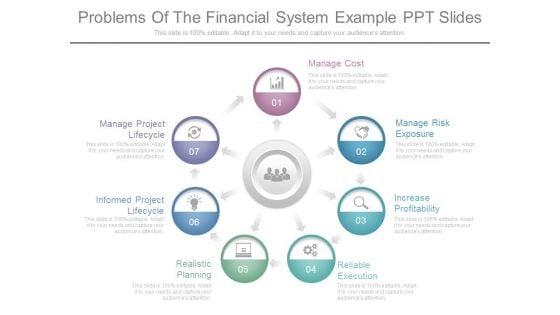
Problems Of The Financial System Example Ppt Slides
This is a problems of the financial system example ppt slides. This is a seven stage process. The stages in this process are manage cost, manage risk exposure, increase profitability, reliable execution, realistic planning, informed project lifecycle, manage project lifecycle.
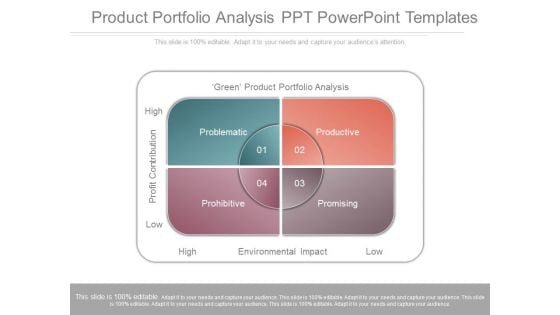
Product Portfolio Analysis Ppt Powerpoint Templates
This is a product portfolio analysis ppt powerpoint templates. This is a four stage process. The stages in this process are green product portfolio analysis, profit contribution, low, high, problematic, productive, prohibitive, promising, environmental impact.

Business Management Information Systems Diagram Presentation Deck
This is a business management information systems diagram presentation deck. This is a seven stage process. The stages in this process are corporations, consulting with a firm or as a freelancer, government, education, technology entrepreneurship, healthcare, non profits.
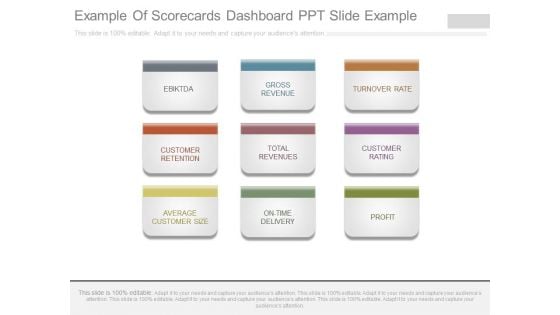
Example Of Scorecards Dashboard Ppt Slide Example
This is a example of scorecards dashboard ppt slide example. This is a nine stage process. The stages in this process are ebiktda, gross revenue, turnover rate, customer retention, total revenues, customer rating, average customer size, on time delivery, profit.


 Continue with Email

 Home
Home


