Budget Change
Online Marketing Techniques Assessment Approach Content Performance Tracking Dashboard For Social Media Topics PDF
This Online Marketing Techniques Assessment Approach Content Performance Tracking Dashboard For Social Media Topics PDF from Slidegeeks makes it easy to present information on your topic with precision. It provides customization options, so you can make changes to the colors, design, graphics, or any other component to create a unique layout. It is also available for immediate download, so you can begin using it right away. Slidegeeks has done good research to ensure that you have everything you need to make your presentation stand out. Make a name out there for a brilliant performance.
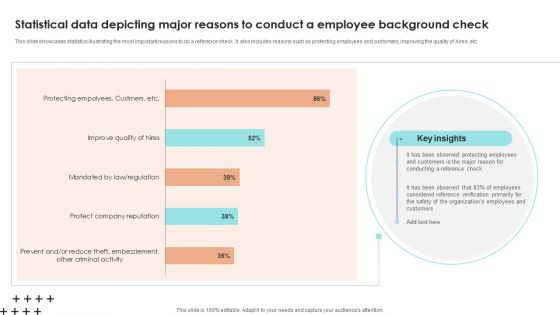
Statistical Data Depicting Major Reasons To Conduct A Employee Background Check Download PDF
This slide showcases statistics illustrating the most important reasons to do a reference check. It also includes reasons such as protecting employees and customers, improving the quality of hires, etc. Pitch your topic with ease and precision using this Statistical Data Depicting Major Reasons To Conduct A Employee Background Check Download PDF. This layout presents information on Key Insights, Reference Check, Customers. It is also available for immediate download and adjustment. So, changes can be made in the color, design, graphics or any other component to create a unique layout.

Hotel Administration Software Dashboard For Business Intelligence Infographics PDF
This slide covers HMS dashboard. The purpose of this dashboard is to get an overview of hotel key metrics and to check financial status against targets. It includes elements such as reservations, check in guests, reservation type and housekeeping. Pitch your topic with ease and precision using this Hotel Administration Software Dashboard For Business Intelligence Infographics PDF. This layout presents information on Guest, Housekeeping, Reservation Type. It is also available for immediate download and adjustment. So, changes can be made in the color, design, graphics or any other component to create a unique layout.
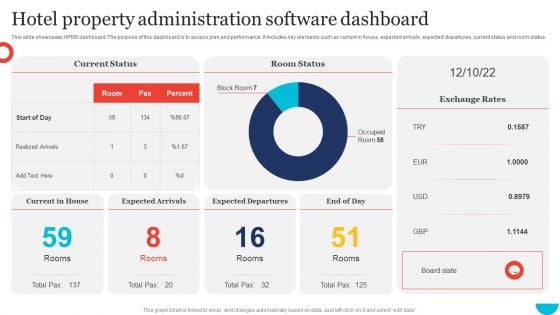
Hotel Property Administration Software Dashboard Guidelines PDF
This slide showcases HPMS dashboard. The purpose of this dashboard is to access plan and performance. It includes key elements such as current in house, expected arrivals, expected departures, current status and room status. Pitch your topic with ease and precision using this Hotel Property Administration Software Dashboard Guidelines PDF. This layout presents information on Current Status, Room Status, Exchange Rates. It is also available for immediate download and adjustment. So, changes can be made in the color, design, graphics or any other component to create a unique layout.
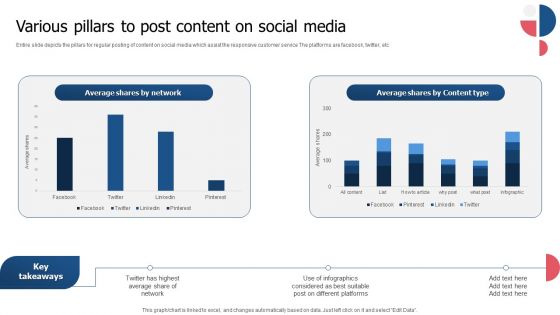
Various Pillars To Post Content On Social Media Mockup PDF
Entire slide depicts the pillars for regular posting of content on social media which assist the responsive customer service The platforms are facebook, twitter, etc. Pitch your topic with ease and precision using this Various Pillars To Post Content On Social Media Mockup PDF. This layout presents information on Average Shares Network, Average Shares Content Type, Average Share Network. It is also available for immediate download and adjustment. So, changes can be made in the color, design, graphics or any other component to create a unique layout.
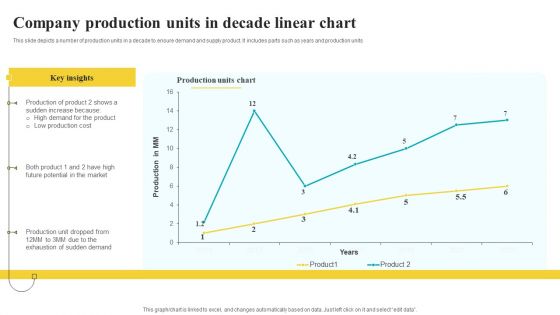
Company Production Units In Decade Linear Chart Designs PDF
This slide depicts a number of production units in a decade to ensure demand and supply product. It includes parts such as years and production units Pitch your topic with ease and precision using this Company Production Units In Decade Linear Chart Designs PDF. This layout presents information on Key Insights, Production Units Chart, Linear Chart. It is also available for immediate download and adjustment. So, changes can be made in the color, design, graphics or any other component to create a unique layout.
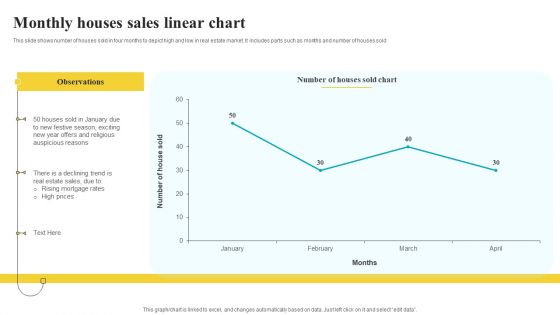
Monthly Houses Sales Linear Chart Pictures PDF
This slide shows number of houses sold in four months to depict high and low in real estate market. It includes parts such as months and number of houses sold Pitch your topic with ease and precision using this Monthly Houses Sales Linear Chart Pictures PDF. This layout presents information on Observations, Auspicious Reasons, Sales Linear Chart. It is also available for immediate download and adjustment. So, changes can be made in the color, design, graphics or any other component to create a unique layout.

Summary Report For Post Hospital Visit Patient Experience Assessment Survey Survey SS
Following slides demonstrates summarized report for survey conducted by manager to improve hospital services. It includes key components such as appointment scheduling process, hospital visit frequency, wafting area experience, hospital cleanliness, staff behavior, etc. Pitch your topic with ease and precision using this Summary Report For Post Hospital Visit Patient Experience Assessment Survey Survey SS. This layout presents information on General Services, Appointment, Behavior. It is also available for immediate download and adjustment. So, changes can be made in the color, design, graphics or any other component to create a unique layout.
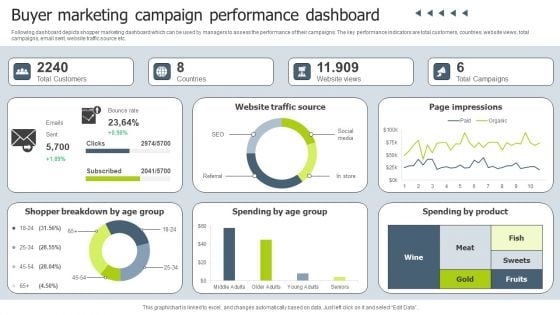
Buyer Marketing Campaign Performance Dashboard Download PDF
Following dashboard depicts shopper marketing dashboard which can be used by managers to assess the performance of their campaigns. The key performance indicators are total customers, countries, website views, total campaigns, email sent, website traffic source etc. Pitch your topic with ease and precision using this Buyer Marketing Campaign Performance Dashboard Download PDF. This layout presents information on Total Customers, Countries, Website Views. It is also available for immediate download and adjustment. So, changes can be made in the color, design, graphics or any other component to create a unique layout.
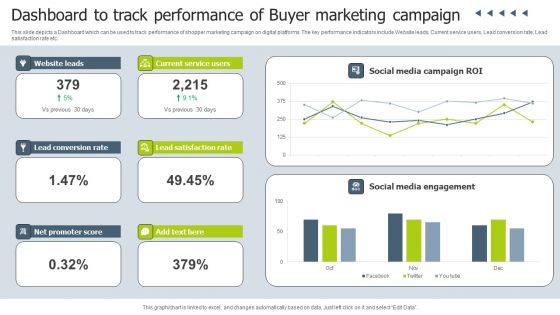
Dashboard To Track Performance Of Buyer Marketing Campaign Infographics PDF
This slide depicts a Dashboard which can be used to track performance of shopper marketing campaign on digital platforms. The key performance indicators include Website leads, Current service users, Lead conversion rate, Lead satisfaction rate etc. Pitch your topic with ease and precision using this Dashboard To Track Performance Of Buyer Marketing Campaign Infographics PDF. This layout presents information on Social Media Campaign, Social Media Engagement, Current Service Users. It is also available for immediate download and adjustment. So, changes can be made in the color, design, graphics or any other component to create a unique layout.
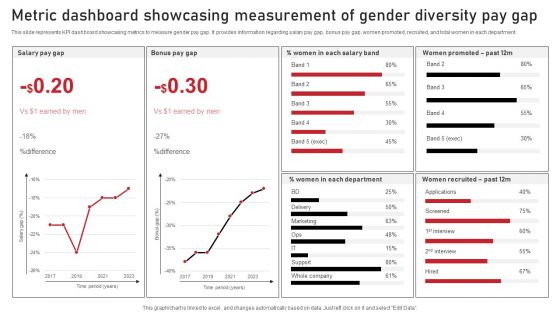
Metric Dashboard Showcasing Measurement Of Gender Diversity Pay Gap Sample PDF
This slide represents KPI dashboard showcasing metrics to measure gender pay gap. It provides information regarding salary pay gap, bonus pay gap, women promoted, recruited, and total women in each department. Pitch your topic with ease and precision using this Metric Dashboard Showcasing Measurement Of Gender Diversity Pay Gap Sample PDF. This layout presents information on Marketing, Screened, Delivery. It is also available for immediate download and adjustment. So, changes can be made in the color, design, graphics or any other component to create a unique layout.
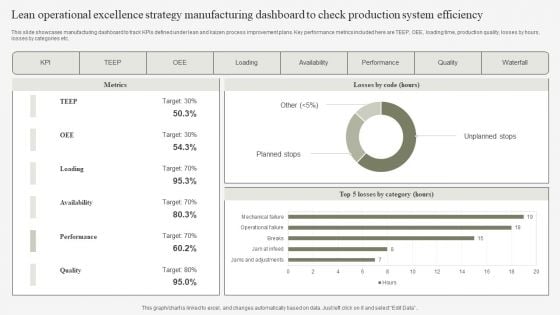
Lean Operational Excellence Strategy Manufacturing Dashboard To Check Production System Efficiency Pictures PDF
This slide showcases manufacturing dashboard to track KPIs defined under lean and kaizen process improvement plans. Key performance metrics included here are TEEP, OEE, loading time, production quality, losses by hours, losses by categories etc. Pitch your topic with ease and precision using this Lean Operational Excellence Strategy Manufacturing Dashboard To Check Production System Efficiency Pictures PDF. This layout presents information on Loading, Availability, Performance. It is also available for immediate download and adjustment. So, changes can be made in the color, design, graphics or any other component to create a unique layout.
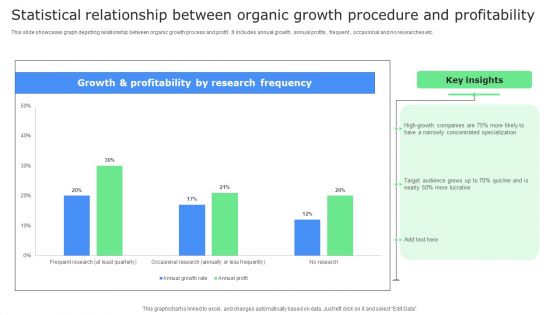
Statistical Relationship Between Organic Growth Procedure And Profitability Rules PDF
This slide showcases graph depicting relationship between organic growth process and profit . It includes annual growth , annual profits , frequent , occasional and no researches etc. Pitch your topic with ease and precision using this Statistical Relationship Between Organic Growth Procedure And Profitability Rules PDF. This layout presents information on Key Insights, Frequency, Profitability. It is also available for immediate download and adjustment. So, changes can be made in the color, design, graphics or any other component to create a unique layout.
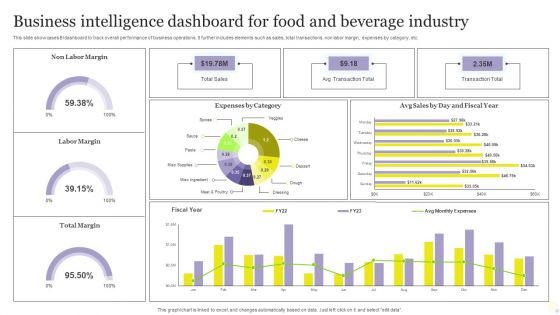
Business Intelligence Dashboard For Food And Beverage Industry Diagrams PDF
This slide showcases BI dashboard to track overall performance of business operations. It further includes elements such as sales, total transactions, non labor margin, expenses by category, etc. Pitch your topic with ease and precision using this Business Intelligence Dashboard For Food And Beverage Industry Diagrams PDF. This layout presents information on Expenses, Sales, Business Intelligence Dashboard. It is also available for immediate download and adjustment. So, changes can be made in the color, design, graphics or any other component to create a unique layout.
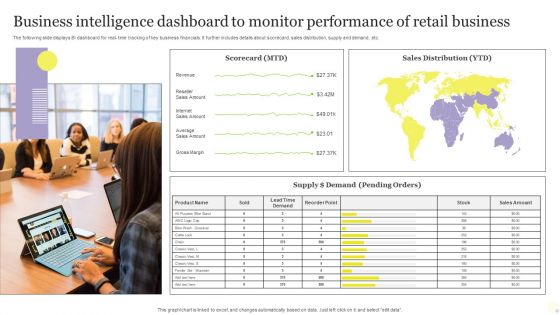
Business Intelligence Dashboard To Monitor Performance Of Retail Business Infographics PDF
The following slide displays BI dashboard for real time tracking of key business financials. It further includes details about scorecard, sales distribution, supply and demand, etc. Pitch your topic with ease and precision using this Business Intelligence Dashboard To Monitor Performance Of Retail Business Infographics PDF. This layout presents information on Business Intelligence Dashboard, Monitor Performance, Retail Business. It is also available for immediate download and adjustment. So, changes can be made in the color, design, graphics or any other component to create a unique layout.
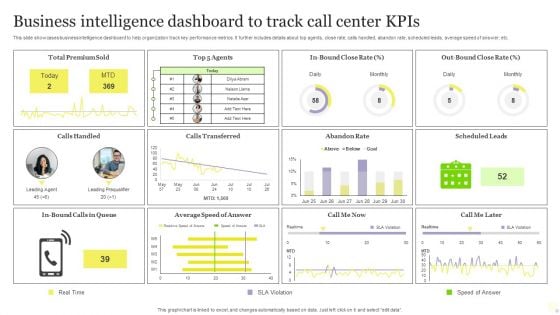
Business Intelligence Dashboard To Track Call Center Kpis Download PDF
This slide showcases business intelligence dashboard to help organization track key performance metrics. It further includes details about top agents, close rate, calls handled, abandon rate, scheduled leads, average speed of answer, etc. Pitch your topic with ease and precision using this Business Intelligence Dashboard To Track Call Center Kpis Download PDF. This layout presents information on Business Intelligence Dashboard, Track Call Center Kpis. It is also available for immediate download and adjustment. So, changes can be made in the color, design, graphics or any other component to create a unique layout.
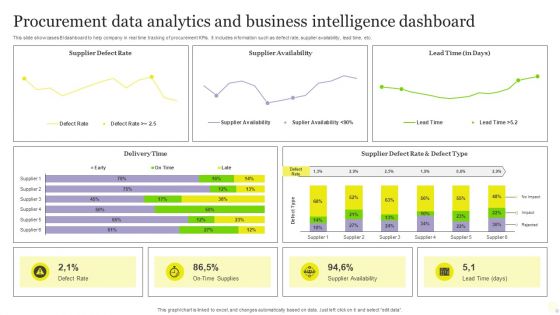
Procurement Data Analytics And Business Intelligence Dashboard Pictures PDF
This slide showcases BI dashboard to help company in real time tracking of procurement KPIs. It includes information such as defect rate, supplier availability, lead time, etc. Pitch your topic with ease and precision using this Procurement Data Analytics And Business Intelligence Dashboard Pictures PDF. This layout presents information on Procurement Data Analytics, Business Intelligence Dashboard. It is also available for immediate download and adjustment. So, changes can be made in the color, design, graphics or any other component to create a unique layout.
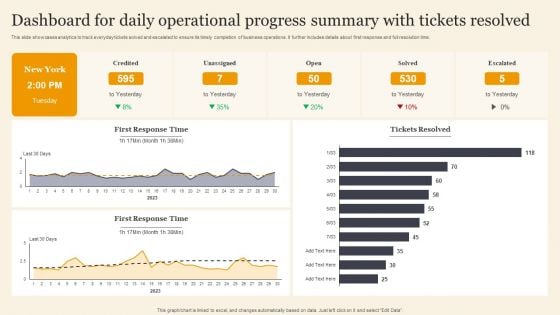
Dashboard For Daily Operational Progress Summary With Tickets Resolved Background PDF
This slide showcases analytics to track everyday tickets solved and escalated to ensure its timely completion of business operations. It further includes details about first response and full resolution time. Pitch your topic with ease and precision using this Dashboard For Daily Operational Progress Summary With Tickets Resolved Background PDF. This layout presents information on Dashboard For Daily Operational, Progress Summary, Tickets Resolved. It is also available for immediate download and adjustment. So, changes can be made in the color, design, graphics or any other component to create a unique layout.
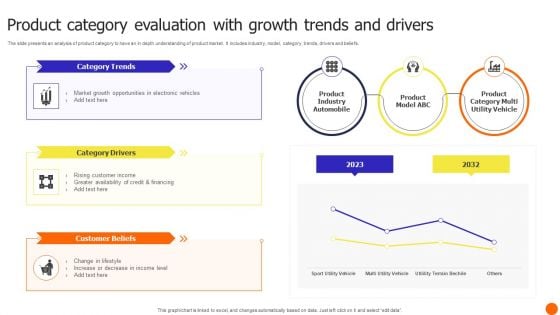
Product Category Evaluation With Growth Trends And Drivers Themes PDF
The slide presents an analysis of product category to have an in depth understanding of product market. It includes industry, model, category, trends, drivers and beliefs. Pitch your topic with ease and precision using this Product Category Evaluation With Growth Trends And Drivers Themes PDF. This layout presents information on Product Industry Automobile, Customer Beliefs, Category Drivers. It is also available for immediate download and adjustment. So, changes can be made in the color, design, graphics or any other component to create a unique layout.
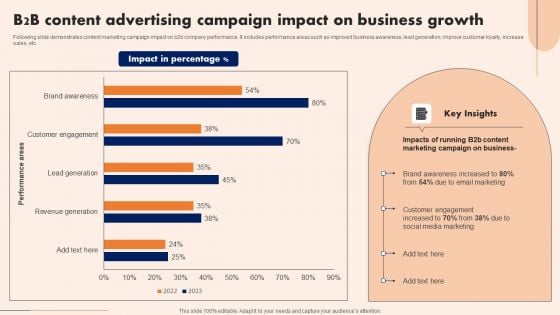
B2B Content Advertising Campaign Impact On Business Growth Sample PDF
Following slide demonstrates content marketing campaign impact on b2b company performance. It includes performance areas such as improved business awareness, lead generation, improve customer loyalty, increase sales, etc. Pitch your topic with ease and precision using this B2B Content Advertising Campaign Impact On Business Growth Sample PDF. This layout presents information on Key Insights, Growth, Marketing . It is also available for immediate download and adjustment. So, changes can be made in the color, design, graphics or any other component to create a unique layout.
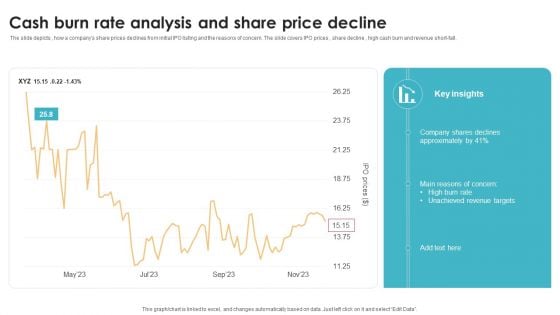
Cash Burn Rate Analysis And Share Price Decline Formats PDF
The slide depicts , how a companys share prices declines from initial IPO listing and the reasons of concern. The slide covers IPO prices , share decline , high cash burn and revenue short-fall. Pitch your topic with ease and precision using this Cash Burn Rate Analysis And Share Price Decline Formats PDF. This layout presents information on Key Insights, Decline, Targets. It is also available for immediate download and adjustment. So, changes can be made in the color, design, graphics or any other component to create a unique layout.
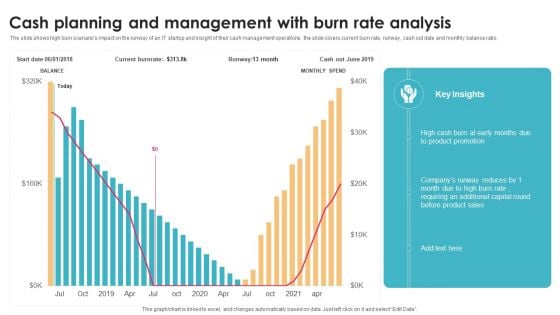
Cash Planning And Management With Burn Rate Analysis Background PDF
The slide shows high burn scenarios impact on the runway of an IT startup and insight of their cash management operations . the slide covers current burn rate, runway, cash out date and monthly balance ratio. Pitch your topic with ease and precision using this Cash Planning And Management With Burn Rate Analysis Background PDF. This layout presents information on Analysis, Key Insights, Product Sales. It is also available for immediate download and adjustment. So, changes can be made in the color, design, graphics or any other component to create a unique layout.
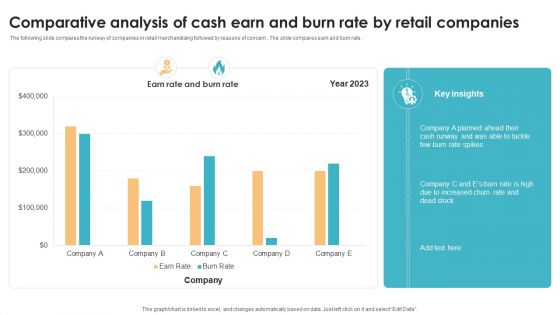
Comparative Analysis Of Cash Earn And Burn Rate By Retail Companies Slides PDF
The following slide compares the runway of companies in retail merchandising followed by reasons of concern . The slide compares earn and burn rate . Pitch your topic with ease and precision using this Comparative Analysis Of Cash Earn And Burn Rate By Retail Companies Slides PDF. This layout presents information on Key Insights, Companies, Company. It is also available for immediate download and adjustment. So, changes can be made in the color, design, graphics or any other component to create a unique layout.
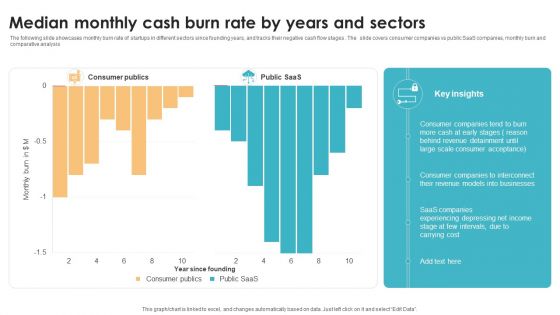
Median Monthly Cash Burn Rate By Years And Sectors Mockup PDF
The following slide showcases monthly burn rate of startups in different sectors since founding years, and tracks their negative cash flow stages . The slide covers consumer companies vs public SaaS companies, monthly burn and comparative analysis Pitch your topic with ease and precision using this Median Monthly Cash Burn Rate By Years And Sectors Mockup PDF. This layout presents information on Sectors, Key Insights, Consumer Acceptance. It is also available for immediate download and adjustment. So, changes can be made in the color, design, graphics or any other component to create a unique layout.
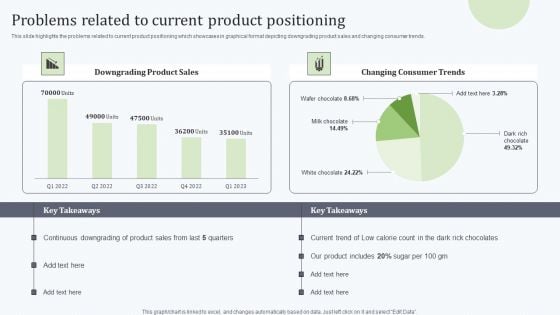
Deploying Revitalization Strategy Enhance Product And Service Sales Problems Related To Current Product Information PDF
This slide highlights the problems related to current product positioning which showcases in graphical format depicting downgrading product sales and changing consumer trends. From laying roadmaps to briefing everything in detail, our templates are perfect for you. You can set the stage with your presentation slides. All you have to do is download these easy to edit and customizable templates. Deploying Revitalization Strategy Enhance Product And Service Sales Problems Related To Current Product Information PDF will help you deliver an outstanding performance that everyone would remember and praise you for. Do download this presentation today.
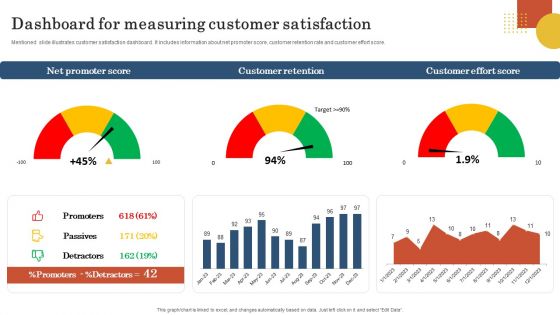
Retail Business Operation Management To Optimize Customer Experience Dashboard Measuring Customer Infographics PDF
Mentioned slide illustrates customer satisfaction dashboard. It includes information about net promoter score, customer retention rate and customer effort score. Present like a pro with Retail Business Operation Management To Optimize Customer Experience Dashboard Measuring Customer Infographics PDF Create beautiful presentations together with your team, using our easy to use presentation slides. Share your ideas in real time and make changes on the fly by downloading our templates. So whether you are in the office, on the go, or in a remote location, you can stay in sync with your team and present your ideas with confidence. With Slidegeeks presentation got a whole lot easier. Grab these presentations today.
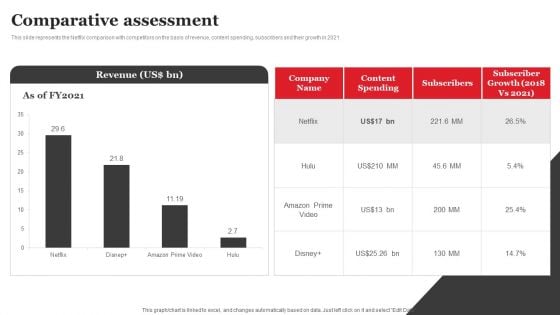
Streaming Platform Company Outline Comparative Assessment Guidelines PDF
This slide represents the Netflix comparison with competitors on the basis of revenue, content spending, subscribers and their growth in 2021. This Streaming Platform Company Outline Comparative Assessment Guidelines PDF from Slidegeeks makes it easy to present information on your topic with precision. It provides customization options, so you can make changes to the colors, design, graphics, or any other component to create a unique layout. It is also available for immediate download, so you can begin using it right away. Slidegeeks has done good research to ensure that you have everything you need to make your presentation stand out. Make a name out there for a brilliant performance.
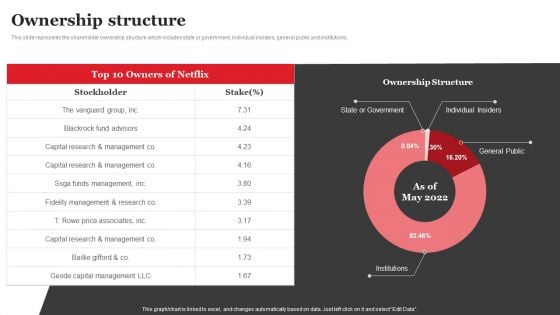
Streaming Platform Company Outline Ownership Structure Brochure PDF
This slide represents the shareholder ownership structure which includes state or government, individual insiders, general public and institutions. Present like a pro with Streaming Platform Company Outline Ownership Structure Brochure PDF Create beautiful presentations together with your team, using our easy to use presentation slides. Share your ideas in real time and make changes on the fly by downloading our templates. So whether you are in the office, on the go, or in a remote location, you can stay in sync with your team and present your ideas with confidence. With Slidegeeks presentation got a whole lot easier. Grab these presentations today.
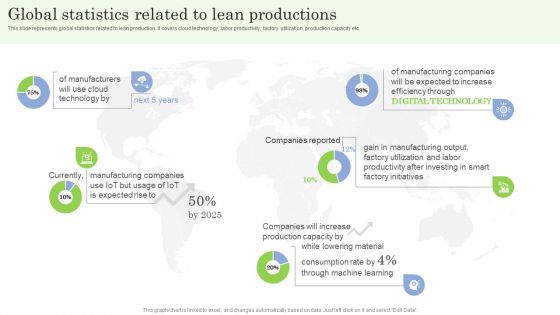
Global Statistics Related To Lean Productions Ppt PowerPoint Presentation File Outline PDF
This slide represents global statistics related to lean production. It covers cloud technology, labor productivity, factory utilization, production capacity etc. Present like a pro with Global Statistics Related To Lean Productions Ppt PowerPoint Presentation File Outline PDF Create beautiful presentations together with your team, using our easy to use presentation slides. Share your ideas in real time and make changes on the fly by downloading our templates. So whether you are in the office, on the go, or in a remote location, you can stay in sync with your team and present your ideas with confidence. With Slidegeeks presentation got a whole lot easier. Grab these presentations today.
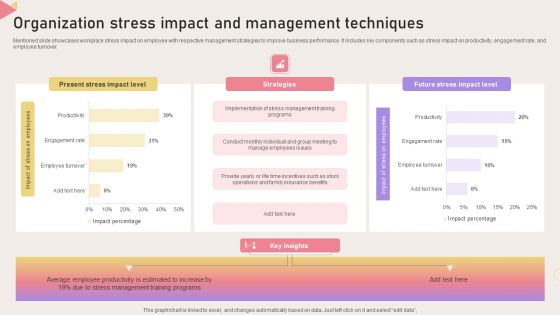
Organization Stress Impact And Management Techniques Sample PDF
Mentioned slide showcases workplace stress impact on employee with respective management strategies to improve business performance. It includes key components such as stress impact on productivity, engagement rate, and employee turnover. Pitch your topic with ease and precision using this Organization Stress Impact And Management Techniques Sample PDF. This layout presents information on Strategies, Impact Level, Technique. It is also available for immediate download and adjustment. So, changes can be made in the color, design, graphics or any other component to create a unique layout.
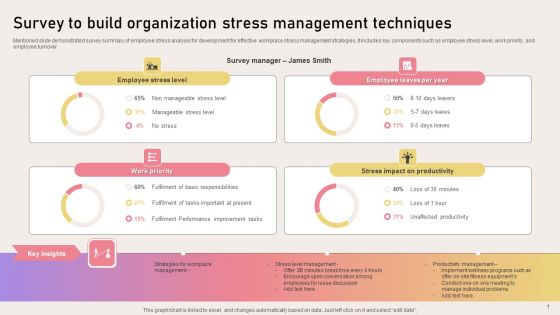
Survey To Build Organization Stress Management Techniques Formats PDF
Mentioned slide demonstrated survey summary of employee stress analysis for development for effective workplace stress management strategies. It includes key components such as employee stress level, work priority. and employee turnover. Pitch your topic with ease and precision using this Survey To Build Organization Stress Management Techniques Formats PDF. This layout presents information on Employee Stress Level, Work Priority, Productivity. It is also available for immediate download and adjustment. So, changes can be made in the color, design, graphics or any other component to create a unique layout.
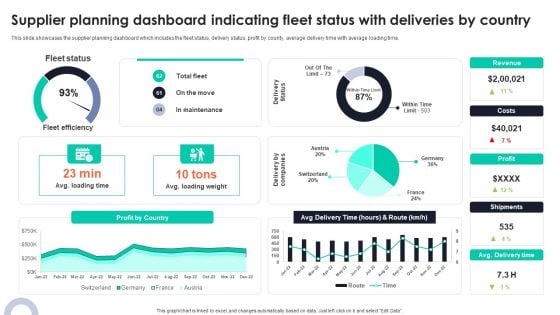
Supplier Planning Dashboard Indicating Fleet Status With Deliveries By Country Graphics PDF
Present like a pro with Supplier Planning Dashboard Indicating Fleet Status With Deliveries By Country Graphics PDF Create beautiful presentations together with your team, using our easy to use presentation slides. Share your ideas in real time and make changes on the fly by downloading our templates. So whether you are in the office, on the go, or in a remote location, you can stay in sync with your team and present your ideas with confidence. With Slidegeeks presentation got a whole lot easier. Grab these presentations today.
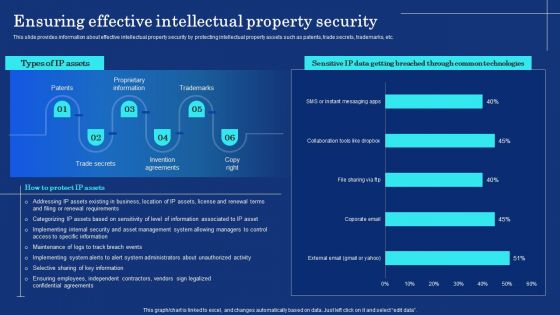
Organizational Assets Security Management Strategy Ensuring Effective Intellectual Property Security Structure PDF
This slide provides information about effective intellectual property security by protecting intellectual property assets such as patents, trade secrets, trademarks, etc. Present like a pro with Organizational Assets Security Management Strategy Ensuring Effective Intellectual Property Security Structure PDF Create beautiful presentations together with your team, using our easy to use presentation slides. Share your ideas in real time and make changes on the fly by downloading our templates. So whether you are in the office, on the go, or in a remote location, you can stay in sync with your team and present your ideas with confidence. With Slidegeeks presentation got a whole lot easier. Grab these presentations today.
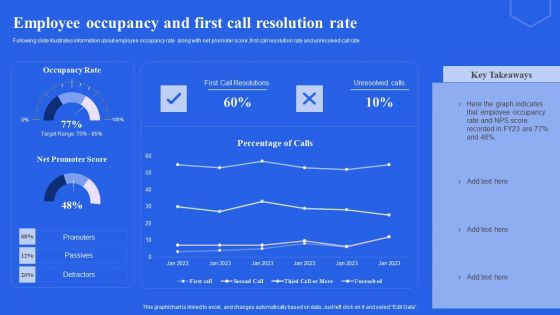
Employee Occupancy And First Call Resolution Rate Ppt Gallery PDF
Following slide illustrates information about employee occupancy rate along with net promoter score, first call resolution rate and unresolved call rate. Present like a pro with Employee Occupancy And First Call Resolution Rate Ppt Gallery PDF Create beautiful presentations together with your team, using our easy to use presentation slides. Share your ideas in real time and make changes on the fly by downloading our templates. So whether you are in the office, on the go, or in a remote location, you can stay in sync with your team and present your ideas with confidence. With Slidegeeks presentation got a whole lot easier. Grab these presentations today.
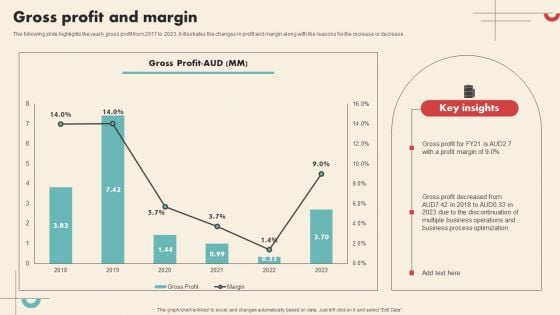
Data Driven Marketing Solutions Firm Company Profile Gross Profit And Margin Information PDF
The following slide highlights the yearly gross profit from 2017 to 2023. it illustrates the changes in profit and margin along with the reasons for the increase or decrease Make sure to capture your audiences attention in your business displays with our gratis customizable Data Driven Marketing Solutions Firm Company Profile Gross Profit And Margin Information PDF. These are great for business strategies, office conferences, capital raising or task suggestions. If you desire to acquire more customers for your tech business and ensure they stay satisfied, create your own sales presentation with these plain slides.
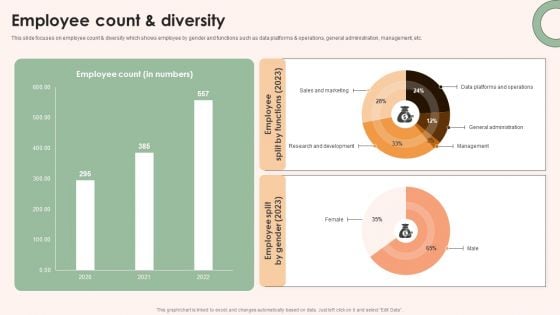
Online Advertising Firm Business Profile Employee Count And Diversity Mockup PDF
This slide focuses on employee count and diversity which shows employee by gender and functions such as data platforms and operations, general administration, management, etc. Present like a pro with Online Advertising Firm Business Profile Employee Count And Diversity Mockup PDF Create beautiful presentations together with your team, using our easy to use presentation slides. Share your ideas in real time and make changes on the fly by downloading our templates. So whether you are in the office, on the go, or in a remote location, you can stay in sync with your team and present your ideas with confidence. With Slidegeeks presentation got a whole lot easier. Grab these presentations today.
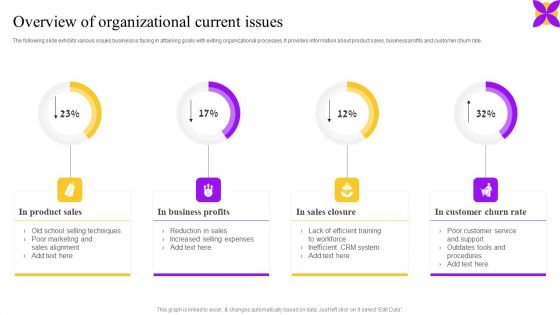
Overview Of Organizational Current Issues Ppt Portfolio Influencers PDF
The following slide exhibits various issues business is facing in attaining goals with exiting organizational processes. It provides information about product sales, business profits and customer churn rate. Present like a pro with Overview Of Organizational Current Issues Ppt Portfolio Influencers PDF Create beautiful presentations together with your team, using our easy to use presentation slides. Share your ideas in real time and make changes on the fly by downloading our templates. So whether you are in the office, on the go, or in a remote location, you can stay in sync with your team and present your ideas with confidence. With Slidegeeks presentation got a whole lot easier. Grab these presentations today.

Global Construction Sector Industry Report Key Market Players In Construction Industry Guidelines PDF
This slide represents key market players in construction industry. It includes Bechtel, Fluor, ARCOM, turner and Skanska corporation leading construction market. Present like a pro with Global Construction Sector Industry Report Key Market Players In Construction Industry Guidelines PDF Create beautiful presentations together with your team, using our easy to use presentation slides. Share your ideas in real time and make changes on the fly by downloading our templates. So whether you are in the office, on the go, or in a remote location, you can stay in sync with your team and present your ideas with confidence. With Slidegeeks presentation got a whole lot easier. Grab these presentations today.
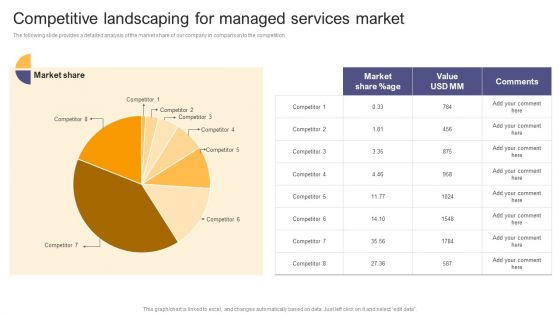
Per Device Pricing Strategy For Managed Solutions Competitive Landscaping For Managed Services Market Guidelines PDF
The following slide provides a detailed analysis of the market share of our company in comparison to the competition. Present like a pro with Per Device Pricing Strategy For Managed Solutions Competitive Landscaping For Managed Services Market Guidelines PDF Create beautiful presentations together with your team, using our easy to use presentation slides. Share your ideas in real time and make changes on the fly by downloading our templates. So whether you are in the office, on the go, or in a remote location, you can stay in sync with your team and present your ideas with confidence. With Slidegeeks presentation got a whole lot easier. Grab these presentations today.
Application Performance Dashboard Ppt Icon Template PDF
This slide covers application performance in market KPIs and metrics such as impressions, clicks, searches for app, conversion rate etc. This Application Performance Dashboard Ppt Icon Template PDF from Slidegeeks makes it easy to present information on your topic with precision. It provides customization options, so you can make changes to the colors, design, graphics, or any other component to create a unique layout. It is also available for immediate download, so you can begin using it right away. Slidegeeks has done good research to ensure that you have everything you need to make your presentation stand out. Make a name out there for a brilliant performance.
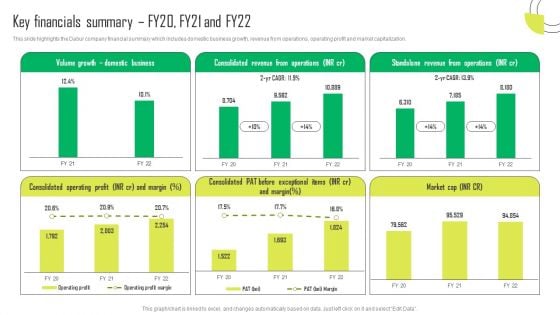
Herbal Products Company Profile Key Financials Summary FY20 FY21 And FY22 Background PDF
This slide highlights the Dabur company financial summary which includes domestic business growth, revenue from operations, operating profit and market capitalization. Present like a pro with Herbal Products Company Profile Key Financials Summary FY20 FY21 And FY22 Background PDF Create beautiful presentations together with your team, using our easy to use presentation slides. Share your ideas in real time and make changes on the fly by downloading our templates. So whether you are in the office, on the go, or in a remote location, you can stay in sync with your team and present your ideas with confidence. With Slidegeeks presentation got a whole lot easier. Grab these presentations today.
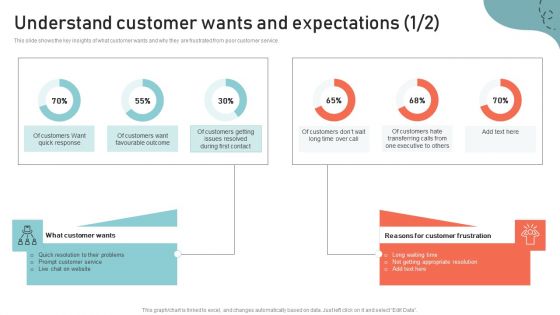
Optimizing Multichannel Strategy To Improve User Experience Understand Customer Sample PDF
This slide shows the key insights of what customer wants and why they are frustrated from poor customer service. This Optimizing Multichannel Strategy To Improve User Experience Understand Customer Sample PDF from Slidegeeks makes it easy to present information on your topic with precision. It provides customization options, so you can make changes to the colors, design, graphics, or any other component to create a unique layout. It is also available for immediate download, so you can begin using it right away. Slidegeeks has done good research to ensure that you have everything you need to make your presentation stand out. Make a name out there for a brilliant performance.
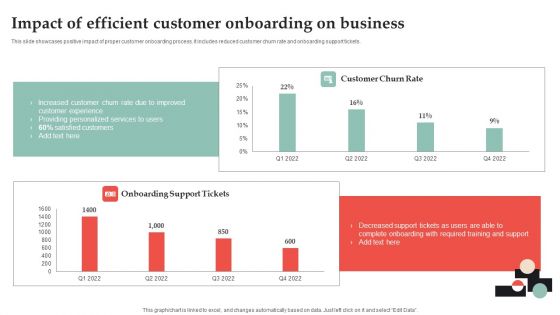
Customer Onboarding Journey Optimization Plan Impact Of Efficient Customer Graphics PDF
This slide showcases positive impact of proper customer onboarding process. It includes reduced customer churn rate and onboarding support tickets. This Customer Onboarding Journey Optimization Plan Impact Of Efficient Customer Graphics PDF from Slidegeeks makes it easy to present information on your topic with precision. It provides customization options, so you can make changes to the colors, design, graphics, or any other component to create a unique layout. It is also available for immediate download, so you can begin using it right away. Slidegeeks has done good research to ensure that you have everything you need to make your presentation stand out. Make a name out there for a brilliant performance.
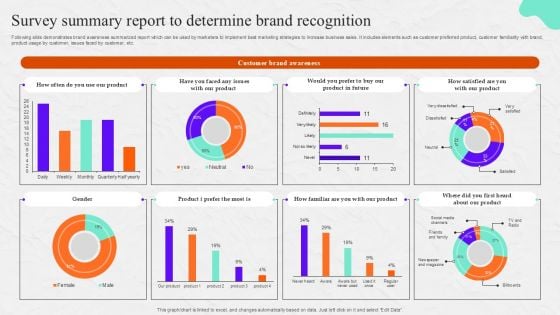
Survey Summary Report To Determine Brand Recognition Survey SS
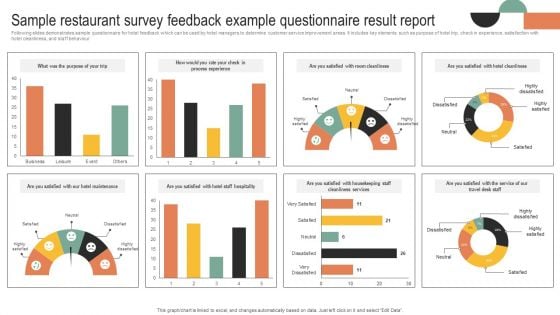
Sample Restaurant Survey Feedback Example Questionnaire Result Report Survey SS
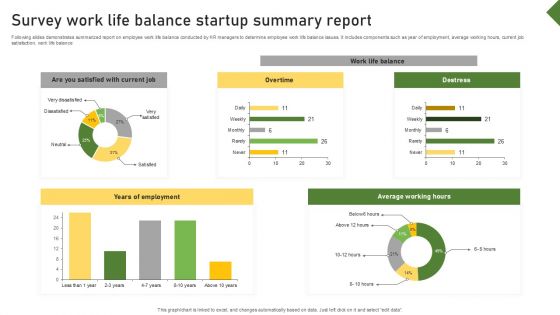
Survey Work Life Balance Startup Summary Report Survey SS
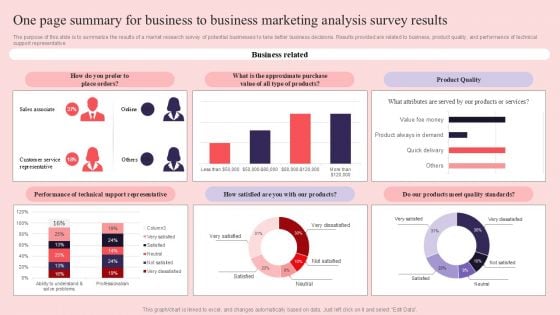
One Page Summary For Business To Business Marketing Analysis Survey Results Survey SS
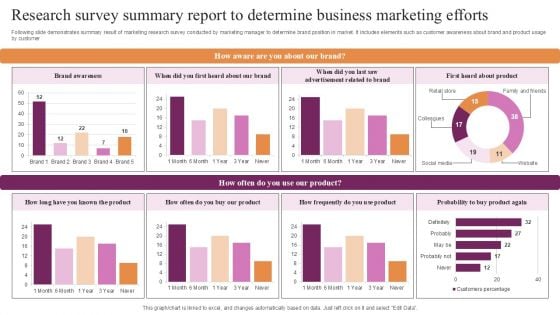
Research Survey Summary Report To Determine Business Marketing Efforts Survey SS
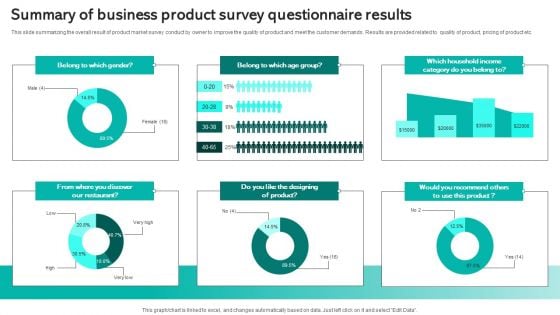
Summary Of Business Product Survey Questionnaire Results Survey SS
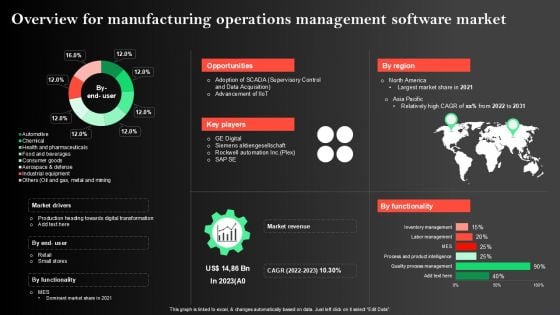
Manufacturing Operations Management Process Overview For Manufacturing Operations Microsoft PDF
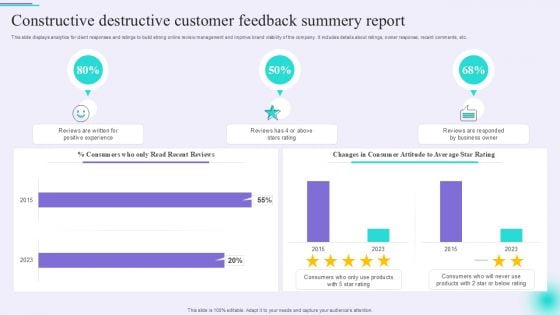
Constructive Destructive Customer Feedback Summery Report Inspiration PDF
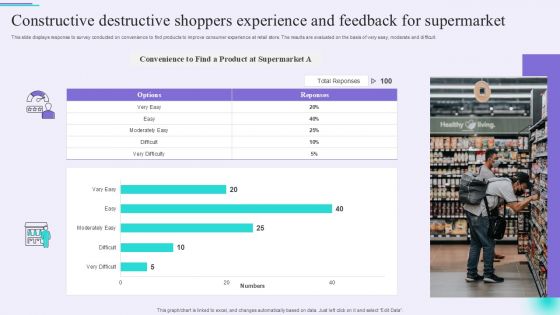
Constructive Destructive Shoppers Experience And Feedback For Supermarket Clipart PDF
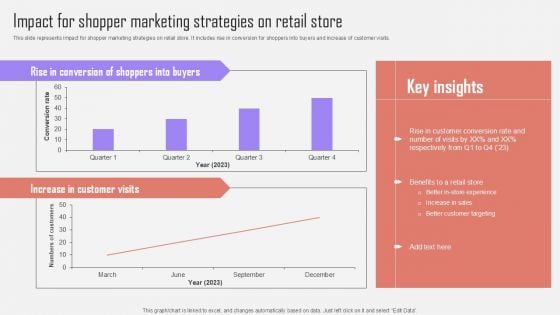
Impact For Shopper Marketing Strategies Retail Store Optimizing Customer Purchase Experience By Executing Clipart PDF
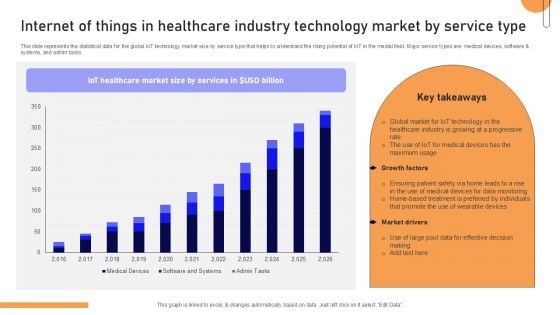
Internet Of Things In Healthcare Industry Technology Market By Service Type Background PDF
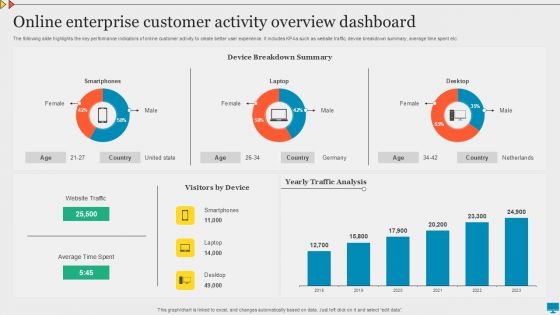
Online Enterprise Customer Activity Overview Dashboard Download PDF
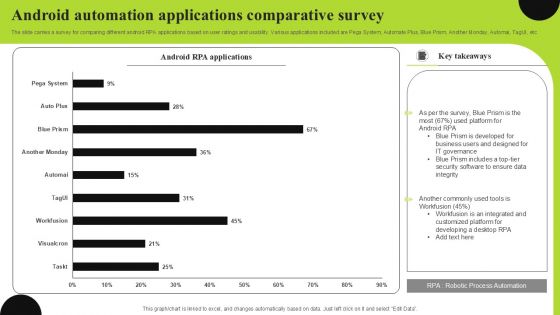
Android Automation Applications Comparative Survey Pictures PDF
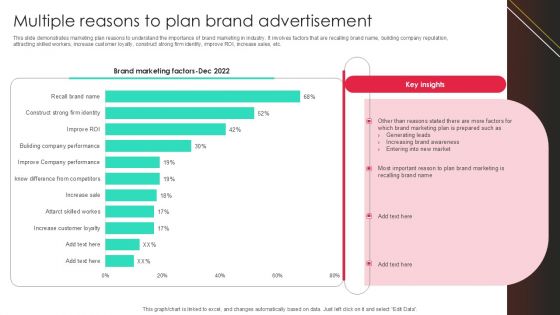
Multiple Reasons To Plan Brand Advertisement Clipart PDF
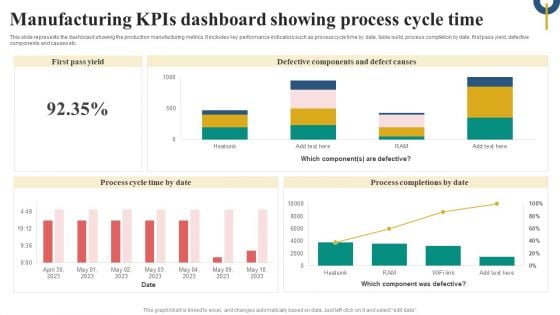
Manufacturing Kpis Dashboard Showing Process Cycle Time Microsoft PDF
This slide represents the dashboard showing the production manufacturing metrics. It includes key performance indicators such as process cycle time by date, table build, process completion by date, first pass yield, defective components and causes etc. Pitch your topic with ease and precision using this Manufacturing Kpis Dashboard Showing Process Cycle Time Microsoft PDF. This layout presents information on Defective Components Defect Causes, Process Cycle, Time By Date, Process Completions By Date. It is also available for immediate download and adjustment. So, changes can be made in the color, design, graphics or any other component to create a unique layout.
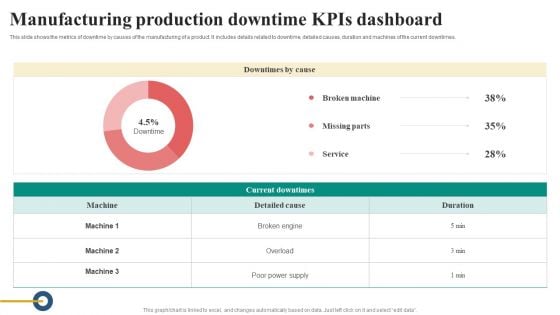
Manufacturing Production Downtime Kpis Dashboard Diagrams PDF
This slide shows the metrics of downtime by causes of the manufacturing of a product. It includes details related to downtime, detailed causes, duration and machines of the current downtimes. Pitch your topic with ease and precision using this Manufacturing Production Downtime Kpis Dashboard Diagrams PDF. This layout presents information on Details Related To Downtime, Detailed Causes, Duration And Machines, Current Downtimes. It is also available for immediate download and adjustment. So, changes can be made in the color, design, graphics or any other component to create a unique layout.
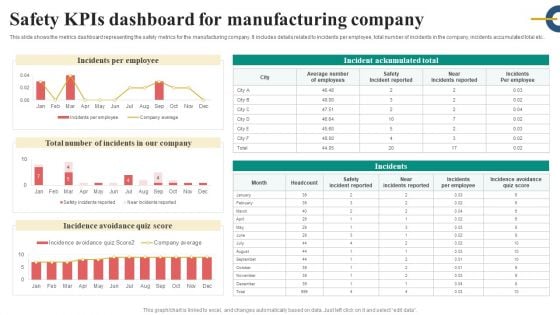
Safety Kpis Dashboard For Manufacturing Company Slides PDF
This slide shows the metrics dashboard representing the safety metrics for the manufacturing company. It includes details related to incidents per employee, total number of incidents in the company, incidents accumulated total etc.. Pitch your topic with ease and precision using this Safety Kpis Dashboard For Manufacturing Company Slides PDF. This layout presents information on Incidents Per Employee, Safety Incident Reported, Incidence Avoidance Quiz Score. It is also available for immediate download and adjustment. So, changes can be made in the color, design, graphics or any other component to create a unique layout.


 Continue with Email

 Home
Home


