Budget Dashboard
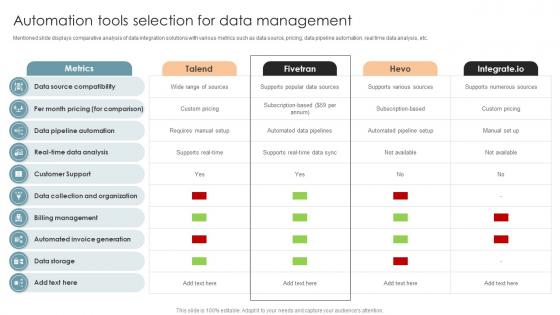
Automation Tools Selection For Data Management Office Process Optimization To Increase Cost Efficiency
Mentioned slide displays comparative analysis of data integration solutions with various metrics such as data source, pricing, data pipeline automation, real time data analysis, etc.There are so many reasons you need a Automation Tools Selection For Data Management Office Process Optimization To Increase Cost Efficiency. The first reason is you can not spend time making everything from scratch, Thus, Slidegeeks has made presentation templates for you too. You can easily download these templates from our website easily. Mentioned slide displays comparative analysis of data integration solutions with various metrics such as data source, pricing, data pipeline automation, real time data analysis, etc.
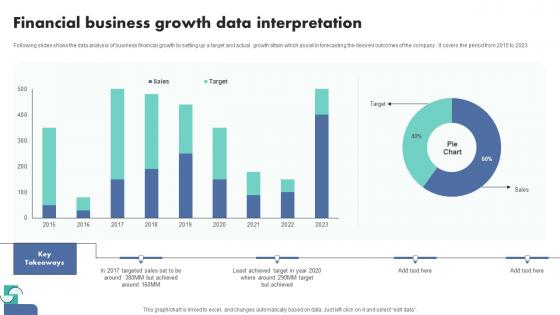
Financial Business Growth Data Interpretation Themes Pdf
Following slides shows the data analysis of business financial growth by setting up a target and actual growth attain which assist in forecasting the desired outcomes of the company . It covers the period from 2015 to 2023.Pitch your topic with ease and precision using this Financial Business Growth Data Interpretation Themes Pdf This layout presents information on Financial Business, Growth Data Interpretation It is also available for immediate download and adjustment. So, changes can be made in the color, design, graphics or any other component to create a unique layout. Following slides shows the data analysis of business financial growth by setting up a target and actual growth attain which assist in forecasting the desired outcomes of the company . It covers the period from 2015 to 2023.
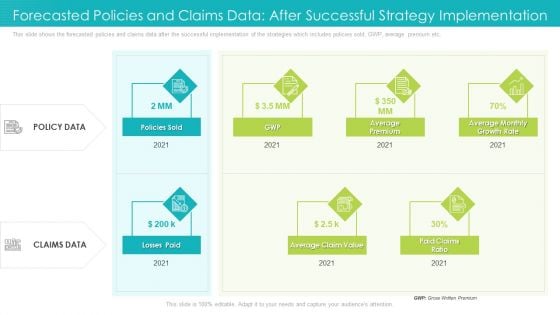
Forecasted Policies And Claims Data After Successful Strategy Implementation Ppt Model Introduction PDF
This slide shows the forecasted policies and claims data after the successful implementation of the strategies which includes policies sold, GWP, average premium etc. This is a forecasted policies and claims data after successful strategy implementation ppt model introduction pdf template with various stages. Focus and dispense information on two stages using this creative set, that comes with editable features. It contains large content boxes to add your information on topics like average premium, paid claims ratio, 2021. You can also showcase facts, figures, and other relevant content using this PPT layout. Grab it now.
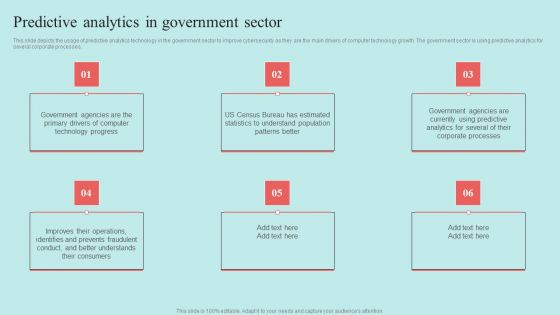
Predictive Data Model Predictive Analytics In Government Sector Graphics PDF
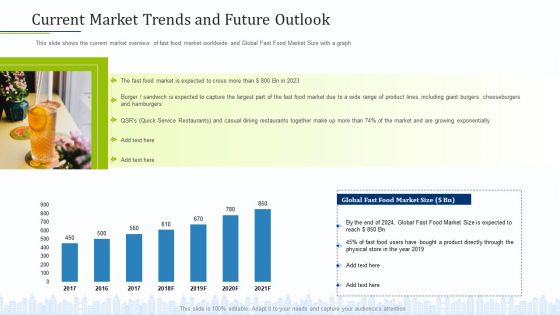
Pitch Deck To Draw External Capital From Commercial Banking Institution Current Market Trends And Future Outlook Background PDF
This slide shows the current market overview of fast food market worldwide and Global Fast Food Market Size with a graph Deliver an awe-inspiring pitch with this creative pitch deck to draw external capital from commercial banking institution current market trends and future outlook background pdf bundle. Topics like global fast food market size, global fast food market size is expected, exponentially can be discussed with this completely editable template. It is available for immediate download depending on the needs and requirements of the user.
Financial Calculations Sumbols And Signs Vector Ilustration Ppt PowerPoint Presentation File Inspiration PDF
Presenting this set of slides with name financial calculations sumbols and signs vector ilustration ppt powerpoint presentation file inspiration pdf. This is a three stage process. The stages in this process are financial calculations sumbols and signs vector ilustration. This is a completely editable PowerPoint presentation and is available for immediate download. Download now and impress your audience.
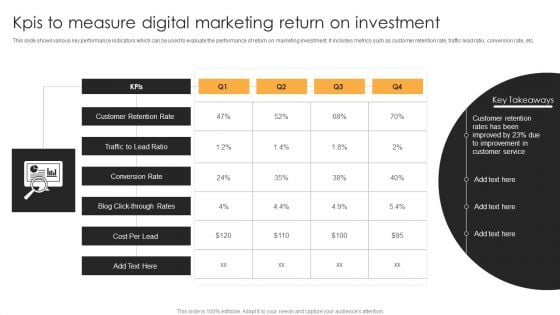
Kpis To Measure Digital Marketing Return On Investment Mockup PDF
This slide shows various key performance indicators which can be used to evaluate the performance of return on marketing investment. It includes metrics such as customer retention rate, traffic lead ratio, conversion rate, etc. Pitch your topic with ease and precision using this Kpis To Measure Digital Marketing Return On Investment Mockup PDF. This layout presents information on Conversion Rate, Traffic To Lead Ratio, Customer Retention Rate. It is also available for immediate download and adjustment. So, changes can be made in the color, design, graphics or any other component to create a unique layout.
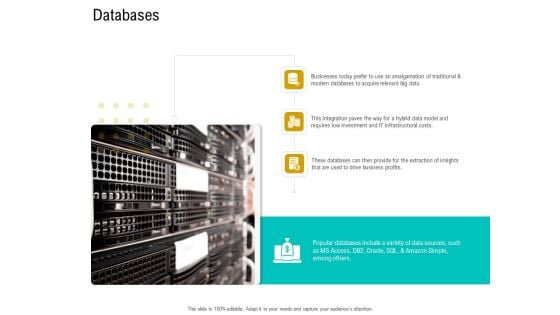
Business Data Analysis Databases Download PDF
Deliver an awe inspiring pitch with this creative business data analysis databases download pdf bundle. Topics like amalgamation of traditional, this integration paves the way for a hybrid data model and requires low investment and it infrastructural costs, these databases can then provide for the extraction of insights that are used to drive business profits. can be discussed with this completely editable template. It is available for immediate download depending on the needs and requirements of the user.
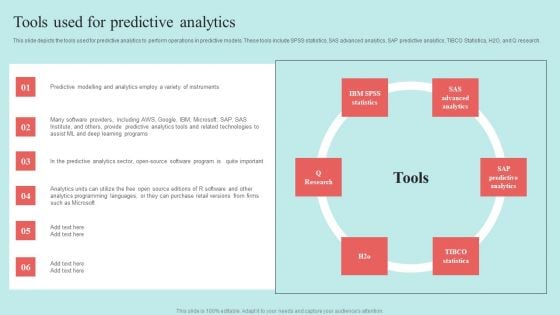
Predictive Data Model Tools Used For Predictive Analytics Download PDF

Predictive Analytics In The Age Of Big Data How Businesses Use Predictive Analytics Introduction PDF
This slide depicts the importance of predictive analytics that covers detecting fraud, improving operations, optimizing marketing campaigns, and reducing risks. Predictive analytics is being used by businesses to fix complex challenges and identify new possibilities. Do you have to make sure that everyone on your team knows about any specific topic I yes, then you should give Predictive Analytics In The Age Of Big Data How Businesses Use Predictive Analytics Introduction PDF a try. Our experts have put a lot of knowledge and effort into creating this impeccable Predictive Analytics In The Age Of Big Data How Businesses Use Predictive Analytics Introduction PDF. You can use this template for your upcoming presentations, as the slides are perfect to represent even the tiniest detail. You can download these templates from the Slidegeeks website and these are easy to edit. So grab these today.

Retail Industry Outlook Retail Market Trends Introduction PDF
Presenting retail industry outlook retail market trends introduction pdf. to provide visual cues and insights. Share and navigate important information on seven stages that need your due attention. This template can be used to pitch topics like procurement, manufacturing, integrated supply chain, research and product development. In addtion, this PPT design contains high resolution images, graphics, etc, that are easily editable and available for immediate download.
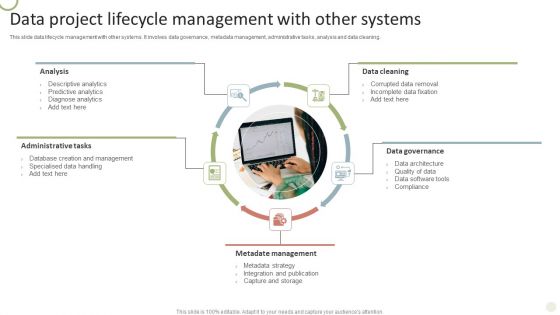
Data Project Lifecycle Management With Other Systems Portrait PDF
This slide data lifecycle management with other systems. It involves data governance, metadata management, administrative tasks, analysis and data cleaning.Persuade your audience using this Data Project Lifecycle Management With Other Systems Portrait PDF. This PPT design covers five stages, thus making it a great tool to use. It also caters to a variety of topics including Descriptive Analytics, Predictive Analytics, Diagnose Analytics. Download this PPT design now to present a convincing pitch that not only emphasizes the topic but also showcases your presentation skills.
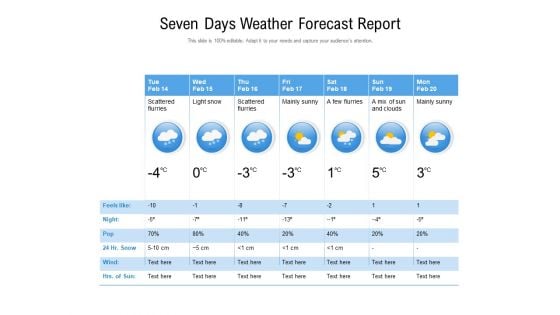
Seven Days Weather Forecast Report Ppt PowerPoint Presentation Professional Deck
Presenting this set of slides with name seven days weather forecast report ppt powerpoint presentation professional deck. The topics discussed in these slide is seven days weather forecast report. This is a completely editable PowerPoint presentation and is available for immediate download. Download now and impress your audience.
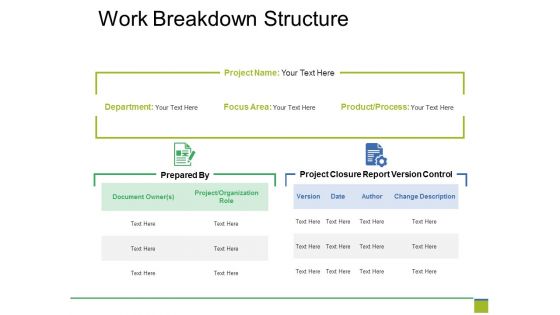
Work Breakdown Structure Ppt PowerPoint Presentation Professional Rules
This is a work breakdown structure ppt powerpoint presentation professional rules. This is a two stage process. The stages in this process are project name, department, focus area, product, project closure report version control.
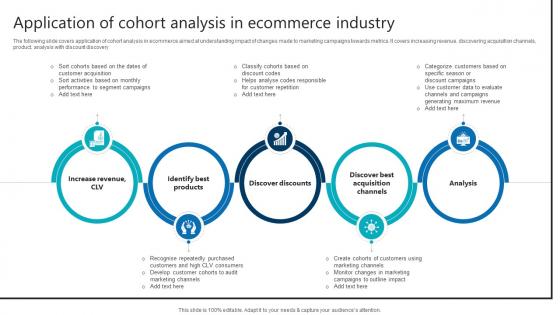
Application Of Cohort Analysis In Ecommerce Industry Product Analytics Implementation Data Analytics V
The following slide covers application of cohort analysis in ecommerce aimed at understanding impact of changes made to marketing campaigns towards metrics. It covers increasing revenue, discovering acquisition channels, product, analysis with discount discovery Boost your pitch with our creative Application Of Cohort Analysis In Ecommerce Industry Product Analytics Implementation Data Analytics V. Deliver an awe-inspiring pitch that will mesmerize everyone. Using these presentation templates you will surely catch everyones attention. You can browse the ppts collection on our website. We have researchers who are experts at creating the right content for the templates. So you do not have to invest time in any additional work. Just grab the template now and use them. The following slide covers application of cohort analysis in ecommerce aimed at understanding impact of changes made to marketing campaigns towards metrics. It covers increasing revenue, discovering acquisition channels, product, analysis with discount discovery

Data Analysis Excel 3d Pie Chart For Marketing Process PowerPoint Templates
Our data analysis excel 3d pie chart for marketing process Powerpoint Templates Team Are A Dogged Lot. They Keep At It Till They Get It Right.
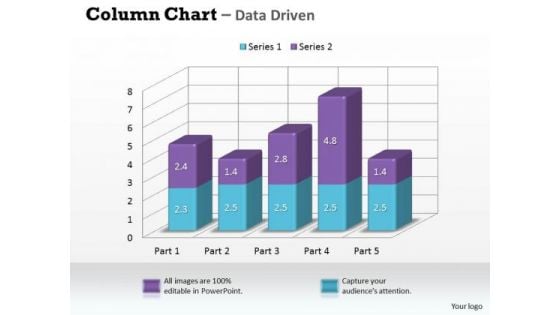
Data Analysis In Excel 3d Column Chart For Market Surveys PowerPoint Templates
Our data analysis in excel 3d column chart for market surveys Powerpoint Templates Leave No One In Doubt. Provide A Certainty To Your Views.
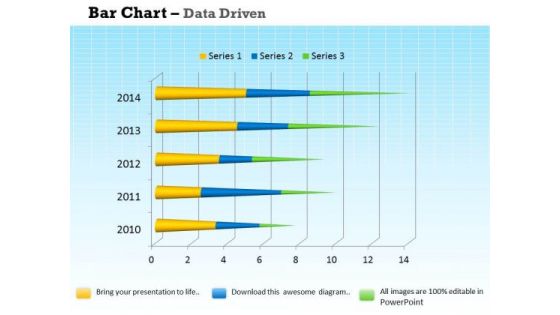
Data Analysis Programs 3d Bar Chart For Market Surveys PowerPoint Templates
Draw On The Experience Of Our data analysis programs 3d bar chart for market surveys Powerpoint Templates . They Imbibe From Past Masters.
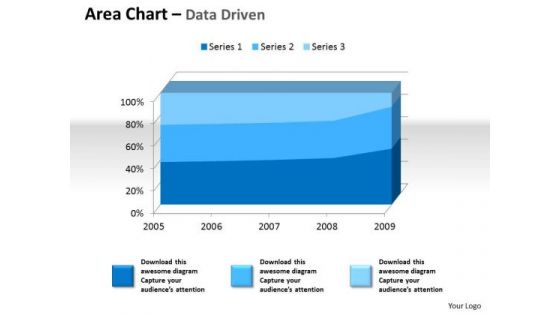
Examples Of Data Analysis Market 3d Area Chart For Quantiative PowerPoint Templates
Drum It Up With Our examples of data analysis market 3d area chart for quantiative Powerpoint Templates . Your Thoughts Will Raise The Tempo.
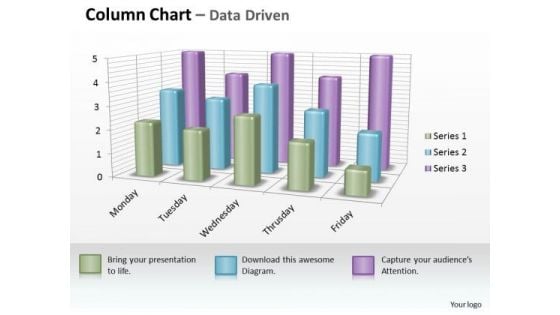
Examples Of Data Analysis Market 3d Business Inspection Procedure Chart PowerPoint Templates
However Dry Your Topic Maybe. Make It Catchy With Our examples of data analysis market 3d business inspection procedure chart Powerpoint Templates .
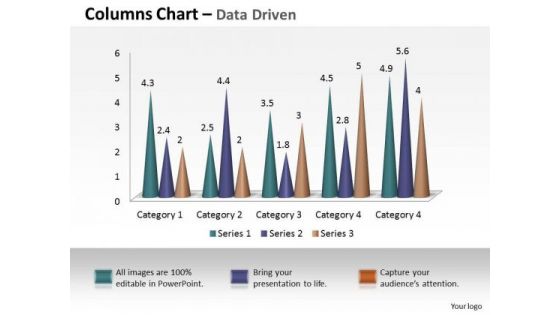
Examples Of Data Analysis Market 3d Business Intelligence And PowerPoint Templates
Our examples of data analysis market 3d business intelligence and Powerpoint Templates Are Dual Purpose. They Help Instruct And Inform At The Same Time.
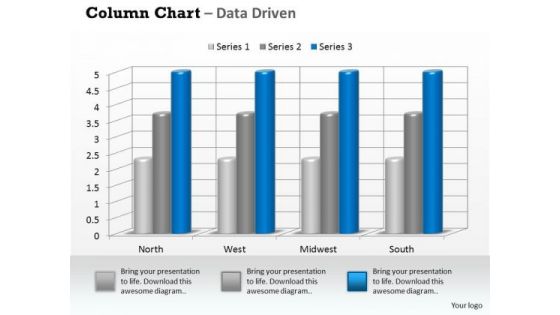
Examples Of Data Analysis Market 3d Business On Regular Intervals PowerPoint Templates
Drum It Out Loud And Clear On Our examples of data analysis market 3d business on regular intervals Powerpoint Templates . Your Words Will Ring In Their Ears.
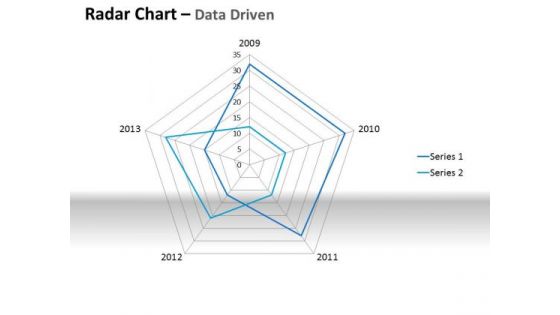
Examples Of Data Analysis Market Driven Plotting The Business Values PowerPoint Slides Templates
Ring The Duck With Our examples of data analysis market driven plotting the business values powerpoint slides Templates . Acquire The Points With Your Ideas.
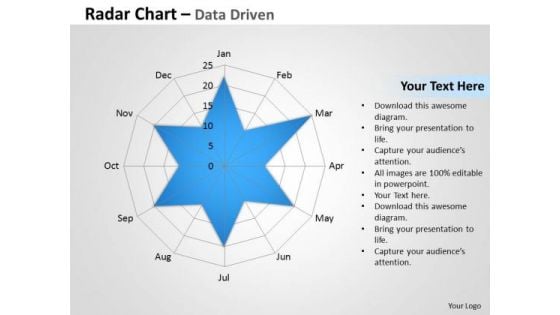
Examples Of Data Analysis Market Driven Radar Chart To Compare PowerPoint Slides Templates
Rely On Our examples of data analysis market driven radar chart to compare powerpoint slides Templates In Any Duel. They Will Drive Home Your Point.
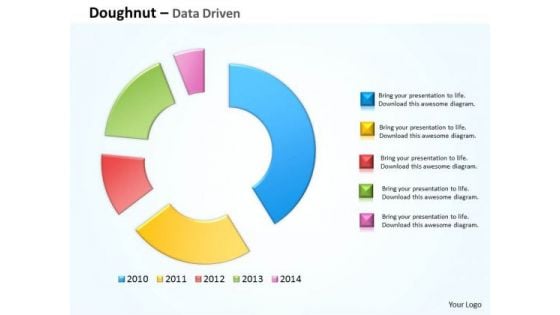
Financial Data Analysis Driven Compare Market Share Of Brand PowerPoint Templates
Doll Up Your Thoughts With Our financial data analysis driven compare market share of brand Powerpoint Templates . They Will Make A Pretty Picture.
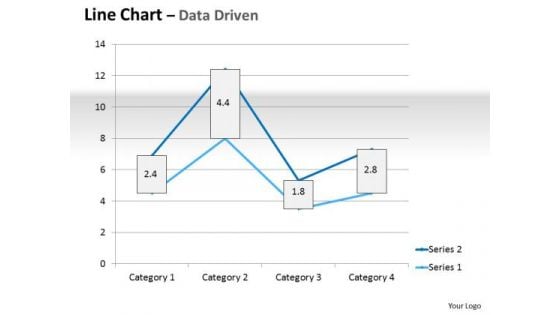
Multivariate Data Analysis Driven Line Chart Market Graph PowerPoint Slides Templates
Plan For All Contingencies With Our multivariate data analysis driven line chart market graph powerpoint slides Templates . Douse The Fire Before It Catches.
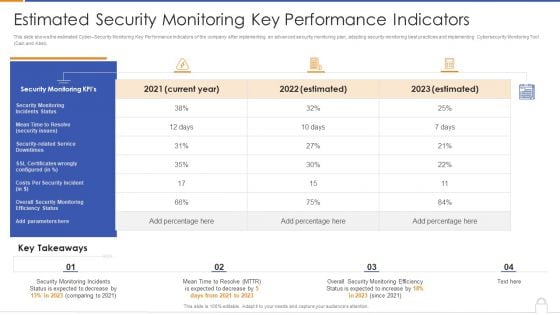
Estimated Security Monitoring Key Performance Indicators Diagrams PDF
Deliver and pitch your topic in the best possible manner with this estimated security monitoring key performance indicators diagrams pdf. Use them to share invaluable insights on security monitoring, security related service downtimes, overall security monitoring and impress your audience. This template can be altered and modified as per your expectations. So, grab it now.
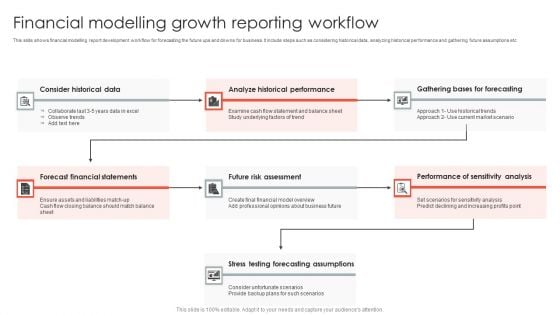
Financial Modelling Growth Reporting Workflow Formats PDF
This slide shows financial modelling report development workflow for forecasting the future ups and downs for business. It include steps such as considering historical data, analyzing historical performance and gathering future assumptions etc. Pitch your topic with ease and precision using this Financial Modelling Growth Reporting Workflow Formats PDF. This layout presents information on Forecast Financial Statements, Risk Assessment, Forecasting Assumptions. It is also available for immediate download and adjustment. So, changes can be made in the color, design, graphics or any other component to create a unique layout.

Data Collection Storage And Analysis Strategies DT SS V
This slide present various digital strategies for effective data collection, storage, and analysis to improve data-based decision making. It includes customer feedback and surveys, cloud-based solutions, data visualization tools , etc. Coming up with a presentation necessitates that the majority of the effort goes into the content and the message you intend to convey. The visuals of a PowerPoint presentation can only be effective if it supplements and supports the story that is being told. Keeping this in mind our experts created Data Collection Storage And Analysis Strategies DT SS V to reduce the time that goes into designing the presentation. This way, you can concentrate on the message while our designers take care of providing you with the right template for the situation. This slide present various digital strategies for effective data collection, storage, and analysis to improve data-based decision making. It includes customer feedback and surveys, cloud-based solutions, data visualization tools , etc.
E Commerce Company Marketing Business Case Icon Ppt Designs PDF
Presenting E Commerce Company Marketing Business Case Icon Ppt Designs PDF to dispense important information. This template comprises three stages. It also presents valuable insights into the topics including E Commerce Company, Marketing Business, Case Icon. This is a completely customizable PowerPoint theme that can be put to use immediately. So, download it and address the topic impactfully.
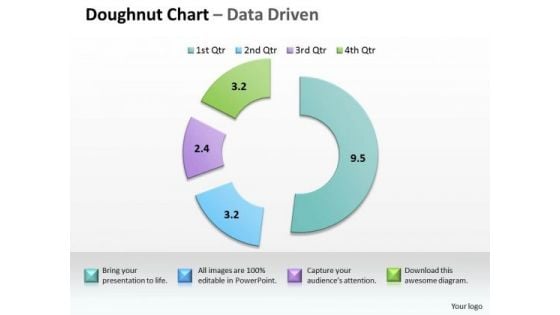
Data Analysis In Excel Completion Project Management PowerPoint Templates
Touch Base With Our data analysis in excel completion project management Powerpoint Templates . Review Your Growth With Your Audience.
Statistical Data Graph Icon Showing Financial Forecast Rules PDF
Presenting statistical data graph icon showing financial forecast rules pdf to dispense important information. This template comprises four stages. It also presents valuable insights into the topics including statistical data graph icon showing financial forecast. This is a completely customizable PowerPoint theme that can be put to use immediately. So, download it and address the topic impactfully.
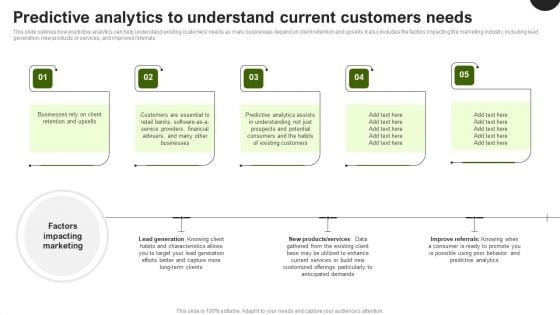
Predictive Analytics In The Age Of Big Data Predictive Analytics To Understand Current Customers Professional PDF
This slide outlines how predictive analytics can help understand existing customers needs as many businesses depend on client retention and upsells. It also includes the factors impacting the marketing industry, including lead generation, new products or services, and improved referrals. Here you can discover an assortment of the finest PowerPoint and Google Slides templates. With these templates, you can create presentations for a variety of purposes while simultaneously providing your audience with an eye catching visual experience. Download Predictive Analytics In The Age Of Big Data Predictive Analytics To Understand Current Customers Professional PDF to deliver an impeccable presentation. These templates will make your job of preparing presentations much quicker, yet still, maintain a high level of quality. Slidegeeks has experienced researchers who prepare these templates and write high quality content for you. Later on, you can personalize the content by editing the Predictive Analytics In The Age Of Big Data Predictive Analytics To Understand Current Customers Professional PDF.

Storage Resource Management Ppt Slides
This is a storage resource management ppt slides. This is a one stage process. The stages in this process are data collection, analysis report generation, qsm repository, threshold checker, presentation.\n\n\n\n\n\n

Comparing Overall Business Performance Objectives And Key Result Methodology For Business
The following slide highlights some key performance indicators to compare business performance with industry standards to formulate strategies and fill the gap. It includes elements such as website traffic, customer acquisition cost, employee satisfaction rate, customer churn rate, sales revenue etc. From laying roadmaps to briefing everything in detail, our templates are perfect for you. You can set the stage with your presentation slides. All you have to do is download these easy-to-edit and customizable templates. Comparing Overall Business Performance Objectives And Key Result Methodology For Business will help you deliver an outstanding performance that everyone would remember and praise you for. Do download this presentation today. The following slide highlights some key performance indicators to compare business performance with industry standards to formulate strategies and fill the gap. It includes elements such as website traffic, customer acquisition cost, employee satisfaction rate, customer churn rate, sales revenue etc.
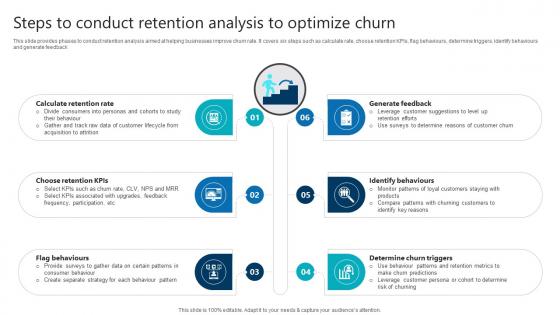
Steps To Conduct Retention Analysis To Optimize Churn Product Analytics Implementation Data Analytics V
This slide provides phases to conduct retention analysis aimed at helping businesses improve churn rate. It covers six steps such as calculate rate, choose retention KPIs, flag behaviours, determine triggers, identify behaviours and generate feedback This Steps To Conduct Retention Analysis To Optimize Churn Product Analytics Implementation Data Analytics V is perfect for any presentation, be it in front of clients or colleagues. It is a versatile and stylish solution for organizing your meetings. The Steps To Conduct Retention Analysis To Optimize Churn Product Analytics Implementation Data Analytics V features a modern design for your presentation meetings. The adjustable and customizable slides provide unlimited possibilities for acing up your presentation. Slidegeeks has done all the homework before launching the product for you. So, do not wait, grab the presentation templates today This slide provides phases to conduct retention analysis aimed at helping businesses improve churn rate. It covers six steps such as calculate rate, choose retention KPIs, flag behaviours, determine triggers, identify behaviours and generate feedback
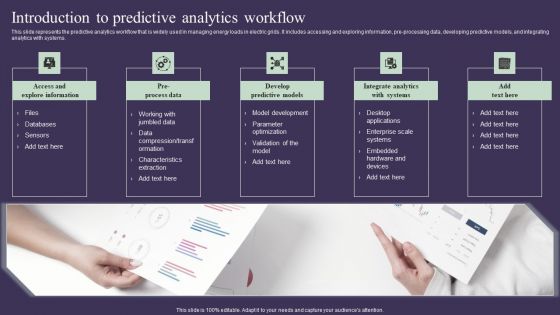
Projection Model Introduction To Predictive Analytics Workflow Microsoft PDF
This slide represents the predictive analytics workflow that is widely used in managing energy loads in electric grids. It includes accessing and exploring information, pre-processing data, developing predictive models, and integrating analytics with systems. Formulating a presentation can take up a lot of effort and time, so the content and message should always be the primary focus. The visuals of the PowerPoint can enhance the presenters message, so our Projection Model Introduction To Predictive Analytics Workflow Microsoft PDF was created to help save time. Instead of worrying about the design, the presenter can concentrate on the message while our designers work on creating the ideal templates for whatever situation is needed. Slidegeeks has experts for everything from amazing designs to valuable content, we have put everything into Projection Model Introduction To Predictive Analytics Workflow Microsoft PDF.
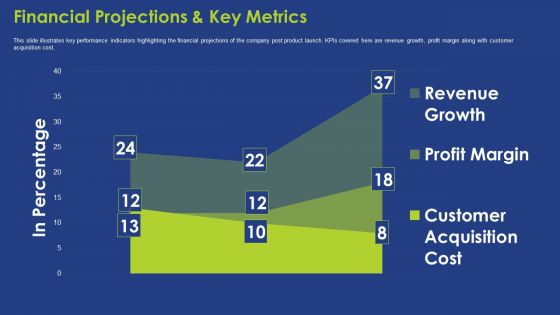
Financial Projections And Key Metrics Ppt Summary Background PDF
This slide illustrates key performance indicators highlighting the financial projections of the company post product launch. KPIs covered here are revenue growth, profit margin along with customer acquisition cost. Deliver an awe inspiring pitch with this creative financial projections and key metrics ppt summary background pdf bundle. Topics like financial projections and key metrics can be discussed with this completely editable template. It is available for immediate download depending on the needs and requirements of the user.
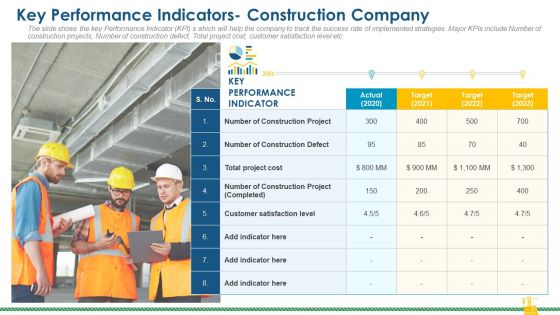
Rising Construction Defect Claims Against The Corporation Key Performance Indicators Construction Company Infographics PDF
The slide shows the key Performance Indicator KPI s which will help the company to track the success rate of implemented strategies. Major KPIs include Number of construction projects, Number of construction defect, Total project cost, customer satisfaction level etc. Deliver an awe inspiring pitch with this creative rising construction defect claims against the corporation key performance indicators construction company infographics pdf bundle. Topics like performance, project, customer satisfaction level can be discussed with this completely editable template. It is available for immediate download depending on the needs and requirements of the user.
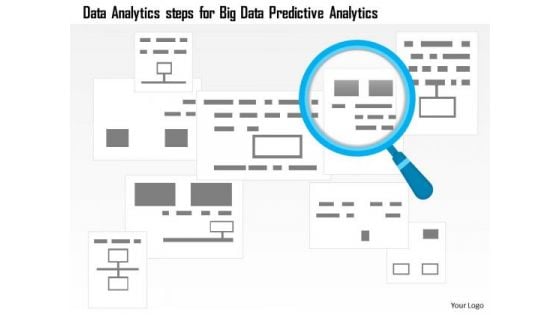
Business Diagram Data Analytics Steps For Big Data Predictive Analytics Ppt Slide
This power point template has been designed with graphic of magnifier over boxes. This slide contains the concept of predictive analytics of big data. This diagram can be used for data analytics related topics in any presentation.
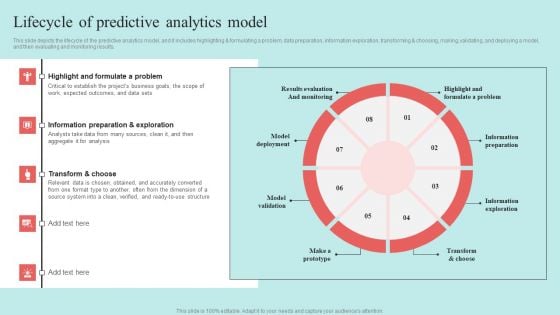
Predictive Data Model Lifecycle Of Predictive Analytics Model Diagrams PDF
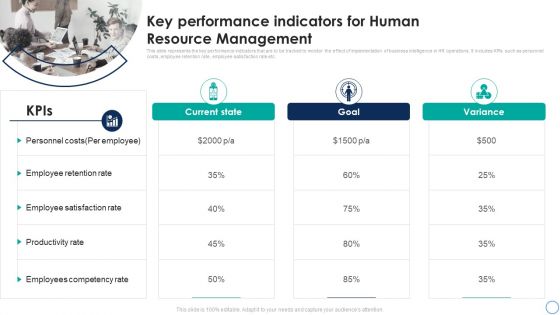
Business Analytics Application Key Performance Indicators For Human Resource Topics PDF
This slide represents the key performance indicators that are to be tracked to monitor the effect of implementation of business intelligence in HR operations. It includes KPIs such as personnel costs, employee retention rate, employee satisfaction rate etc. The Business Analytics Application Key Performance Indicators For Human Resource Topics PDF is a compilation of the most recent design trends as a series of slides. It is suitable for any subject or industry presentation, containing attractive visuals and photo spots for businesses to clearly express their messages. This template contains a variety of slides for the user to input data, such as structures to contrast two elements, bullet points, and slides for written information. Slidegeeks is prepared to create an impression.
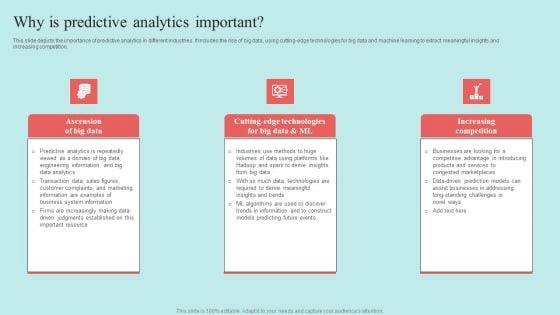
Predictive Data Model Why Is Predictive Analytics Important Mockup PDF
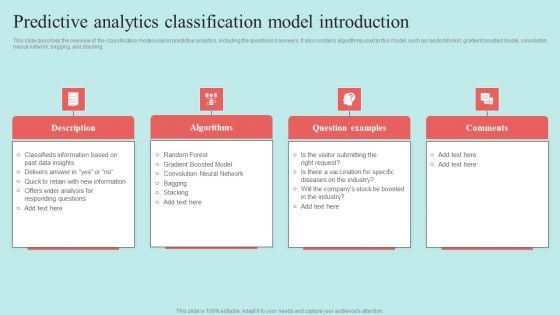
Predictive Data Model Predictive Analytics Classification Model Introduction Formats PDF
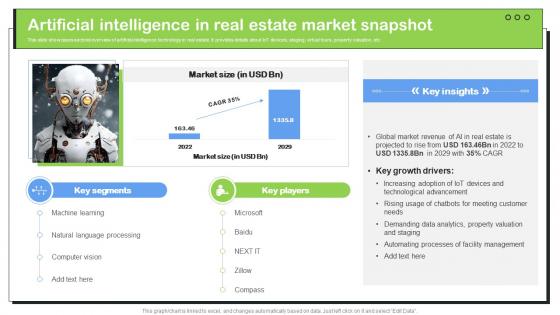
Transforming Real Estate Artificial Intelligence In Real Estate Market Snapshot ChatGPT SS V
This slide showcases sectoral overview of artificial intelligence technology in real estate. It provides details about IoT devices, staging, virtual tours, property valuation, etc. Do you have to make sure that everyone on your team knows about any specific topic I yes, then you should give Transforming Real Estate Artificial Intelligence In Real Estate Market Snapshot ChatGPT SS V a try. Our experts have put a lot of knowledge and effort into creating this impeccable Transforming Real Estate Artificial Intelligence In Real Estate Market Snapshot ChatGPT SS V. You can use this template for your upcoming presentations, as the slides are perfect to represent even the tiniest detail. You can download these templates from the Slidegeeks website and these are easy to edit. So grab these today This slide showcases sectoral overview of artificial intelligence technology in real estate. It provides details about IoT devices, staging, virtual tours, property valuation, etc.
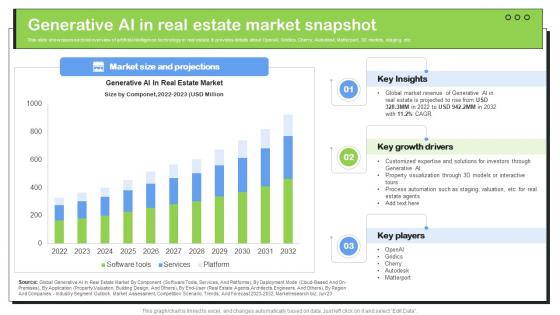
Transforming Real Estate Generative AI In Real Estate Market Snapshot ChatGPT SS V
This slide showcases sectoral overview of artificial intelligence technology in real estate. It provides details about OpenAI, Gridics, Cherry, Autodesk, Matterport, 3D models, staging, etc. Explore a selection of the finest Transforming Real Estate Generative AI In Real Estate Market Snapshot ChatGPT SS V here. With a plethora of professionally designed and pre-made slide templates, you can quickly and easily find the right one for your upcoming presentation. You can use our Transforming Real Estate Generative AI In Real Estate Market Snapshot ChatGPT SS V to effectively convey your message to a wider audience. Slidegeeks has done a lot of research before preparing these presentation templates. The content can be personalized and the slides are highly editable. Grab templates today from Slidegeeks. This slide showcases sectoral overview of artificial intelligence technology in real estate. It provides details about OpenAI, Gridics, Cherry, Autodesk, Matterport, 3D models, staging, etc.
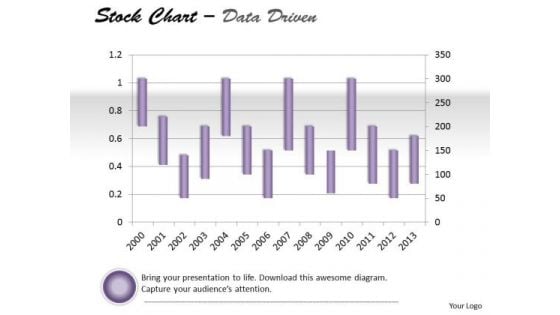
Data Analysis On Excel Driven Stock Chart For Market History PowerPoint Slides Templates
Draw Out The Best In You With Our data analysis on excel driven stock chart for market history powerpoint slides Templates . Let Your Inner Brilliance Come To The Surface.
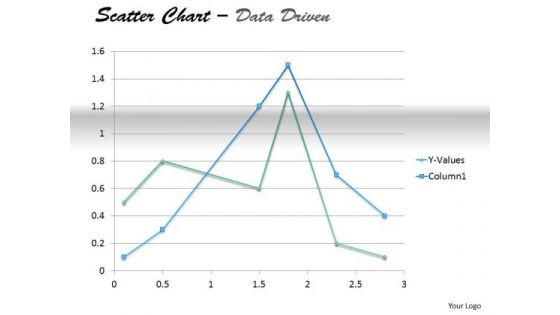
Examples Of Data Analysis Market Driven Present In Scatter Chart PowerPoint Slides Templates
Your Thoughts Will Take To Our examples of data analysis market driven present in scatter chart powerpoint slides Templates Like A Duck To Water. They Develop A Binding Affinity.
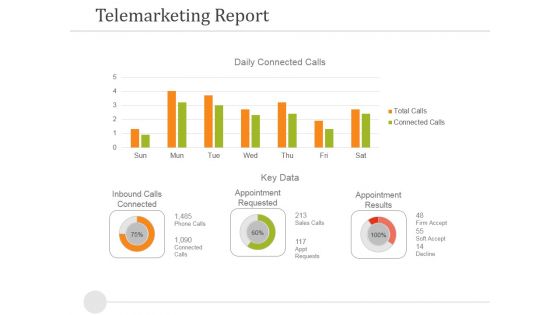
Telemarketing Report Template 1 Ppt PowerPoint Presentation Model Model
This is a telemarketing report template 1 ppt powerpoint presentation model model. This is a two stage process. The stages in this process are inbound calls connected, appointment requested, appointment results, key data.
Investment Annual Returns Performance Report Icons PDF
This slide presents a report highlighting performance of returns from investments in multiple funds to analyze and measure portfolio. It includes key components such as annual returns of funds, corporate bonds, equity, cash and market mood index and G-sec. Pitch your topic with ease and precision using this Investment Annual Returns Performance Report Icons PDF. This layout presents information on Cash, Quity, Corporate Bonds. It is also available for immediate download and adjustment. So, changes can be made in the color, design, graphics or any other component to create a unique layout.
Chat Messenger Investor Funding Elevator Pitch Deck Magnify Glass Portrait PDF
Welcome to our selection of the Chat Messenger Investor Funding Elevator Pitch Deck Magnify Glass Portrait PDF. These are designed to help you showcase your creativity and bring your sphere to life. Planning and Innovation are essential for any business that is just starting out. This collection contains the designs that you need for your everyday presentations. All of our PowerPoints are 100 percent editable, so you can customize them to suit your needs. This multi purpose template can be used in various situations. Grab these presentation templates today.
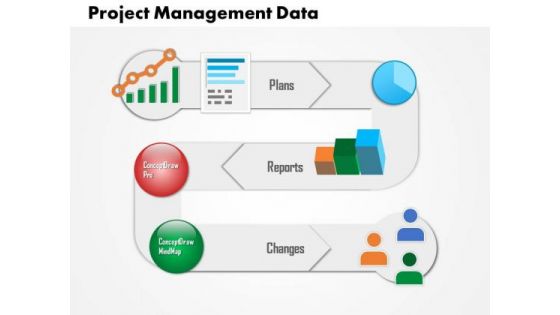
Business Diagram Project Management Data PowerPoint Ppt Presentation
This slide provides diagram for project management data. It contains spiral diagram with icons depicting plans reports and changes. Download this awesome diagram to capture your audiences attention.
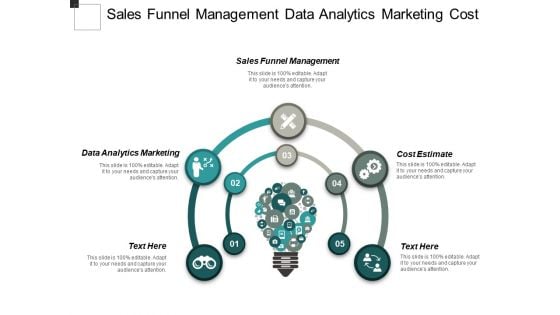
Sales Funnel Management Data Analytics Marketing Cost Estimate Ppt PowerPoint Presentation Inspiration Templates Cpb
This is a sales funnel management data analytics marketing cost estimate ppt powerpoint presentation inspiration templates cpb. This is a five stage process. The stages in this process are sales funnel management, data analytics marketing, cost estimate.
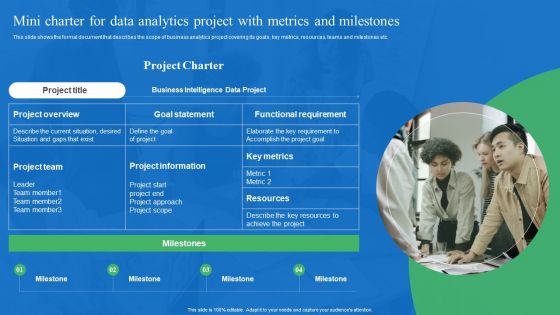
Mini Charter For Data Analytics Project With Metrics And Milestones Clipart PDF
This slide shows the formal document that describes the scope of business analytics project covering its goals, key metrics, resources, teams and milestones etc. This Mini Charter For Data Analytics Project With Metrics And Milestones Clipart PDF from Slidegeeks makes it easy to present information on your topic with precision. It provides customization options, so you can make changes to the colors, design, graphics, or any other component to create a unique layout. It is also available for immediate download, so you can begin using it right away. Slidegeeks has done good research to ensure that you have everything you need to make your presentation stand out. Make a name out there for a brilliant performance.
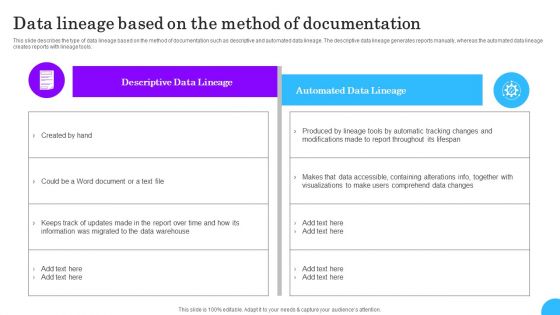
Comprehensive Analysis Of Different Data Lineage Classification Data Lineage Based On The Method Microsoft PDF
This slide describes the type of data lineage based on the method of documentation such as descriptive and automated data lineage. The descriptive data lineage generates reports manually, whereas the automated data lineage creates reports with lineage tools. If your project calls for a presentation, then Slidegeeks is your go to partner because we have professionally designed, easy to edit templates that are perfect for any presentation. After downloading, you can easily edit Comprehensive Analysis Of Different Data Lineage Classification Data Lineage Based On The Method Microsoft PDF and make the changes accordingly. You can rearrange slides or fill them with different images. Check out all the handy templates
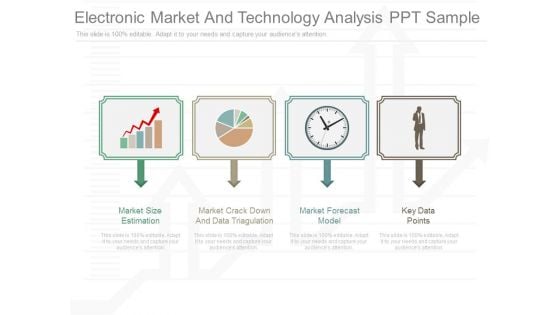
Electronic Market And Technology Analysis Ppt Sample
This is a electrnic market and technology analysis ppt sample. This is a four stage process. The stages in this process are market size estimation, market crack down and data triagulation, market forecast model, key data points.
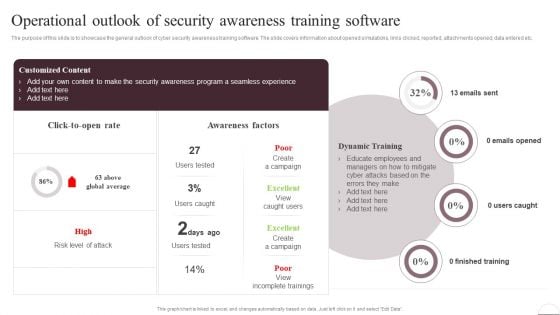
Prevention Of Information Operational Outlook Of Security Awareness Structure PDF
The purpose of this slide is to showcase the general outlook of cyber security awareness training software. The slide covers information about opened simulations, links clicked, reported, attachments opened, data entered. Slidegeeks has constructed Prevention Of Information Operational Outlook Of Security Awareness Structure PDF after conducting extensive research and examination. These presentation templates are constantly being generated and modified based on user preferences and critiques from editors. Here, you will find the most attractive templates for a range of purposes while taking into account ratings and remarks from users regarding the content. This is an excellent jumping-off point to explore our content and will give new users an insight into our top-notch PowerPoint Templates.
Investment Banking Reports Ppt PowerPoint Presentation Summary Inspiration Cpb Pdf
Presenting this set of slides with name investment banking reports ppt powerpoint presentation summary inspiration cpb pdf. This is an editable Powerpoint six stages graphic that deals with topics like investment banking reports to help convey your message better graphically. This product is a premium product available for immediate download and is 100 percent editable in Powerpoint. Download this now and use it in your presentations to impress your audience.
Cost Per Acquisition Report Of Network Marketing Structure Pdf
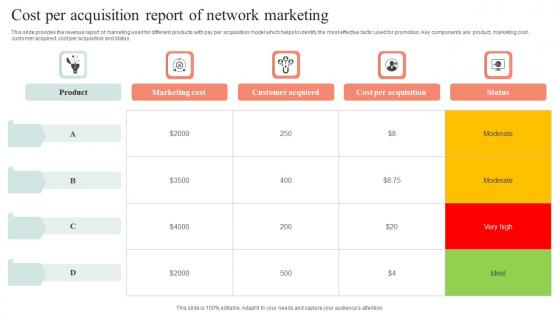
This slide provides the revenue report of marketing used for different products with pay per acquisition model which helps to identify the most effective tactic used for promotion. Key components are product, marketing cost, customer acquired, cost per acquisition and status. Showcasing this set of slides titled Cost Per Acquisition Report Of Network Marketing Structure Pdf. The topics addressed in these templates are Marketing Cost, Customer Acquired, Cost Per Acquisition. All the content presented in this PPT design is completely editable. Download it and make adjustments in color, background, font etc. as per your unique business setting. This slide provides the revenue report of marketing used for different products with pay per acquisition model which helps to identify the most effective tactic used for promotion. Key components are product, marketing cost, customer acquired, cost per acquisition and status.

Key Failure Reasons For Data Analytics Project Business Analysis Modification Toolkit Portrait PDF
This slide displays the key reasons for why the data analytics project fails. It includes reasons such as incorrect data, poor communication structure, and conflicting data etc.Presenting Key Failure Reasons For Data Analytics Project Business Analysis Modification Toolkit Portrait PDF to provide visual cues and insights. Share and navigate important information on six stages that need your due attention. This template can be used to pitch topics like Real Business, Poor Communication, Unrealistic Expectations. In addtion, this PPT design contains high resolution images, graphics, etc, that are easily editable and available for immediate download.


 Continue with Email

 Home
Home


