Budget Dashboard
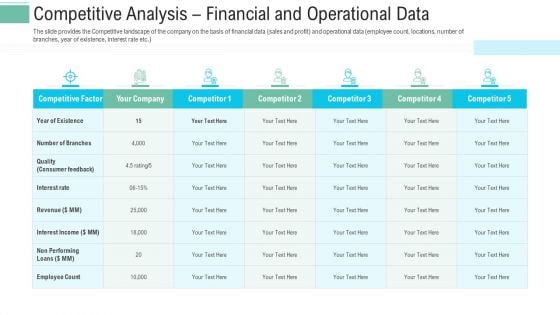
Pitch Presentation Raise Money Spot Market Competitive Analysis Financial And Operational Data Structure PDF
The slide provides the Competitive landscape of the company on the basis of financial data sales and profit and operational data employee count, locations, number of branches, year of existence, interest rate etc. Deliver and pitch your topic in the best possible manner with this pitch presentation raise money spot market competitive analysis financial and operational data structure pdf. Use them to share invaluable insights on consumer feedback, revenue, interest rate and impress your audience. This template can be altered and modified as per your expectations. So, grab it now.
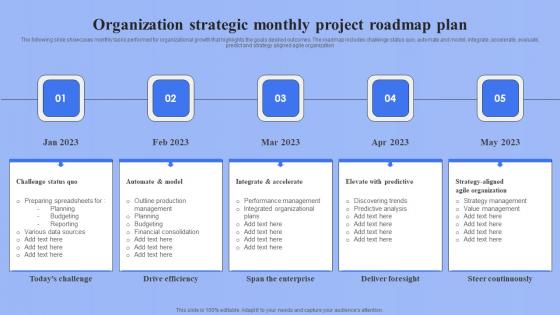
Organization Strategic Monthly Project Roadmap Plan Ppt Infographic Template Slide Download pdf
The following slide showcases monthly tasks performed for organizational growth that highlights the goals desired outcomes. The roadmap includes challenge status quo, automate and model, integrate, accelerate, evaluate, predict and strategy aligned agile organization. Showcasing this set of slides titled Organization Strategic Monthly Project Roadmap Plan Ppt Infographic Template Slide Download pdf. The topics addressed in these templates are Evaluate, Predict And Strategy, Aligned Agile Organization. All the content presented in this PPT design is completely editable. Download it and make adjustments in color, background, font etc. as per your unique business setting. The following slide showcases monthly tasks performed for organizational growth that highlights the goals desired outcomes. The roadmap includes challenge status quo, automate and model, integrate, accelerate, evaluate, predict and strategy aligned agile organization.
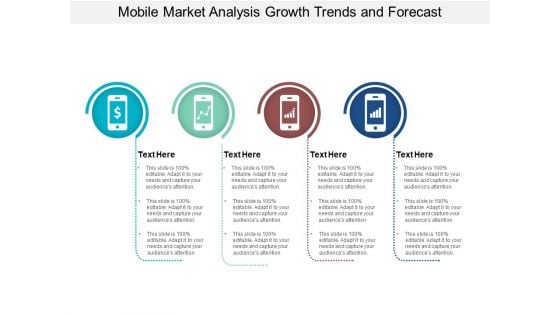
Mobile Market Analysis Growth Trends And Forecast Ppt PowerPoint Presentation Styles Outline
This is a mobile market analysis growth trends and forecast ppt powerpoint presentation styles outline. This is a three stage process. The stages in this process are mobile analytics, mobile tracking, mobile web analytics.
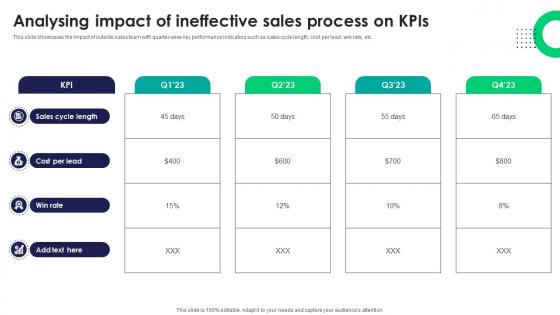
Analysing Impact Of Ineffective Sales Process On Kpis Tactics For Improving Field Sales Team SA SS V
This slide showcases the impact of outside sales team with quarter-wise key performance indicators such as sales cycle length, cost per lead, win rate, etc. Create an editable Analysing Impact Of Ineffective Sales Process On Kpis Tactics For Improving Field Sales Team SA SS V that communicates your idea and engages your audience. Whether you are presenting a business or an educational presentation, pre-designed presentation templates help save time. Analysing Impact Of Ineffective Sales Process On Kpis Tactics For Improving Field Sales Team SA SS V is highly customizable and very easy to edit, covering many different styles from creative to business presentations. Slidegeeks has creative team members who have crafted amazing templates. So, go and get them without any delay. This slide showcases the impact of outside sales team with quarter-wise key performance indicators such as sales cycle length, cost per lead, win rate, etc.
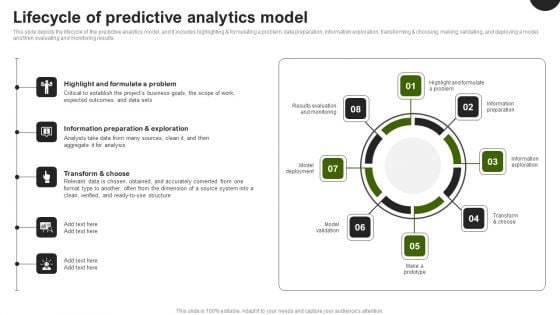
Predictive Analytics In The Age Of Big Data Lifecycle Of Predictive Analytics Model Pictures PDF
This slide depicts the lifecycle of the predictive analytics model, and it includes highlighting and formulating a problem, data preparation, information exploration, transforming and choosing, making, validating, and deploying a model, and then evaluating and monitoring results. Present like a pro with Predictive Analytics In The Age Of Big Data Lifecycle Of Predictive Analytics Model Pictures PDF Create beautiful presentations together with your team, using our easy to use presentation slides. Share your ideas in real time and make changes on the fly by downloading our templates. So whether you are in the office, on the go, or in a remote location, you can stay in sync with your team and present your ideas with confidence. With Slidegeeks presentation got a whole lot easier. Grab these presentations today.

Information Transformation Process Toolkit Data Analysis Project Plan Diagrams PDF
The slide outline the key steps for data analytics methodology. It initiates with defining business objectives to data understanding, modelling and ends at data visualization and presentation. Presenting Information Transformation Process Toolkit Data Analysis Project Plan Diagrams PDF to provide visual cues and insights. Share and navigate important information on six stages that need your due attention. This template can be used to pitch topics like Business Issue Understanding, Data Understanding, Data Preparation. In addtion, this PPT design contains high resolution images, graphics, etc, that are easily editable and available for immediate download.
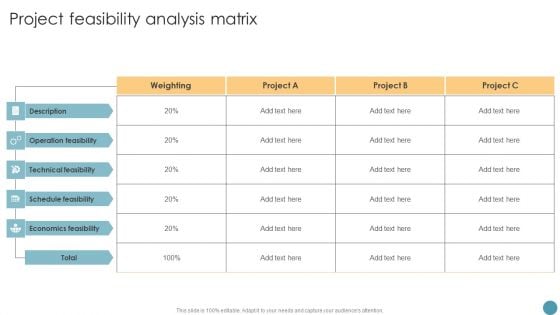
Project Feasibility Analysis Matrix Feasibility Analysis Report For Construction Project Designs PDF
The Project Feasibility Analysis Matrix Feasibility Analysis Report For Construction Project Designs PDF is a compilation of the most recent design trends as a series of slides. It is suitable for any subject or industry presentation, containing attractive visuals and photo spots for businesses to clearly express their messages. This template contains a variety of slides for the user to input data, such as structures to contrast two elements, bullet points, and slides for written information. Slidegeeks is prepared to create an impression.

Calculate Facebook Key Performance Indicator Ppt PowerPoint Presentation Complete Deck With Slides
This complete deck acts as a great communication tool. It helps you in conveying your business message with personalized sets of graphics, icons etc. Comprising a set of eleven slides, this complete deck can help you persuade your audience. It also induces strategic thinking as it has been thoroughly researched and put together by our experts. Not only is it easily downloadable but also editable. The color, graphics, theme any component can be altered to fit your individual needs. So grab it now.
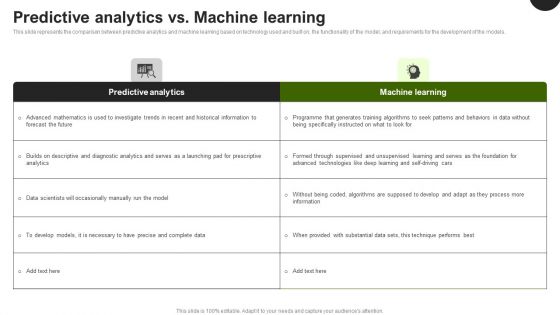
Predictive Analytics In The Age Of Big Data Predictive Analytics Vs Machine Learning Slides PDF
This slide represents the comparison between predictive analytics and machine learning based on technology used and built on, the functionality of the model, and requirements for the development of the models. This Predictive Analytics In The Age Of Big Data Predictive Analytics Vs Machine Learning Slides PDF from Slidegeeks makes it easy to present information on your topic with precision. It provides customization options, so you can make changes to the colors, design, graphics, or any other component to create a unique layout. It is also available for immediate download, so you can begin using it right away. Slidegeeks has done good research to ensure that you have everything you need to make your presentation stand out. Make a name out there for a brilliant performance.
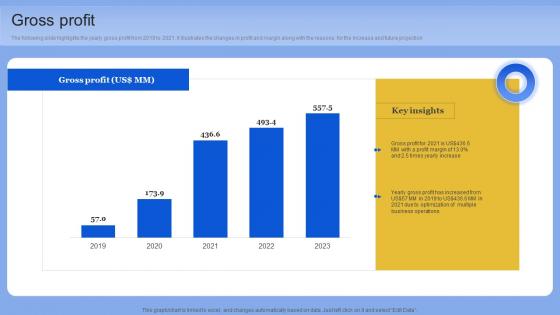
Gross Profit Data Analytics Company Outline Pictures PDF
The following slide highlights the yearly gross profit from 2019 to 2021. it illustrates the changes in profit and margin along with the reasons for the increase and future projection. Formulating a presentation can take up a lot of effort and time, so the content and message should always be the primary focus. The visuals of the PowerPoint can enhance the presenters message, so our Gross Profit Data Analytics Company Outline Pictures PDF was created to help save time. Instead of worrying about the design, the presenter can concentrate on the message while our designers work on creating the ideal templates for whatever situation is needed. Slidegeeks has experts for everything from amazing designs to valuable content, we have put everything into Gross Profit Data Analytics Company Outline Pictures PDF The following slide highlights the yearly gross profit from 2019 to 2021. it illustrates the changes in profit and margin along with the reasons for the increase and future projection

Kpis For Investing In Human Resource Career Model Ppt Powerpoint Presentation Gallery Show PDF
Persuade your audience using this kpis for investing in human resource career model ppt powerpoint presentation gallery show pdf. This PPT design covers six stages, thus making it a great tool to use. It also caters to a variety of topics including opportunities, resources, technology. Download this PPT design now to present a convincing pitch that not only emphasizes the topic but also showcases your presentation skills.
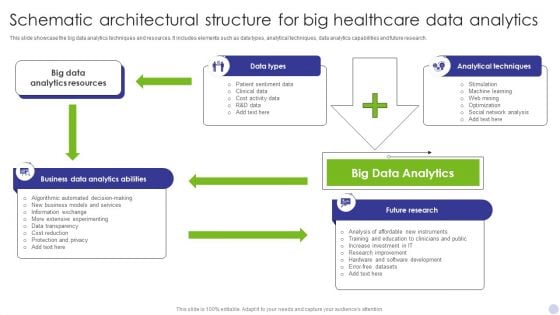
Schematic Architectural Structure For Big Healthcare Data Analytics Portrait PDF
This slide showcase the big data analytics techniques and resources. It includes elements such as data types, analytical techniques, data analytics capabilities and future research. Showcasing this set of slides titled Schematic Architectural Structure For Big Healthcare Data Analytics Portrait PDF. The topics addressed in these templates are Big Data Analytics, Analytical Techniques, Future Research. All the content presented in this PPT design is completely editable. Download it and make adjustments in color, background, font etc. as per your unique business setting.

Introduction To Monte Carlo Simulation Description And Objectives Data Analytics SS V
This slide provides an introduction to monte carlo simulation aimed ta helping businesses improve decision making by forecasting outcomes. It covers description, objectives and industries utilizing monte carlo simulation.Get a simple yet stunning designed Introduction To Monte Carlo Simulation Description And Objectives Data Analytics SS V. It is the best one to establish the tone in your meetings. It is an excellent way to make your presentations highly effective. So, download this PPT today from Slidegeeks and see the positive impacts. Our easy-to-edit Introduction To Monte Carlo Simulation Description And Objectives Data Analytics SS V can be your go-to option for all upcoming conferences and meetings. So, what are you waiting for Grab this template today. This slide provides an introduction to monte carlo simulation aimed ta helping businesses improve decision making by forecasting outcomes. It covers description, objectives and industries utilizing monte carlo simulation.
Data Analytics IT Data Science In Healthcare Department Ppt Professional Icon PDF
This slide depicts the role of data science in healthcare departments and its benefits in different ways, such as image analysis, drug discovery, genetics and Genomics, predictive diagnosis, and NLP. Presenting data analytics it data science in healthcare department ppt professional icon pdf to provide visual cues and insights. Share and navigate important information on five stages that need your due attention. This template can be used to pitch topics like medical image analysis, drug discovery, genetics and genomics, predictive diagnosis, natural language processing. In addtion, this PPT design contains high resolution images, graphics, etc, that are easily editable and available for immediate download.
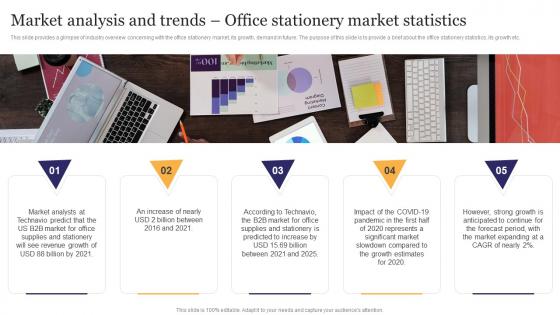
Market Analysis And Trends Office Stationery Business Plan Go To Market Strategy Download Pdf
This slide provides a glimpse of industry overview concerning with the office stationery market, its growth, demand in future. The purpose of this slide is to provide a brief about the office stationery statistics, its growth etc. This Market Analysis And Trends Office Stationery Business Plan Go To Market Strategy Download Pdf is perfect for any presentation, be it in front of clients or colleagues. It is a versatile and stylish solution for organizing your meetings. The Market Analysis And Trends Office Stationery Business Plan Go To Market Strategy Download Pdf features a modern design for your presentation meetings. The adjustable and customizable slides provide unlimited possibilities for acing up your presentation. Slidegeeks has done all the homework before launching the product for you. So, do not wait, grab the presentation templates today This slide provides a glimpse of industry overview concerning with the office stationery market, its growth, demand in future. The purpose of this slide is to provide a brief about the office stationery statistics, its growth etc.

Pie Chart With Coins Finance PowerPoint Templates And PowerPoint Backgrounds 0811
Microsoft PowerPoint Template and Background with pie chart with coins and statistic data Facilitate your discourse with our Pie Chart With Coins Finance PowerPoint Templates And PowerPoint Backgrounds 0811. Add to the amenities at your command.

Pie Chart With Coins Finance PowerPoint Themes And PowerPoint Slides 0811
Microsoft PowerPoint Theme and slide with pie chart with coins and statistic data Our Pie Chart With Coins Finance PowerPoint Themes And PowerPoint Slides 0811 are more than just a facelift. They actually add to the depth of your views.
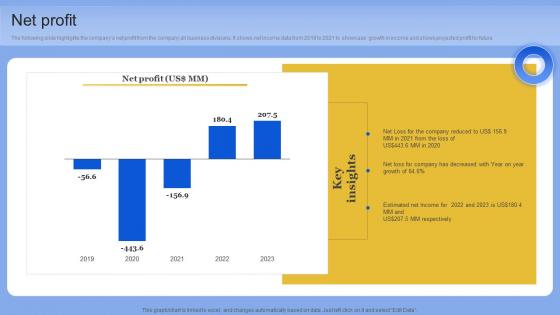
Net Profit Data Analytics Company Outline Diagrams PDF
The following slide highlights the companys net profit from the company all business divisions. It shows net income data from 2019 to 2021 to showcase growth in income and shows projected profit for future. Retrieve professionally designed Net Profit Data Analytics Company Outline Diagrams PDF to effectively convey your message and captivate your listeners. Save time by selecting pre-made slideshows that are appropriate for various topics, from business to educational purposes. These themes come in many different styles, from creative to corporate, and all of them are easily adjustable and can be edited quickly. Access them as PowerPoint templates or as Google Slides themes. You do not have to go on a hunt for the perfect presentation because Slidegeeks got you covered from everywhere. The following slide highlights the companys net profit from the company all business divisions. It shows net income data from 2019 to 2021 to showcase growth in income and shows projected profit for future
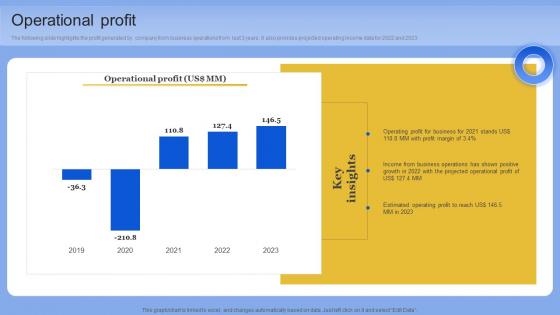
Operational Profit Data Analytics Company Outline Pictures PDF
The following slide highlights the profit generated by company from business operations from last 3 years. It also provides projected operating income data for 2022 and 2023. Slidegeeks has constructed Operational Profit Data Analytics Company Outline Pictures PDF after conducting extensive research and examination. These presentation templates are constantly being generated and modified based on user preferences and critiques from editors. Here, you will find the most attractive templates for a range of purposes while taking into account ratings and remarks from users regarding the content. This is an excellent jumping-off point to explore our content and will give new users an insight into our top-notch PowerPoint Templates. The following slide highlights the profit generated by company from business operations from last 3 years. It also provides projected operating income data for 2022 and 2023

How Does Data Mining Work Using Data Mining Tools To Optimize Processes AI SS V
This slide showcases basic process on how data mining works which can help developers in getting an initial idea for its operations. It provides details about data gathering, data preparation, data mining and data analysis. Take your projects to the next level with our ultimate collection of How Does Data Mining Work Using Data Mining Tools To Optimize Processes AI SS V. Slidegeeks has designed a range of layouts that are perfect for representing task or activity duration, keeping track of all your deadlines at a glance. Tailor these designs to your exact needs and give them a truly corporate look with your own brand colors they will make your projects stand out from the rest This slide showcases basic process on how data mining works which can help developers in getting an initial idea for its operations. It provides details about data gathering, data preparation, data mining and data analysis.
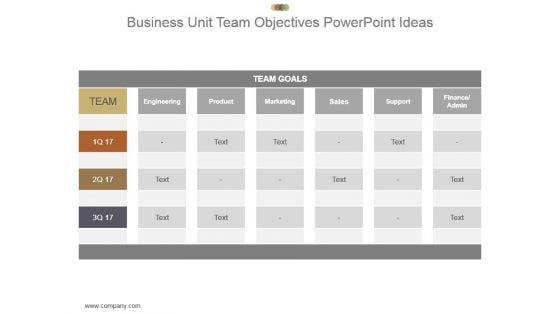
Business Unit Team Objectives Powerpoint Ideas
This is a business unit team objectives powerpoint ideas. This is a four stage process. The stages in this process are team, team goals, engineering, product, marketing, sales, support, finance admin.

Business And Financial Analysis Ppt PowerPoint Presentation Inspiration Design Templates
This is a business and financial analysis ppt powerpoint presentation inspiration design templates. This is a eight stage process. The stages in this process are investment, equipment, land cost, interior cost, employee cost.
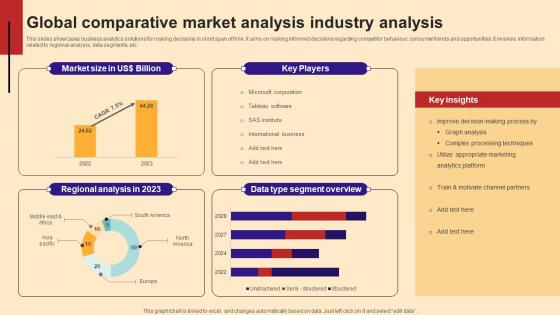
Global Comparative Market Analysis Industry Analysis Introduction Pdf
This slides showcases business analytics solutions for making decisions in short span of time. It aims on making informed decisions regarding competitor behaviour, consumer trends and opportunities. It involves information related to regional analysis, data segments, etc.Showcasing this set of slides titled Global Comparative Market Analysis Industry Analysis Introduction Pdf The topics addressed in these templates are Complex Processing Techniques, Segment Overview, Motivate Channel Partners All the content presented in this PPT design is completely editable. Download it and make adjustments in color, background, font etc. as per your unique business setting. This slides showcases business analytics solutions for making decisions in short span of time. It aims on making informed decisions regarding competitor behaviour, consumer trends and opportunities. It involves information related to regional analysis, data segments, etc.
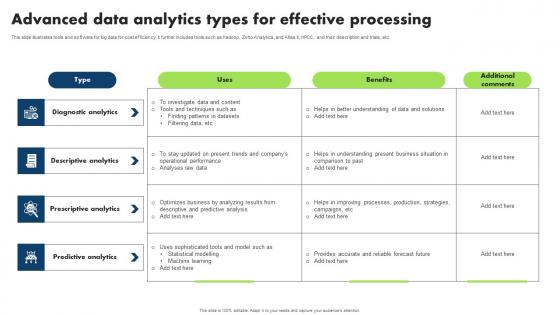
Advanced Data Analytics Types For Effective Processing Microsoft Pdf
This slide illustrates tools and software for big data for cost efficiency. It further includes tools such as Hadoop, Zoho Analytics, and Atlas.ti, HPCC, and their description and trials, etc Showcasing this set of slides titled Advanced Data Analytics Types For Effective Processing Microsoft Pdf. The topics addressed in these templates are Diagnostic Analytics, Descriptive Analytics, Prescriptive Analytics. All the content presented in this PPT design is completely editable. Download it and make adjustments in color, background, font etc. as per your unique business setting. This slide illustrates tools and software for big data for cost efficiency. It further includes tools such as Hadoop, Zoho Analytics, and Atlas.ti, HPCC, and their description and trials, etc
KPIs To Track Impact Of Eco Friendly Procurement Icons Pdf
The slide showcases key performance indicators that assist in maintaining a track record of activities initiated in order to attain sustainable procurement in organisations. The KPIs are carbon emissions, power and energy, social, governance, etc.Pitch your topic with ease and precision using this KPIs To Track Impact Of Eco Friendly Procurement Icons Pdf This layout presents information on Measure Organizations, Consumption Costs, Stakeholder Engagement It is also available for immediate download and adjustment. So, changes can be made in the color, design, graphics or any other component to create a unique layout. The slide showcases key performance indicators that assist in maintaining a track record of activities initiated in order to attain sustainable procurement in organisations. The KPIs are carbon emissions, power and energy, social, governance, etc.
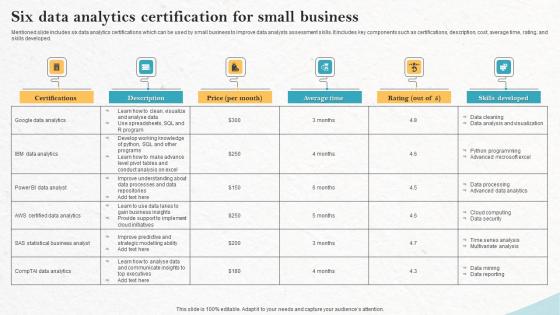
Six Data Analytics Certification For Small Business Pictures Pdf
Mentioned slide includes six data analytics certifications which can be used by small business to improve data analysts assessment skills. It includes key components such as certifications, description, cost, average time, rating, and skills developed. Showcasing this set of slides titled Six Data Analytics Certification For Small Business Pictures Pdf. The topics addressed in these templates are Six Data Analytics, Certification For Small Business, Skills Developed, Analysts Assessment Skills. All the content presented in this PPT design is completely editable. Download it and make adjustments in color, background, font etc. as per your unique business setting. Mentioned slide includes six data analytics certifications which can be used by small business to improve data analysts assessment skills. It includes key components such as certifications, description, cost, average time, rating, and skills developed.
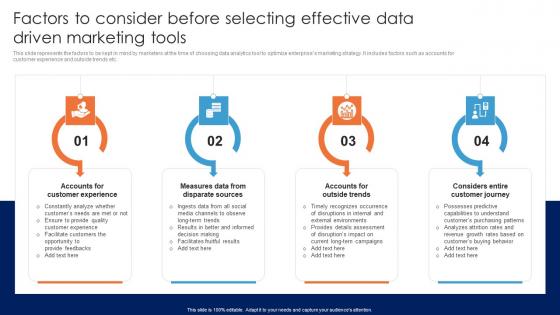
Factors To Consider Before Selecting Effective Guide For Data Driven Advertising Microsoft Pdf
This slide represents the factors to be kept in mind by marketers at the time of choosing data analytics tool to optimize enterprises marketing strategy. It includes factors such as accounts for customer experience and outside trends etc.Boost your pitch with our creative Factors To Consider Before Selecting Effective Guide For Data Driven Advertising Microsoft Pdf. Deliver an awe-inspiring pitch that will mesmerize everyone. Using these presentation templates you will surely catch everyones attention. You can browse the ppts collection on our website. We have researchers who are experts at creating the right content for the templates. So you do not have to invest time in any additional work. Just grab the template now and use them. This slide represents the factors to be kept in mind by marketers at the time of choosing data analytics tool to optimize enterprises marketing strategy. It includes factors such as accounts for customer experience and outside trends etc.
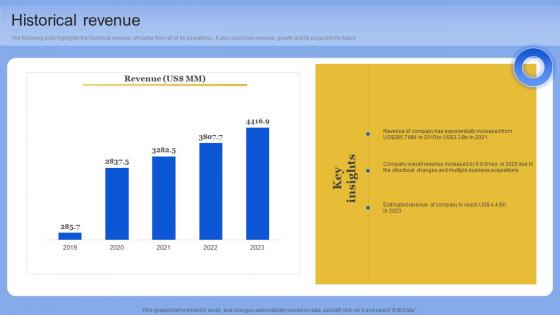
Historical Revenue Data Analytics Company Outline Information PDF
The following slide highlights the historical revenue of Kantar from all of its operations. It also describes revenue growth and its projection for future. This modern and well-arranged Historical Revenue Data Analytics Company Outline Information PDF provides lots of creative possibilities. It is very simple to customize and edit with the Powerpoint Software. Just drag and drop your pictures into the shapes. All facets of this template can be edited with Powerpoint, no extra software is necessary. Add your own material, put your images in the places assigned for them, adjust the colors, and then you can show your slides to the world, with an animated slide included. The following slide highlights the historical revenue of Kantar from all of its operations. It also describes revenue growth and its projection for future
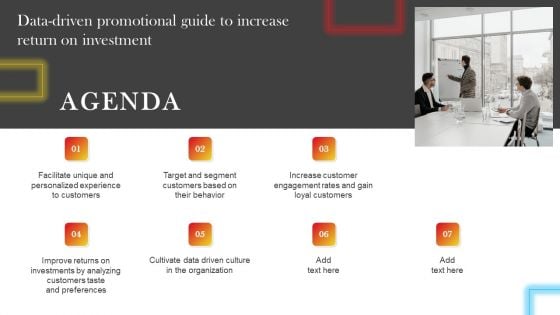
AGENDA Data Driven Promotional Guide To Increase Return On Investment Designs PDF
Are you in need of a template that can accommodate all of your creative concepts This one is crafted professionally and can be altered to fit any style. Use it with Google Slides or PowerPoint. Include striking photographs, symbols, depictions, and other visuals. Fill, move around, or remove text boxes as desired. Test out color palettes and font mixtures. Edit and save your work, or work with colleagues. Download AGENDA Data Driven Promotional Guide To Increase Return On Investment Designs PDF and observe how to make your presentation outstanding. Give an impeccable presentation to your group and make your presentation unforgettable.

Importance Of Data Migration Using Cloud Services Data Migration From On Premises
This slide showcases key benefits of using cloud services for data migration such as cost saving, improved performance and digital experience. The Importance Of Data Migration Using Cloud Services Data Migration From On Premises is a compilation of the most recent design trends as a series of slides. It is suitable for any subject or industry presentation, containing attractive visuals and photo spots for businesses to clearly express their messages. This template contains a variety of slides for the user to input data, such as structures to contrast two elements, bullet points, and slides for written information. Slidegeeks is prepared to create an impression. This slide showcases key benefits of using cloud services for data migration such as cost saving, improved performance and digital experience.
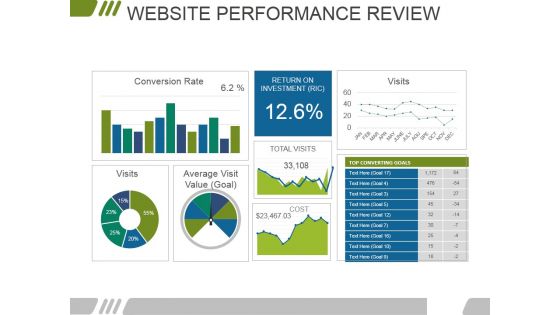
Website Performance Review Template 2 Ppt PowerPoint Presentation Infographics Background Designs
This is a website performance review template 2 ppt powerpoint presentation infographics background designs. This is a three stage process. The stages in this process are conversion rate, visits, return on investment, average visit value.
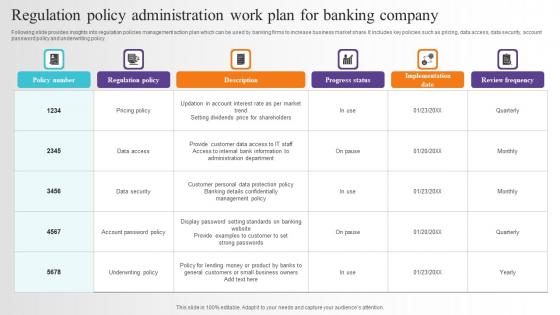
Regulation Policy Administration Work Plan For Banking Company Information Pdf
Following slide provides insights into regulation policies management action plan which can be used by banking firms to increase business market share. It includes key policies such as pricing, data access, data security, account password policy and underwriting policy. Pitch your topic with ease and precision using this Regulation Policy Administration Work Plan For Banking Company Information Pdf. This layout presents information on Data Access, Data Security, Account Password. It is also available for immediate download and adjustment. So, changes can be made in the color, design, graphics or any other component to create a unique layout. Following slide provides insights into regulation policies management action plan which can be used by banking firms to increase business market share. It includes key policies such as pricing, data access, data security, account password policy and underwriting policy.
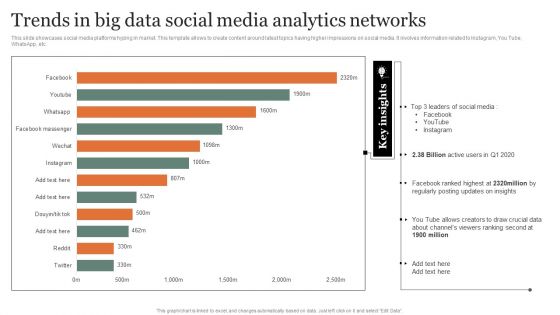
Trends In Big Data Social Media Analytics Networks Guidelines PDF
This slide showcases social media platforms hyping in market. This template allows to create content around latest topics having higher impressions on social media. It involves information related to Instagram, You Tube, WhatsApp, etc. Showcasing this set of slides titled Trends In Big Data Social Media Analytics Networks Guidelines PDF Topics. The topics addressed in these templates are Analytics Networks, Posting Updates, Ranking Second. All the content presented in this PPT design is completely editable. Download it and make adjustments in color, background, font etc. as per your unique business setting.
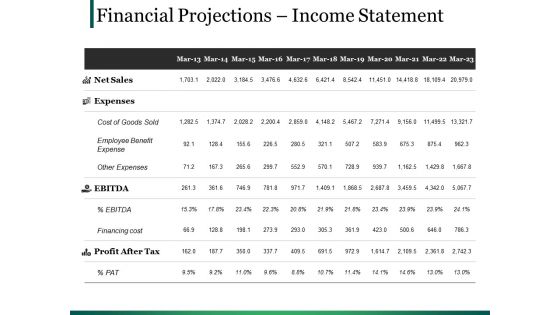
Financial Projections Income Statement Ppt PowerPoint Presentation Model Format
This is a financial projections income statement ppt powerpoint presentation model format. This is a two stage process. The stages in this process are tables, marketing, planning, strategy, finance.
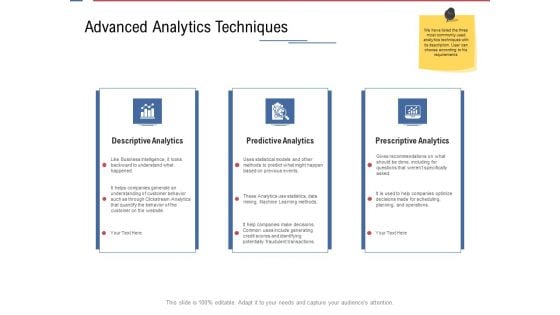
Data Assimilation Advanced Analytics Techniques Ppt Ideas Good PDF
This is a data assimilation advanced analytics techniques ppt ideas good pdf template with various stages. Focus and dispense information on three stages using this creative set, that comes with editable features. It contains large content boxes to add your information on topics like descriptive analytics, predictive analytics, prescriptive analytics. You can also showcase facts, figures, and other relevant content using this PPT layout. Grab it now.
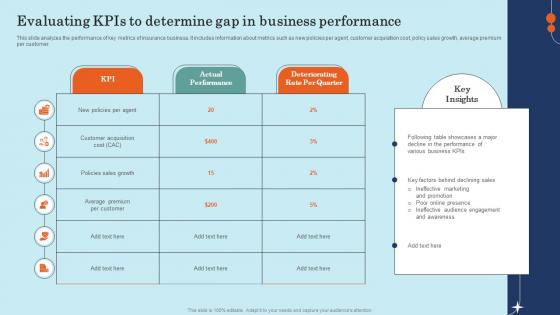
Evaluating KPIs To Determine Gap In Business Effective General Insurance Marketing Pictures Pdf
This slide analyzes the performance of key metrics of insurance business. It includes information about metrics such as new policies per agent, customer acquisition cost, policy sales growth, average premium per customer.Whether you have daily or monthly meetings, a brilliant presentation is necessary. Evaluating KPIs To Determine Gap In Business Effective General Insurance Marketing Pictures Pdf can be your best option for delivering a presentation. Represent everything in detail using Evaluating KPIs To Determine Gap In Business Effective General Insurance Marketing Pictures Pdf and make yourself stand out in meetings. The template is versatile and follows a structure that will cater to your requirements. All the templates prepared by Slidegeeks are easy to download and edit. Our research experts have taken care of the corporate themes as well. So, give it a try and see the results. This slide analyzes the performance of key metrics of insurance business. It includes information about metrics such as new policies per agent, customer acquisition cost, policy sales growth, average premium per customer.

Dollar Question Mark Finance PowerPoint Templates And PowerPoint Themes 1112
We present our Dollar Question Mark Finance PowerPoint Templates And PowerPoint Themes 1112.Use our Success PowerPoint Templates because, Timelines Display:- You have developed a vision of where you want to be a few years from now. Use our Money PowerPoint Templates because, Illustrate your ideas one by one and demonstrate how each is an important cog in running the entire wheel. Use our Success PowerPoint Templates because, Start the gears of youthful minds and set them in motion. Use our Signs PowerPoint Templates because,They are indicators of the path you have in mind. Use our Business PowerPoint Templates because,Marketing Strategy Business Template:- Maximising sales of your product is the intended destination.Use these PowerPoint slides for presentations relating to Dollar question mark, money, finance, success, signs, business. The prominent colors used in the PowerPoint template are Green, Red, Black Examine data with our Dollar Question Mark Finance PowerPoint Templates And PowerPoint Themes 1112. You will come out on top.
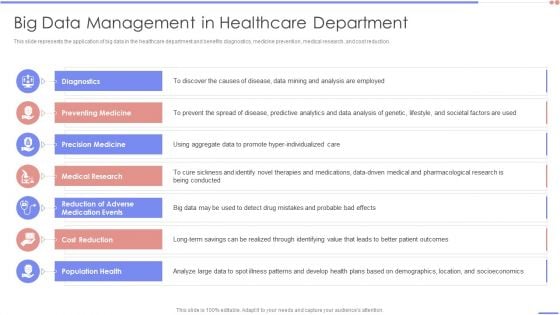
Data Analytics Management Big Data Management In Healthcare Department Infographics PDF
This slide represents the application of big data in the healthcare department and benefits diagnostics, medicine prevention, medical research, and cost reduction.Deliver and pitch your topic in the best possible manner with this Data Analytics Management Big Data Management In Healthcare Department Infographics PDF. Use them to share invaluable insights on Preventing Medicine, Precision Medicine, Medical Research and impress your audience. This template can be altered and modified as per your expectations. So, grab it now.
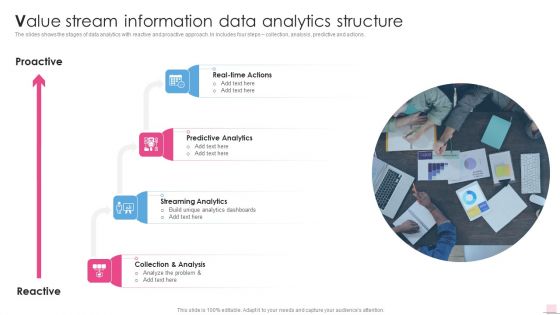
Value Stream Information Data Analytics Structure Business Analysis Modification Toolkit Rules PDF
The slides shows the stages of data analytics with reactive and proactive approach. In includes four steps collection, analysis, predictive and actions.Presenting Value Stream Information Data Analytics Structure Business Analysis Modification Toolkit Rules PDF to provide visual cues and insights. Share and navigate important information on four stages that need your due attention. This template can be used to pitch topics like Predictive Analytics, Streaming Analytics, Collection Analysis. In addtion, this PPT design contains high resolution images, graphics, etc, that are easily editable and available for immediate download.
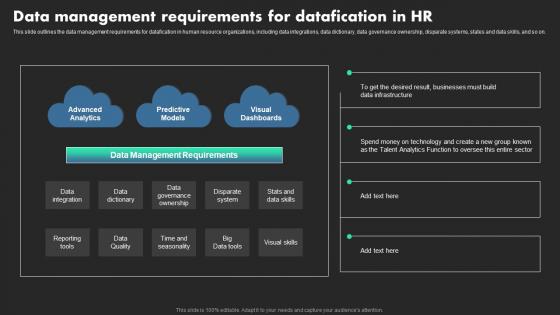
Data Management Requirements For Datafication In HR Ethical Dimensions Of Datafication Summary Pdf
This slide outlines the data management requirements for datafication in human resource organizations, including data integrations, data dictionary, data governance ownership, disparate systems, states and data skills, and so on. Make sure to capture your audiences attention in your business displays with our gratis customizable Data Management Requirements For Datafication In HR Ethical Dimensions Of Datafication Summary Pdf These are great for business strategies, office conferences, capital raising or task suggestions. If you desire to acquire more customers for your tech business and ensure they stay satisfied, create your own sales presentation with these plain slides. This slide outlines the data management requirements for datafication in human resource organizations, including data integrations, data dictionary, data governance ownership, disparate systems, states and data skills, and so on.
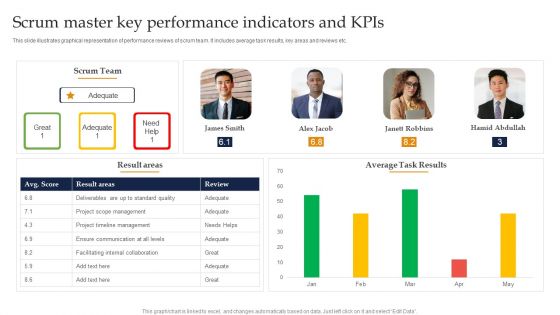
Scrum Master Key Performance Indicators And Kpis Ppt Gallery Files PDF
This slide illustrates graphical representation of performance reviews of scrum team. It includes average task results, key areas and reviews etc. Showcasing this set of slides titled Scrum Master Key Performance Indicators And Kpis Ppt Gallery Files PDF. The topics addressed in these templates are Scrum Team, Average Task Results, Project Timeline Management. All the content presented in this PPT design is completely editable. Download it and make adjustments in color, background, font etc. as per your unique business setting.
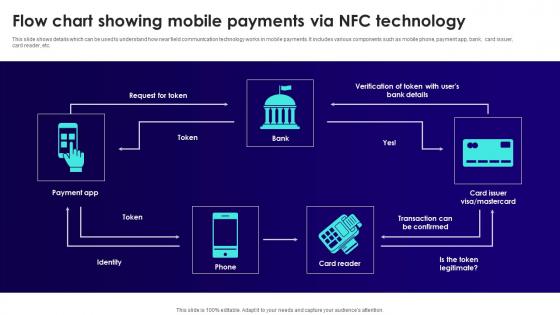
Wireless Banking To Improve Flow Chart Showing Mobile Payments Via Fin SS V
This slide shows details which can be used to understand how near field communication technology works in mobile payments. It includes various components such as mobile phone, payment app, bank, card issuer, card reader, etc. The Wireless Banking To Improve Flow Chart Showing Mobile Payments Via Fin SS V is a compilation of the most recent design trends as a series of slides. It is suitable for any subject or industry presentation, containing attractive visuals and photo spots for businesses to clearly express their messages. This template contains a variety of slides for the user to input data, such as structures to contrast two elements, bullet points, and slides for written information. Slidegeeks is prepared to create an impression. This slide shows details which can be used to understand how near field communication technology works in mobile payments. It includes various components such as mobile phone, payment app, bank, card issuer, card reader, etc.
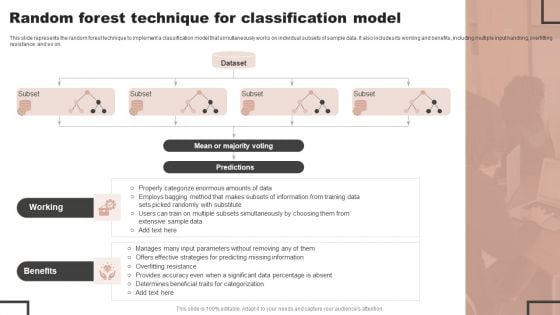
Forecast Analysis Technique IT Random Forest Technique For Classification Model Professional PDF
This slide represents the random forest technique to implement a classification model that simultaneously works on individual subsets of sample data. It also includes its working and benefits, including multiple input handling, overfitting resistance, and so on. From laying roadmaps to briefing everything in detail, our templates are perfect for you. You can set the stage with your presentation slides. All you have to do is download these easy to edit and customizable templates. Forecast Analysis Technique IT Random Forest Technique For Classification Model Professional PDF will help you deliver an outstanding performance that everyone would remember and praise you for. Do download this presentation today.
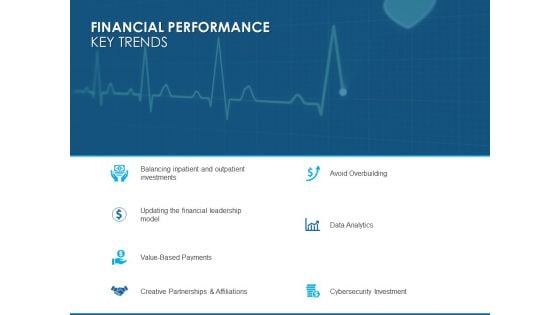
Overview Healthcare Business Management Financial Performance Key Trends Infographics PDF
Presenting this set of slides with name overview healthcare business management financial performance key trends infographics pdf. The topics discussed in these slides are data analytics, cybersecurity investment, avoid overbuilding, creative partnerships and affiliations, value based payments. This is a completely editable PowerPoint presentation and is available for immediate download. Download now and impress your audience.

Proposal For Data Analysis In Research Project Why Our Data Analytics Company One Pager Sample Example Document
Presenting you an exemplary Proposal For Data Analysis In Research Project Why Our Data Analytics Company One Pager Sample Example Document. Our one-pager comprises all the must-have essentials of an inclusive document. You can edit it with ease, as its layout is completely editable. With such freedom, you can tweak its design and other elements to your requirements. Download this Proposal For Data Analysis In Research Project Why Our Data Analytics Company One Pager Sample Example Document brilliant piece now.
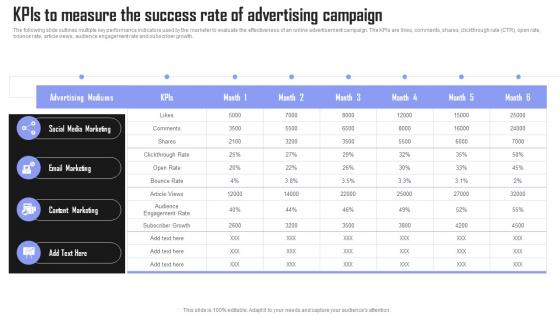
KPIs To Measure Success Rate Brand Building Techniques To Gain Competitive Edge Background Pdf
The following slide outlines multiple key performance indicators used by the marketer to evaluate the effectiveness of an online advertisement campaign. The KPIs are likes, comments, shares, clickthrough rate CTR, open rate, bounce rate, article views, audience engagement rate and subscriber growth. The best PPT templates are a great way to save time, energy, and resources. Slidegeeks have 100 percent editable powerpoint slides making them incredibly versatile. With these quality presentation templates, you can create a captivating and memorable presentation by combining visually appealing slides and effectively communicating your message. Download KPIs To Measure Success Rate Brand Building Techniques To Gain Competitive Edge Background Pdf from Slidegeeks and deliver a wonderful presentation. The following slide outlines multiple key performance indicators used by the marketer to evaluate the effectiveness of an online advertisement campaign. The KPIs are likes, comments, shares, clickthrough rate CTR, open rate, bounce rate, article views, audience engagement rate and subscriber growth.
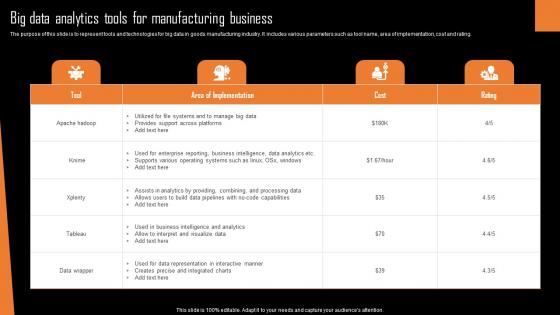
Big Data Analytics Tools For Manufacturing Business Professional Pdf
The purpose of this slide is to represent tools and technologies for big data in goods manufacturing industry. It includes various parameters such as tool name, area of implementation, cost and rating.Showcasing this set of slides titled Big Data Analytics Tools For Manufacturing Business Professional Pdf The topics addressed in these templates are Provides Support, Across Platforms, Analytics Providing All the content presented in this PPT design is completely editable. Download it and make adjustments in color, background, font etc. as per your unique business setting. The purpose of this slide is to represent tools and technologies for big data in goods manufacturing industry. It includes various parameters such as tool name, area of implementation, cost and rating.
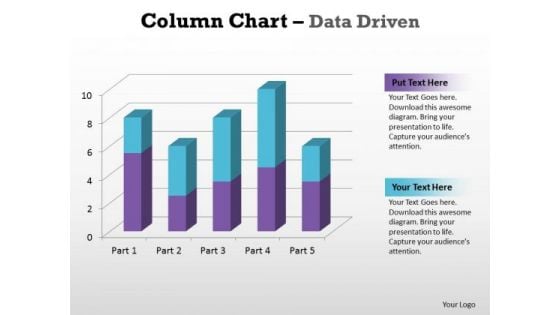
Business Graphic PowerPoint Templates Business Column Chart Data Driven Ppt Slides
Business Graphic PowerPoint Templates Business column chart data driven PPT Slides-With help of visual aids like this template you can capture the attention of the audience and make the presentation very interactive and lively.-Business Graphic PowerPoint Templates Business column chart data driven PPT Slides-This ppt can be used for concepts relating to-chart,, graph, growth, investment, , market, percentage, , presentation report, results, statistics, stock, success and business. Attain stardom with our Business Graphic PowerPoint Templates Business Column Chart Data Driven Ppt Slides. You will come out on top.

Table Of Prescriptive Model Deployment Timeline Data Analytics SS V
This slide provides a deployment table of prescriptive model aimed at highlighting movement of models through various phases. The basis of deployment are stage, start and end date, manager name with resources utilized.The Table Of Prescriptive Model Deployment Timeline Data Analytics SS V is a compilation of the most recent design trends as a series of slides. It is suitable for any subject or industry presentation, containing attractive visuals and photo spots for businesses to clearly express their messages. This template contains a variety of slides for the user to input data, such as structures to contrast two elements, bullet points, and slides for written information. Slidegeeks is prepared to create an impression. This slide provides a deployment table of prescriptive model aimed at highlighting movement of models through various phases. The basis of deployment are stage, start and end date, manager name with resources utilized.
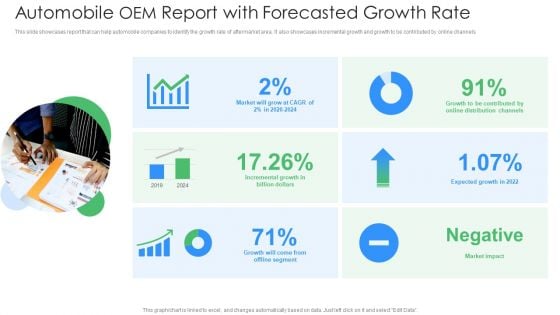
Automobile OEM Report With Forecasted Growth Rate Ppt PowerPoint Presentation File Background Images PDF
This slide showcases report that can help automobile companies to identify the growth rate of aftermarket area. It also showcases incremental growth and growth to be contributed by online channels. Pitch your topic with ease and precision using this automobile oem report with forecasted growth rate ppt powerpoint presentation file background images pdf. This layout presents information on incremental growth, billion dollars, growth, offline segment, market impact, expected growth in 2022. It is also available for immediate download and adjustment. So, changes can be made in the color, design, graphics or any other component to create a unique layout.

Global Investment Powerpoint Presentation Examples
This is a global investment powerpoint presentation examples. This is a six stage process. The stages in this process are accounting weekly export, transfer and variances reports, purchase reports, sale reports, accounting reports, global investment.\n\n
Human Resource Management Monthly Report Icon
Crafting an eye-catching presentation has never been more straightforward. Let your presentation shine with this tasteful yet straightforward Human Resource Management Monthly Report Icon template. It offers a minimalistic and classy look that is great for making a statement. The colors have been employed intelligently to add a bit of playfulness while still remaining professional. Construct the ideal Human Resource Management Monthly Report Icon that effortlessly grabs the attention of your audience Begin now and be certain to wow your customers Our Human Resource Management Monthly Report Icon slide is created to enhance your presentations with a professional and visually appealing design. These icons are specifically created to complement a variety of HR topics, providing a clean and modern backdrop to key reports, trends, and performance metrics.

Iot And Digital Twin To Reduce Costs Post Covid Key Performance Indicators In Oil And Gas Industry Infographics PDF
This slide focuses on the key performance indicators in oil and gas industry which includes loss of primary containment, oil spills, greenhouse gas emissions, etc. Deliver an awe inspiring pitch with this creative iot and digital twin to reduce costs post covid key performance indicators in oil and gas industry infographics pdf bundle. Topics like reported recordable injury frequency, loss of primary containment, oil spills, diversity and inclusion, group priorities engagement can be discussed with this completely editable template. It is available for immediate download depending on the needs and requirements of the user.
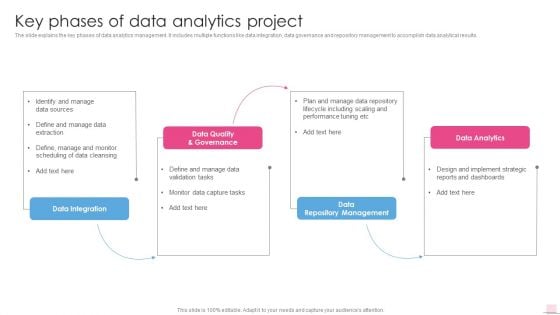
Key Phases Of Data Analytics Project Business Analysis Modification Toolkit Diagrams PDF
The slide explains the key phases of data analytics management. It includes multiple functions like data integration, data governance and repository management to accomplish data analytical results.Deliver and pitch your topic in the best possible manner with this Key Phases Of Data Analytics Project Business Analysis Modification Toolkit Diagrams PDF. Use them to share invaluable insights on Data Quality Governance, Performance Tuning, Including Scaling and impress your audience. This template can be altered and modified as per your expectations. So, grab it now.
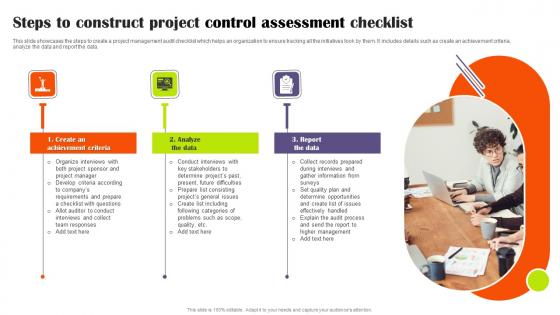
Steps To Construct Project Control Assessment Checklist Designs Pdf
This slide showcases the steps to create a project management audit checklist which helps an organization to ensure tracking all the initiatives took by them. It includes details such as create an achievement criteria, analyze the data and report the data. Pitch your topic with ease and precision using this Steps To Construct Project Control Assessment Checklist Designs Pdf This layout presents information on Achievement Criteria, Analyze The Data, Report The Data It is also available for immediate download and adjustment. So, changes can be made in the color, design, graphics or any other component to create a unique layout. This slide showcases the steps to create a project management audit checklist which helps an organization to ensure tracking all the initiatives took by them. It includes details such as create an achievement criteria, analyze the data and report the data.
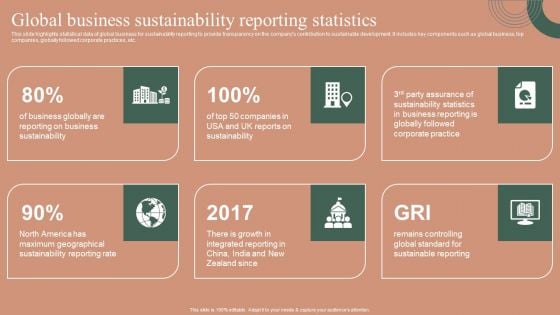
Global Business Sustainability Reporting Statistics Themes PDF

Submission Of Project Viability Report For Bank Loan Table Of Contents Elements PDF
Purpose of this slide is to address staffing strategy matrix. Here each strategy is identified as either directly applicable to a specific work type or indirectly applicable. The Submission Of Project Viability Report For Bank Loan Table Of Contents Elements PDF is a compilation of the most recent design trends as a series of slides. It is suitable for any subject or industry presentation, containing attractive visuals and photo spots for businesses to clearly express their messages. This template contains a variety of slides for the user to input data, such as structures to contrast two elements, bullet points, and slides for written information. Slidegeeks is prepared to create an impression.
Business Forecast Trends And Insights Vector Icon Ppt Slides Template PDF
Showcasing this set of slides titled business forecast trends and insights vector icon ppt slides template pdf. The topics addressed in these templates are business forecast trends and insights vector icon. All the content presented in this PPT design is completely editable. Download it and make adjustments in color, background, font etc. as per your unique business setting.
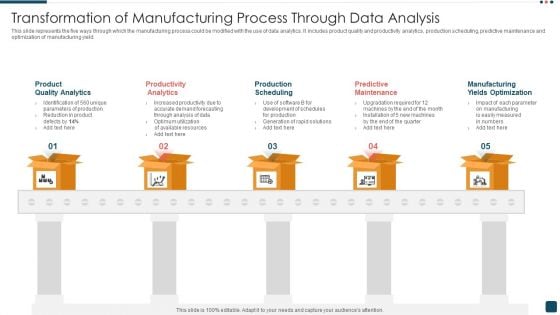
Transformation Of Manufacturing Process Through Data Analysis Download PDF
This slide represents the five ways through which the manufacturing process could be modified with the use of data analytics. It includes product quality and productivity analytics, production scheduling, predictive maintenance and optimization of manufacturing yield. Persuade your audience using this Transformation Of Manufacturing Process Through Data Analysis Download PDF. This PPT design covers five stages, thus making it a great tool to use. It also caters to a variety of topics including Product Quality Analytics, Productivity Analytics, Production Scheduling. Download this PPT design now to present a convincing pitch that not only emphasizes the topic but also showcases your presentation skills.
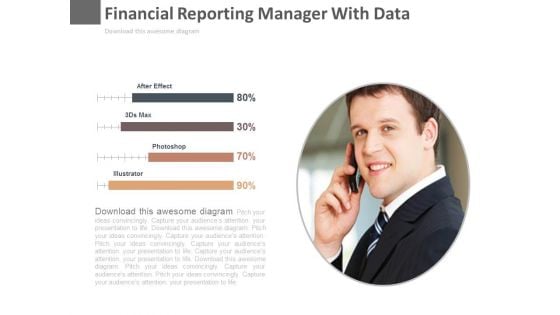
Financial Reporting Manager With Data Powerpoint Slides
This PowerPoint template has been designed with graphics of finance manager and percentage data. This diagram is useful to exhibit financial management. This diagram slide can be used to make impressive presentations.


 Continue with Email

 Home
Home


