Budget Dashboard
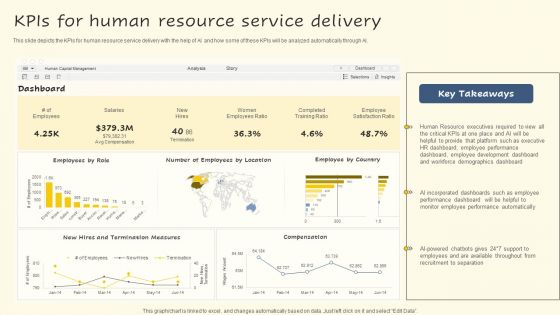
Kpis For Human Resource Service Delivery Guidelines PDF
This slide depicts the KPIs for human resource service delivery with the help of AI and how some of these KPIs will be analyzed automatically through AI. Are you in need of a template that can accommodate all of your creative concepts This one is crafted professionally and can be altered to fit any style. Use it with Google Slides or PowerPoint. Include striking photographs, symbols, depictions, and other visuals. Fill, move around, or remove text boxes as desired. Test out color palettes and font mixtures. Edit and save your work, or work with colleagues. Download Kpis For Human Resource Service Delivery Guidelines PDF and observe how to make your presentation outstanding. Give an impeccable presentation to your group and make your presentation unforgettable.
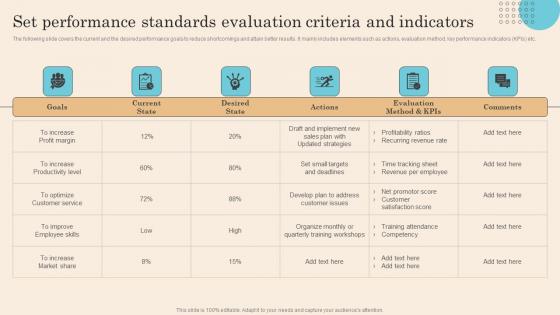
Set Performance Standards Evaluation Criteria Executing Successful Staff Performance Template Pdf
The following slide covers the current and the desired performance goals to reduce shortcomings and attain better results. It mainly includes elements such as actions, evaluation method, key performance indicators KPIs etc. Take your projects to the next level with our ultimate collection of Set Performance Standards Evaluation Criteria Executing Successful Staff Performance Template Pdf. Slidegeeks has designed a range of layouts that are perfect for representing task or activity duration, keeping track of all your deadlines at a glance. Tailor these designs to your exact needs and give them a truly corporate look with your own brand colors they will make your projects stand out from the rest. The following slide covers the current and the desired performance goals to reduce shortcomings and attain better results. It mainly includes elements such as actions, evaluation method, key performance indicators KPIs etc.
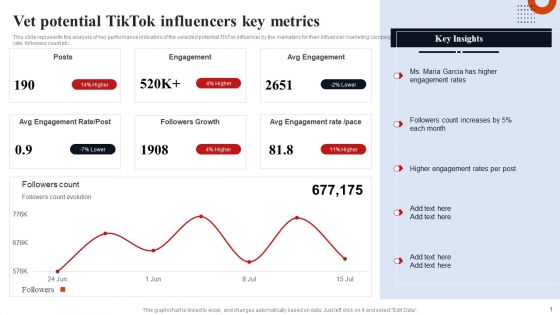
Vet Potential Tiktok Influencers Key Metrics Template PDF
This slide represents the analysis of key performance indicators of the selected potential TikTok influencer by the marketers for their influencer marketing campaign. It includes details related to key metrics such as engagement rate, followers count etc. Explore a selection of the finest Vet Potential Tiktok Influencers Key Metrics Template PDF here. With a plethora of professionally designed and pre made slide templates, you can quickly and easily find the right one for your upcoming presentation. You can use our Vet Potential Tiktok Influencers Key Metrics Template PDF to effectively convey your message to a wider audience. Slidegeeks has done a lot of research before preparing these presentation templates. The content can be personalized and the slides are highly editable. Grab templates today from Slidegeeks.
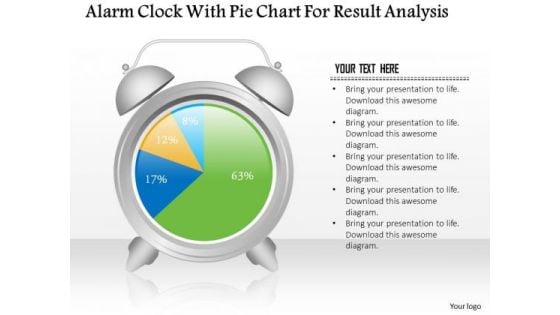
Business Diagram Alarm Clock With Pie Chart For Result Analysis PowerPoint Slide
This business slide displays alarm clock with pie chart. This diagram is a data visualization tool that gives you a simple way to present statistical information. This slide helps your audience examine and interpret the data you present.
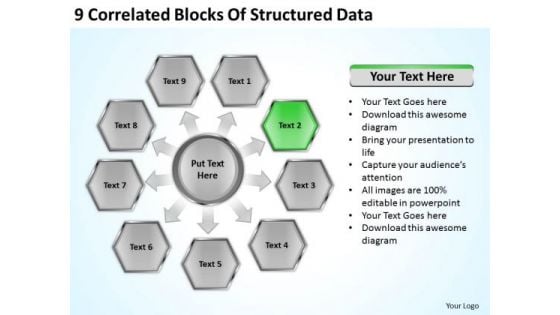
9 Correlated Blocks Of Structured Data Business Plans That Work PowerPoint Templates
We present our 9 correlated blocks of structured data business plans that work PowerPoint templates.Download and present our Marketing PowerPoint Templates because Our PowerPoint Templates and Slides will let you meet your Deadlines. Use our Business PowerPoint Templates because You can Hit the nail on the head with our PowerPoint Templates and Slides. Embed your ideas in the minds of your audience. Present our Finance PowerPoint Templates because Our PowerPoint Templates and Slides are aesthetically designed to attract attention. We gaurantee that they will grab all the eyeballs you need. Use our Process and Flows PowerPoint Templates because You can Be the puppeteer with our PowerPoint Templates and Slides as your strings. Lead your team through the steps of your script. Download and present our Arrows PowerPoint Templates because You canTake a leap off the starting blocks with our PowerPoint Templates and Slides. They will put you ahead of the competition in quick time.Use these PowerPoint slides for presentations relating to Diagram, Chart, Business, Background, Vector, Pie, Brown, Abstract, Wheel, Options, Board, Website, Cross, Statistics, Model, Item, Document, Media, Beehives, Red, Hive, Concept, Presentation, Template, Matt, Brochure, Orange, Guide, Description, Multicolor, Marketing, Gray, Development, Title, Management, Honeycomb, Illustration, Six, Catalog, Direction, Plans, Blue, Text, Reports, Financial, Workplace, Navigation, Parts. The prominent colors used in the PowerPoint template are Green, Gray, Black. Our 9 Correlated Blocks Of Structured Data Business Plans That Work PowerPoint Templates have a feel for it. They automatically create an ambience.
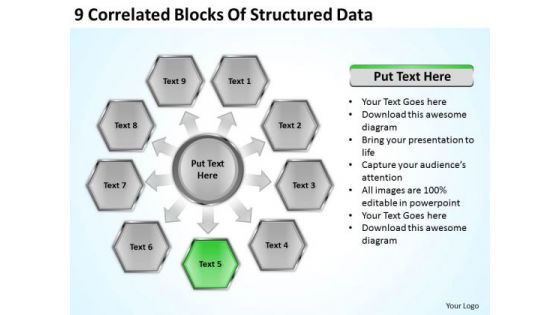
9 Correlated Blocks Of Structured Data How To Present Business Plan PowerPoint Slides
We present our 9 correlated blocks of structured data how to present business plan PowerPoint Slides.Download our Marketing PowerPoint Templates because Our PowerPoint Templates and Slides are focused like a searchlight beam. They highlight your ideas for your target audience. Use our Business PowerPoint Templates because You can Stir your ideas in the cauldron of our PowerPoint Templates and Slides. Cast a magic spell on your audience. Use our Finance PowerPoint Templates because You can Rise to the occasion with our PowerPoint Templates and Slides. You will bring your audience on their feet in no time. Present our Process and Flows PowerPoint Templates because Our PowerPoint Templates and Slides are innately eco-friendly. Their high recall value negate the need for paper handouts. Use our Arrows PowerPoint Templates because our PowerPoint Templates and Slides will give your ideas the shape.Use these PowerPoint slides for presentations relating to Diagram, Chart, Business, Background, Vector, Pie, Brown, Abstract, Wheel, Options, Board, Website, Cross, Statistics, Model, Item, Document, Media, Beehives, Red, Hive, Concept, Presentation, Template, Matt, Brochure, Orange, Guide, Description, Multicolor, Marketing, Gray, Development, Title, Management, Honeycomb, Illustration, Six, Catalog, Direction, Plans, Blue, Text, Reports, Financial, Workplace, Navigation, Parts. The prominent colors used in the PowerPoint template are Green, Gray, Black. Begin with a bang with our 9 Correlated Blocks Of Structured Data How To Present Business Plan PowerPoint Slides. Explode off the blocks with your thoughts.
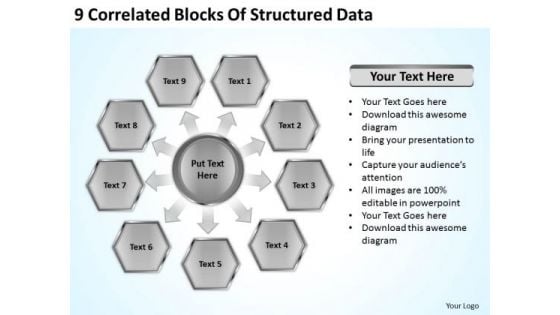
9 Correlated Blocks Of Structured Data Outline Business Plan PowerPoint Slides
We present our 9 correlated blocks of structured data outline business plan PowerPoint Slides.Download and present our Marketing PowerPoint Templates because Our PowerPoint Templates and Slides are conceived by a dedicated team. Use them and give form to your wondrous ideas. Download our Business PowerPoint Templates because Our PowerPoint Templates and Slides will provide weight to your words. They will bring out the depth of your thought process. Download our Finance PowerPoint Templates because Our PowerPoint Templates and Slides are Clear and concise. Use them and dispel any doubts your team may have. Present our Process and Flows PowerPoint Templates because It will mark the footprints of your journey. Illustrate how they will lead you to your desired destination. Download and present our Arrows PowerPoint Templates because Our PowerPoint Templates and Slides will fulfill your every need. Use them and effectively satisfy the desires of your audience.Use these PowerPoint slides for presentations relating to Diagram, Chart, Business, Background, Vector, Pie, Brown, Abstract, Wheel, Options, Board, Website, Cross, Statistics, Model, Item, Document, Media, Beehives, Red, Hive, Concept, Presentation, Template, Matt, Brochure, Orange, Guide, Description, Multicolor, Marketing, Gray, Development, Title, Management, Honeycomb, Illustration, Six, Catalog, Direction, Plans, Blue, Text, Reports, Financial, Workplace, Navigation, Parts. The prominent colors used in the PowerPoint template are White, Gray, Black. Our 9 Correlated Blocks Of Structured Data Outline Business Plan PowerPoint Slides have amazing characteristics. They educate and entertain on your command.
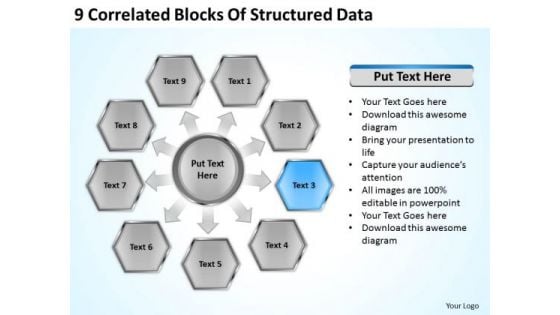
9 Correlated Blocks Of Structured Data Ppt Business Plan PowerPoint Slides
We present our 9 correlated blocks of structured data ppt business plan PowerPoint Slides.Download our Marketing PowerPoint Templates because You aspire to touch the sky with glory. Let our PowerPoint Templates and Slides provide the fuel for your ascent. Download our Business PowerPoint Templates because our PowerPoint Templates and Slides will give your ideas the shape. Download our Finance PowerPoint Templates because Our PowerPoint Templates and Slides offer you the widest possible range of options. Present our Process and Flows PowerPoint Templates because our PowerPoint Templates and Slides will give your ideas the shape. Download our Arrows PowerPoint Templates because you can Break through with our PowerPoint Templates and Slides. Bring down the mental barriers of your audience.Use these PowerPoint slides for presentations relating to Diagram, Chart, Business, Background, Vector, Pie, Brown, Abstract, Wheel, Options, Board, Website, Cross, Statistics, Model, Item, Document, Media, Beehives, Red, Hive, Concept, Presentation, Template, Matt, Brochure, Orange, Guide, Description, Multicolor, Marketing, Gray, Development, Title, Management, Honeycomb, Illustration, Six, Catalog, Direction, Plans, Blue, Text, Reports, Financial, Workplace, Navigation, Parts. The prominent colors used in the PowerPoint template are Blue, Gray, Black. Get rid of the fat with our 9 Correlated Blocks Of Structured Data Ppt Business Plan PowerPoint Slides. Get to the meat with your thoughts.
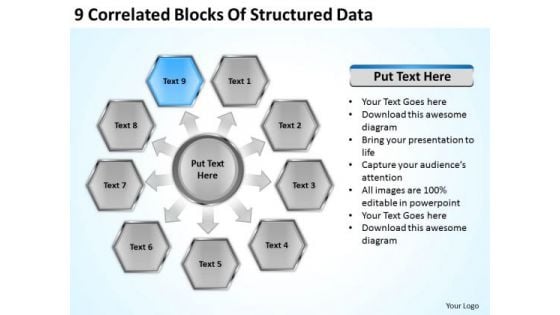
9 Correlated Blocks Of Structured Data Ppt Business Plan PowerPoint Templates
We present our 9 correlated blocks of structured data ppt business plan PowerPoint templates.Use our Marketing PowerPoint Templates because Our PowerPoint Templates and Slides provide you with a vast range of viable options. Select the appropriate ones and just fill in your text. Download our Business PowerPoint Templates because It is Aesthetically crafted by artistic young minds. Our PowerPoint Templates and Slides are designed to display your dexterity. Download and present our Finance PowerPoint Templates because Our PowerPoint Templates and Slides will definately Enhance the stature of your presentation. Adorn the beauty of your thoughts with their colourful backgrounds. Present our Process and Flows PowerPoint Templates because Our PowerPoint Templates and Slides come in all colours, shades and hues. They help highlight every nuance of your views. Download and present our Arrows PowerPoint Templates because Our PowerPoint Templates and Slides will effectively help you save your valuable time. They are readymade to fit into any presentation structure. Use these PowerPoint slides for presentations relating to Diagram, Chart, Business, Background, Vector, Pie, Brown, Abstract, Wheel, Options, Board, Website, Cross, Statistics, Model, Item, Document, Media, Beehives, Red, Hive, Concept, Presentation, Template, Matt, Brochure, Orange, Guide, Description, Multicolor, Marketing, Gray, Development, Title, Management, Honeycomb, Illustration, Six, Catalog, Direction, Plans, Blue, Text, Reports, Financial, Workplace, Navigation, Parts. The prominent colors used in the PowerPoint template are Blue, Gray, Black. Our 9 Correlated Blocks Of Structured Data Ppt Business Plan PowerPoint Templates stay away from farce. They treat every event correctly.
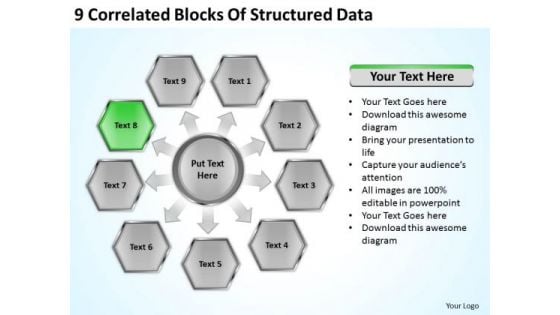
9 Correlated Blocks Of Structured Data Ppt Hotel Business Plan Example PowerPoint Slides
We present our 9 correlated blocks of structured data ppt hotel business plan example PowerPoint Slides.Present our Marketing PowerPoint Templates because Your ideas provide food for thought. Our PowerPoint Templates and Slides will help you create a dish to tickle the most discerning palate. Download our Business PowerPoint Templates because You can Stir your ideas in the cauldron of our PowerPoint Templates and Slides. Cast a magic spell on your audience. Present our Finance PowerPoint Templates because You can Create a matrix with our PowerPoint Templates and Slides. Feel the strength of your ideas click into place. Use our Process and Flows PowerPoint Templates because It can be used to Set your controls for the heart of the sun. Our PowerPoint Templates and Slides will be the propellant to get you there. Present our Arrows PowerPoint Templates because You canTake a leap off the starting blocks with our PowerPoint Templates and Slides. They will put you ahead of the competition in quick time.Use these PowerPoint slides for presentations relating to Diagram, Chart, Business, Background, Vector, Pie, Brown, Abstract, Wheel, Options, Board, Website, Cross, Statistics, Model, Item, Document, Media, Beehives, Red, Hive, Concept, Presentation, Template, Matt, Brochure, Orange, Guide, Description, Multicolor, Marketing, Gray, Development, Title, Management, Honeycomb, Illustration, Six, Catalog, Direction, Plans, Blue, Text, Reports, Financial, Workplace, Navigation, Parts. The prominent colors used in the PowerPoint template are Green, Gray, Black. Burst through the ceiling with our 9 Correlated Blocks Of Structured Data Ppt Hotel Business Plan Example PowerPoint Slides. Rise strongly above created barriers.
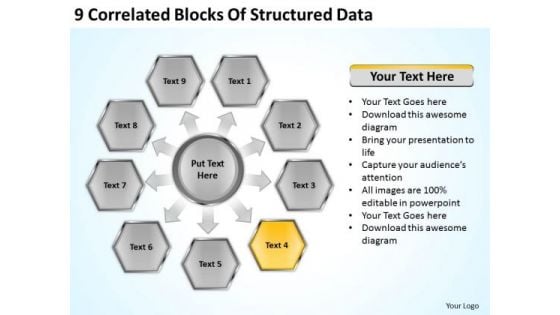
9 Correlated Blocks Of Structured Data Ppt Sales Business Plan Outline PowerPoint Templates
We present our 9 correlated blocks of structured data ppt sales business plan outline PowerPoint templates.Download our Marketing PowerPoint Templates because Our PowerPoint Templates and Slides will let you meet your Deadlines. Download and present our Business PowerPoint Templates because You can Hit the nail on the head with our PowerPoint Templates and Slides. Embed your ideas in the minds of your audience. Download and present our Finance PowerPoint Templates because Our PowerPoint Templates and Slides are a sure bet. Gauranteed to win against all odds. Download and present our Process and Flows PowerPoint Templates because Our PowerPoint Templates and Slides will bullet point your ideas. See them fall into place one by one. Use our Arrows PowerPoint Templates because Our PowerPoint Templates and Slides will let your ideas bloom. Create a bed of roses for your audience.Use these PowerPoint slides for presentations relating to Diagram, Chart, Business, Background, Vector, Pie, Brown, Abstract, Wheel, Options, Board, Website, Cross, Statistics, Model, Item, Document, Media, Beehives, Red, Hive, Concept, Presentation, Template, Matt, Brochure, Orange, Guide, Description, Multicolor, Marketing, Gray, Development, Title, Management, Honeycomb, Illustration, Six, Catalog, Direction, Plans, Blue, Text, Reports, Financial, Workplace, Navigation, Parts. The prominent colors used in the PowerPoint template are Yellow, Gray, Black. Color your presentation with success with our 9 Correlated Blocks Of Structured Data Ppt Sales Business Plan Outline PowerPoint Templates. You will come out on top.
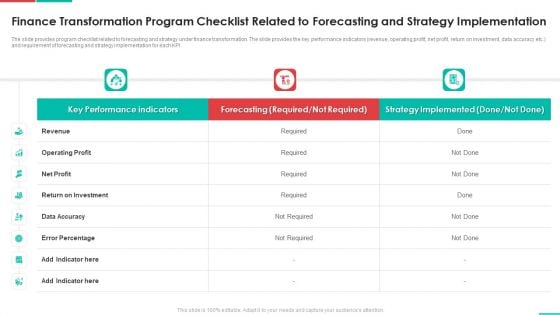
Roadmap For Financial Accounting Transformation Finance Transformation Program Checklist Related Themes PDF
The slide provides program checklist related to forecasting and strategy under finance transformation. The slide provides the key performance indicators revenue, operating profit, net profit, return on investment, data accuracy etc. and requirement of forecasting and strategy implementation for each KPI. Deliver and pitch your topic in the best possible manner with this roadmap for financial accounting transformation finance transformation program checklist related themes pdf. Use them to share invaluable insights on revenue, operating profit, net profit, return on investment, data accuracy and impress your audience. This template can be altered and modified as per your expectations. So, grab it now.
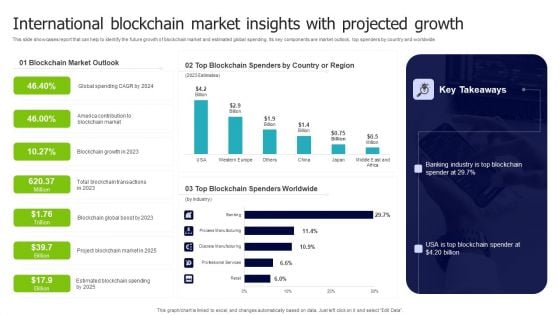
International Blockchain Market Insights With Projected Growth Microsoft PDF
This slide showcases report that can help to identify the future growth of blockchain market and estimated global spending. Its key components are market outlook, top spenders by country and worldwide. Showcasing this set of slides titled International Blockchain Market Insights With Projected Growth Microsoft PDF. The topics addressed in these templates are Blockchain Market Outlook, Blockchain Spenders, Country Region. All the content presented in this PPT design is completely editable. Download it and make adjustments in color, background, font etc. as per your unique business setting.
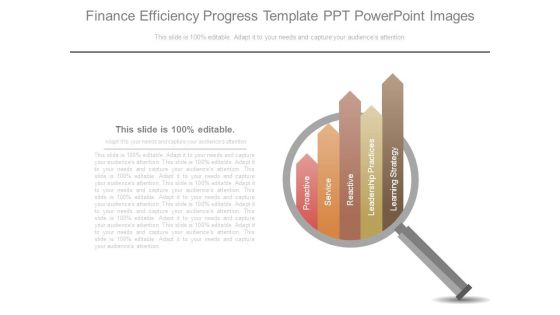
Finance Efficiency Progress Template Ppt Powerpoint Images
This is a finance efficiency progress template ppt powerpoint images. This is a five stage process. The stages in this process are proactive, service, reactive, leadership practices, learning strategy.
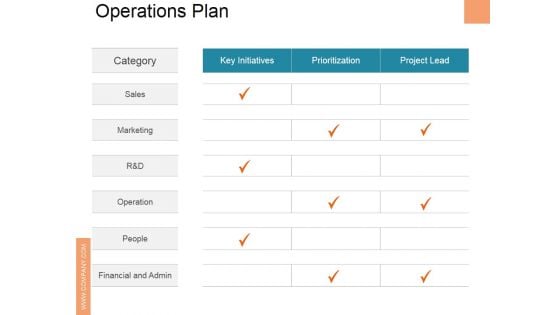
Operations Plan Ppt PowerPoint Presentation Pictures Example
This is a operations plan ppt powerpoint presentation pictures example. This is a three stage process. The stages in this process are key initiatives, prioritization, project lead, sales, marketing.
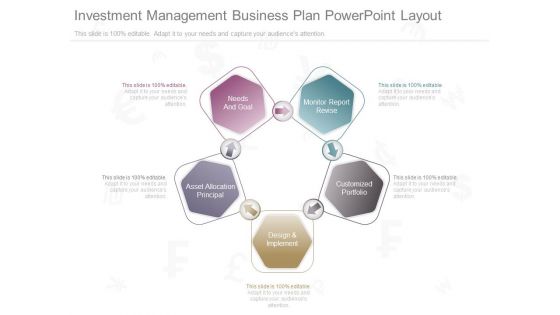
Investment Management Business Plan Powerpoint Layout
This is a investment management business plan powerpoint layout. This is a five stage process. The stages in this process are needs and goal, monitor report revise, customized portfolio, design and implement, asset allocation principal.
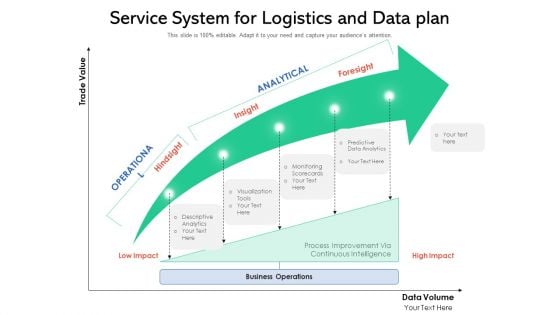
Service System For Logistics And Data Plan Ppt Pictures Graphic Images PDF
Presenting service system for logistics and data plan ppt pictures graphic images pdf to dispense important information. This template comprises one stage. It also presents valuable insights into the topics including business operations, monitoring, predictive data analytics. This is a completely customizable PowerPoint theme that can be put to use immediately. So, download it and address the topic impactfully.
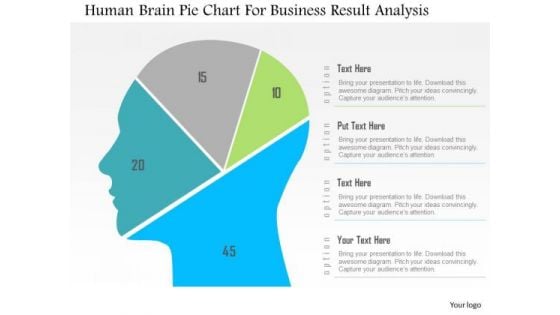
Business Diagram Human Brain Pie Chart For Business Result Analysis PowerPoint Slide
This diagram displays human face graphic divided into sections. This section can be used for data display. Use this diagram to build professional presentations for your viewers.
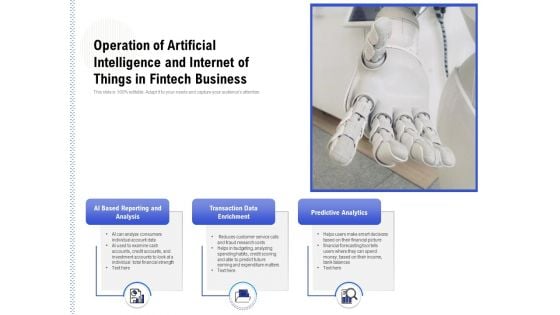
Operation Of Artificial Intelligence And Internet Of Things In Fintech Business Ppt PowerPoint Presentation Infographic Template Example File
Pitch your topic with ease and precision using this operation of artificial intelligence and internet of things in fintech business ppt powerpoint presentation infographic template example file. This layout presents information on ai based reporting and analysis, transaction data enrichment, predictive analytics. It is also available for immediate download and adjustment. So, changes can be made in the color, design, graphics or any other component to create a unique layout.
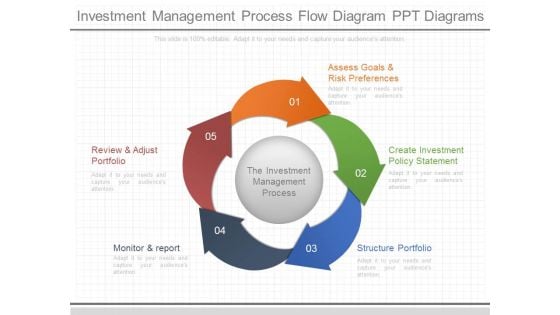
Investment Management Process Flow Diagram Ppt Diagrams
This is a investment management process flow diagram ppt diagrams. This is a five stage process. The stages in this process are assess goals and risk preferences, create investment policy statement, structure portfolio, monitor and report, review and adjust portfolio, the investment management process.
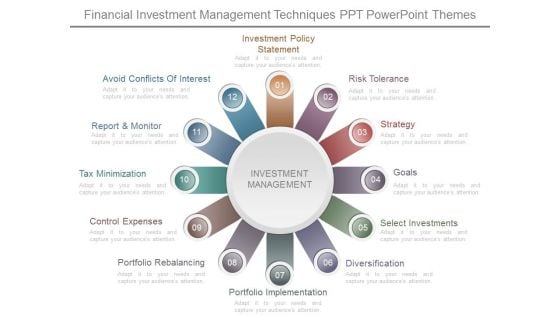
Financial Investment Management Techniques Ppt Powerpoint Themes
This is a financial investment management techniques ppt powerpoint themes. This is a twelve stage process. The stages in this process are investment policy statement, risk tolerance, strategy, goals, select investments, diversification, portfolio implementation, portfolio rebalancing, control expenses, tax minimization, report and monitor, avoid conflicts of interest.
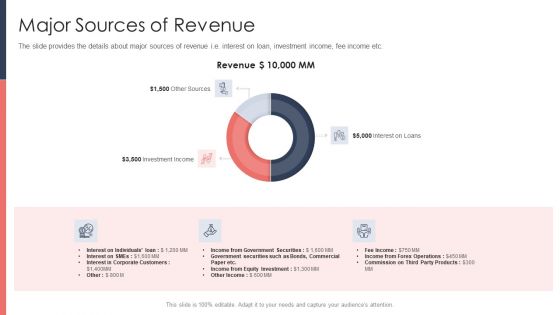
Pitch Deck For Fundraising From Post Market Financing Major Sources Of Revenue Infographics PDF
The slide provides forecasted free cash flow of the company for next five years. It provides forecasted data for Revenue, EBITDA, EBIT, Capital Expenditure, Depreciation and Amortization etc.Deliver an awe-inspiring pitch with this creative pitch deck for fundraising from post market financing major sources of revenue infographics pdf bundle. Topics like revenue, interest on loans, investment income can be discussed with this completely editable template. It is available for immediate download depending on the needs and requirements of the user.
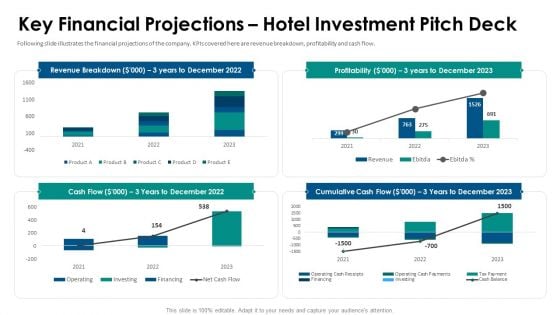
Hospitality Fundraising Key Financial Projections Hotel Investment Pitch Deck Download PDF
Following slide illustrates the financial projections of the company. KPIs covered here are revenue breakdown, profitability and cash flow. Deliver and pitch your topic in the best possible manner with this hospitality fundraising key financial projections hotel investment pitch deck download pdf. Use them to share invaluable insights on revenue, profitability, cash flow and impress your audience. This template can be altered and modified as per your expectations. So, grab it now.
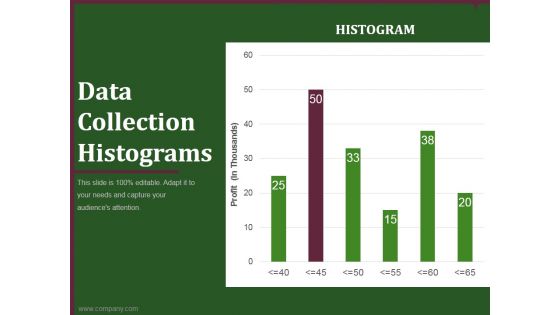
data collection histograms ppt powerpoint presentation example
This is a data collection histograms ppt powerpoint presentation example. This is a six stage process. The stages in this process are business, planning, marketing, histograms, graph.
Magnify Glass Ppt Powerpoint Presentation Pictures Icons
This is a magnify glass ppt powerpoint presentation pictures icons. This is a one stage process. The stages in this process are magnifying glass, search, finance, business.
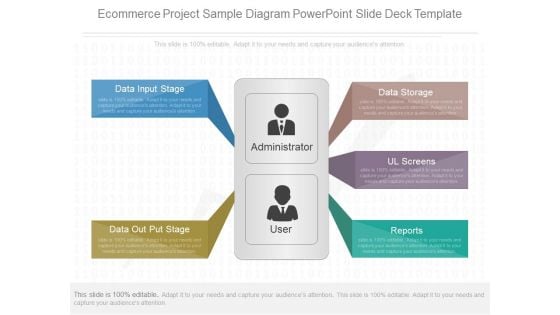
Ecommerce Project Sample Diagram Powerpoint Slide Deck Template
This is a ecommerce project sample diagram powerpoint slide deck template. This is a five stage process. The stages in this process are data input stage, data out put stage, data storage, ul screens, reports.

Statistical Tools For Evidence Statistical Analytics In Food Processing Outlet
This slide represents the concise overview of the problem, the proposed solution, and the achieved result for using data analytics in food processing outlet. The outcomes are precise food quantity forecasts, optimized resource allocation, etc. Want to ace your presentation in front of a live audience Our Statistical Tools For Evidence Statistical Analytics In Food Processing Outlet can help you do that by engaging all the users towards you. Slidegeeks experts have put their efforts and expertise into creating these impeccable powerpoint presentations so that you can communicate your ideas clearly. Moreover, all the templates are customizable, and easy-to-edit and downloadable. Use these for both personal and commercial use. This slide represents the concise overview of the problem, the proposed solution, and the achieved result for using data analytics in food processing outlet. The outcomes are precise food quantity forecasts, optimized resource allocation, etc.

Market Research Analysis Of Housing Sector Real Estate Price And Sales Historical Data Background PDF
Deliver and pitch your topic in the best possible manner with this market research analysis of housing sector real estate price and sales historical data background pdf. Use them to share invaluable insights on prices, sales and impress your audience. This template can be altered and modified as per your expectations. So, grab it now.
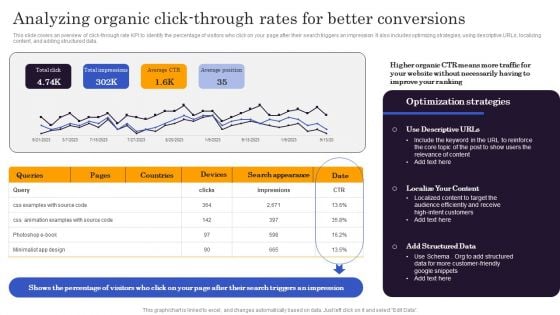
Marketers Guide To Data Analysis Optimization Analyzing Organic Click Through Rates For Better Conversions Structure PDF
This slide covers an overview of click-through rate KPI to identify the percentage of visitors who click on your page after their search triggers an impression. It also includes optimizing strategies, using descriptive URLs, localizing content, and adding structured data. Find highly impressive Marketers Guide To Data Analysis Optimization Analyzing Organic Click Through Rates For Better Conversions Structure PDF on Slidegeeks to deliver a meaningful presentation. You can save an ample amount of time using these presentation templates. No need to worry to prepare everything from scratch because Slidegeeks experts have already done a huge research and work for you. You need to download Marketers Guide To Data Analysis Optimization Analyzing Organic Click Through Rates For Better Conversions Structure PDF for your upcoming presentation. All the presentation templates are 100 percent editable and you can change the color and personalize the content accordingly. Download now.
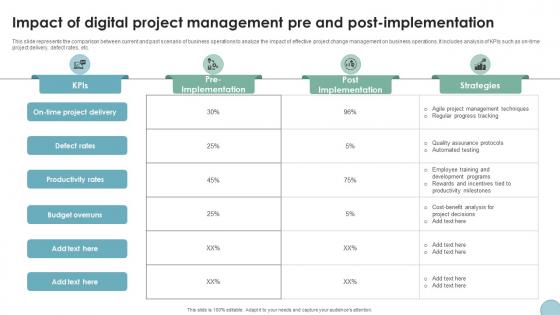
Impact Of Digital Project Management Pre Digital Transformation In Project Management
This slide represents the comparison between current and past scenario of business operations to analyze the impact of effective project change management on business operations. It includes analysis of KPIs such as on-time project delivery, defect rates, etc. Crafting an eye-catching presentation has never been more straightforward. Let your presentation shine with this tasteful yet straightforward Impact Of Digital Project Management Pre Digital Transformation In Project Management template. It offers a minimalistic and classy look that is great for making a statement. The colors have been employed intelligently to add a bit of playfulness while still remaining professional. Construct the ideal Impact Of Digital Project Management Pre Digital Transformation In Project Management that effortlessly grabs the attention of your audience Begin now and be certain to wow your customers This slide represents the comparison between current and past scenario of business operations to analyze the impact of effective project change management on business operations. It includes analysis of KPIs such as on-time project delivery, defect rates, etc.

Magnifying Glass Ppt PowerPoint Presentation Background Designs
This is a magnifying glass ppt powerpoint presentation background designs. This is a five stage process. The stages in this process are years, magnify, search, success, time line.
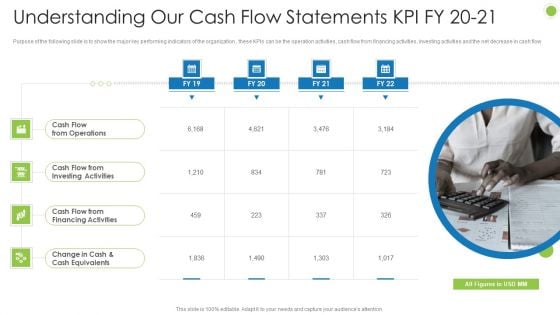
Debt Retrieval Techniques Understanding Our Cash Flow Statements Kpi Fy 20 21 Ppt Infographic Template Background Images PDF
Purpose of the following slide is to show the major key performing indicators of the organization , these KPIs can be the operation activities, cash flow from financing activities, investing activities and the net decrease in cash flow This is a debt retrieval techniques understanding our cash flow statements kpi fy 20 21 ppt infographic template background images pdf template with various stages. Focus and dispense information on four stages using this creative set, that comes with editable features. It contains large content boxes to add your information on topics like cash flow from operations, cash flow from investing activities, cash flow from financing activities, change in cash and cash equivalents. You can also showcase facts, figures, and other relevant content using this PPT layout. Grab it now.
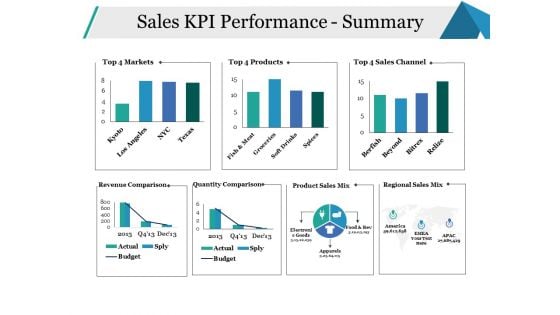
Sales KPI Performance Summary Ppt PowerPoint Presentation Infographics Model
This is a sales kpi performance summary ppt powerpoint presentation infographics model. This is a seven stage process. The stages in this process are sales channel, revenue comparison, quantity comparison, business, marketing.
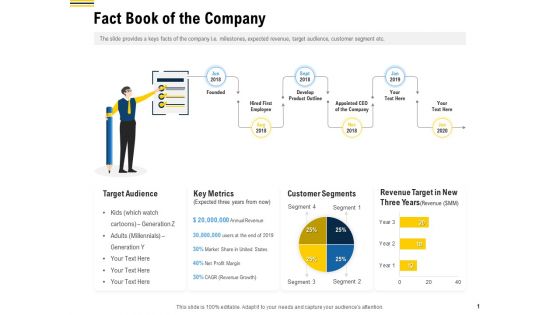
Raise Funding From Pre Seed Money Fact Book Of The Company Sample PDF
Showcasing this set of slides titled raise funding from pre seed money fact book of the company sample pdf. The topics addressed in these templates are target audience, key metrics, customer segments. All the content presented in this PPT design is completely editable. Download it and make adjustments in color, background, font etc. as per your unique business setting.
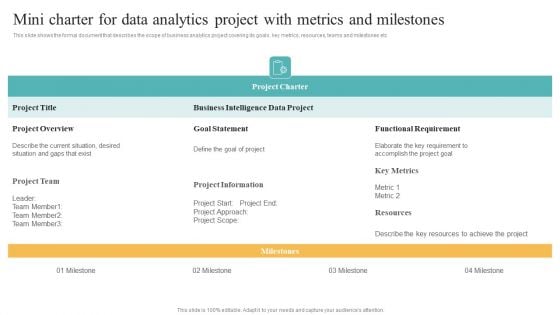
Mini Charter For Data Analytics Project With Metrics And Milestones Brochure PDF
This slide shows the formal document that describes the scope of business analytics project covering its goals, key metrics, resources, teams and milestones etc Find a pre designed and impeccable Mini Charter For Data Analytics Project With Metrics And Milestones Brochure PDF. The templates can ace your presentation without additional effort. You can download these easy to edit presentation templates to make your presentation stand out from others. So, what are you waiting for Download the template from Slidegeeks today and give a unique touch to your presentation.
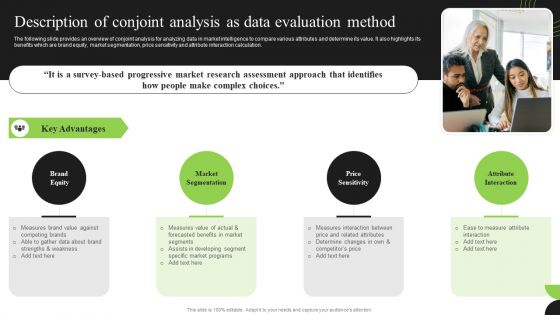
Guidebook For Executing Business Market Intelligence Description Of Conjoint Analysis As Data Professional PDF
The following slide provides an overview of conjoint analysis for analyzing data in market intelligence to compare various attributes and determine its value. It also highlights its benefits which are brand equity, market segmentation, price sensitivity and attribute interaction calculation. Create an editable Guidebook For Executing Business Market Intelligence Description Of Conjoint Analysis As Data Professional PDF that communicates your idea and engages your audience. Whether you are presenting a business or an educational presentation, pre designed presentation templates help save time. Guidebook For Executing Business Market Intelligence Description Of Conjoint Analysis As Data Professional PDF is highly customizable and very easy to edit, covering many different styles from creative to business presentations. Slidegeeks has creative team members who have crafted amazing templates. So, go and get them without any delay.
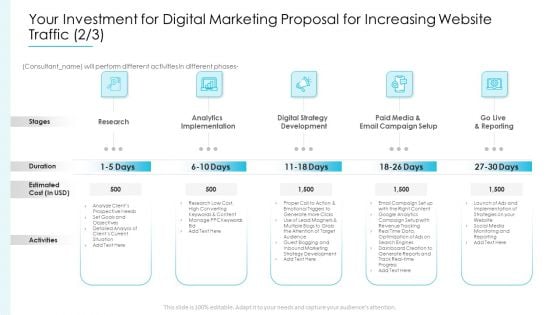
Your Investment For Digital Marketing Proposal For Increasing Website Traffic Cost Elements PDF
This is a your investment for digital marketing proposal for increasing website traffic cost elements pdf template with various stages. Focus and dispense information on five stages using this creative set, that comes with editable features. It contains large content boxes to add your information on topics like research, analytics implementation, digital strategy development, paid media and email campaign setup, go live and reporting. You can also showcase facts, figures, and other relevant content using this PPT layout. Grab it now.
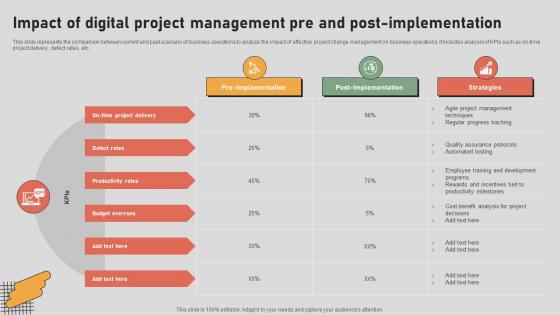
The Digital Project Managers Impact Of Digital Project Management Pre And Post Implementation
This slide represents the comparison between current and past scenario of business operations to analyze the impact of effective project change management on business operations. It includes analysis of KPIs such as on-time project delivery, defect rates, etc. Coming up with a presentation necessitates that the majority of the effort goes into the content and the message you intend to convey. The visuals of a PowerPoint presentation can only be effective if it supplements and supports the story that is being told. Keeping this in mind our experts created The Digital Project Managers Impact Of Digital Project Management Pre And Post Implementation to reduce the time that goes into designing the presentation. This way, you can concentrate on the message while our designers take care of providing you with the right template for the situation. This slide represents the comparison between current and past scenario of business operations to analyze the impact of effective project change management on business operations. It includes analysis of KPIs such as on-time project delivery, defect rates, etc.

Digital Project Management Strategies Impact Of Digital Project Management Strategies Pre And Post
This slide represents the comparison between current and past scenario of business operations to analyze the impact of effective project change management on business operations. It includes analysis of KPIs such as on-time project delivery, defect rates, etc. Are you in need of a template that can accommodate all of your creative concepts This one is crafted professionally and can be altered to fit any style. Use it with Google Slides or PowerPoint. Include striking photographs, symbols, depictions, and other visuals. Fill, move around, or remove text boxes as desired. Test out color palettes and font mixtures. Edit and save your work, or work with colleagues. Download Digital Project Management Strategies Impact Of Digital Project Management Strategies Pre And Post and observe how to make your presentation outstanding. Give an impeccable presentation to your group and make your presentation unforgettable. This slide represents the comparison between current and past scenario of business operations to analyze the impact of effective project change management on business operations. It includes analysis of KPIs such as on-time project delivery, defect rates, etc.

Marketers Guide To Data Analysis Optimization Analyzing Cost Per Click CPC To Ensure Higher ROI Slides PDF
Get a simple yet stunning designed Marketers Guide To Data Analysis Optimization Analyzing Cost Per Click CPC To Ensure Higher ROI Slides PDF. It is the best one to establish the tone in your meetings. It is an excellent way to make your presentations highly effective. So, download this PPT today from Slidegeeks and see the positive impacts. Our easy to edit Marketers Guide To Data Analysis Optimization Analyzing Cost Per Click CPC To Ensure Higher ROI Slides PDF can be your go to option for all upcoming conferences and meetings. So, what are you waiting for Grab this template today.
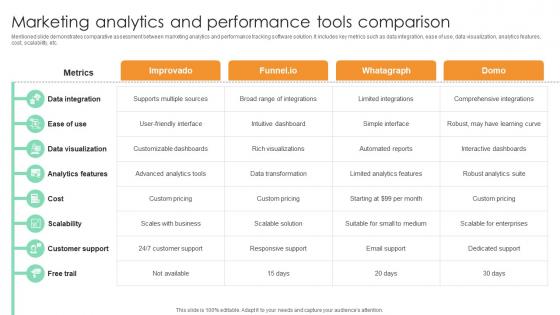
Marketing Analytics And Performance Tools Comparison Comprehensive Guide For Marketing Technology
Mentioned slide demonstrates comparative assessment between marketing analytics and performance tracking software solution. It includes key metrics such as data integration, ease of use, data visualization, analytics features, cost, scalability, etc.Get a simple yet stunning designed Marketing Analytics And Performance Tools Comparison Comprehensive Guide For Marketing Technology. It is the best one to establish the tone in your meetings. It is an excellent way to make your presentations highly effective. So, download this PPT today from Slidegeeks and see the positive impacts. Our easy-to-edit Marketing Analytics And Performance Tools Comparison Comprehensive Guide For Marketing Technology can be your go-to option for all upcoming conferences and meetings. So, what are you waiting for Grab this template today. Mentioned slide demonstrates comparative assessment between marketing analytics and performance tracking software solution. It includes key metrics such as data integration, ease of use, data visualization, analytics features, cost, scalability, etc.
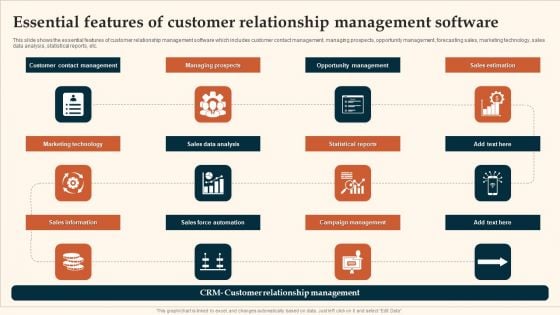
Essential Features Of Customer Relationship Management Software Formats PDF
This slide shows the essential features of customer relationship management software which includes customer contact management, managing prospects, opportunity management, forecasting sales, marketing technology, sales data analysis, statistical reports, etc. Presenting Essential Features Of Customer Relationship Management Software Formats PDF to dispense important information. This template comprises tweleve stages. It also presents valuable insights into the topics including Marketing Technology, Sales Data Analysis, Statistical Reports. This is a completely customizable PowerPoint theme that can be put to use immediately. So, download it and address the topic impactfully.
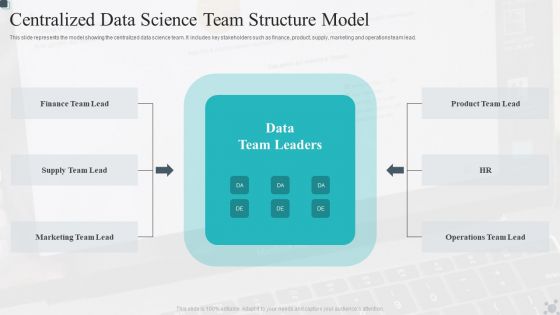
Centralized Data Science Team Structure Model Summary PDF
This slide represents the model showing the centralized data science team. It includes key stakeholders such as finance, product, supply, marketing and operations team lead.Showcasing this set of slides titled Centralized Data Science Team Structure Model Summary PDF. The topics addressed in these templates are Marketing Team, Finance Team, Operations Team. All the content presented in this PPT design is completely editable. Download it and make adjustments in color, background, font etc. as per your unique business setting.
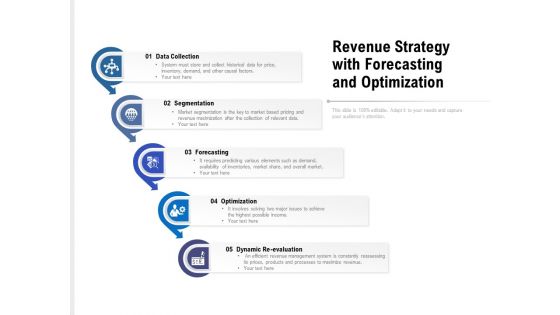
Revenue Strategy With Forecasting And Optimization Ppt PowerPoint Presentation Inspiration Templates
Presenting this set of slides with name revenue strategy with forecasting and optimization ppt powerpoint presentation inspiration templates. This is a five stage process. The stages in this process are data collection, segmentation, forecasting, optimization, dynamic re evaluation. This is a completely editable PowerPoint presentation and is available for immediate download. Download now and impress your audience.
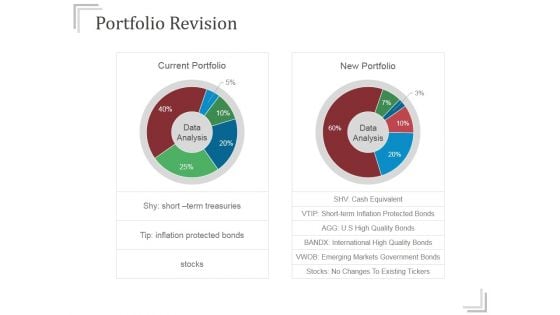
Portfolio Revision Ppt PowerPoint Presentation Slide
This is a portfolio revision ppt powerpoint presentation slide. This is a two stage process. The stages in this process are current portfolio, new portfolio, data analysis.
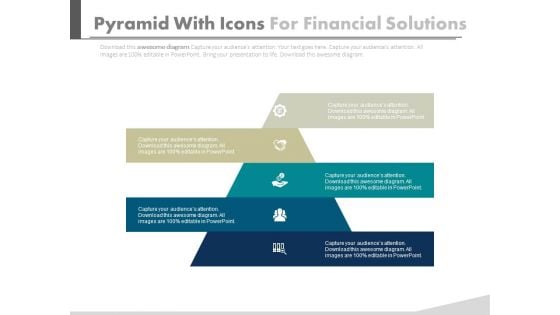
Pyramid For Financial Accounting Information Powerpoint Slides
This PowerPoint template has been designed with graphics of pyramid chart. This PPT slide can be used to prepare presentations for profit growth report and also for financial data analysis. You can download finance PowerPoint template to prepare awesome presentations.
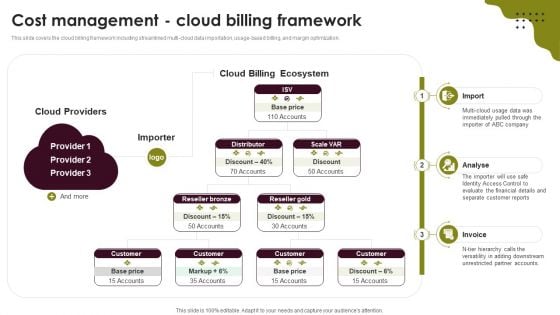
Cloud Computing Scalability Cost Management Cloud Billing Framework Infographics PDF
This slide covers the cloud billing framework including streamlined multi-cloud data importation, usage-based billing, and margin optimization. Do you have an important presentation coming up Are you looking for something that will make your presentation stand out from the rest Look no further than Cloud Computing Scalability Cost Management Cloud Billing Framework Infographics PDF. With our professional designs, you can trust that your presentation will pop and make delivering it a smooth process. And with Slidegeeks, you can trust that your presentation will be unique and memorable. So why wait Grab Cloud Computing Scalability Cost Management Cloud Billing Framework Infographics PDF today and make your presentation stand out from the rest.
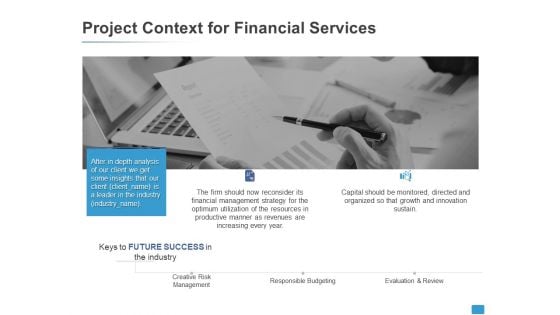
Project Context For Financial Services Data Analysis Ppt PowerPoint Presentation Professional Guidelines
Presenting this set of slides with name project context for financial services data analysis ppt powerpoint presentation professional guidelines. This is a two stage process. The stages in this process are agenda, target audiences, preferred by many, values client, strategy. This is a completely editable PowerPoint presentation and is available for immediate download. Download now and impress your audience.
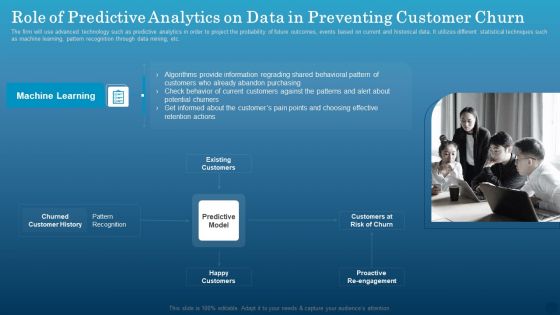
Role Of Predictive Analytics On Data In Preventing Customer Churn Formats PDF
The firm will use advanced technology such as predictive analytics in order to project the probability of future outcomes, events based on current and historical data. It utilizes different statistical techniques such as machine learning, pattern recognition through data mining, etc. Get a simple yet stunning designed Role Of Predictive Analytics On Data In Preventing Customer Churn Formats PDF. It is the best one to establish the tone in your meetings. It is an excellent way to make your presentations highly effective. So, download this PPT today from Slidegeeks and see the positive impacts. Our easy to edit Role Of Predictive Analytics On Data In Preventing Customer Churn Formats PDF can be your go-to option for all upcoming conferences and meetings. So, what are you waiting for Grab this template today.
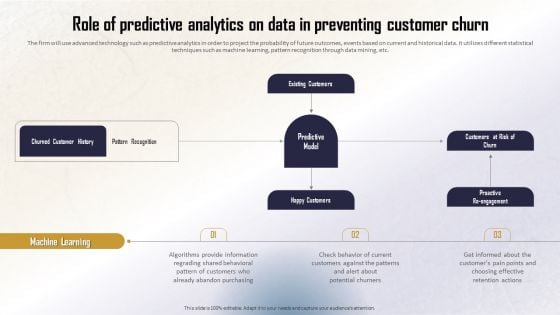
Identifying Direct And Indirect Role Of Predictive Analytics On Data In Preventing Summary PDF
The firm will use advanced technology such as predictive analytics in order to project the probability of future outcomes, events based on current and historical data. It utilizes different statistical techniques such as machine learning, pattern recognition through data mining, etc. Are you searching for a Identifying Direct And Indirect Role Of Predictive Analytics On Data In Preventing Summary PDF that is uncluttered, straightforward, and original Its easy to edit, and you can change the colors to suit your personal or business branding. For a presentation that expresses how much effort youve put in, this template is ideal With all of its features, including tables, diagrams, statistics, and lists, its perfect for a business plan presentation. Make your ideas more appealing with these professional slides. Download Identifying Direct And Indirect Role Of Predictive Analytics On Data In Preventing Summary PDF from Slidegeeks today.
Marketers Guide To Data Analysis Optimization Tracking Social Media Engagement Rate For Improving Conversions Brochure PDF
This slide covers an overview of the social media engagement rate to identify if the content is reaching the target audience. It also includes improvement strategies such as having a consistent, authentic voice, knowing your algorithms, and creating shareable content. Do you have to make sure that everyone on your team knows about any specific topic I yes, then you should give Marketers Guide To Data Analysis Optimization Tracking Social Media Engagement Rate For Improving Conversions Brochure PDF a try. Our experts have put a lot of knowledge and effort into creating this impeccable Marketers Guide To Data Analysis Optimization Tracking Social Media Engagement Rate For Improving Conversions Brochure PDF. You can use this template for your upcoming presentations, as the slides are perfect to represent even the tiniest detail. You can download these templates from the Slidegeeks website and these are easy to edit. So grab these today.
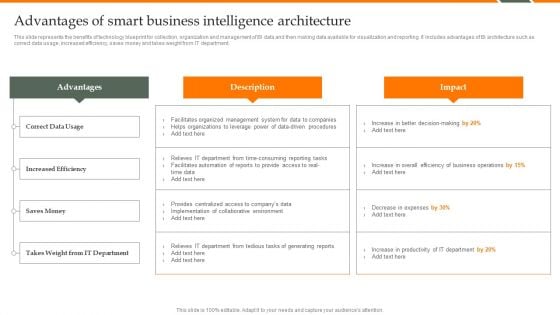
Human Resource Analytics Advantages Of Smart Business Intelligence Architecture Rules PDF
This slide represents the benefits of technology blueprint for collection, organization and management of BI data and then making data available for visualization and reporting. It includes advantages of BI architecture such as correct data usage, increased efficiency, saves money and takes weight from IT department. Take your projects to the next level with our ultimate collection of Human Resource Analytics Advantages Of Smart Business Intelligence Architecture Rules PDF. Slidegeeks has designed a range of layouts that are perfect for representing task or activity duration, keeping track of all your deadlines at a glance. Tailor these designs to your exact needs and give them a truly corporate look with your own brand colors theyll make your projects stand out from the rest.
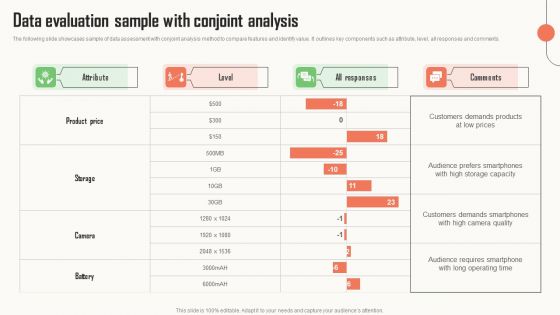
Strategic Market Insight Implementation Guide Data Evaluation Sample With Conjoint Analysis Background PDF
The following slide showcases sample of data assessment with conjoint analysis method to compare features and identify value. It outlines key components such as attribute, level, all responses and comments. Slidegeeks is here to make your presentations a breeze with Strategic Market Insight Implementation Guide Data Evaluation Sample With Conjoint Analysis Background PDF With our easy to use and customizable templates, you can focus on delivering your ideas rather than worrying about formatting. With a variety of designs to choose from, you are sure to find one that suits your needs. And with animations and unique photos, illustrations, and fonts, you can make your presentation pop. So whether you are giving a sales pitch or presenting to the board, make sure to check out Slidegeeks first.
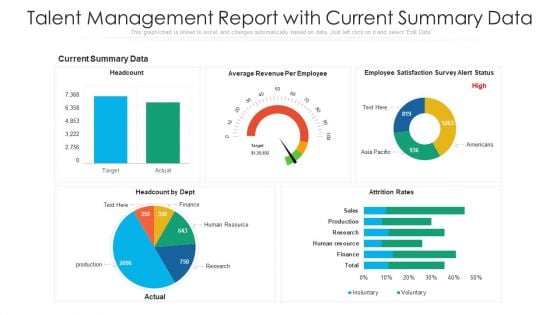
Talent Management Report With Current Summary Data Ppt Gallery Example Topics PDF
Showcasing this set of slides titled talent management report with current summary data ppt gallery example topics pdf. The topics addressed in these templates are human resource, research, production. All the content presented in this PPT design is completely editable. Download it and make adjustments in color, background, font etc. as per your unique business setting.
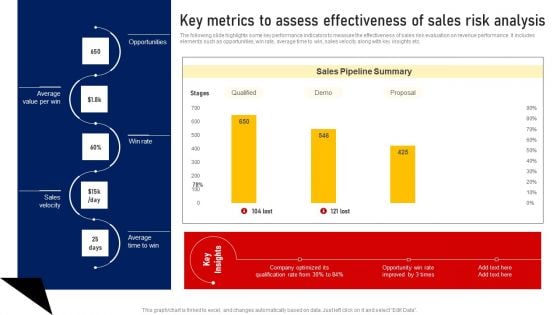
Performing Sales Risk Analysis Procedure Key Metrics To Assess Effectiveness Of Sales Risk Analysis Brochure PDF
The following slide highlights some key performance indicators to measure the effectiveness of sales risk evaluation on revenue performance. It includes elements such as opportunities, win rate, average time to win, sales velocity along with key insights etc. Get a simple yet stunning designed Performing Sales Risk Analysis Procedure Key Metrics To Assess Effectiveness Of Sales Risk Analysis Brochure PDF. It is the best one to establish the tone in your meetings. It is an excellent way to make your presentations highly effective. So, download this PPT today from Slidegeeks and see the positive impacts. Our easy to edit Performing Sales Risk Analysis Procedure Key Metrics To Assess Effectiveness Of Sales Risk Analysis Brochure PDF can be your go to option for all upcoming conferences and meetings. So, what are you waiting for Grab this template today.

Magnifying Glass Ppt PowerPoint Presentation Model Smartart
This is a magnifying glass ppt powerpoint presentation model smartart. This is a four stage process. The stages in this process are magnifying glass, business, marketing, management, finance.
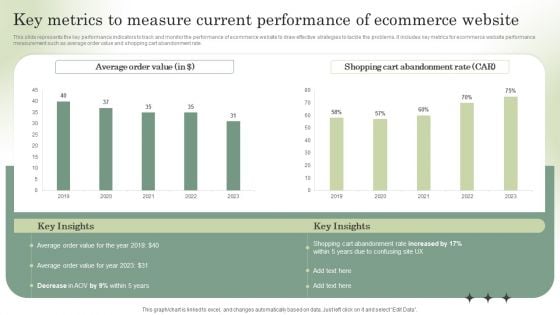
Optimizing Online Stores Key Metrics To Measure Current Performance Download PDF
This slide represents the key performance indicators to track and monitor the performance of ecommerce website to draw effective strategies to tackle the problems. It includes key metrics for ecommerce website performance measurement such as average order value and shopping cart abandonment rate. The Optimizing Online Stores Key Metrics To Measure Current Performance Download PDF is a compilation of the most recent design trends as a series of slides. It is suitable for any subject or industry presentation, containing attractive visuals and photo spots for businesses to clearly express their messages. This template contains a variety of slides for the user to input data, such as structures to contrast two elements, bullet points, and slides for written information. Slidegeeks is prepared to create an impression.
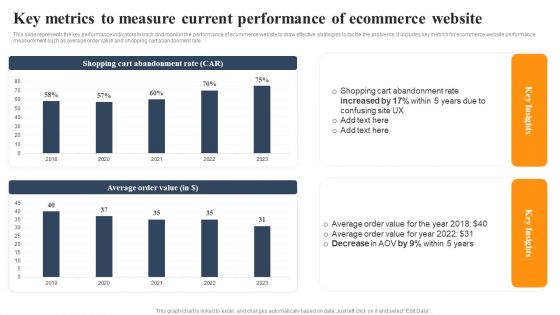
Implementing An Effective Ecommerce Management Framework Key Metrics Current Performance Of Ecommerce Website Slides PDF
This slide represents the key performance indicators to track and monitor the performance of ecommerce website to draw effective strategies to tackle the problems. It includes key metrics for ecommerce website performance measurement such as average order value and shopping cart abandonment rate. The Implementing An Effective Ecommerce Management Framework Key Metrics Current Performance Of Ecommerce Website Slides PDF is a compilation of the most recent design trends as a series of slides. It is suitable for any subject or industry presentation, containing attractive visuals and photo spots for businesses to clearly express their messages. This template contains a variety of slides for the user to input data, such as structures to contrast two elements, bullet points, and slides for written information. Slidegeeks is prepared to create an impression.
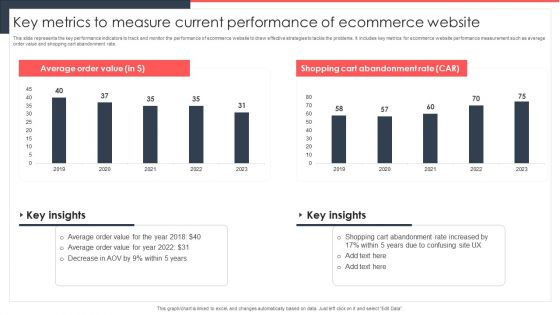
Implementing Management System To Enhance Ecommerce Processes Key Metrics To Measure Current Performance Themes PDF
This slide represents the key performance indicators to track and monitor the performance of ecommerce website to draw effective strategies to tackle the problems. It includes key metrics for ecommerce website performance measurement such as average order value and shopping cart abandonment rate. Do you know about Slidesgeeks Implementing Management System To Enhance Ecommerce Processes Key Metrics To Measure Current Performance Themes PDF. These are perfect for delivering any kind od presentation. Using it, create PowerPoint presentations that communicate your ideas and engage audiences. Save time and effort by using our pre designed presentation templates that are perfect for a wide range of topic. Our vast selection of designs covers a range of styles, from creative to business, and are all highly customizable and easy to edit. Download as a PowerPoint template or use them as Google Slides themes.
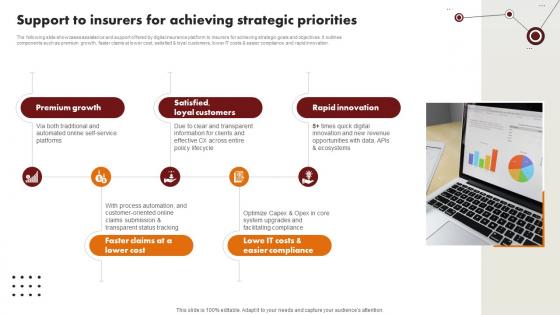
Technology Trends In Online Insurance Support To Insurers For Achieving Strategic Priorities
The following slide showcases assistance and support offered by digital insurance platform to insurers for achieving strategic goals and objectives. It outlines components such as premium growth, faster claims at lower cost, satisfied and loyal customers, lower IT costs and easier compliance and rapid innovation. Coming up with a presentation necessitates that the majority of the effort goes into the content and the message you intend to convey. The visuals of a PowerPoint presentation can only be effective if it supplements and supports the story that is being told. Keeping this in mind our experts created Technology Trends In Online Insurance Support To Insurers For Achieving Strategic Priorities to reduce the time that goes into designing the presentation. This way, you can concentrate on the message while our designers take care of providing you with the right template for the situation. The following slide showcases assistance and support offered by digital insurance platform to insurers for achieving strategic goals and objectives. It outlines components such as premium growth, faster claims at lower cost, satisfied and loyal customers, lower IT costs and easier compliance and rapid innovation.


 Continue with Email

 Home
Home


