Budget Dashboard
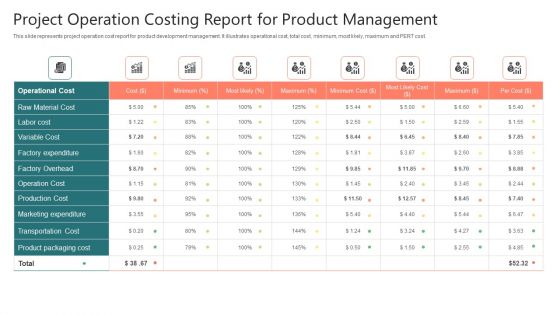
Project Operation Costing Report For Product Management Information PDF
This slide represents project operation cost report for product development management. It illustrates operational cost, total cost, minimum, most likely, maximum and PERT cost. Showcasing this set of slides titled Project Operation Costing Report For Product Management Information PDF. The topics addressed in these templates are Factory Expenditure, Variable Cost, Marketing Expenditure. All the content presented in this PPT design is completely editable. Download it and make adjustments in color, background, font etc. as per your unique business setting.
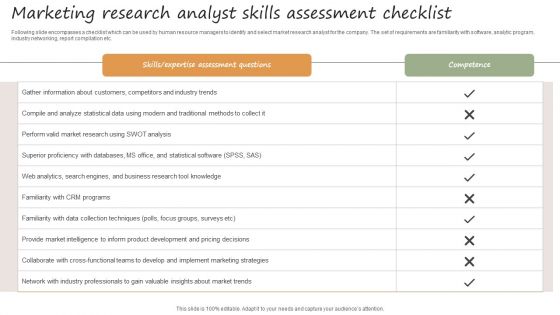
Marketing Research Analyst Skills Assessment Checklist Inspiration PDF
Following slide encompasses a checklist which can be used by human resource managers to identify and select market research analyst for the company. The set of requirements are familiarity with software, analytic program, industry networking, report compilation etc. Showcasing this set of slides titled Marketing Research Analyst Skills Assessment Checklist Inspiration PDF. The topics addressed in these templates are Gather Information Customers, Competitors Industry Trends, Statistical Data Using Modern. All the content presented in this PPT design is completely editable. Download it and make adjustments in color, background, font etc. as per your unique business setting.
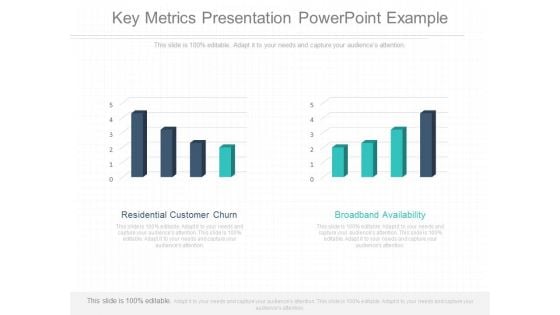
Key Metrics Presentation Powerpoint Example
This is a key metrics presentation powerpoint example. This is a two stage process. The stages in this process are residential customer churn, broadband availability.
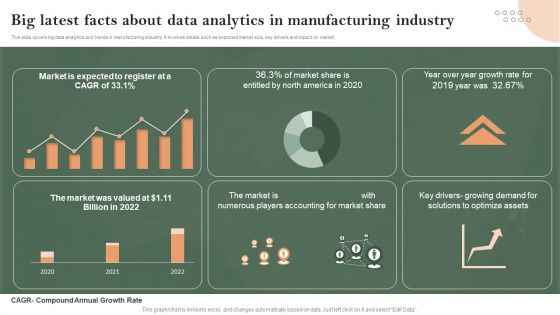
Big Latest Facts About Data Analytics In Manufacturing Industry Infographics PDF
This slide covers big data analytics and trends in manufacturing industry. It involves details such as expected market size, key drivers and impact on market. Pitch your topic with ease and precision using this Big Latest Facts About Data Analytics In Manufacturing Industry Infographics PDF. This layout presents information on Big Latest Facts, About Data Analytics, Manufacturing Industry. It is also available for immediate download and adjustment. So, changes can be made in the color, design, graphics or any other component to create a unique layout.
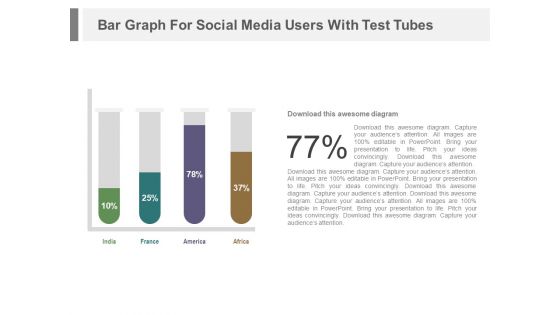
Test Tubes With Financial Data In Percentage Ratio Powerpoint Slides
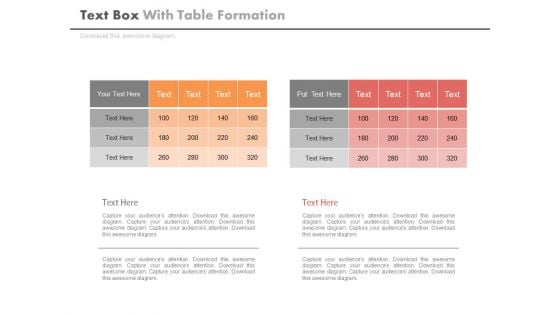
Two Table Charts For Business Data Powerpoint Slides
This PowerPoint template contains two tables chart. You may download this PPT slide to display statistical analysis. You can easily customize this template to make it more unique as per your need.
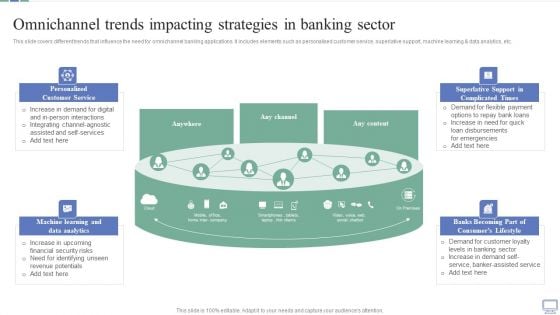
Omnichannel Banking Services Platform Omnichannel Trends Impacting Strategies In Banking Sector Designs PDF
This slide covers different trends that influence the need for omnichannel banking applications. It includes elements such as personalised customer service, superlative support, machine learning and data analytics, etc. Do you have to make sure that everyone on your team knows about any specific topic I yes, then you should give Omnichannel Banking Services Platform Omnichannel Trends Impacting Strategies In Banking Sector Designs PDF a try. Our experts have put a lot of knowledge and effort into creating this impeccable Omnichannel Banking Services Platform Omnichannel Trends Impacting Strategies In Banking Sector Designs PDF. You can use this template for your upcoming presentations, as the slides are perfect to represent even the tiniest detail. You can download these templates from the Slidegeeks website and these are easy to edit. So grab these today.

Kpis To Measure International Growth Performance Ppt Infographics Graphic Tips PDF
This slide shows various KPIs which can be used to evaluate international growth performance. It includes revenue, e-commerce conversion rate, cost per acquisition, bounce rate, etc. Pitch your topic with ease and precision using this Kpis To Measure International Growth Performance Ppt Infographics Graphic Tips PDF. This layout presents information on Revenue, Cost Per Acquisition, Bounce Rate. It is also available for immediate download and adjustment. So, changes can be made in the color, design, graphics or any other component to create a unique layout.
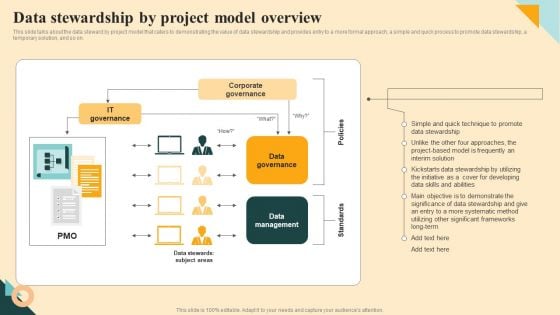
Data Stewardship By Project Model Overview Structure PDF
This slide talks about the data steward by project model that caters to demonstrating the value of data stewardship and provides entry to a more formal approach, a simple and quick process to promote data stewardship, a temporary solution, and so on. There are so many reasons you need a Data Stewardship By Project Model Overview Structure PDF. The first reason is you can not spend time making everything from scratch, Thus, Slidegeeks has made presentation templates for you too. You can easily download these templates from our website easily.
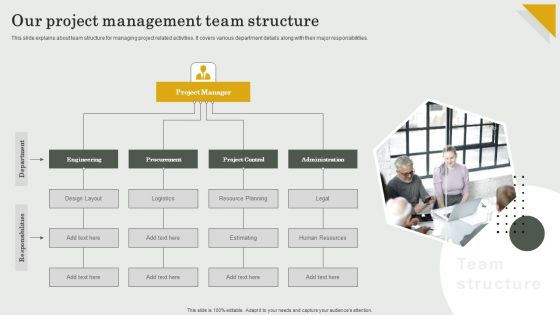
Submission Of Project Viability Report For Bank Loan Our Project Management Team Structure Sample PDF
Whether you have daily or monthly meetings, a brilliant presentation is necessary. Submission Of Project Viability Report For Bank Loan Our Project Management Team Structure Sample PDF can be your best option for delivering a presentation. Represent everything in detail using Submission Of Project Viability Report For Bank Loan Our Project Management Team Structure Sample PDF and make yourself stand out in meetings. The template is versatile and follows a structure that will cater to your requirements. All the templates prepared by Slidegeeks are easy to download and edit. Our research experts have taken care of the corporate themes as well. So, give it a try and see the results.
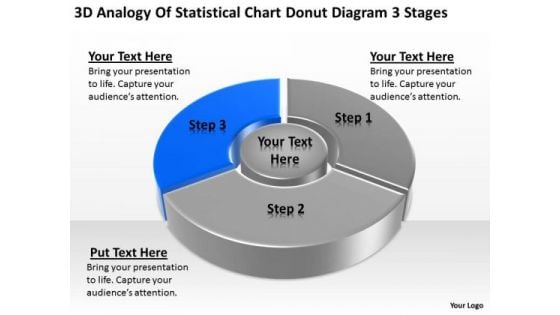
Statistical Chart Donut Diagram 3 Stages Ppt Samples Business Plan PowerPoint Slides
We present our statistical chart donut diagram 3 stages ppt samples business plan PowerPoint Slides.Download our Finance PowerPoint Templates because you should Experience excellence with our PowerPoint Templates and Slides. They will take your breath away. Present our Marketing PowerPoint Templates because our bewitching PowerPoint Templates and Slides will delight your audience with the magic of your words. Use our Sales PowerPoint Templates because You have gained great respect for your brilliant ideas. Use our PowerPoint Templates and Slides to strengthen and enhance your reputation. Download our Business PowerPoint Templates because You have a driving passion to excel in your field. Our PowerPoint Templates and Slides will prove ideal vehicles for your ideas. Download our Success PowerPoint Templates because You should Kick up a storm with our PowerPoint Templates and Slides. The heads of your listeners will swirl with your ideas.Use these PowerPoint slides for presentations relating to Chart, Business, Data, Donut, Market, Sales, Document, Economy, Display, Bar, Corporate, Income, Concept, Success, Presentation, Symbol, Diagram, Percentage, Graphic, Finance, Stock, Clean, Analysis, Report, Marketing, Accounting, Management, Graph, Colors, Forecast, Design, Growth, Competition, Progress, Profit, Information, Background, Trade, Investment, Statistic, Financial. The prominent colors used in the PowerPoint template are Blue, Gray, Black. Make the event with our Statistical Chart Donut Diagram 3 Stages Ppt Samples Business Plan PowerPoint Slides. Your thoughts will be really happening.
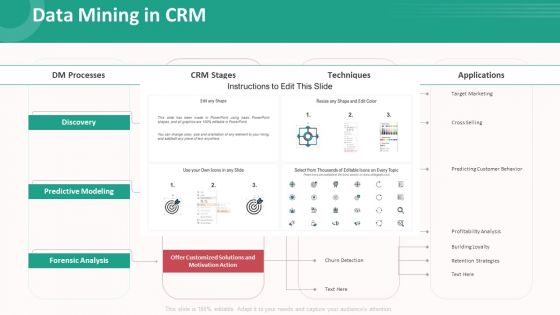
Customer Relationship Management Action Plan Data Mining In CRM Mockup PDF
Deliver an awe inspiring pitch with this creative customer relationship management action plan data mining in crm mockup pdf bundle. Topics like discovery, predictive modeling, forensic analysis can be discussed with this completely editable template. It is available for immediate download depending on the needs and requirements of the user.
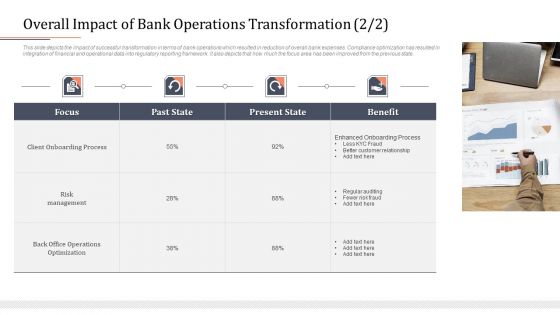
Modifying Banking Functionalities Overall Impact Of Bank Operations Transformation State Template PDF
This slide depicts the impact of successful transformation in terms of bank operations which resulted in reduction of overall bank expenses. Compliance optimization has resulted in integration of financial and operational data into regulatory reporting framework. It also depicts that how much the focus area has been improved from the previous state. Presenting modifying banking functionalities overall impact of bank operations transformation state template pdf to provide visual cues and insights. Share and navigate important information on four stages that need your due attention. This template can be used to pitch topics like process, risk management, optimization. In addtion, this PPT design contains high resolution images, graphics, etc, that are easily editable and available for immediate download.
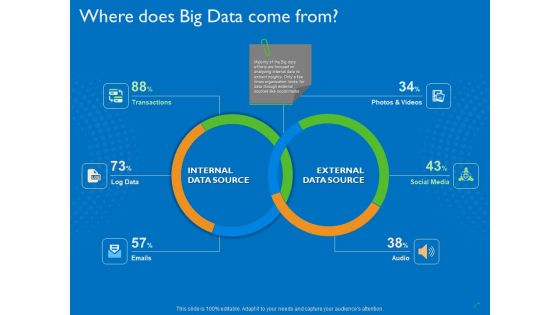
Transforming Big Data Analytics To Knowledge Where Does Big Data Come From Ppt Gallery Styles PDF
This is a transforming big data analytics to knowledge where does big data come from ppt gallery styles pdf template with various stages. Focus and dispense information on six stages using this creative set, that comes with editable features. It contains large content boxes to add your information on topics like transactions, social media, emails, audio, log data. You can also showcase facts, figures, and other relevant content using this PPT layout. Grab it now.
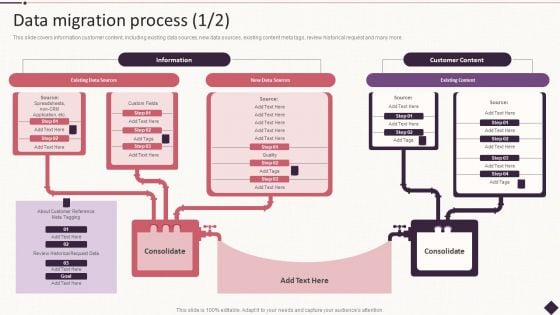
IT Project Development Planning Data Migration Process Brochure PDF
This slide covers information customer content, including existing data sources, new data sources, existing content meta tags, review historical request and many more.Deliver and pitch your topic in the best possible manner with this IT Project Development Planning Data Migration Process Brochure PDF. Use them to share invaluable insights on System Requirements, Maintenance Planner, Specific Preparation and impress your audience. This template can be altered and modified as per your expectations. So, grab it now.
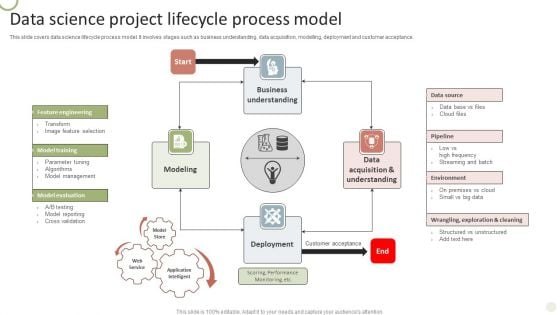
Data Science Project Lifecycle Process Model Brochure PDF
This slide covers data science lifecycle process model. It involves stages such as business understanding, data acquisition, modelling, deployment and customer acceptance.Showcasing this set of slides titled Data Science Project Lifecycle Process Model Brochure PDF. The topics addressed in these templates are Model Management, Parameter Tuning, Feature Selection. All the content presented in this PPT design is completely editable. Download it and make adjustments in color, background, font etc. as per your unique business setting.
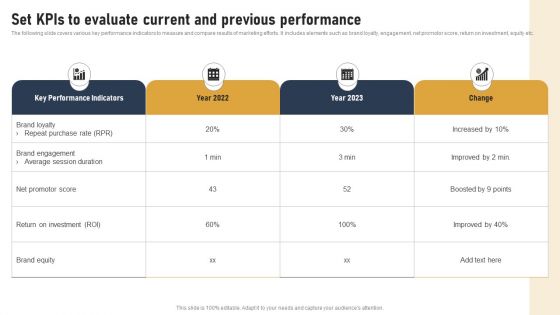
Incorporating Real Time Marketing For Improved Consumer Set Kpis To Evaluate Current And Previous Introduction PDF
The following slide covers various key performance indicators to measure and compare results of marketing efforts. It includes elements such as brand loyalty, engagement, net promotor score, return on investment, equity etc. The Incorporating Real Time Marketing For Improved Consumer Set Kpis To Evaluate Current And Previous Introduction PDF is a compilation of the most recent design trends as a series of slides. It is suitable for any subject or industry presentation, containing attractive visuals and photo spots for businesses to clearly express their messages. This template contains a variety of slides for the user to input data, such as structures to contrast two elements, bullet points, and slides for written information. Slidegeeks is prepared to create an impression.
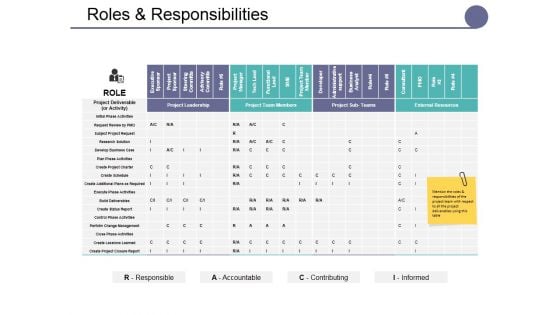
Roles And Responsibilities Ppt PowerPoint Presentation Pictures Sample
This is a roles and responsibilities ppt powerpoint presentation pictures sample. This is a four stage process. The stages in this process are project leadership, project team members, external resources, role.
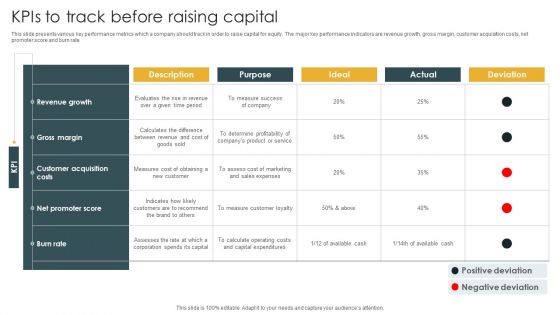
Kpis To Track Before Raising Capital Portrait PDF
This slide presents various key performance metrics which a company should track in order to raise capital for equity. The major key performance indicators are revenue growth, gross margin, customer acquisition costs, net promoter score and burn rate. Pitch your topic with ease and precision using this Kpis To Track Before Raising Capital Portrait PDF. This layout presents information on Net Promoter Score, Customer Acquisition Costs, Gross Margin. It is also available for immediate download and adjustment. So, changes can be made in the color, design, graphics or any other component to create a unique layout.
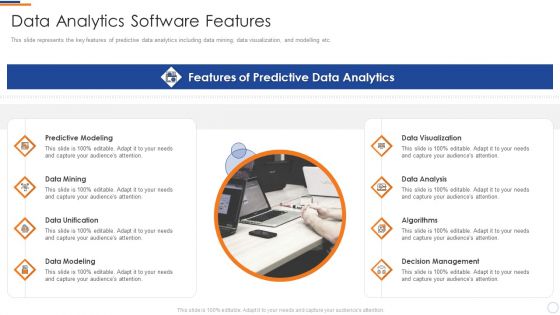
Business Intelligence And Big Transformation Toolkit Data Analytics Software Features Slides PDF
This slide represents the key features of predictive data analytics including data mining, data visualization, and modelling etc. This is a business intelligence and big transformation toolkit data analytics software features slides pdf template with various stages. Focus and dispense information on eight stages using this creative set, that comes with editable features. It contains large content boxes to add your information on topics like predictive modeling, data mining, data unification, data modeling, visualization and presentation. You can also showcase facts, figures, and other relevant content using this PPT layout. Grab it now.
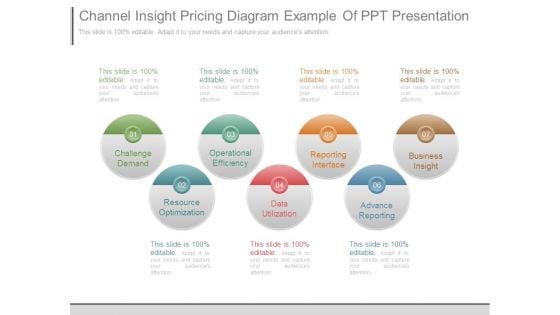
Channel Insight Pricing Diagram Example Of Ppt Presentation
This is a channel insight pricing diagram example of ppt presentation. This is a seven stage process. The stages in this process are challenge demand, operational efficiency, reporting interface, business insight, resource optimization, data utilization, advance reporting.
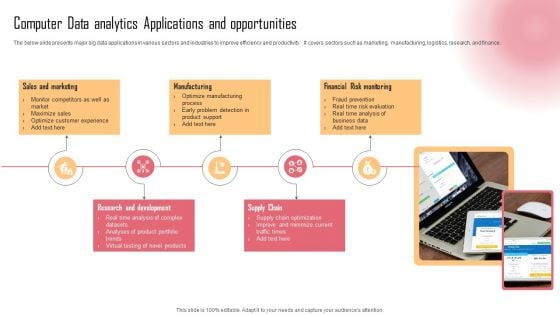
Computer Data Analytics Applications And Opportunities Demonstration PDF
The below slide presents major big data applications in various sectors and industries to improve efficiency and productivity. It covers sectors such as marketing, manufacturing, logistics, research, and finance. Presenting Computer Data Analytics Applications And Opportunities Demonstration PDF to dispense important information. This template comprises five stages. It also presents valuable insights into the topics including Sales And Marketing, Manufacturing, Financial Risk Monitoring . This is a completely customizable PowerPoint theme that can be put to use immediately. So, download it and address the topic impactfully.
Key Performance Indicators Comparison Analysis Ppt PowerPoint Presentation Complete Deck With Slides
Improve your presentation delivery using this Key Performance Indicators Comparison Analysis Ppt PowerPoint Presentation Complete Deck With Slides. Support your business vision and objectives using this well-structured PPT deck. This template offers a great starting point for delivering beautifully designed presentations on the topic of your choice. Comprising twalve this professionally designed template is all you need to host discussion and meetings with collaborators. Each slide is self-explanatory and equipped with high-quality graphics that can be adjusted to your needs. Therefore, you will face no difficulty in portraying your desired content using this PPT slideshow. This PowerPoint slideshow contains every important element that you need for a great pitch. It is not only editable but also available for immediate download and utilization. The color, font size, background, shapes everything can be modified to create your unique presentation layout. Therefore, download it now.
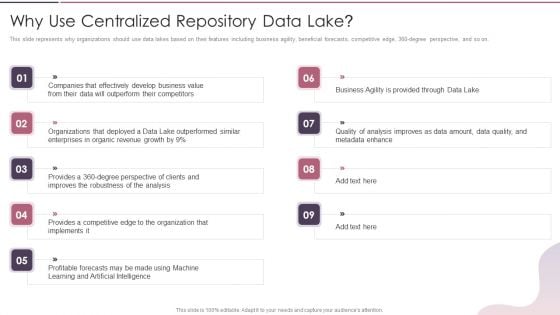
Data Lake Development With Azure Cloud Software Why Use Centralized Repository Data Lake Structure PDF
This slide represents why organizations should use data lakes based on their features including business agility, beneficial forecasts, competitive edge, 360 degree perspective, and so on. This is a Data Lake Development With Azure Cloud Software Why Use Centralized Repository Data Lake Structure PDF template with various stages. Focus and dispense information on nine stages using this creative set, that comes with editable features. It contains large content boxes to add your information on topics like Organizations, Enterprises, Organic Revenue Growth. You can also showcase facts, figures, and other relevant content using this PPT layout. Grab it now.
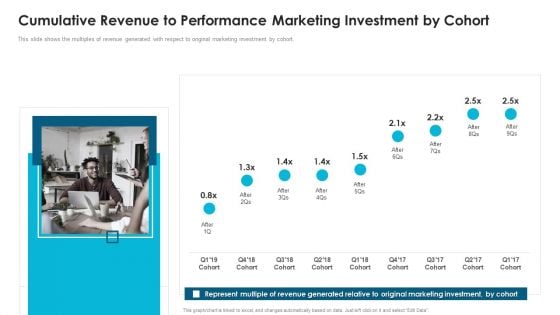
Fiverr Capital Fundraising Cumulative Revenue To Performance Marketing Investment Ppt Infographics Grid PDF
This slide shows the multiples of revenue generated with respect to original marketing investment by cohort. This is a Fiverr Capital Fundraising Cumulative Revenue To Performance Marketing Investment Ppt Infographics Grid PDF template with various stages. Focus and dispense information on one stages using this creative set, that comes with editable features. It contains large content boxes to add your information on topics like Represent Multiple Revenue, Generated Relative Original, Marketing Investment Cohort. You can also showcase facts, figures, and other relevant content using this PPT layout. Grab it now.
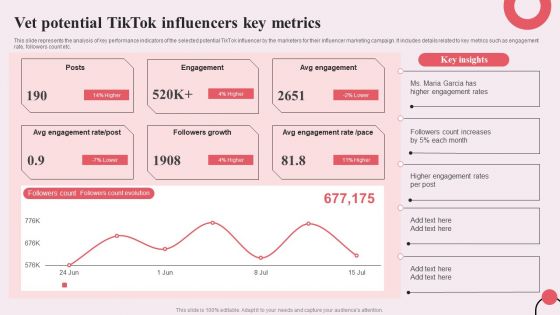
Tiktok Digital Marketing Campaign Vet Potential Tiktok Influencers Key Metrics Download PDF
This slide represents the analysis of key performance indicators of the selected potential TikTok influencer by the marketers for their influencer marketing campaign. It includes details related to key metrics such as engagement rate, followers count etc. Do you have to make sure that everyone on your team knows about any specific topic I yes, then you should give Tiktok Digital Marketing Campaign Vet Potential Tiktok Influencers Key Metrics Download PDF a try. Our experts have put a lot of knowledge and effort into creating this impeccable Tiktok Digital Marketing Campaign Vet Potential Tiktok Influencers Key Metrics Download PDF. You can use this template for your upcoming presentations, as the slides are perfect to represent even the tiniest detail. You can download these templates from the Slidegeeks website and these are easy to edit. So grab these today
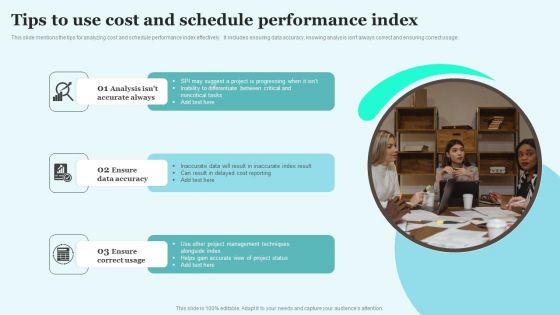
Tips To Use Cost And Schedule Performance Index Diagrams PDF
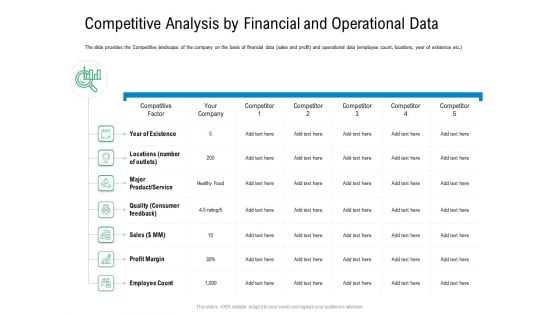
Convertible Preferred Stock Funding Pitch Deck Competitive Analysis By Financial And Operational Data Brochure PDF
The slide provides the Competitive landscape of the company on the basis of financial data sales and profit and operational data employee count, locations, year of existence etc. Deliver an awe inspiring pitch with this creative convertible preferred stock funding pitch deck competitive analysis by financial and operational data brochure pdf bundle. Topics like sales, profit margin, service, quality, locations can be discussed with this completely editable template. It is available for immediate download depending on the needs and requirements of the user.

Comprehensive Customer Data Platform Guide Optimizing Promotional Initiatives Traeger Grills Cdp Execution Outcomes Sample PDF
The following slide illustrates key benefits gained by Trager Grills post customer platform adoption to attract and retain customers. It includes elements such as challenges, solutions, outcomes, data driven decision making, predictive marketing, click rate, conversion rates etc. Do you have an important presentation coming up Are you looking for something that will make your presentation stand out from the rest Look no further than Comprehensive Customer Data Platform Guide Optimizing Promotional Initiatives Traeger Grills Cdp Execution Outcomes Sample PDF. With our professional designs, you can trust that your presentation will pop and make delivering it a smooth process. And with Slidegeeks, you can trust that your presentation will be unique and memorable. So why wait Grab Comprehensive Customer Data Platform Guide Optimizing Promotional Initiatives Traeger Grills Cdp Execution Outcomes Sample PDF today and make your presentation stand out from the rest.
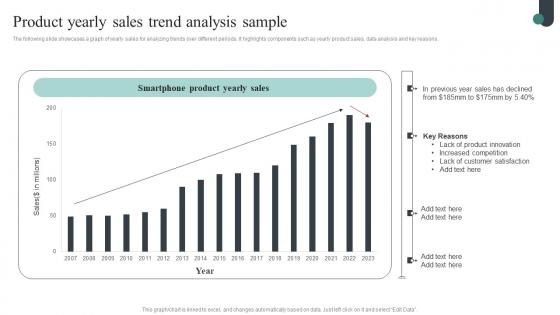
Competitive Intelligence Guide To Determine Market Product Yearly Sales Trend Download Pdf
The following slide showcases a graph of yearly sales for analyzing trends over different periods. It highlights components such as yearly product sales, data analysis and key reasons. This modern and well-arranged Competitive Intelligence Guide To Determine Market Product Yearly Sales Trend Download Pdf provides lots of creative possibilities. It is very simple to customize and edit with the Powerpoint Software. Just drag and drop your pictures into the shapes. All facets of this template can be edited with Powerpoint no extra software is necessary. Add your own material, put your images in the places assigned for them, adjust the colors, and then you can show your slides to the world, with an animated slide included. The following slide showcases a graph of yearly sales for analyzing trends over different periods. It highlights components such as yearly product sales, data analysis and key reasons.
Scenario Analysis Steps
Retrieve professionally designed Scenario Analysis Steps to effectively convey your message and captivate your listeners. Save time by selecting pre-made slideshows that are appropriate for various topics, from business to educational purposes. These themes come in many different styles, from creative to corporate, and all of them are easily adjustable and can be edited quickly. Access them as PowerPoint templates or as Google Slides themes. You do not have to go on a hunt for the perfect presentation because Slidegeeks got you covered from everywhere. The Scenario Analysis Steps PPT outlines the key stages of conducting effective scenario analysis. From defining objectives and collecting data to evaluating outcomes and integrating findings into business strategy, this template guides users through each step. Its an essential tool for analysts, consultants, and decision-makers who need to forecast future scenarios and make informed decisions based on different possible outcomes.
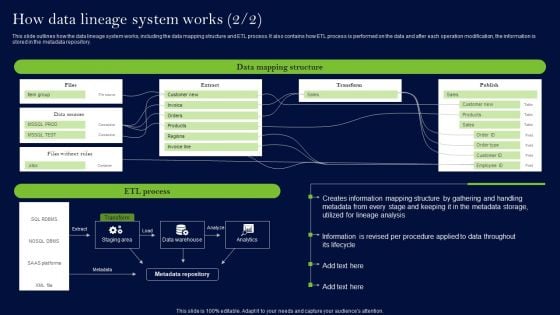
Data Lineage Methods How Data Lineage System Works Inspiration PDF
This slide outlines how the data lineage system works, including the data mapping structure and ETL process. It also contains how ETL process is performed on the data and after each operation modification, the information is stored in the metadata repository. If your project calls for a presentation, then Slidegeeks is your go-to partner because we have professionally designed, easy-to-edit templates that are perfect for any presentation. After downloading, you can easily edit Data Lineage Methods How Data Lineage System Works Inspiration PDF and make the changes accordingly. You can rearrange slides or fill them with different images. Check out all the handy templates
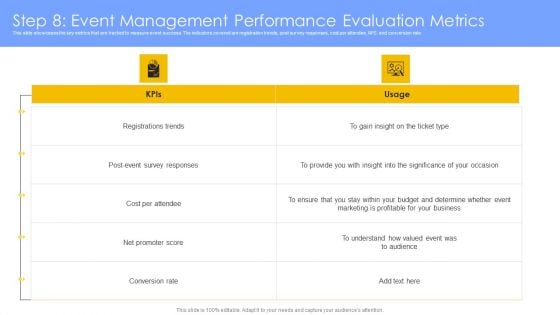
Step 8 Event Management Performance Evaluation Metrics Themes PDF
This slide showcases the key metrics that are tracked to measure event success. The indicators covered are registration trends, post survey responses, cost per attendee, NPS and conversion rate. Take your projects to the next level with our ultimate collection of Step 8 Event Management Performance Evaluation Metrics Themes PDF. Slidegeeks has designed a range of layouts that are perfect for representing task or activity duration, keeping track of all your deadlines at a glance. Tailor these designs to your exact needs and give them a truly corporate look with your own brand colors they will make your projects stand out from the rest
Latest Trends And Opportunities In Manufacturing Data Analysis Designs PDF
Persuade your audience using this Latest Trends And Opportunities In Manufacturing Data Analysis Designs PDF. This PPT design covers four stages, thus making it a great tool to use. It also caters to a variety of topics including Manufacturing Data Analysis, Opportunities. Download this PPT design now to present a convincing pitch that not only emphasizes the topic but also showcases your presentation skills.
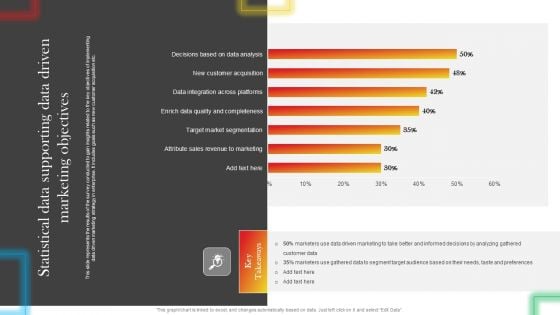
Statistical Data Supporting Data Driven Marketing Objectives Summary PDF
This slide represents the results of the survey conducted to gain insights related to the key objectives of implementing data driven marketing strategy in enterprise. It includes goals such as new customer acquisition etc. Are you in need of a template that can accommodate all of your creative concepts This one is crafted professionally and can be altered to fit any style. Use it with Google Slides or PowerPoint. Include striking photographs, symbols, depictions, and other visuals. Fill, move around, or remove text boxes as desired. Test out color palettes and font mixtures. Edit and save your work, or work with colleagues. Download Statistical Data Supporting Data Driven Marketing Objectives Summary PDF and observe how to make your presentation outstanding. Give an impeccable presentation to your group and make your presentation unforgettable.
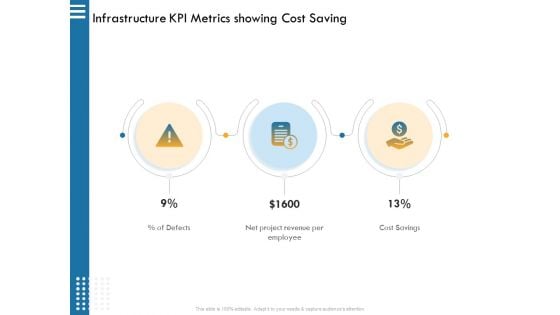
IT Infrastructure Governance Infrastructure KPI Metrics Showing Cost Saving Ppt Infographic Template Graphic Images PDF
This is a it infrastructure governance infrastructure kpi metrics showing cost saving ppt infographic template graphic images pdf. template with various stages. Focus and dispense information on three stages using this creative set, that comes with editable features. It contains large content boxes to add your information on topics like defects, net project revenue per employee, cost savings. You can also showcase facts, figures, and other relevant content using this PPT layout. Grab it now
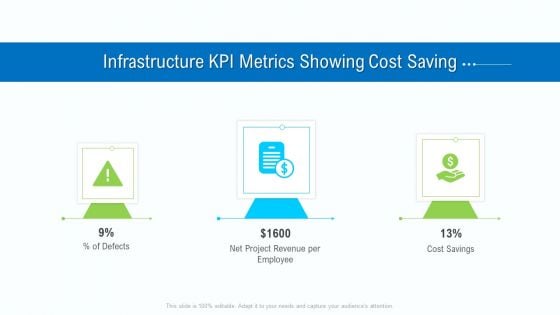
Business Activities Assessment Examples Infrastructure KPI Metrics Showing Cost Saving Infographics PDF
Presenting business activities assessment examples infrastructure kpi metrics showing cost saving infographics pdf to provide visual cues and insights. Share and navigate important information on three stages that need your due attention. This template can be used to pitch topics like net project revenue per employee, cost savings . In addtion, this PPT design contains high resolution images, graphics, etc, that are easily editable and available for immediate download.
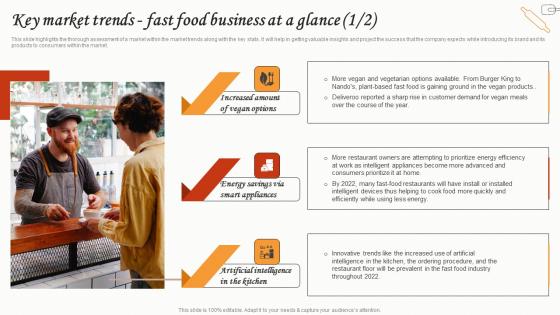
Key Market Trends Fast Food Business At A Glance Small Restaurant Business Portrait Pdf
This slide highlights the thorough assessment of a market within the market trends along with the key stats. It will help in getting valuable insights and project the success that the company expects while introducing its brand and its products to consumers within the market. Create an editable Key Market Trends Fast Food Business At A Glance Small Restaurant Business Portrait Pdf that communicates your idea and engages your audience. Whether you are presenting a business or an educational presentation, pre-designed presentation templates help save time. Key Market Trends Fast Food Business At A Glance Small Restaurant Business Portrait Pdf is highly customizable and very easy to edit, covering many different styles from creative to business presentations. Slidegeeks has creative team members who have crafted amazing templates. So, go and get them without any delay. This slide highlights the thorough assessment of a market within the market trends along with the key stats. It will help in getting valuable insights and project the success that the company expects while introducing its brand and its products to consumers within the market.
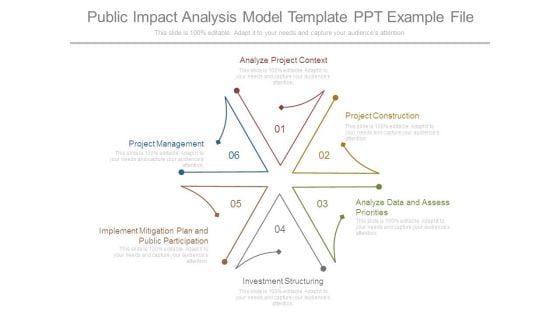
Public Impact Analysis Model Template Ppt Example File
This is a public impact analysis model template ppt example file. This is a six stage process. The stages in this process are analyze project context, project construction, analyze data and assess priorities, investment structuring, implement mitigation plan and public participation, project management.
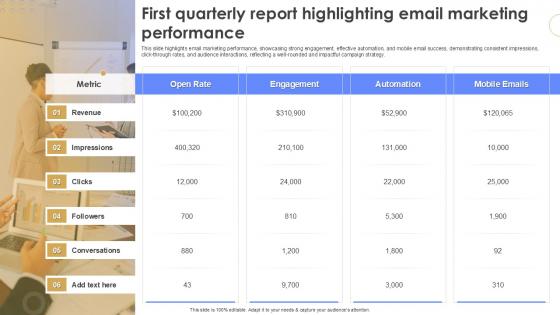
First Quarterly Report Highlighting Email Marketing Performance Quarterly Report Ppt Example
This slide highlights email marketing performance, showcasing strong engagement, effective automation, and mobile email success, demonstrating consistent impressions, click-through rates, and audience interactions, reflecting a well-rounded and impactful campaign strategy. Boost your pitch with our creative First Quarterly Report Highlighting Email Marketing Performance Quarterly Report Ppt Example Deliver an awe-inspiring pitch that will mesmerize everyone. Using these presentation templates you will surely catch everyones attention. You can browse the ppts collection on our website. We have researchers who are experts at creating the right content for the templates. So you do not have to invest time in any additional work. Just grab the template now and use them. This slide highlights email marketing performance, showcasing strong engagement, effective automation, and mobile email success, demonstrating consistent impressions, click-through rates, and audience interactions, reflecting a well-rounded and impactful campaign strategy.
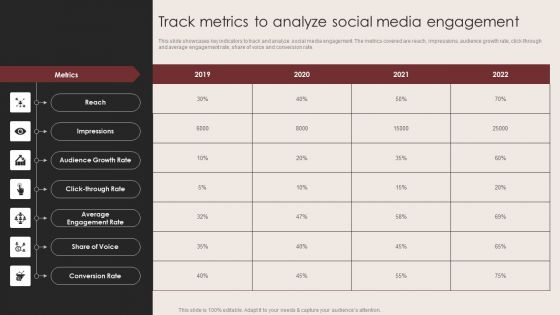
E Commerce Clothing Business Strategy Track Metrics To Analyze Social Media Engagement Background PDF
This slide showcases key indicators to track and analyze social media engagement. The metrics covered are reach, impressions, audience growth rate, click-through and average engagement rate, share of voice and conversion rate.Slidegeeks is one of the best resources for PowerPoint templates. You can download easily and regulate E Commerce Clothing Business Strategy Track Metrics To Analyze Social Media Engagement Background PDF for your personal presentations from our wonderful collection. A few clicks is all it takes to discover and get the most relevant and appropriate templates. Use our Templates to add a unique zing and appeal to your presentation and meetings. All the slides are easy to edit and you can use them even for advertisement purposes.
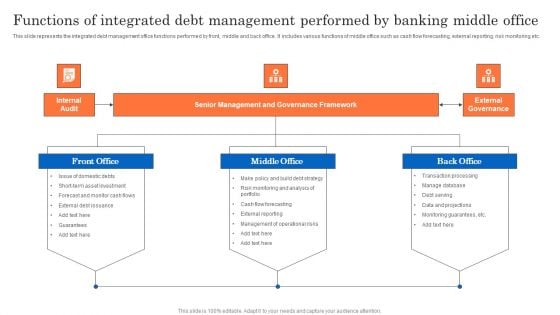
Functions Of Integrated Debt Management Performed By Banking Middle Office Infographics PDF
This slide represents the integrated debt management office functions performed by front, middle and back office. It includes various functions of middle office such as cash flow forecasting, external reporting, risk monitoring etc. Presenting Functions Of Integrated Debt Management Performed By Banking Middle Office Infographics PDF to dispense important information. This template comprises three stages. It also presents valuable insights into the topics including Front Office, Middle Office, Back Office. This is a completely customizable PowerPoint theme that can be put to use immediately. So, download it and address the topic impactfully.
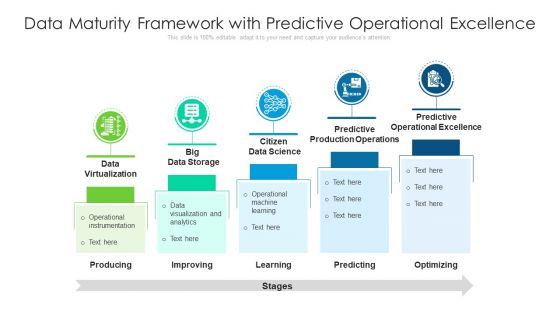
Data Maturity Framework With Predictive Operational Excellence Ppt PowerPoint Presentation Gallery Pictures PDF
Presenting data maturity framework with predictive operational excellence ppt powerpoint presentation gallery pictures pdf to dispense important information. This template comprises five stages. It also presents valuable insights into the topics including producing, improving, learning. This is a completely customizable PowerPoint theme that can be put to use immediately. So, download it and address the topic impactfully.
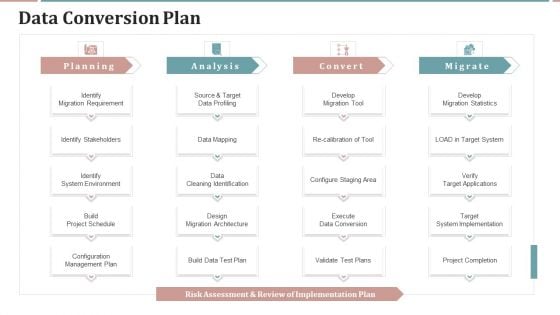
Project Planning Templates Bundle Data Conversion Plan Professional PDF
Deliver an awe inspiring pitch with this creative Project Planning Templates Bundle Data Conversion Plan Professional PDF bundle. Topics like Identify Stakeholders, System Environment, Migration Architecture can be discussed with this completely editable template. It is available for immediate download depending on the needs and requirements of the user.
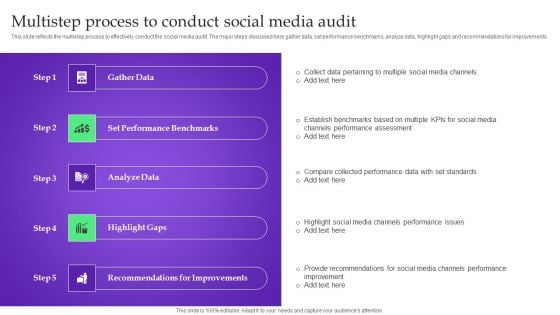
Analysis Plan For E Commerce Promotion Tactics Multistep Process To Conduct Social Media Audit Themes PDF
This slide reflects the multistep process to effectively conduct the social media audit. The major steps discussed here gather data, set performance benchmarks, analyze data, highlight gaps and recommendations for improvements. This slide reflects the multistep process to effectively conduct the social media audit. The major steps discussed here gather data, set performance benchmarks, analyze data, highlight gaps and recommendations for improvements. Want to ace your presentation in front of a live audience Our Analysis Plan For E Commerce Promotion Tactics Multistep Process To Conduct Social Media Audit Themes PDF can help you do that by engaging all the users towards you. Slidegeeks experts have put their efforts and expertise into creating these impeccable powerpoint presentations so that you can communicate your ideas clearly. Moreover, all the templates are customizable, and easy to edit and downloadable. Use these for both personal and commercial use.
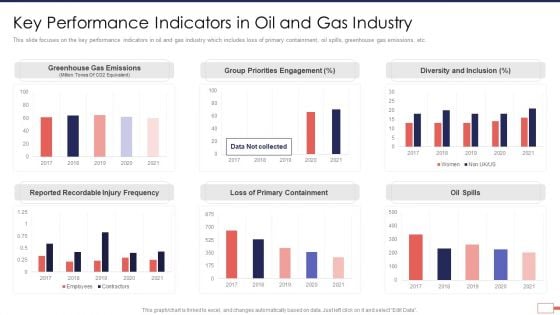
Iot Digital Twin Technology Post Covid Expenditure Management Key Performance Indicators Background PDF
This slide focuses on the key performance indicators in oil and gas industry which includes loss of primary containment, oil spills, greenhouse gas emissions, etc. Deliver an awe inspiring pitch with this creative iot digital twin technology post covid expenditure management key performance indicators background pdf bundle. Topics like key performance indicators in oil and gas industry can be discussed with this completely editable template. It is available for immediate download depending on the needs and requirements of the user.
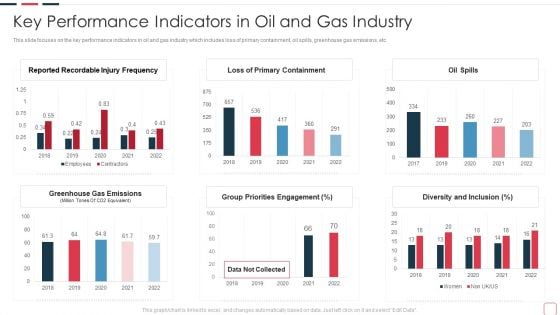
Price Benefit Internet Things Digital Twins Execution After Covid Key Performance Indicators In Oil Slides PDF
This slide focuses on the key performance indicators in oil and gas industry which includes loss of primary containment, oil spills, greenhouse gas emissions, etc. Deliver an awe inspiring pitch with this creative price benefit internet things digital twins execution after covid key performance indicators in oil slides pdf bundle. Topics like key performance indicators in oil and gas industry can be discussed with this completely editable template. It is available for immediate download depending on the needs and requirements of the user.
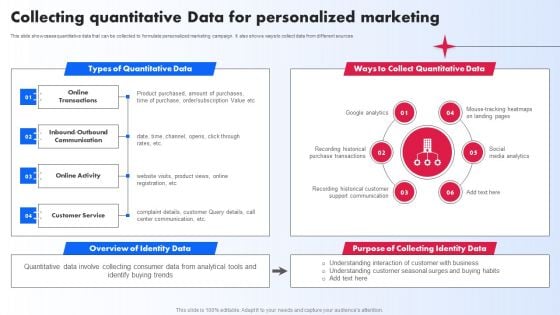
Collecting Quantitative Data For Personalized Marketing Ppt PowerPoint Presentation File Model PDF
This slide showcases quantitative data that can be collected to formulate personalized marketing campaign. It also shows ways to collect data from different sources If your project calls for a presentation, then Slidegeeks is your go to partner because we have professionally designed, easy to edit templates that are perfect for any presentation. After downloading, you can easily edit Collecting Quantitative Data For Personalized Marketing Ppt PowerPoint Presentation File Model PDF and make the changes accordingly. You can rearrange slides or fill them with different images. Check out all the handy templates
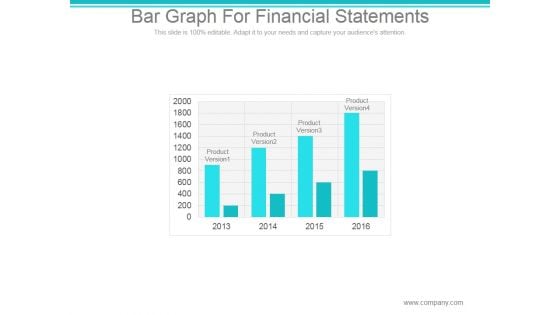
Bar Graph For Financial Statements Ppt PowerPoint Presentation Example
This is a bar graph for financial statements ppt powerpoint presentation example. This is a four stage process. The stages in this process are product version, finance, year.
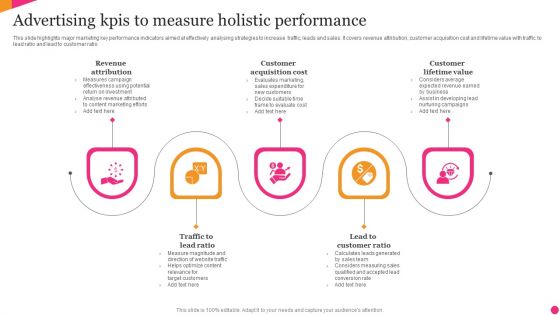
Advertising Kpis To Measure Holistic Performance Structure PDF
This slide highlights major marketing key performance indicators aimed at effectively analysing strategies to increase traffic, leads and sales. It covers revenue attribution, customer acquisition cost and lifetime value with traffic to lead ratio and lead to customer ratio. Persuade your audience using this Advertising Kpis To Measure Holistic Performance Structure PDF. This PPT design covers five stages, thus making it a great tool to use. It also caters to a variety of topics including Revenue Attribution, Customer Acquisition Cost, Customer Lifetime Value. Download this PPT design now to present a convincing pitch that not only emphasizes the topic but also showcases your presentation skills.
Data Driven Organizational Culture Icon Depicting Statistical Analysis Sample PDF
Persuade your audience using this data driven organizational culture icon depicting statistical analysis sample pdf. This PPT design covers three stages, thus making it a great tool to use. It also caters to a variety of topics including data driven organizational culture icon depicting statistical analysis. Download this PPT design now to present a convincing pitch that not only emphasizes the topic but also showcases your presentation skills.
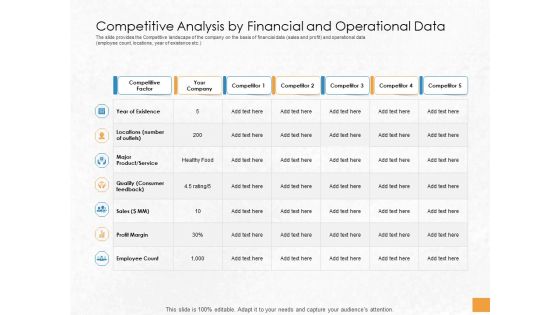
Convertible Debenture Funding Competitive Analysis By Financial And Operational Data Ppt Professional Vector PDF
The slide provides the Competitive landscape of the company on the basis of financial data sales and profit and operational data employee count, locations, year of existence etc. Deliver an awe-inspiring pitch with this creative convertible debenture funding competitive analysis by financial and operational data ppt professional vector pdf bundle. Topics like locations number outlets, major product, service, quality consumer feedback, sales, profit margin, employee count, year existence can be discussed with this completely editable template. It is available for immediate download depending on the needs and requirements of the user.
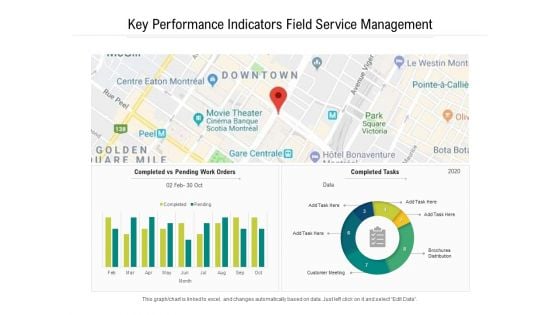
Key Performance Indicators Field Service Management Ppt PowerPoint Presentation Gallery Rules PDF
Presenting this set of slides with name key performance indicators field service management ppt powerpoint presentation gallery rules pdf. The topics discussed in these slide is key performance indicators field service management. This is a completely editable PowerPoint presentation and is available for immediate download. Download now and impress your audience.
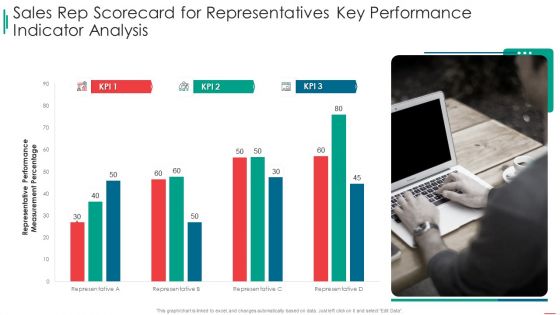
Sales Rep Scorecard Sales Rep Scorecard For Representatives Key Performance Indicator Analysis Portrait PDF
Deliver an awe inspiring pitch with this creative sales rep scorecard sales rep scorecard for representatives key performance indicator analysis portrait pdf bundle. Topics like sales rep scorecard for representatives key performance indicator analysis can be discussed with this completely editable template. It is available for immediate download depending on the needs and requirements of the user.
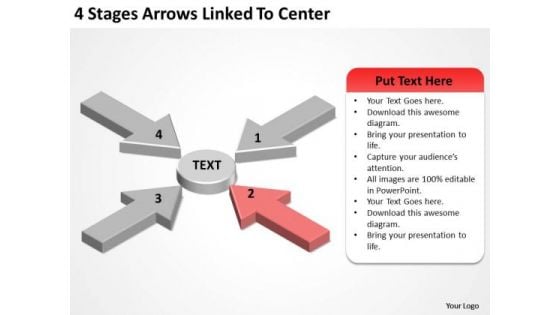
Parallel Data Processing Linked To Center PowerPoint Templates Backgrounds For Slides
We present our parallel data processing linked to center PowerPoint templates backgrounds for slides.Use our Arrows PowerPoint Templates because Our PowerPoint Templates and Slides will provide weight to your words. They will bring out the depth of your thought process. Download our Business PowerPoint Templates because You can Zap them with our PowerPoint Templates and Slides. See them reel under the impact. Download our Marketing PowerPoint Templates because Our PowerPoint Templates and Slides will let Your superior ideas hit the target always and everytime. Download our Flow Charts PowerPoint Templates because Our PowerPoint Templates and Slides will let you Clearly mark the path for others to follow. Present our Marketing PowerPoint Templates because It will Raise the bar of your Thoughts. They are programmed to take you to the next level.Use these PowerPoint slides for presentations relating to Abstract, achievement, aim, arrow, blue,business, button, career, chart, color,communication, competition, concept,development, direction, education,financial, forecast, forward, glossy,gradient, graph, group, growth, higher,icon, illustration, increase, investment,leader, leadership, moving, onwards,outlook, path, plan, prediction, price,profit, series,success, target, team, teamwork. The prominent colors used in the PowerPoint template are Red, Gray, White. Presenters tell us our parallel data processing linked to center PowerPoint templates backgrounds for slides are designed by professionals Presenters tell us our business PowerPoint templates and PPT Slides are designed by professionals Customers tell us our parallel data processing linked to center PowerPoint templates backgrounds for slides have awesome images to get your point across. Use our business PowerPoint templates and PPT Slides will get their audience's attention. Customers tell us our parallel data processing linked to center PowerPoint templates backgrounds for slides provide you with a vast range of viable options. Select the appropriate ones and just fill in your text. Presenters tell us our career PowerPoint templates and PPT Slides are topically designed to provide an attractive backdrop to any subject. Our Parallel Data Processing Linked To Center PowerPoint Templates Backgrounds For Slides will benefit your Ideas. They will deliver better dividends.
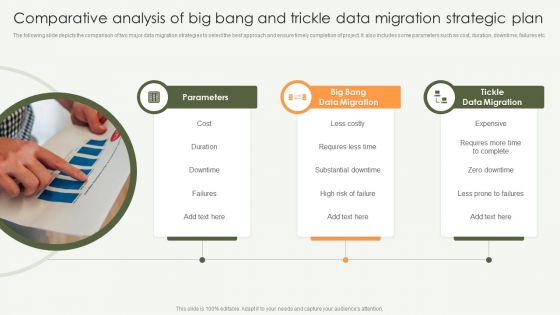
Comparative Analysis Of Big Bang And Trickle Data Migration Strategic Plan Designs PDF
The following slide depicts the comparison of two major data migration strategies to select the best approach and ensure timely completion of project. It also includes some parameters such as cost, duration, downtime, failures etc. Persuade your audience using this Comparative Analysis Of Big Bang And Trickle Data Migration Strategic Plan Designs PDF. This PPT design covers three stages, thus making it a great tool to use. It also caters to a variety of topics including Big Bang Data Migration, Tickle Data Migration, Cost. Download this PPT design now to present a convincing pitch that not only emphasizes the topic but also showcases your presentation skills.
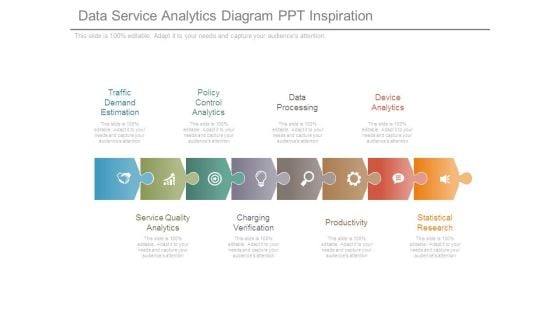
Data Service Analytics Diagram Ppt Inspiration
This is a data service analytics diagram ppt inspiration. This is a eight stage process. The stages in this process are traffic demand estimation, policy control analytics, data processing, device analytics, service quality analytics, charging verification, productivity, statistical research.
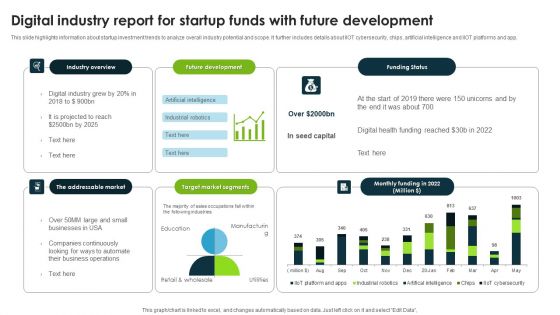
Digital Industry Report For Startup Funds With Future Development Pictures PDF
This slide highlights information about startup investment trends to analyze overall industry potential and scope. It further includes details about IIOT cybersecurity, chips, artificial intelligence and IIOT platforms and app. Pitch your topic with ease and precision using this Digital Industry Report For Startup Funds With Future Development Pictures PDF. This layout presents information on Industry Overview, Future Development, Target Market Segments. It is also available for immediate download and adjustment. So, changes can be made in the color, design, graphics or any other component to create a unique layout.
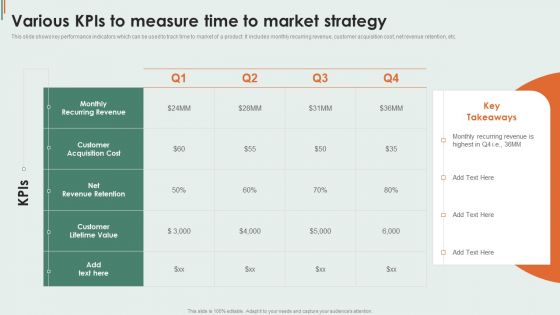
Various Kpis To Measure Time To Market Strategy Infographics PDF
This slide shows key performance indicators which can be used to track time to market of a product. It includes monthly recurring revenue, customer acquisition cost, net revenue retention, etc. Showcasing this set of slides titled Various Kpis To Measure Time To Market Strategy Infographics PDF. The topics addressed in these templates are Customer Acquisition, Customer Lifetime, Monthly Recurring. All the content presented in this PPT design is completely editable. Download it and make adjustments in color, background, font etc. as per your unique business setting.
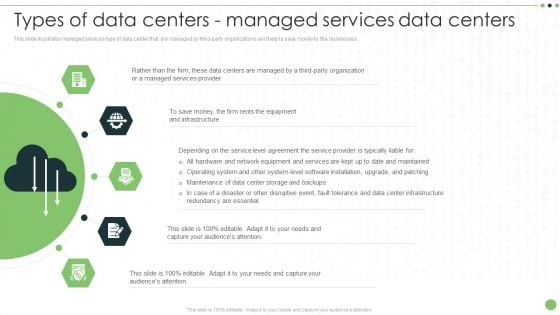
Different Categories Of Data Centers Types Of Data Centers Managed Services Data Centers Ideas PDF
This slide illustrates managed services type of data center that are managed by third-party organizations and help to save money to the businesses. The Different Categories Of Data Centers Types Of Data Centers Managed Services Data Centers Ideas PDF is a compilation of the most recent design trends as a series of slides. It is suitable for any subject or industry presentation, containing attractive visuals and photo spots for businesses to clearly express their messages. This template contains a variety of slides for the user to input data, such as structures to contrast two elements, bullet points, and slides for written information. Slidegeeks is prepared to create an impression.


 Continue with Email

 Home
Home


