Budget Dashboard
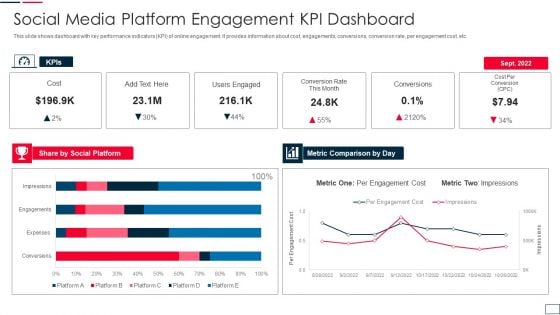
Social Media Platform Engagement Kpi Dashboard Elements PDF
This slide shows dashboard with key performance indicators KPI of online engagement. It provides information about cost, engagements, conversions, conversion rate, per engagement cost, etc. Showcasing this set of slides titled social media platform engagement kpi dashboard elements pdf. The topics addressed in these templates are social, metric, cost. All the content presented in this PPT design is completely editable. Download it and make adjustments in color, background, font etc. as per your unique business setting.
Solution Development Process Performance Tracking Dashboard For SDLC Ideas PDF
This slide represents the software development life cycle dashboard, including summary, tasks, workloads, time spent on projects, new vs. finished, and team cost breakdown.Deliver an awe inspiring pitch with this creative Solution Development Process Performance Tracking Dashboard For SDLC Ideas PDF bundle. Topics like Summary, Workload, Cost Backdown can be discussed with this completely editable template. It is available for immediate download depending on the needs and requirements of the user.
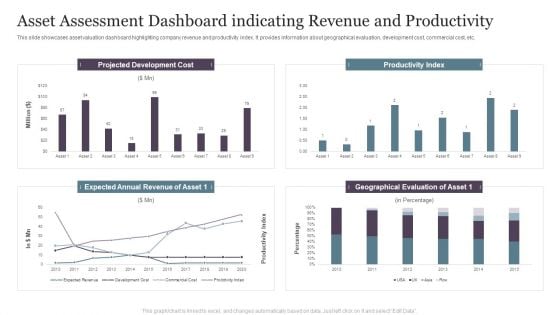
Asset Assessment Dashboard Indicating Revenue And Productivity Infographics PDF
This slide showcases asset valuation dashboard highlighting company revenue and productivity index. It provides information about geographical evaluation, development cost, commercial cost, etc.Pitch your topic with ease and precision using this Asset Assessment Dashboard Indicating Revenue And Productivity Infographics PDF. This layout presents information on Projected Development, Productivity Index, Geographical Evaluation. It is also available for immediate download and adjustment. So, changes can be made in the color, design, graphics or any other component to create a unique layout.
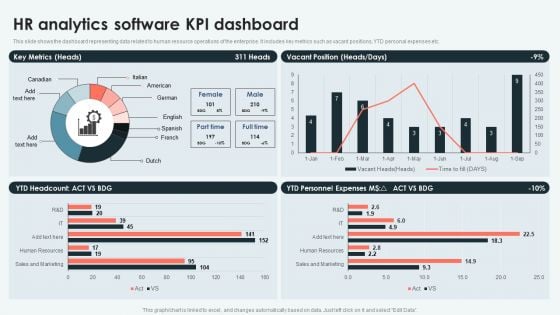
Analyzing And Deploying HR Analytics Software Kpi Dashboard Information PDF
This slide shows the dashboard representing data related to human resource operations of the enterprise. It includes key metrics such as vacant positions, YTD personal expenses etc. There are so many reasons you need a Analyzing And Deploying HR Analytics Software Kpi Dashboard Information PDF. The first reason is you cant spend time making everything from scratch, Thus, Slidegeeks has made presentation templates for you too. You can easily download these templates from our website easily.
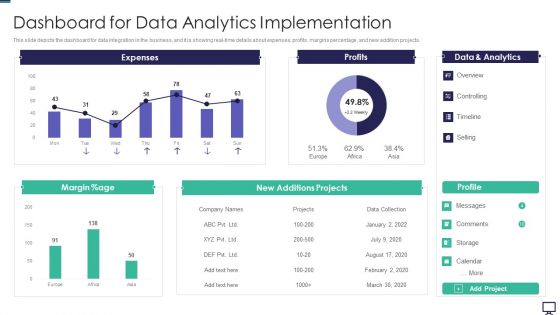
Dashboard For Data Analytics Implementation Ppt Model Files PDF
This slide depicts the dashboard for data integration in the business, and it is showing real time details about expenses, profits, margins percentage, and new addition projects. Deliver and pitch your topic in the best possible manner with this dashboard for data analytics implementation ppt model files pdf. Use them to share invaluable insights on expenses, profits, analytics, data and impress your audience. This template can be altered and modified as per your expectations. So, grab it now.
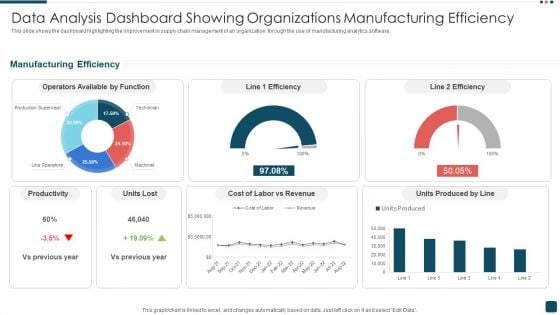
Data Analysis Dashboard Showing Organizations Manufacturing Efficiency Demonstration PDF
This slide shows the dashboard highlighting the improvement in supply chain management of an organization through the use of manufacturing analytics software. Pitch your topic with ease and precision using this Data Analysis Dashboard Showing Organizations Manufacturing Efficiency Demonstration PDF. This layout presents information on Productivity, Revenue, Manufacturing Efficiency. It is also available for immediate download and adjustment. So, changes can be made in the color, design, graphics or any other component to create a unique layout.
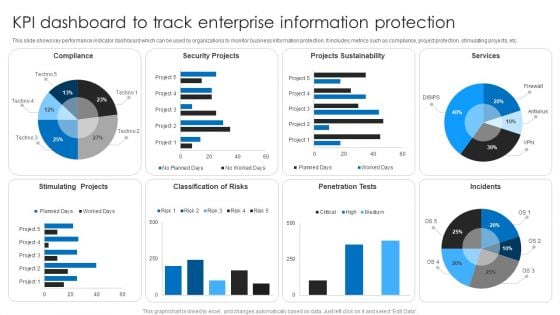
KPI Dashboard To Track Enterprise Information Protection Topics PDF
This slide shows key performance indicator dashboard which can be used by organizations to monitor business information protection. It includes metrics such as compliance, project protection, stimulating projects, etc. Showcasing this set of slides titled KPI Dashboard To Track Enterprise Information Protection Topics PDF. The topics addressed in these templates are Security Projects, Projects Sustainability, Services. All the content presented in this PPT design is completely editable. Download it and make adjustments in color, background, font etc. as per your unique business setting.
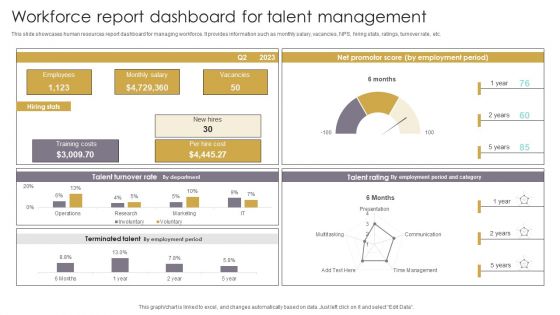
Workforce Report Dashboard For Talent Management Template PDF
This slide showcases human resources report dashboard for managing workforce. It provides information such as monthly salary, vacancies, NPS, hiring stats, ratings, turnover rate, etc. Pitch your topic with ease and precision using this Workforce Report Dashboard For Talent Management Template PDF. This layout presents information on Employees, Training Costs, Talent Turnover Rate. It is also available for immediate download and adjustment. So, changes can be made in the color, design, graphics or any other component to create a unique layout.
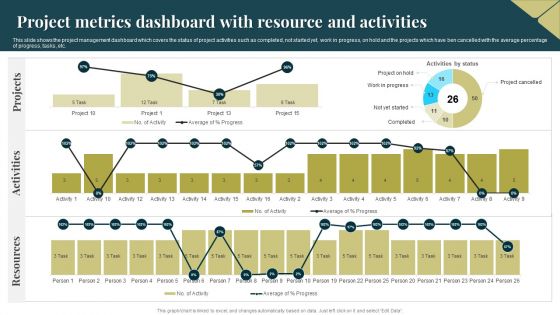
Project Metrics Dashboard With Resource And Activities Infographics PDF
This slide shows the project management dashboard which covers the status of project activities such as completed, not started yet, work in progress, on hold and the projects which have ben cancelled with the average percentage of progress, tasks, etc. Showcasing this set of slides titled Project Metrics Dashboard With Resource And Activities Infographics PDF. The topics addressed in these templates are Activities, Projects, Resources. All the content presented in this PPT design is completely editable. Download it and make adjustments in color, background, font etc. as per your unique business setting.
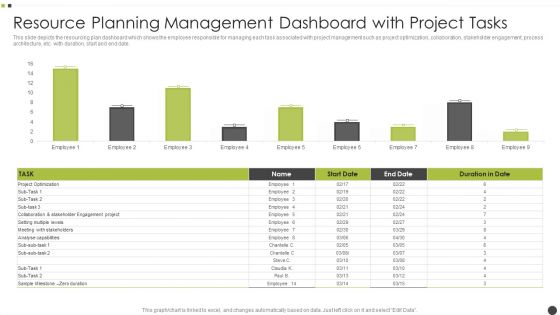
Resource Planning Management Dashboard With Project Tasks Clipart PDF
This slide depicts the resourcing plan dashboard which shows the employee responsible for managing each task associated with project management such as project optimization, collaboration, stakeholder engagement, process architecture, etc. with duration, start and end date. Showcasing this set of slides titled Resource Planning Management Dashboard With Project Tasks Clipart PDF. The topics addressed in these templates are Project Optimization, Analyse Capabilities. All the content presented in this PPT design is completely editable. Download it and make adjustments in color, background, font etc. as per your unique business setting.
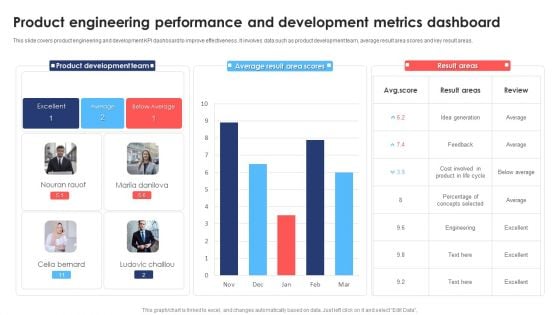
Product Engineering Performance And Development Metrics Dashboard Topics PDF
This slide covers product engineering and development KPI dashboard to improve effectiveness. It involves data such as product development team, average result area scores and key result areas. Showcasing this set of slides titled Product Engineering Performance And Development Metrics Dashboard Topics PDF. The topics addressed in these templates are Product Development Team, Average, Cost. All the content presented in this PPT design is completely editable. Download it and make adjustments in color, background, font etc. as per your unique business setting.
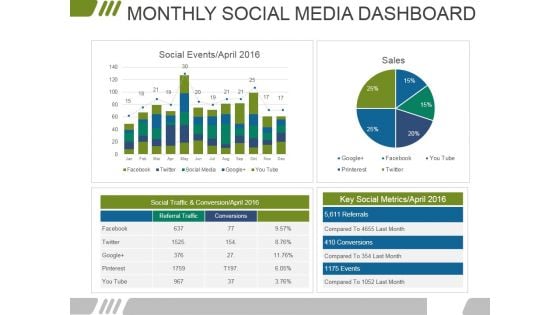
Monthly Social Media Dashboard Ppt PowerPoint Presentation Infographics Files
This is a monthly social media dashboard ppt powerpoint presentation infographics files. This is a four stage process. The stages in this process are marketing, business, financial, data analysis, management.
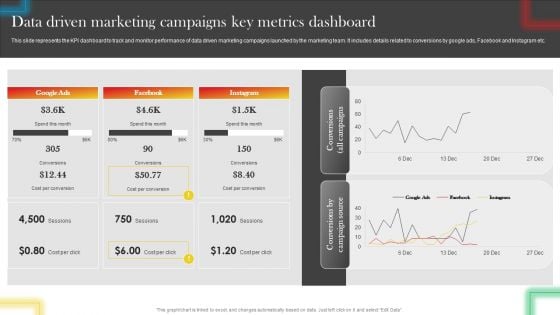
Data Driven Marketing Campaigns Key Metrics Dashboard Microsoft PDF
This slide represents the KPI dashboard to track and monitor performance of data driven marketing campaigns launched by the marketing team. It includes details related to conversions by google ads, Facebook and Instagram etc. There are so many reasons you need a Data Driven Marketing Campaigns Key Metrics Dashboard Microsoft PDF. The first reason is you can not spend time making everything from scratch, Thus, Slidegeeks has made presentation templates for you too. You can easily download these templates from our website easily.
Database Modeling Structures Data Model Performance Tracking Dashboard Template Pdf
This slide shows the data model performance tracking dashboard. The purpose of this slide is to represent the Information related to the change brought by data models graphically. Formulating a presentation can take up a lot of effort and time, so the content and message should always be the primary focus. The visuals of the PowerPoint can enhance the presenters message, so our Database Modeling Structures Data Model Performance Tracking Dashboard Template Pdf was created to help save time. Instead of worrying about the design, the presenter can concentrate on the message while our designers work on creating the ideal templates for whatever situation is needed. Slidegeeks has experts for everything from amazing designs to valuable content, we have put everything into Database Modeling Structures Data Model Performance Tracking Dashboard Template Pdf. This slide shows the data model performance tracking dashboard. The purpose of this slide is to represent the Information related to the change brought by data models graphically.
Dashboard Analysis For Tracking Agricultural Tasks Adopting Sustainable Farming Techniques
This slide showcases the KPIs that would help to track the improvements with adoption of new sustainable agriculture practices. It includes current tasks, crops, harvest, todays weather, summary, etc. Take your projects to the next level with our ultimate collection of Dashboard Analysis For Tracking Agricultural Tasks Adopting Sustainable Farming Techniques. Slidegeeks has designed a range of layouts that are perfect for representing task or activity duration, keeping track of all your deadlines at a glance. Tailor these designs to your exact needs and give them a truly corporate look with your own brand colors they will make your projects stand out from the rest This slide showcases the KPIs that would help to track the improvements with adoption of new sustainable agriculture practices. It includes current tasks, crops, harvest, todays weather, summary, etc.
Performance Tracking Dashboard For Software Development Life Cycle Structure PDF
This slide represents the software development life cycle dashboard, including summary, tasks, workloads, time spent on projects, new vs. finished, and team cost breakdown. Deliver an awe inspiring pitch with this creative overview of the software development life cycle company demonstration pdf bundle. Topics like performance tracking dashboard for software development life cycle can be discussed with this completely editable template. It is available for immediate download depending on the needs and requirements of the user.
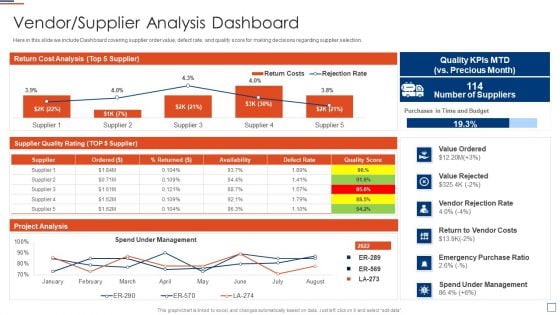
Risk Evaluation And Mitigation Vendor Supplier Analysis Dashboard Clipart PDF
Here in this slide we include Dashboard covering supplier order value, defect rate, and quality score for making decisions regarding supplier selection. Deliver an awe inspiring pitch with this creative Risk Evaluation And Mitigation Vendor Supplier Analysis Dashboard Clipart PDF bundle. Topics like Cost Analysis, Project Analysis, Supplier Quality can be discussed with this completely editable template. It is available for immediate download depending on the needs and requirements of the user.
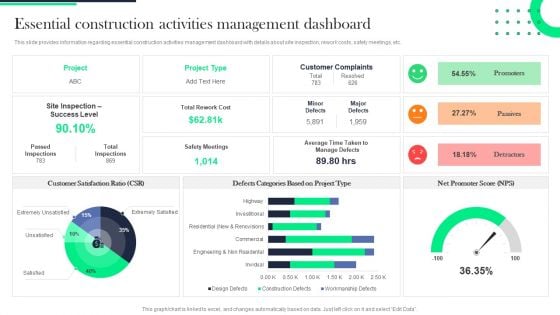
Architecture Transformation Playbook Essential Construction Activities Management Dashboard Topics PDF
This slide provides information regarding essential construction activities management dashboard with details about site inspection, rework costs, safety meetings, etc. Deliver an awe inspiring pitch with this creative Architecture Transformation Playbook Essential Construction Activities Management Dashboard Topics PDF bundle. Topics like Project, Customer Complaints, Customer Satisfaction Ratio can be discussed with this completely editable template. It is available for immediate download depending on the needs and requirements of the user.
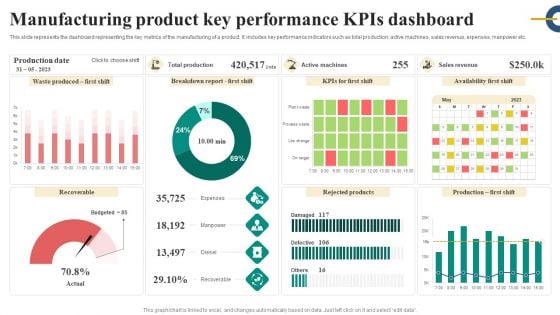
Manufacturing Product Key Performance Kpis Dashboard Inspiration PDF
This slide represents the dashboard representing the key metrics of the manufacturing of a product. It includes key performance indicators such as total production, active machines, sales revenue, expenses, manpower etc. Showcasing this set of slides titled Manufacturing Product Key Performance Kpis Dashboard Inspiration PDF. The topics addressed in these templates are Expenses, Manpower, Diesel, Recoverable. All the content presented in this PPT design is completely editable. Download it and make adjustments in color, background, font etc. as per your unique business setting.
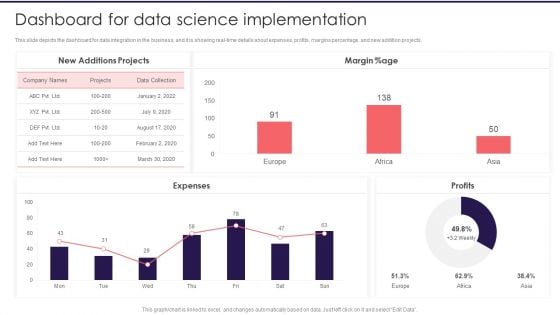
Information Studies Dashboard For Data Science Implementation Structure PDF
This slide depicts the dashboard for data integration in the business, and it is showing real time details about expenses, profits, margins percentage, and new addition projects. Deliver an awe inspiring pitch with this creative Information Studies Dashboard For Data Science Implementation Structure PDF bundle. Topics like New Additions Projects, Margin, Expenses can be discussed with this completely editable template. It is available for immediate download depending on the needs and requirements of the user.
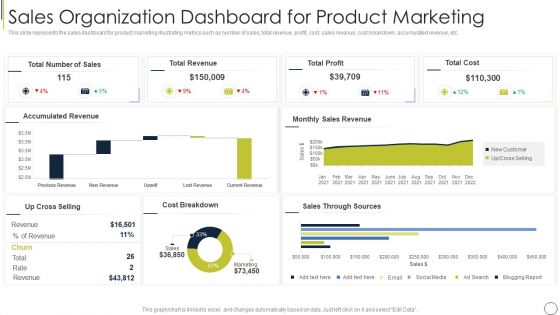
Sales Organization Dashboard For Product Marketing Themes PDF
This slide represents the sales dashboard for product marketing illustrating metrics such as number of sales, total revenue, profit, cost, sales revenue, cost breakdown, accumulated revenue, etc. Pitch your topic with ease and precision using this sales organization dashboard for product marketing themes pdf. This layout presents information on total cost, total profit, total revenue. It is also available for immediate download and adjustment. So, changes can be made in the color, design, graphics or any other component to create a unique layout.
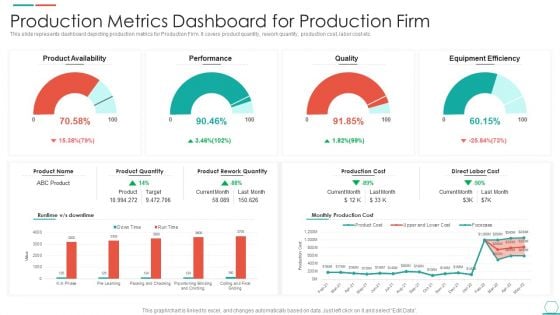
Production Metrics Dashboard For Production Firm Rules PDF
This slide represents dashboard depicting production metrics for Production Firm. It covers product quantity, rework quantity, production cost, labor cost etc. Showcasing this set of slides titled Production Metrics Dashboard For Production Firm Rules PDF. The topics addressed in these templates are Equipment Efficiency, Product Availability, Production Cost. All the content presented in this PPT design is completely editable. Download it and make adjustments in color, background, font etc. as per your unique business setting.
Content Marketing Dashboard For Effective Tracking Structure PDF
Purpose of the following slide is to show key metrics that can help the organization to track their content marketing efforts, these metrics are ad cost, visits, cost per click etc. Deliver an awe inspiring pitch with this creative Content Marketing Dashboard For Effective Tracking Structure PDF bundle. Topics like Metrics, Content Marketing Dashboard can be discussed with this completely editable template. It is available for immediate download depending on the needs and requirements of the user.
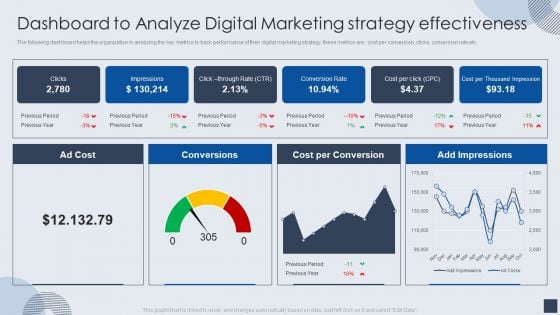
Dashboard To Analyze Digital Marketing Strategy Effectiveness Mockup PDF
The following dashboard helps the organization in analyzing the key metrics to track performance of their digital marketing strategy, these metrics are cost per conversion, clicks, conversion rate etc. Deliver an awe inspiring pitch with this creative Dashboard To Analyze Digital Marketing Strategy Effectiveness Mockup PDF bundle. Topics like Cost Per Conversion, Conversion Rate can be discussed with this completely editable template. It is available for immediate download depending on the needs and requirements of the user.
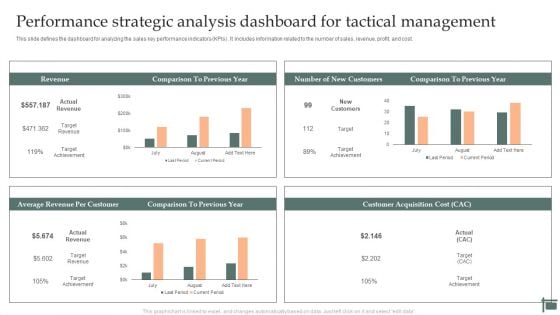
Performance Strategic Analysis Dashboard For Tactical Management Rules PDF
This slide defines the dashboard for analyzing the sales key performance indicators KPIs. It includes information related to the number of sales, revenue, profit, and cost. Showcasing this set of slides titled Performance Strategic Analysis Dashboard For Tactical Management Rules PDF. The topics addressed in these templates are Revenue, New Customers, Average Revenue, Per Customer. All the content presented in this PPT design is completely editable. Download it and make adjustments in color, background, font etc. as per your unique business setting.
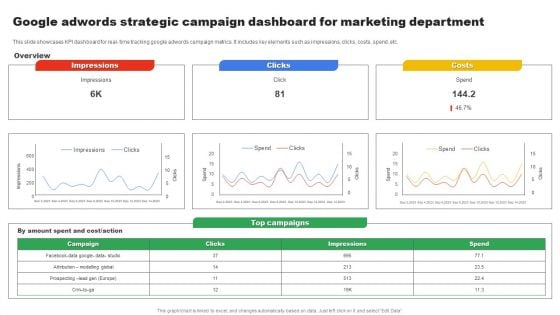
Google Adwords Strategic Campaign Dashboard For Marketing Department Download PDF
This slide showcases KPI dashboard for real time tracking google adwords campaign metrics. It includes key elements such as impressions, clicks, costs, spend, etc. Pitch your topic with ease and precision using this Google Adwords Strategic Campaign Dashboard For Marketing Department Download PDF. This layout presents information on Impressions, Clicks, Costs. It is also available for immediate download and adjustment. So, changes can be made in the color, design, graphics or any other component to create a unique layout.
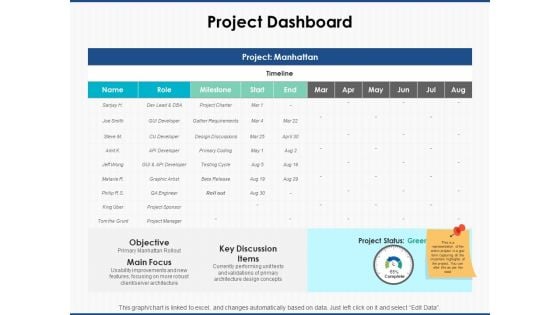
Project Dashboard Measurement Ppt PowerPoint Presentation Summary Brochure
This is a project dashboard measurement ppt powerpoint presentation summary brochure. The topics discussed in this diagram are marketing, business, management, planning, strategy This is a completely editable PowerPoint presentation, and is available for immediate download.
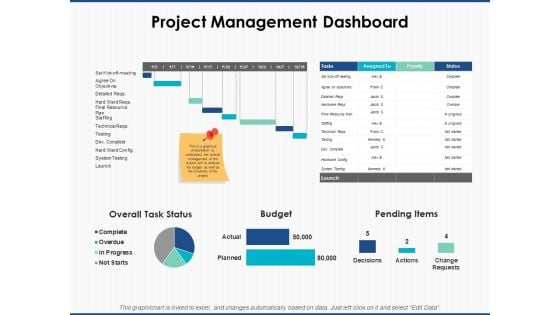
Project Management Dashboard Ppt PowerPoint Presentation Inspiration Background
This is a project management dashboard ppt powerpoint presentation inspiration background. The topics discussed in this diagram are marketing, business, management, planning, strategy This is a completely editable PowerPoint presentation, and is available for immediate download.
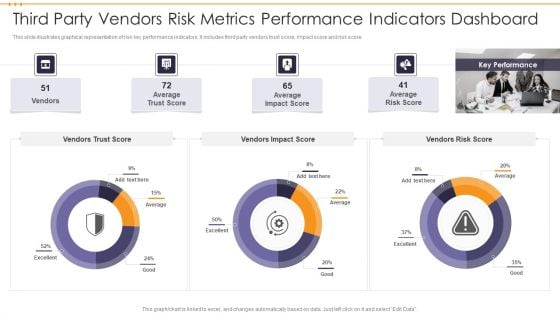
Third Party Vendors Risk Metrics Performance Indicators Dashboard Topics PDF
This slide illustrates graphical representation of risk key performance indicators. It includes third party vendors trust score, impact score and risk score. Pitch your topic with ease and precision using this Third Party Vendors Risk Metrics Performance Indicators Dashboard Topics PDF. This layout presents information on Third Party Vendors Risk Metrics Performance Indicators Dashboard. It is also available for immediate download and adjustment. So, changes can be made in the color, design, graphics or any other component to create a unique layout.
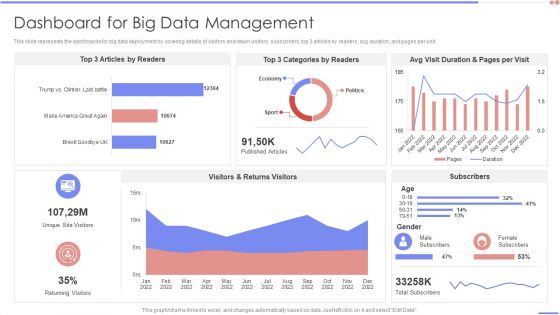
Data Analytics Management Dashboard For Big Data Management Background PDF
This slide represents the dashboards for big data deployment by covering details of visitors and return visitors, subscribers, top 3 articles by readers, avg duration, and pages per visit. Deliver and pitch your topic in the best possible manner with this Data Analytics Management Dashboard For Big Data Management Background PDF. Use them to share invaluable insights on Article Readers, Categories Readers, Duration Pages and impress your audience. This template can be altered and modified as per your expectations. So, grab it now.
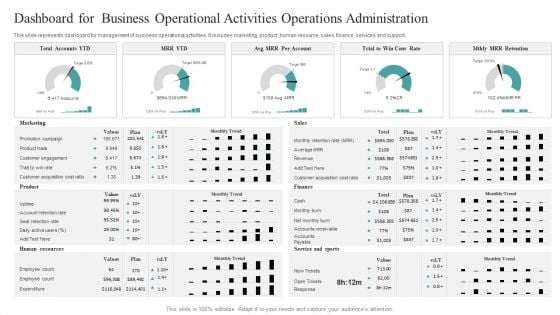
Dashboard For Business Operational Activities Operations Administration Designs PDF
This slide represents dashboard for management of business operational activities. It includes marketing, product, human resource, sales, finance, services and support. Pitch your topic with ease and precision using this Dashboard For Business Operational Activities Operations Administration Designs PDF. This layout presents information on Marketing, Product, Human Resources. It is also available for immediate download and adjustment. So, changes can be made in the color, design, graphics or any other component to create a unique layout.
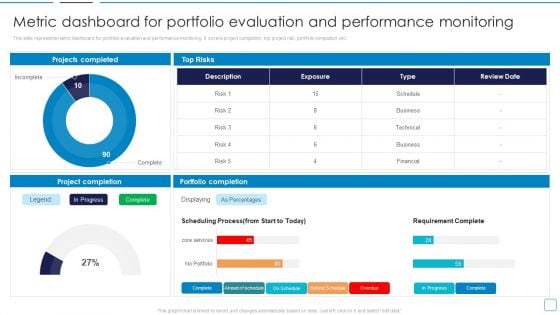
Portfolio Wealth Management Metric Dashboard For Portfolio Evaluation Graphics PDF
This slide represents metric dashboard for portfolio evaluation and performance monitoring. It covers project completion, top project risk, portfolio completion etc. Deliver an awe inspiring pitch with this creative Portfolio Wealth Management Metric Dashboard For Portfolio Evaluation Graphics PDF bundle. Topics like Projects Completed, Top Risks, Project Completion can be discussed with this completely editable template. It is available for immediate download depending on the needs and requirements of the user.
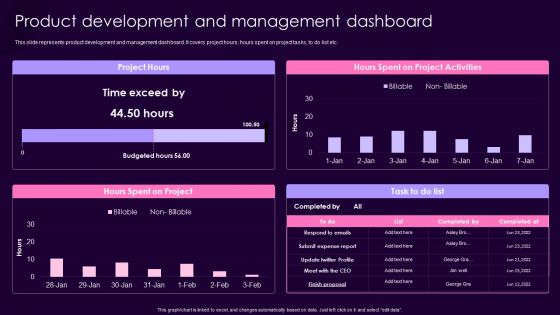
Product Management Techniques Product Development And Management Dashboard Professional PDF
This slide represents product development and management dashboard. It covers project hours, hours spent on project tasks, to do list etc. Deliver an awe inspiring pitch with this creative Product Management Techniques Product Development And Management Dashboard Professional PDF bundle. Topics like Project Hours, Hours Spent, Project Activities can be discussed with this completely editable template. It is available for immediate download depending on the needs and requirements of the user.
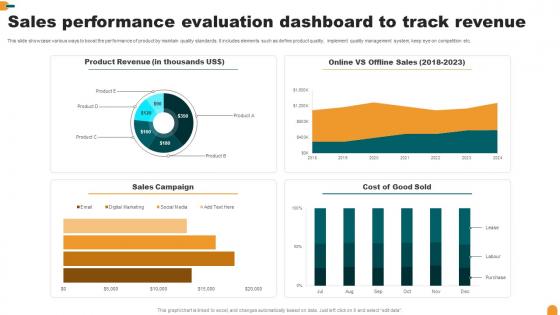
Sales Performance Evaluation Dashboard To Track Revenue Summary Pdf
This slide showcase various ways to boost the performance of product by maintain quality standards. It includes elements such as define product quality, implement quality management system, keep eye on competition etc.Pitch your topic with ease and precision using this Sales Performance Evaluation Dashboard To Track Revenue Summary Pdf This layout presents information on Sales Campaign, Product Revenue, Cost Good Sold It is also available for immediate download and adjustment. So, changes can be made in the color, design, graphics or any other component to create a unique layout. This slide showcase various ways to boost the performance of product by maintain quality standards. It includes elements such as define product quality, implement quality management system, keep eye on competition etc.
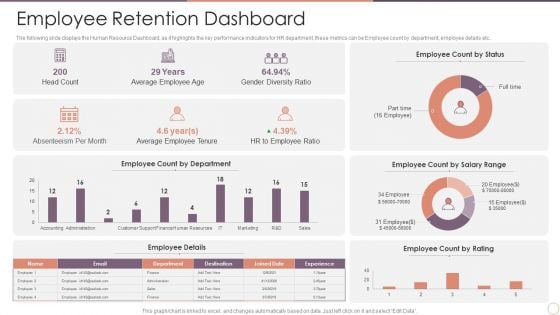
Managing Employee Turnover Employee Retention Dashboard Information PDF
The following slide displays the Human Resource Dashboard, as it highlights the key performance indicators for HR department, these metrics can be Employee count by department, employee details etc.Deliver and pitch your topic in the best possible manner with this Managing Employee Turnover Employee Retention Dashboard Information PDF. Use them to share invaluable insights on Employee Count, Gender Diversity, Average Employee and impress your audience. This template can be altered and modified as per your expectations. So, grab it now.
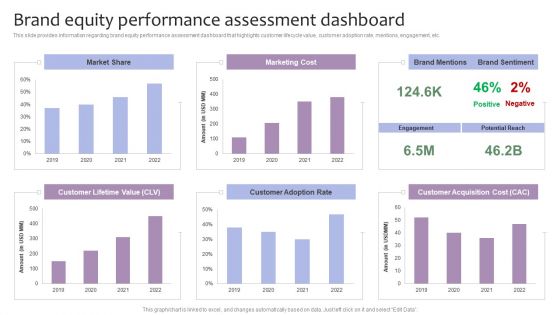
Strategic Brand Management Brand Equity Performance Assessment Dashboard Infographics PDF
This slide provides information regarding brand equity performance assessment dashboard that highlights customer lifecycle value, customer adoption rate, mentions, engagement, etc. Deliver and pitch your topic in the best possible manner with this Strategic Brand Management Brand Equity Performance Assessment Dashboard Infographics PDF. Use them to share invaluable insights on Market Share, Marketing Cost, Customer Lifetime Value, Customer Adoption Rate and impress your audience. This template can be altered and modified as per your expectations. So, grab it now.
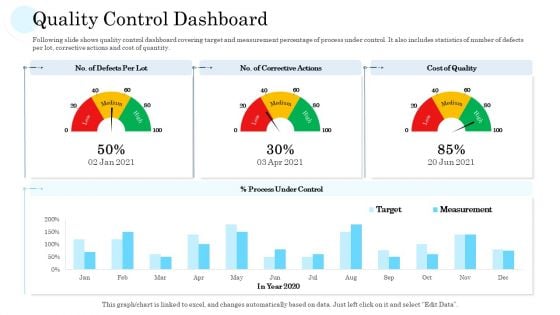
Quality Control Dashboard Ppt PowerPoint Presentation Visual Aids Summary PDF
Following slide shows quality control dashboard covering target and measurement percentage of process under control. It also includes statistics of number of defects per lot, corrective actions and cost of quantity.Deliver an awe-inspiring pitch with this creative quality control dashboard ppt powerpoint presentation visual aids summary pdf. bundle. Topics like process under control, cost of quality, target can be discussed with this completely editable template. It is available for immediate download depending on the needs and requirements of the user.
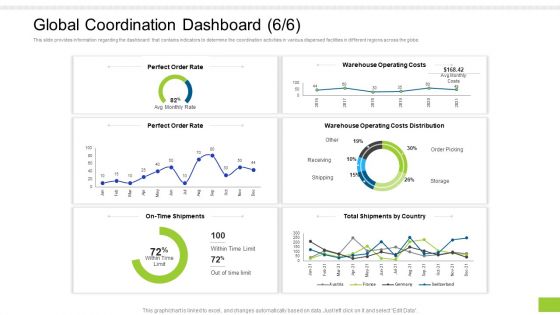
Enterprise Collaboration Global Scale Global Coordination Dashboard Rate Professional PDF
This slide provides information regarding the dashboard that contains indicators to determine the coordination activities in various dispersed facilities in different regions across the globe. Deliver and pitch your topic in the best possible manner with this enterprise collaboration global scale global coordination dashboard rate professional pdf. Use them to share invaluable insights on perfect order rate, warehouse operating costs, operating costs distribution and impress your audience. This template can be altered and modified as per your expectations. So, grab it now.
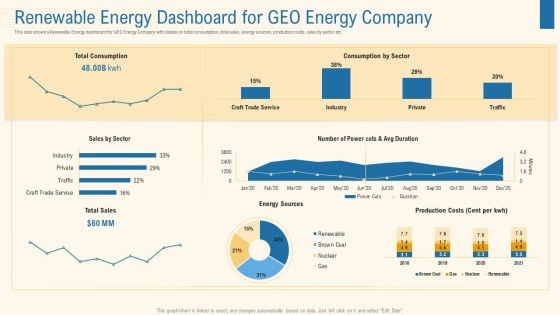
Renewable Energy Dashboard For Geo Energy Company Professional PDF
This slide shows a Renewable Energy dashboard for GEO Energy Company with details on total consumption, total sales, energy sources, production costs, sales by sector etc. Deliver and pitch your topic in the best possible manner with this renewable energy dashboard for geo energy company professional pdf. Use them to share invaluable insights on sales, industry, sources, costs, services and impress your audience. This template can be altered and modified as per your expectations. So, grab it now.
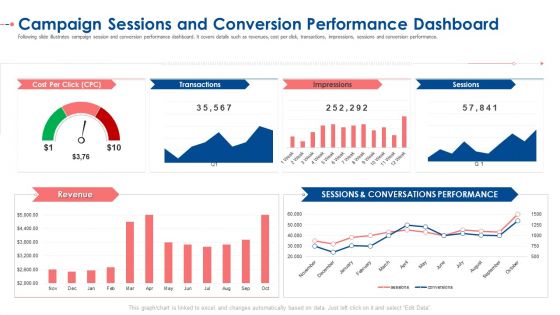
Campaign Sessions And Conversion Performance Dashboard Ppt Inspiration Styles PDF
Following slide illustrates campaign session and conversion performance dashboard. It covers details such as revenues, cost per click, transactions, impressions, sessions and conversion performance. Deliver an awe-inspiring pitch with this creative campaign sessions and conversion performance dashboard ppt inspiration styles pdf. bundle. Topics like cost per click, transactions, impressions, sessions, revenue can be discussed with this completely editable template. It is available for immediate download depending on the needs and requirements of the user.
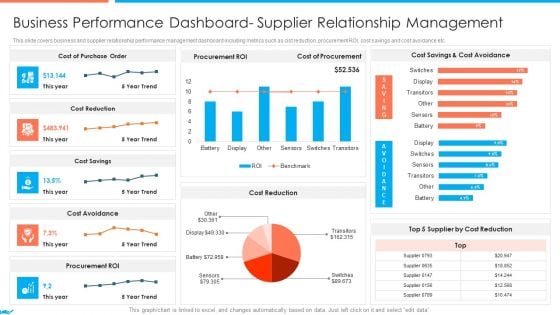
Supplier Association Management Techniques Business Performance Dashboard Portrait PDF
This slide covers business and supplier relationship performance management dashboard including metrics such as cist reduction, procurement ROI, cost savings and cost avoidance etc. Deliver an awe inspiring pitch with this creative icons slide for supplier association management techniques introduction pdf bundle. Topics like supplier association management techniques supplier performance management kpi dashboards guidelines pdf can be discussed with this completely editable template. It is available for immediate download depending on the needs and requirements of the user.
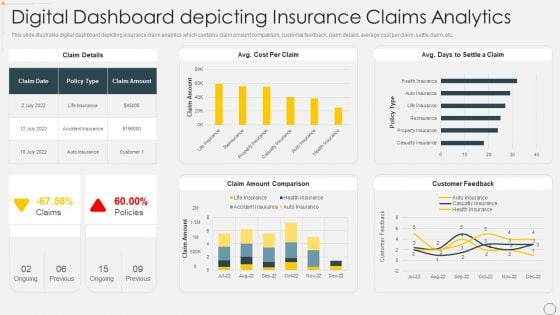
Digital Dashboard Depicting Insurance Claims Analytics Pictures PDF
This slide illustrates digital dashboard depicting insurance claim analytics which contains claim amount comparison, customer feedback, claim details, average cost per claim, settle claim, etc. Showcasing this set of slides titled Digital Dashboard Depicting Insurance Claims Analytics Pictures PDF. The topics addressed in these templates are Policy, Cost, Comparison. All the content presented in this PPT design is completely editable. Download it and make adjustments in color, background, font etc. as per your unique business setting.
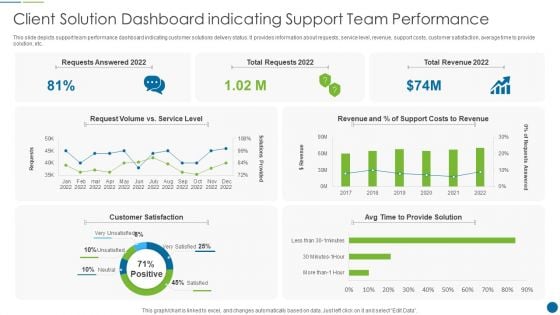
Client Solution Dashboard Indicating Support Team Performance Graphics PDF
This slide depicts support team performance dashboard indicating customer solutions delivery status. It provides information about requests, service level, revenue, support costs, customer satisfaction, average time to provide solution, etc. Showcasing this set of slides titled Client Solution Dashboard Indicating Support Team Performance Graphics PDF. The topics addressed in these templates are Costs, Revenue, Customer. All the content presented in this PPT design is completely editable. Download it and make adjustments in color, background, font etc. as per your unique business setting.
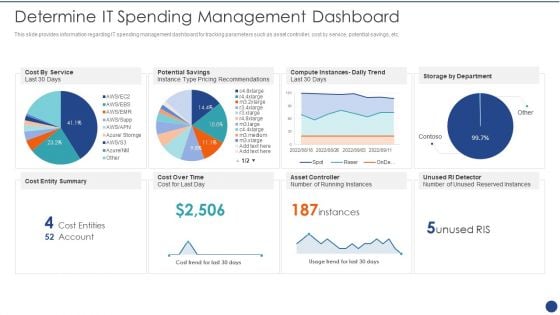
Cios Value Optimization Determine IT Spending Management Dashboard Demonstration PDF
This slide provides information regarding IT spending management dashboard for tracking parameters such as asset controller, cost by service, potential savings, etc. Deliver and pitch your topic in the best possible manner with this Cios Value Optimization Determine IT Spending Management Dashboard Demonstration PDF. Use them to share invaluable insights on Cost Service, Potential Savings, Compute Instances and impress your audience. This template can be altered and modified as per your expectations. So, grab it now.
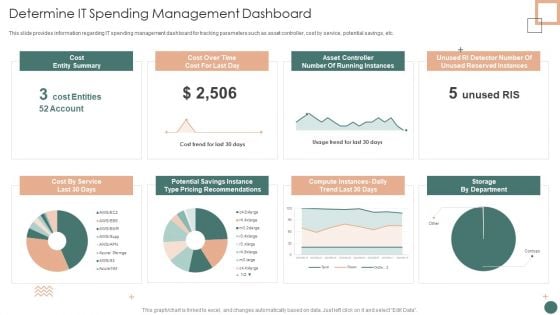
Improved Digital Expenditure Determine IT Spending Management Dashboard Template PDF
This slide provides information regarding IT spending management dashboard for tracking parameters such as asset controller, cost by service, potential savings, etc. Deliver and pitch your topic in the best possible manner with this Improved Digital Expenditure Determine IT Spending Management Dashboard Template PDF. Use them to share invaluable insights on Cost Entity, Asset Controller, Reserved Instances and impress your audience. This template can be altered and modified as per your expectations. So, grab it now.
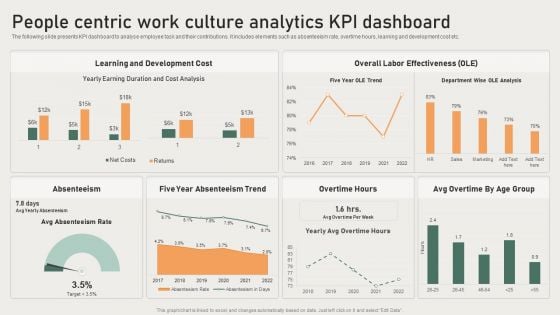
People Centric Work Cuture Analytics Kpi Dashboard Brochure PDF
The following slide presents KPI dashboard to analyse employee task and their contributions. It includes elements such as absenteeism rate, overtime hours, learning and development cost etc. Showcasing this set of slides titled People Centric Work Cuture Analytics Kpi Dashboard Brochure PDF. The topics addressed in these templates are Development Cost, Overall Labor Effectiveness, Absenteeism. All the content presented in this PPT design is completely editable. Download it and make adjustments in color, background, font etc. as per your unique business setting.
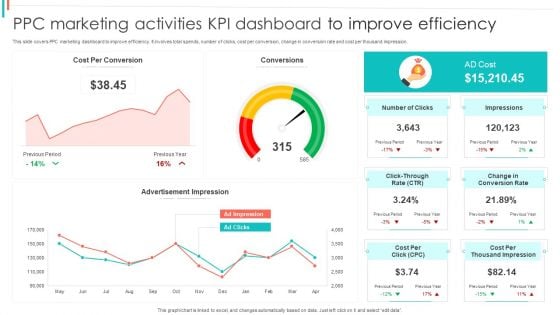
PPC Marketing Activities KPI Dashboard To Improve Efficiency Diagrams PDF
This slide covers PPC marketing dashboard to improve efficiency. It involves total spends, number of clicks, cost per conversion, change in conversion rate and cost per thousand impression.Showcasing this set of slides titled PPC Marketing Activities KPI Dashboard To Improve Efficiency Diagrams PDF. The topics addressed in these templates are Per Conversion, Advertisement Impression, Impressions. All the content presented in this PPT design is completely editable. Download it and make adjustments in color, background, font etc. as per your unique business setting.
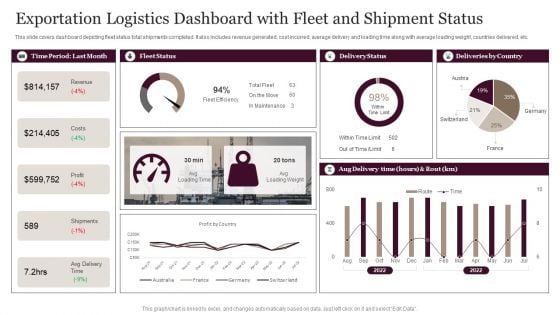
Exportation Logistics Dashboard With Fleet And Shipment Status Demonstration PDF
This slide covers dashboard depicting fleet status total shipments completed. It also includes revenue generated, cost incurred, average delivery and loading time along with average loading weight, countries delivered, etc. Showcasing this set of slides titled Exportation Logistics Dashboard With Fleet And Shipment Status Demonstration PDF. The topics addressed in these templates are Revenue, Costs, Profit. All the content presented in this PPT design is completely editable. Download it and make adjustments in color, background, font etc. as per your unique business setting.
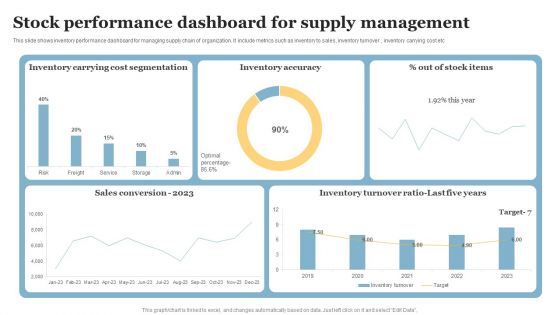
Stock Performance Dashboard For Supply Management Template PDF
This slide shows inventory performance dashboard for managing supply chain of organization. It include metrics such as inventory to sales, inventory turnover , inventory carrying cost etc. Showcasing this set of slides titled Stock Performance Dashboard For Supply Management Template PDF. The topics addressed in these templates are Inventory Carrying, Cost Segmentation, Inventory Accuracy. All the content presented in this PPT design is completely editable. Download it and make adjustments in color, background, font etc. as per your unique business setting.

Monthly Profit And Loss Statement Reports Analysis Dashboard Brochure PDF
This slide shows a monthly profit and loss statement dashboard. The constituting elements herein are total net revenue, cost of goods sold and gross profit.Pitch your topic with ease and precision using this Monthly Profit And Loss Statement Reports Analysis Dashboard Brochure PDF. This layout presents information on Costs Good Sold, Earnings Before, Interest Expense. It is also available for immediate download and adjustment. So, changes can be made in the color, design, graphics or any other component to create a unique layout.

Weekly Sales Performance KPI Dashboard For Revenue Generation Brochure PDF
The following slide exhibits dashboard to maintain revenue and management under control. It presents information related to profits, cross selling, costs, etc. Pitch your topic with ease and precision using this Weekly Sales Performance KPI Dashboard For Revenue Generation Brochure PDF. This layout presents information on Total Sales, Revenue, Profit, Cost. It is also available for immediate download and adjustment. So, changes can be made in the color, design, graphics or any other component to create a unique layout.
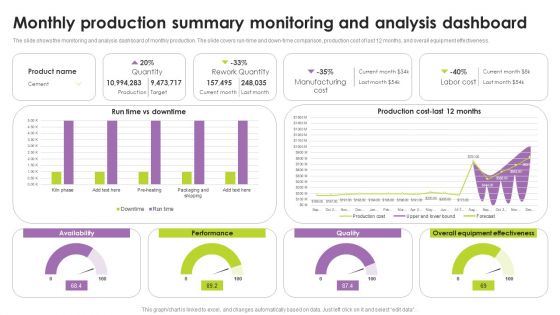
Monthly Production Summary Monitoring And Analysis Dashboard Guidelines PDF
The slide shows the monitoring and analysis dashboard of monthly production. The slide covers run-time and down time comparison, production cost of last 12 months, and overall equipment effectiveness. Showcasing this set of slides titled Monthly Production Summary Monitoring And Analysis Dashboard Guidelines PDF. The topics addressed in these templates are Availability, Rework Quantity, Manufacturing Cost. All the content presented in this PPT design is completely editable. Download it and make adjustments in color, background, font etc. as per your unique business setting.
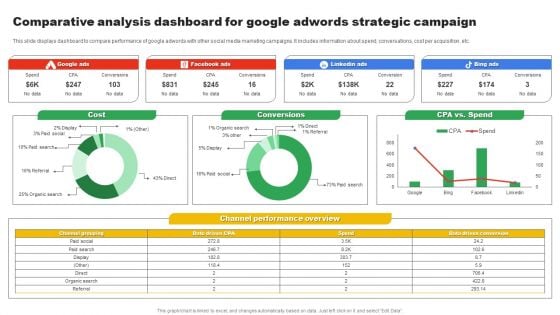
Comparative Analysis Dashboard For Google Adwords Strategic Campaign Slides PDF
This slide displays dashboard to compare performance of google adwords with other social media marketing campaigns. It includes information about spend, conversations, cost per acquisition, etc. Showcasing this set of slides titled Comparative Analysis Dashboard For Google Adwords Strategic Campaign Slides PDF. The topics addressed in these templates are Google Ads, Cost, Conversions. All the content presented in this PPT design is completely editable. Download it and make adjustments in color, background, font etc. as per your unique business setting.

Monthly Financial Metrics Dashboard With Revenue And Expenditure Rules PDF
This slide showcases KPI dashboard for monitoring financial health of business to ensure smooth flow of business operations. It includes details such as COGS, net profit, cost breakdown, etc. Showcasing this set of slides titled Monthly Financial Metrics Dashboard With Revenue And Expenditure Rules PDF. The topics addressed in these templates are Net Profit, Costs, Expenditure. All the content presented in this PPT design is completely editable. Download it and make adjustments in color, background, font etc. as per your unique business setting.
Datafy Performance Tracking Dashboard For E-Commerce Website Information PDF
This slide represents the performance tracking dashboard for an e-commerce website by covering the details of visitors and return visitors, total customers and products, the top three products and product categories, and average visit duration and purchase per visit. The best PPT templates are a great way to save time, energy, and resources. Slidegeeks have percent editable powerpoint slides making them incredibly versatile. With these quality presentation templates, you can create a captivating and memorable presentation by combining visually appealing slides and effectively communicating your message. Download Datafy Performance Tracking Dashboard For E-Commerce Website Information PDF from Slidegeeks and deliver a wonderful presentation.
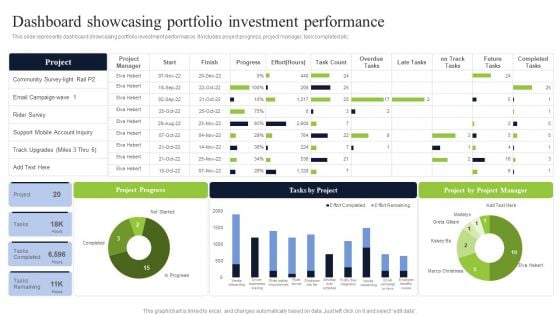
Diversified Profitable Portfolio Dashboard Showcasing Portfolio Investment Performance Guidelines PDF
Deliver and pitch your topic in the best possible manner with this Diversified Profitable Portfolio Dashboard Showcasing Portfolio Investment Performance Guidelines PDF. Use them to share invaluable insights on Rider Survey, Community Survey, Tasks By Project and impress your audience. This template can be altered and modified as per your expectations. So, grab it now.
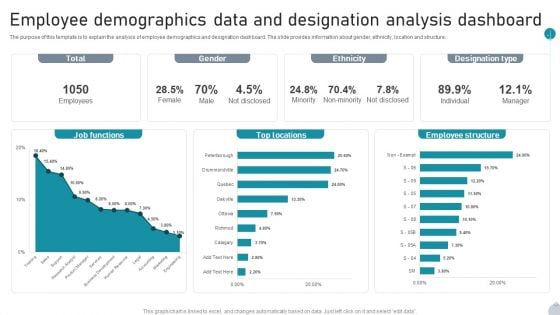
Employee Demographics Data And Designation Analysis Dashboard Introduction PDF
The purpose of this template is to explain the analysis of employee demographics and designation dashboard. The slide provides information about gender, ethnicity, location and structure. Pitch your topic with ease and precision using this Employee Demographics Data And Designation Analysis Dashboard Introduction PDF. This layout presents information on Job Functions, Top Locations, Employee Structure It is also available for immediate download and adjustment. So, changes can be made in the color, design, graphics or any other component to create a unique layout.
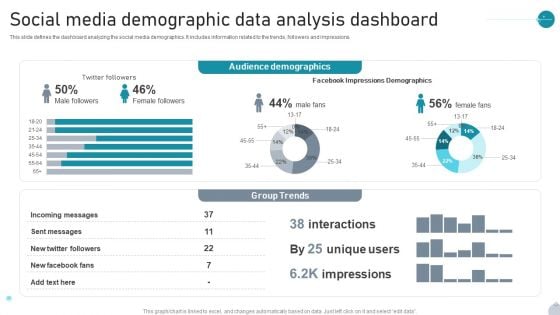
Social Media Demographic Data Analysis Dashboard Infographics PDF
This slide defines the dashboard analyzing the social media demographics. It includes information related to the trends, followers and impressions. Pitch your topic with ease and precision using this Social Media Demographic Data Analysis Dashboard Infographics PDF. This layout presents information on Audience Demographics, Group Trends, Impressions Demographics It is also available for immediate download and adjustment. So, changes can be made in the color, design, graphics or any other component to create a unique layout.
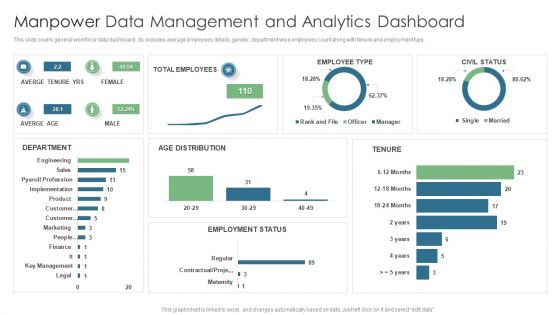
Manpower Data Management And Analytics Dashboard Topics PDF
This slide covers general workforce data dashboard . Its includes average employees details, gender, department wise employees count along with tenure and employment type. Pitch your topic with ease and precision using this Manpower Data Management And Analytics Dashboard Topics PDF. This layout presents information on Total Employees, Averge Tenure Yrs, Employee Type. It is also available for immediate download and adjustment. So, changes can be made in the color, design, graphics or any other component to create a unique layout.
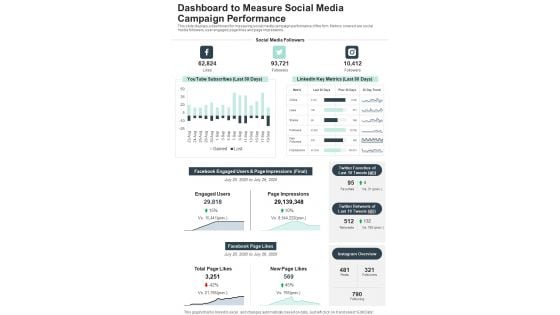
Dashboard To Measure Social Media Campaign Performance One Pager Documents
This slide displays a dashboard for measuring social media campaign performance of the firm. Metrics covered are social media followers, user engaged, page likes and page impressions. Presenting you a fantastic Dashboard To Measure Social Media Campaign Performance One Pager Documents. This piece is crafted on hours of research and professional design efforts to ensure you have the best resource. It is completely editable and its design allow you to rehash its elements to suit your needs. Get this Dashboard To Measure Social Media Campaign Performance One Pager Documents A4 One-pager now.


 Continue with Email

 Home
Home


