Budget Icons
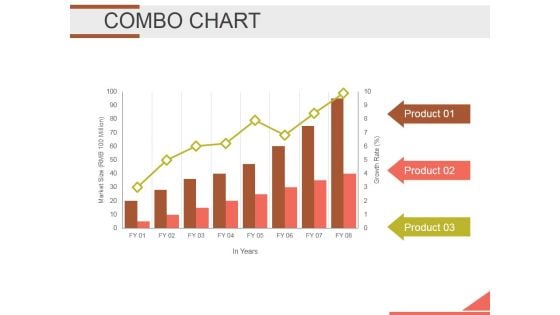
Combo Chart Ppt PowerPoint Presentation Infographics Infographics
This is a combo chart ppt powerpoint presentation infographics infographics. This is a three stage process. The stages in this process are bar graph, growth, finance, marketing, strategy, business.
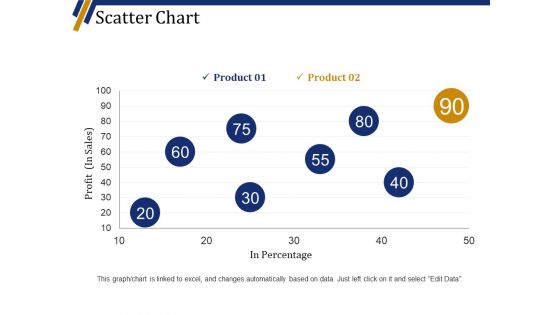
Scatter Chart Ppt PowerPoint Presentation Summary Visuals
This is a scatter chart ppt powerpoint presentation summary visuals. This is a eight stage process. The stages in this process are product, profit in sales, in percentage, finance, business.
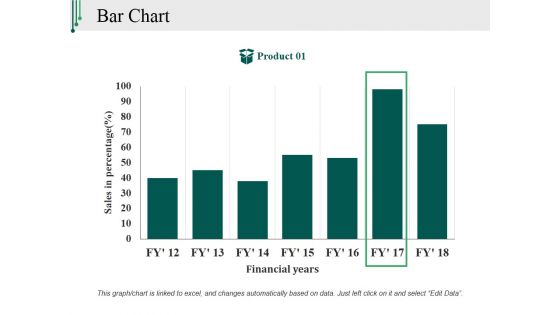
Bar Chart Ppt PowerPoint Presentation Outline Backgrounds
This is a bar chart ppt powerpoint presentation outline backgrounds. This is a one stage process. The stages in this process are sales in percentage, financial years, product, bar graph, finance.
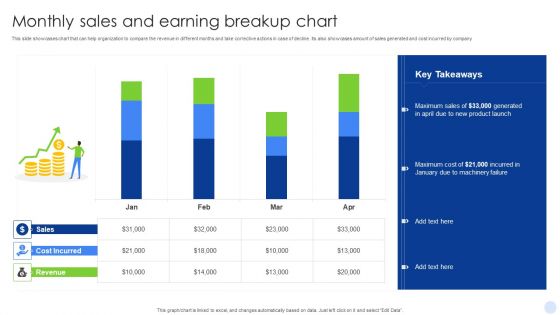
Monthly Sales And Earning Breakup Chart Clipart PDF
This slide showcases chart that can help organization to compare the revenue in different months and take corrective actions in case of decline. Its also showcases amount of sales generated and cost incurred by company. Showcasing this set of slides titled Monthly Sales And Earning Breakup Chart Clipart PDF. The topics addressed in these templates are New Product Launch, Machinery Failure. All the content presented in this PPT design is completely editable. Download it and make adjustments in color, background, font etc. as per your unique business setting.
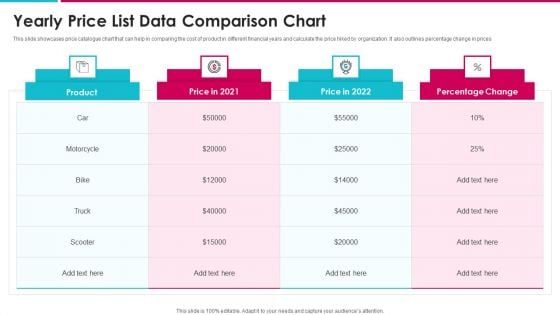
Yearly Price List Data Comparison Chart Structure PDF
This slide showcases price catalogue chart that can help in comparing the cost of product in different financial years and calculate the price hiked by organization. It also outlines percentage change in prices Showcasing this set of slides titled yearly price list data comparison chart structure pdf. The topics addressed in these templates are yearly price list data comparison chart. All the content presented in this PPT design is completely editable. Download it and make adjustments in color, background, font etc. as per your unique business setting.
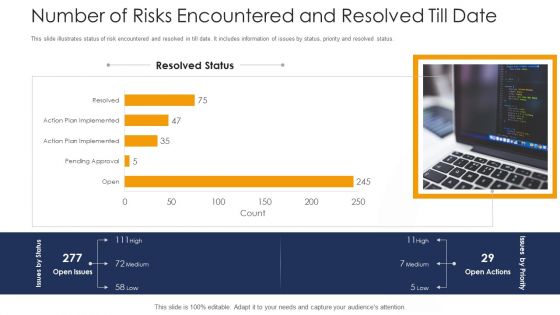
Strategies To Tackle In Banking Institutions Number Of Risks Encountered And Resolved Till Date Topics PDF
This slide illustrates status of risk encountered and resolved in till date. It includes information of issues by status, priority and resolved status. Deliver an awe inspiring pitch with this creative strategies to tackle in banking institutions number of risks encountered and resolved till date topics pdf bundle. Topics like high, medium, low can be discussed with this completely editable template. It is available for immediate download depending on the needs and requirements of the user.
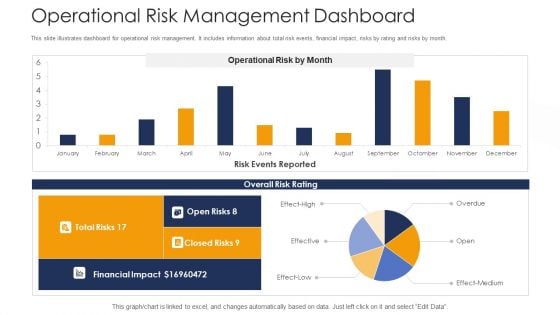
Strategies To Tackle Operational Risk In Banking Institutions Operational Risk Management Dashboard Structure PDF
This slide illustrates dashboard for operational risk management. It includes information about total risk events, financial impact, risks by rating and risks by month. Deliver an awe inspiring pitch with this creative strategies to tackle operational risk in banking institutions operational risk management dashboard structure pdf bundle. Topics like financial impact, operational risk management dashboard can be discussed with this completely editable template. It is available for immediate download depending on the needs and requirements of the user.
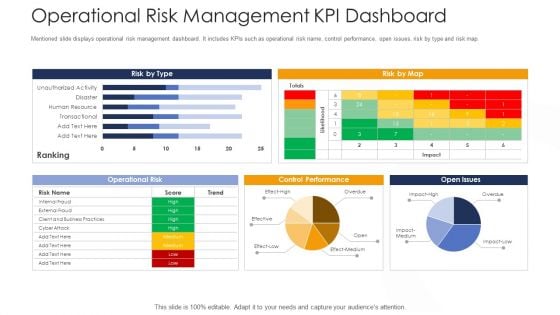
Strategies To Tackle Operational Risk In Banking Institutions Operational Risk Management KPI Dashboard Template PDF
Mentioned slide displays operational risk management dashboard. It includes KPIs such as operational risk name, control performance, open issues, risk by type and risk map. Deliver an awe inspiring pitch with this creative strategies to tackle operational risk in banking institutions operational risk management kpi dashboard template pdf bundle. Topics like operational risk, control performance, operational risk management kpi dashboard can be discussed with this completely editable template. It is available for immediate download depending on the needs and requirements of the user.

Investor Pitch Deck Procure Federal Debt From Banks Current Growth Status Of The Company Guidelines PDF
This slide shows Current Growth Performance of the company in terms of increase in Cash Equivalents and overall Company Revenue. Deliver and pitch your topic in the best possible manner with this investor pitch deck procure federal debt from banks current growth status of the company guidelines pdf. Use them to share invaluable insights on revenue, cash equivalents at year end, financial highlights and impress your audience. This template can be altered and modified as per your expectations. So, grab it now.
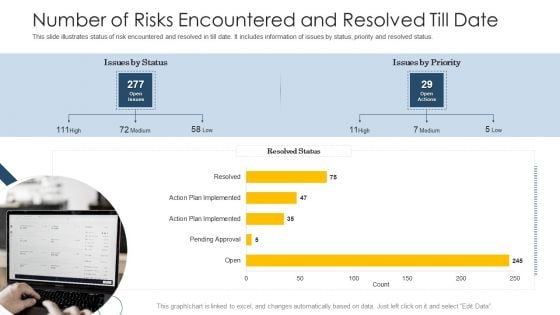
Establishing Operational Risk Framework Banking Number Of Risks Encountered And Resolved Till Date Brochure PDF
This slide illustrates status of risk encountered and resolved in till date. It includes information of issues by status, priority and resolved status. Deliver an awe-inspiring pitch with this creative establishing operational risk framework banking number of risks encountered and resolved till date brochure pdf bundle. Topics like number of risks encountered and resolved till date can be discussed with this completely editable template. It is available for immediate download depending on the needs and requirements of the user.
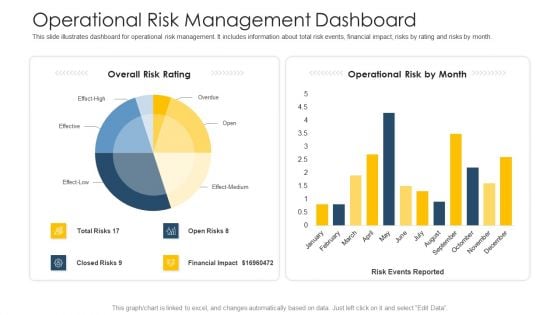
Establishing Operational Risk Framework Banking Operational Risk Management Dashboard Slides PDF
This slide illustrates dashboard for operational risk management. It includes information about total risk events, financial impact, risks by rating and risks by month. Deliver and pitch your topic in the best possible manner with this establishing operational risk framework banking operational risk management dashboard slides pdf. Use them to share invaluable insights on financial impact, operational risk, overall risk rating and impress your audience. This template can be altered and modified as per your expectations. So, grab it now.
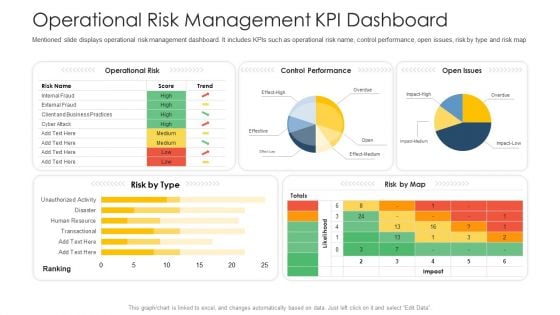
Establishing Operational Risk Framework Banking Operational Risk Management KPI Dashboard Brochure PDF
Mentioned slide displays operational risk management dashboard. It includes KPIs such as operational risk name, control performance, open issues, risk by type and risk map. Deliver an awe-inspiring pitch with this creative establishing operational risk framework banking operational risk management kpi dashboard brochure pdf bundle. Topics like operational risk, control performance, risk by map can be discussed with this completely editable template. It is available for immediate download depending on the needs and requirements of the user.
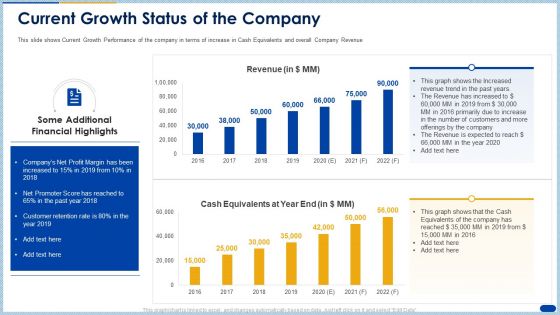
Raising Capital Banking Organizations Post Initial Public Offering Current Growth Status Of The Company Professional PDF
This slide shows Current Growth Performance of the company in terms of increase in Cash Equivalents and overall Company Revenue Deliver and pitch your topic in the best possible manner with this raising capital banking organizations post initial public offering current growth status of the company professional pdf. Use them to share invaluable insights on revenue, customer retention rate, net profit margin and impress your audience. This template can be altered and modified as per your expectations. So, grab it now.

M Banking System Improving Consumer Quarterly Customer Experience Assessment Overview Brochure PDF
This slide displays quarterly overview about customer experience assessment statistics. The slide includes ratings of NPS, CSAT, churn rate, retention rate, CLV and CES. Deliver and pitch your topic in the best possible manner with this m banking system improving consumer quarterly customer experience assessment overview brochure pdf. Use them to share invaluable insights on customer effort score, customer lifetime value, retention rate and impress your audience. This template can be altered and modified as per your expectations. So, grab it now.
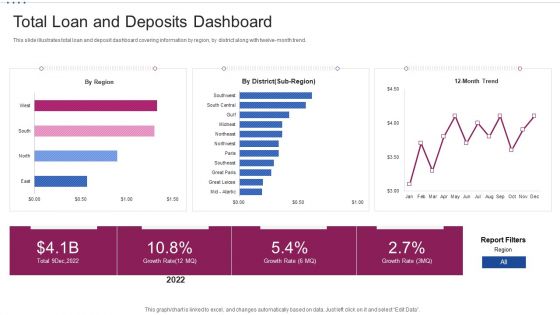
M Banking System Improving Consumer Total Loan And Deposits Dashboard Microsoft PDF
This slide illustrates total loan and deposit dashboard covering information by region, by district along with twelve-month trend. Deliver an awe inspiring pitch with this creative m banking system improving consumer total loan and deposits dashboard microsoft pdf bundle. Topics like growth rate, 12 month trend can be discussed with this completely editable template. It is available for immediate download depending on the needs and requirements of the user.
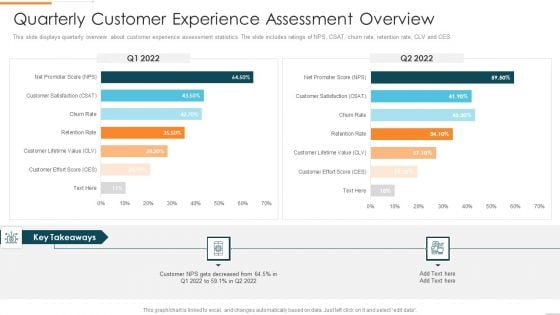
Enhanced Customer Banking Experience With Mobile Quarterly Customer Experience Assessment Background PDF
This slide displays quarterly overview about customer experience assessment statistics. The slide includes ratings of NPS, CSAT, churn rate, retention rate, CLV and CES.Deliver and pitch your topic in the best possible manner with this Enhanced Customer Banking Experience With Mobile Quarterly Customer Experience Assessment Background PDF Use them to share invaluable insights on Quarterly Customer Experience Assessment Overview and impress your audience. This template can be altered and modified as per your expectations. So, grab it now.
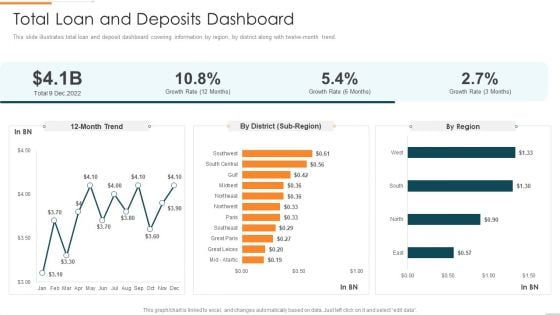
Enhanced Customer Banking Experience With Mobile Total Loan And Deposits Dashboard Professional PDF
This slide illustrates total loan and deposit dashboard covering information by region, by district along with twelve-month trend.Deliver an awe inspiring pitch with this creative Enhanced Customer Banking Experience With Mobile Total Loan And Deposits Dashboard Professional PDF bundle. Topics like Total Loan And Deposits Dashboard can be discussed with this completely editable template. It is available for immediate download depending on the needs and requirements of the user.
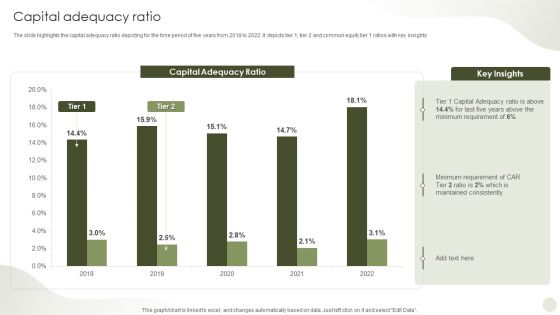
Commercial Bank Financial Services Company Profile Capital Adequacy Ratio Elements PDF
The slide highlights the capital adequacy ratio depicting for the time period of five years from 2018 to 2022. It depicts tier 1, tier 2 and common equity tier 1 ratios with key insights. Deliver an awe inspiring pitch with this creative Commercial Bank Financial Services Company Profile Capital Adequacy Ratio Elements PDF bundle. Topics like Capital Adequacy Ratio can be discussed with this completely editable template. It is available for immediate download depending on the needs and requirements of the user.
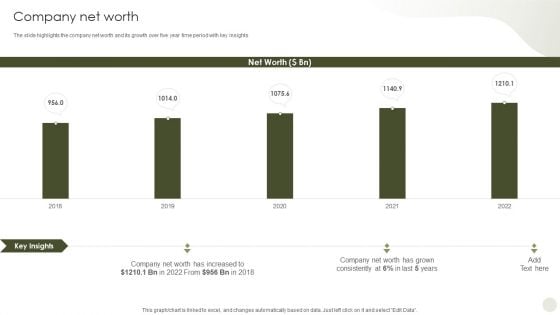
Commercial Bank Financial Services Company Profile Company Net Worth Template PDF
The slide highlights the company net worth and its growth over five year time period with key insights. Deliver an awe inspiring pitch with this creative Commercial Bank Financial Services Company Profile Company Net Worth Template PDF bundle. Topics like Company Net Worth can be discussed with this completely editable template. It is available for immediate download depending on the needs and requirements of the user.
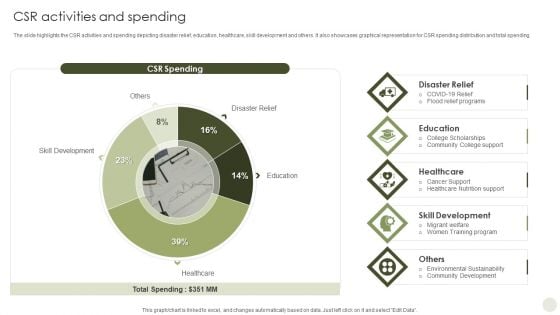
Commercial Bank Financial Services Company Profile CSR Activities And Spending Background PDF
The slide highlights the CSR activities and spending depicting disaster relief, education, healthcare, skill development and others. It also showcases graphical representation for CSR spending distribution and total spending. Deliver an awe inspiring pitch with this creative Commercial Bank Financial Services Company Profile CSR Activities And Spending Background PDF bundle. Topics like Skill Development, Education, Disaster Relief, Healthcare can be discussed with this completely editable template. It is available for immediate download depending on the needs and requirements of the user.
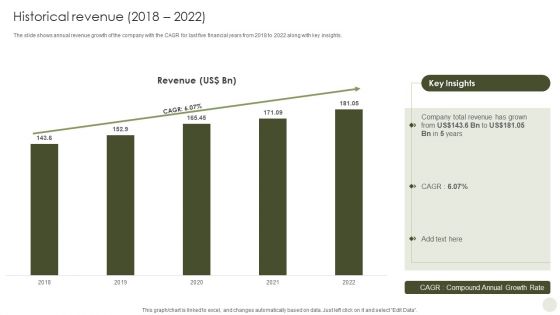
Commercial Bank Financial Services Company Profile Historical Revenue 2018 To 2022 Infographics PDF
The slide shows annual revenue growth of the company with the CAGR for last five financial years from 2018 to 2022 along with key insights. Deliver and pitch your topic in the best possible manner with this Commercial Bank Financial Services Company Profile Historical Revenue 2018 To 2022 Infographics PDF. Use them to share invaluable insights on Historical Revenue and impress your audience. This template can be altered and modified as per your expectations. So, grab it now.
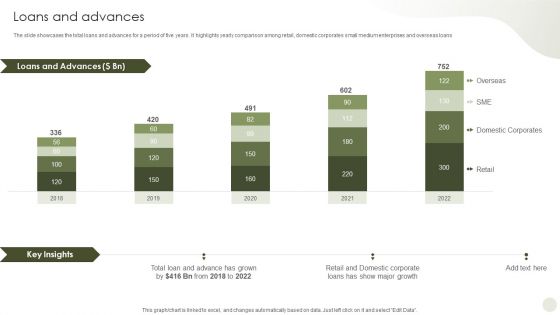
Commercial Bank Financial Services Company Profile Loans And Advances Rules PDF
The slide showcases the total loans and advances for a period of five years. It highlights yearly comparison among retail, domestic corporates small medium enterprises and overseas loans. Deliver an awe inspiring pitch with this creative Commercial Bank Financial Services Company Profile Loans And Advances Rules PDF bundle. Topics like Loans And Advances can be discussed with this completely editable template. It is available for immediate download depending on the needs and requirements of the user.
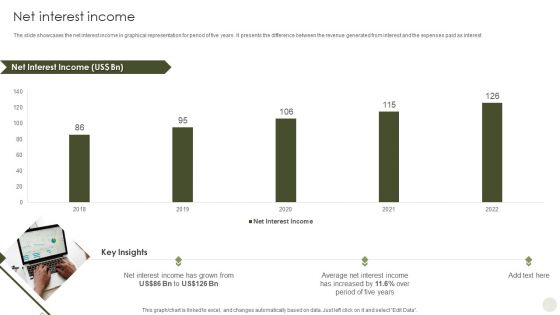
Commercial Bank Financial Services Company Profile Net Interest Income Pictures PDF
The slide showcases the net interest income in graphical representation for period of five years. It presents the difference between the revenue generated from interest and the expenses paid as interest. Deliver and pitch your topic in the best possible manner with this Commercial Bank Financial Services Company Profile Net Interest Income Pictures PDF. Use them to share invaluable insights on Net Interest Income and impress your audience. This template can be altered and modified as per your expectations. So, grab it now.
Lego Blocks Business PowerPoint Templates And PowerPoint Themes 0412
Microsoft Powerpoint Templates and Background with diagram Give your thoughts an artistic backing. Add on the craftsmanship of our Lego Blocks Business PowerPoint Templates And PowerPoint Themes 0412.
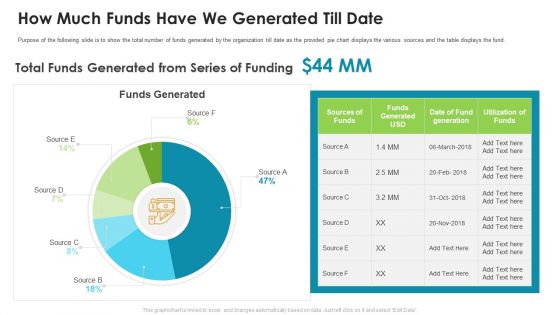
How Much Funds Have We Generated Till Date Pictures PDF
Purpose of the following slide is to show the total number of funds generated by the organization till date as the provided pie chart displays the various sources and the table displays the fund.Deliver an awe-inspiring pitch with this creative how much funds have we generated till date pictures pdf. bundle. Topics like total funds generated from series of funding can be discussed with this completely editable template. It is available for immediate download depending on the needs and requirements of the user.
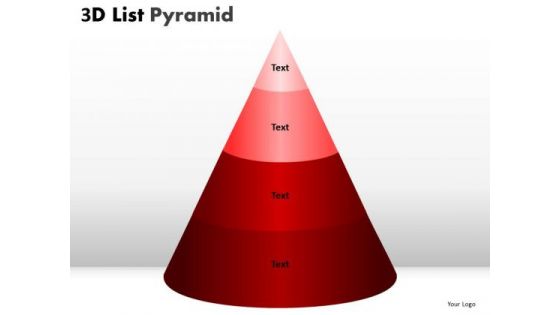
PowerPoint Slide Designs Graphic Bulleted List Pyramid Ppt Themes
PowerPoint Slide Designs Graphic Bulleted List Pyramid PPT Themes-These high quality, editable pre-designed powerpoint slides have been carefully created by our professional team to help you impress your audience. Each graphic in every slide is vector based and is 100% editable in powerpoint. Each and every property of any slide - color, size, shading etc can be modified to build an effective powerpoint presentation. Use these slides to convey complex business concepts in a simplified manner. Any text can be entered at any point in the powerpoint slide. Simply DOWNLOAD, TYPE and PRESENT! You have envisaged a bright future for your organisation. Deliver your forecast on our PowerPoint Slide Designs Graphic Bulleted List Pyramid Ppt Themes.
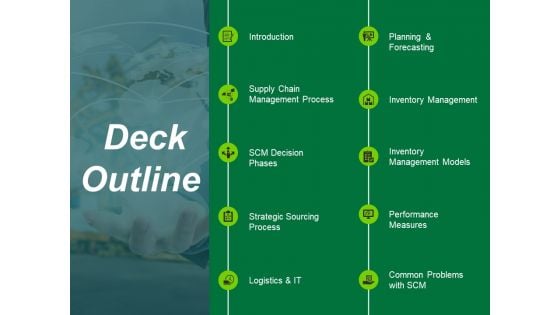
Deck Outline Ppt PowerPoint Presentation Layouts Portrait
This is a deck outline ppt powerpoint presentation layouts portrait. This is a ten stage process. The stages in this process are introduction, planning and forecasting, inventory management, performance measures, strategic sourcing process, scm decision phases.
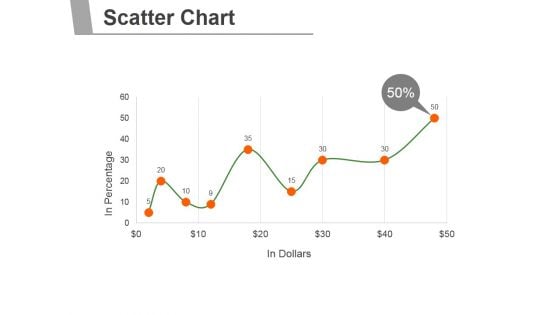
Scatter Chart Ppt PowerPoint Presentation Rules
This is a scatter chart ppt powerpoint presentation rules. This is a ten stage process. The stages in this process are business, marketing, scatter chart, growth, management.
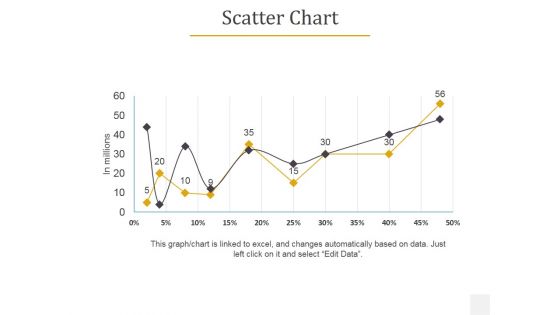
Scatter Chart Ppt PowerPoint Presentation Inspiration Styles
This is a scatter chart ppt powerpoint presentation inspiration styles. This is a two stage process. The stages in this process are business, chart, marketing, product, management.
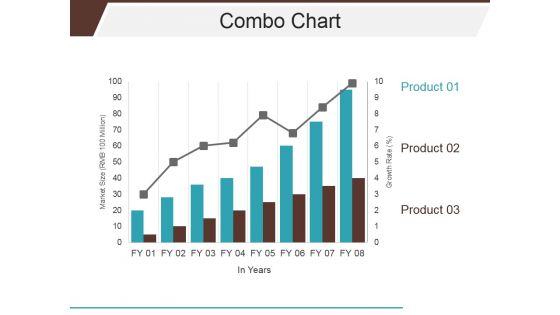
Combo Chart Ppt PowerPoint Presentation Infographics Slideshow
This is a combo chart ppt powerpoint presentation infographics slideshow. This is a three stage process. The stages in this process are business, marketing, graph, line chart, growth.
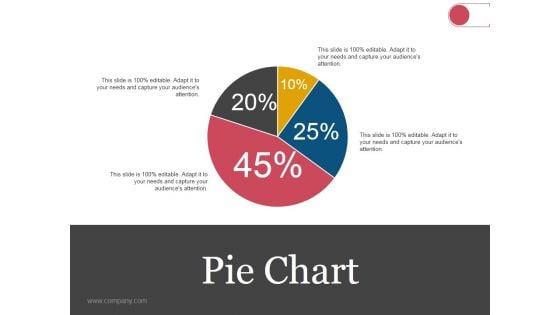
Pie Chart Ppt PowerPoint Presentation Gallery Skills
This is a pie chart ppt powerpoint presentation gallery skills. This is a four stage process. The stages in this process are business, strategy, analysis, marketing, pie chart.
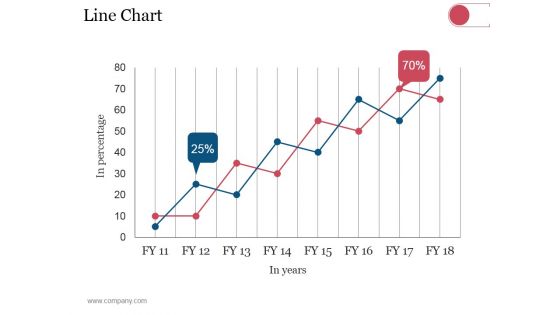
Line Chart Ppt PowerPoint Presentation Model Elements
This is a line chart ppt powerpoint presentation model elements. This is a eight stage process. The stages in this process are business, strategy, analysis, planning, line chart.
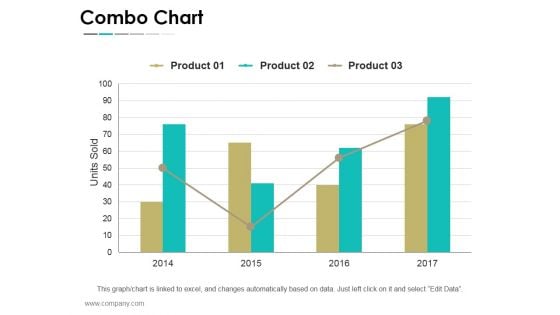
Combo Chart Ppt PowerPoint Presentation Slides Smartart
This is a combo chart ppt powerpoint presentation slides smartart. This is a four stage process. The stages in this process are business, strategy, analysis, planning, combo chart.
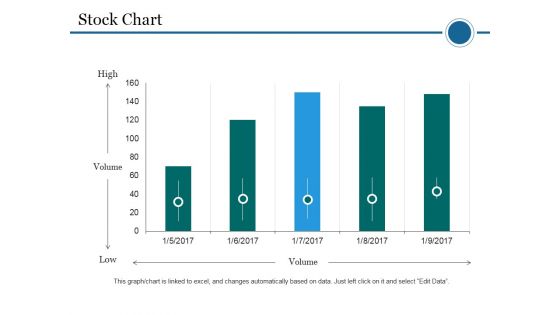
Stock Chart Ppt PowerPoint Presentation Professional Vector
This is a stock chart ppt powerpoint presentation professional vector. This is a five stage process. The stages in this process are stock chart, volume, high, low.
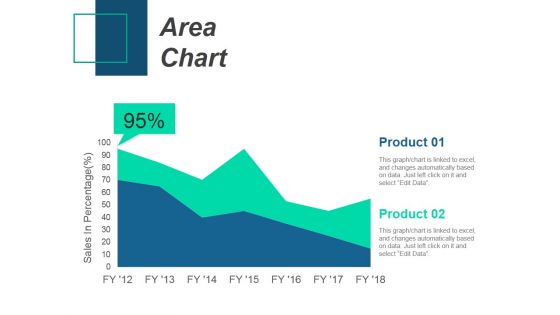
Area Chart Ppt PowerPoint Presentation Inspiration Images
This is a area chart ppt powerpoint presentation inspiration images. This is a two stage process. The stages in this process are area chart, product, sales in percentage.
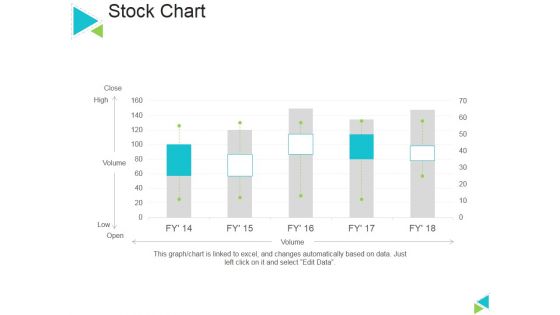
Stock Chart Ppt PowerPoint Presentation Ideas Slideshow
This is a stock chart ppt powerpoint presentation ideas slideshow. This is a five stage process. The stages in this process are stock chart, close, volume, open.
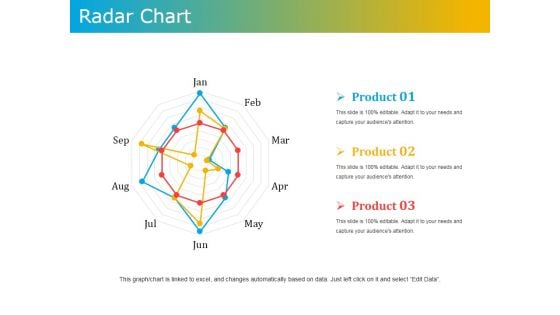
Radar Chart Ppt PowerPoint Presentation Outline Model
This is a radar chart ppt powerpoint presentation outline model. This is a three stage process. The stages in this process are radar chart, product, business, marketing, management.
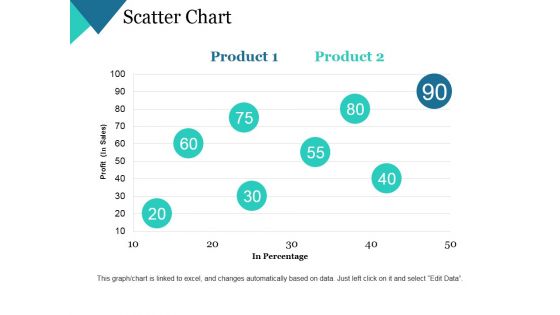
Scatter Chart Ppt PowerPoint Presentation Gallery Microsoft
This is a scatter chart ppt powerpoint presentation gallery microsoft. This is a two stage process. The stages in this process are profit, in percentage, business, marketing, chart.
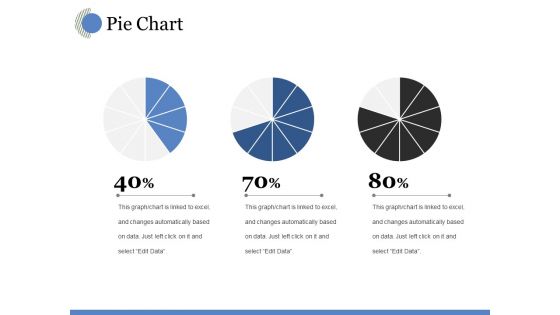
Pie Chart Ppt PowerPoint Presentation Professional Graphics
This is a pie chart ppt powerpoint presentation professional graphics. This is a three stage process. The stages in this process are chart, percentage, business, marketing, strategy.
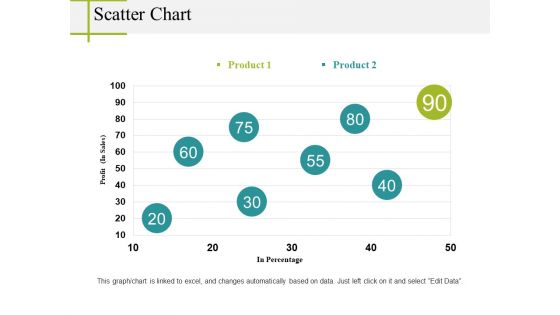
Scatter Chart Ppt PowerPoint Presentation Infographics Good
This is a scatter chart ppt powerpoint presentation infographics good. This is a two stage process. The stages in this process are in percentage, profit, chart, business, marketing.
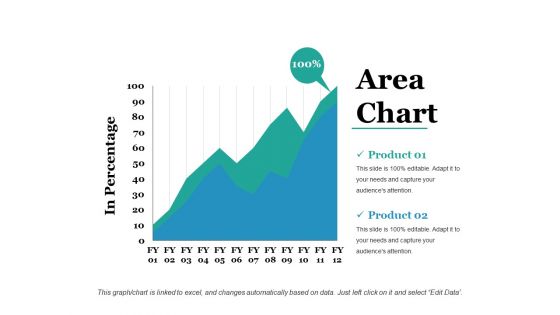
Area Chart Ppt PowerPoint Presentation Show Background
This is a area chart ppt powerpoint presentation show background. This is a two stage process. The stages in this process are in percentage, chart, business, marketing, strategy.
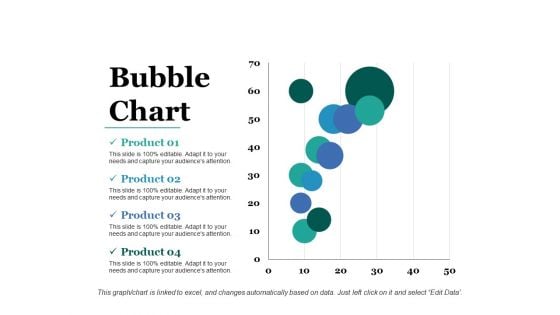
Bubble Chart Ppt PowerPoint Presentation File Styles
This is a bubble chart ppt powerpoint presentation file styles. This is a four stage process. The stages in this process are chart, business, marketing, strategy, bubble.
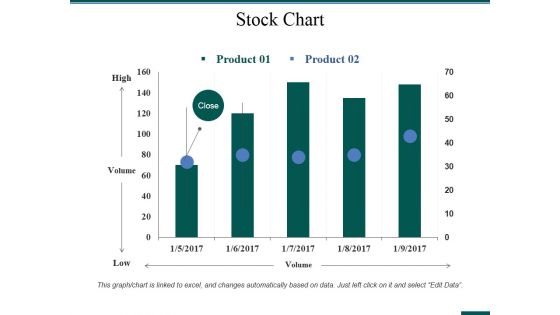
Stock Chart Ppt PowerPoint Presentation Professional Topics
This is a stock chart ppt powerpoint presentation professional topics. This is a two stage process. The stages in this process are high, volume, low, stock chart.
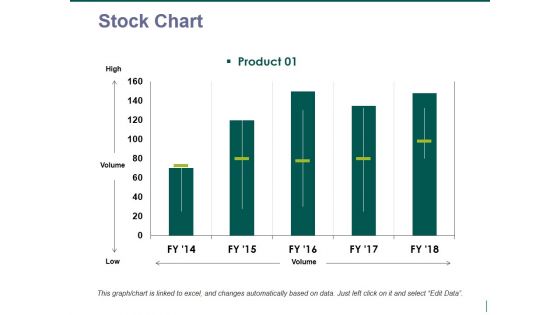
stock chart ppt powerpoint presentation pictures mockup
This is a stock chart ppt powerpoint presentation pictures mockup. This is a one stage process. The stages in this process are stock chart, high, volume, low.
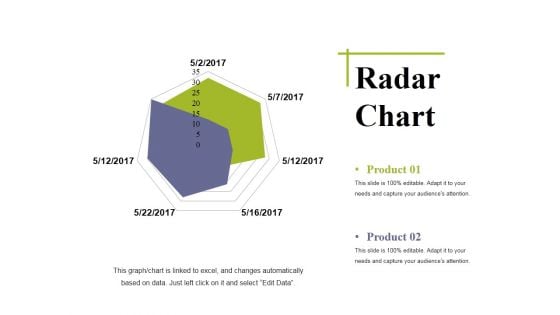
Radar Chart Ppt PowerPoint Presentation Outline Deck
This is a radar chart ppt powerpoint presentation outline deck. This is a two stage process. The stages in this process are radar chart, marketing, strategy, analysis, business.
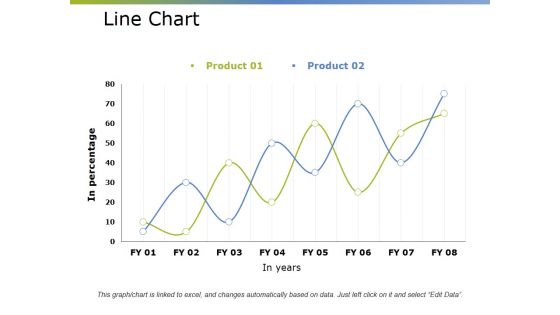
Line Chart Ppt PowerPoint Presentation Professional Gridlines
This is a line chart ppt powerpoint presentation professional gridlines. This is a two stage process. The stages in this process are business, marketing, growth, success, line chart.
Stock Chart Ppt PowerPoint Presentation Ideas Inspiration
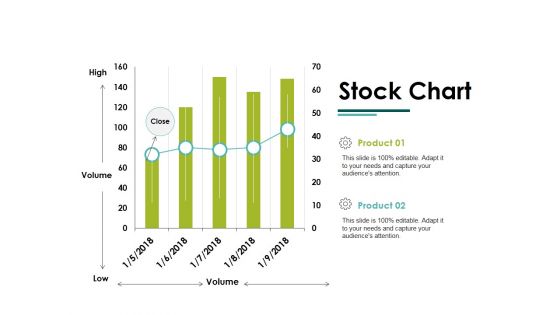
This is a stock chart ppt powerpoint presentation ideas inspiration. This is a two stage process. The stages in this process are high, volume, low, stock chart.
Column Chart Ppt PowerPoint Presentation Portfolio Outline
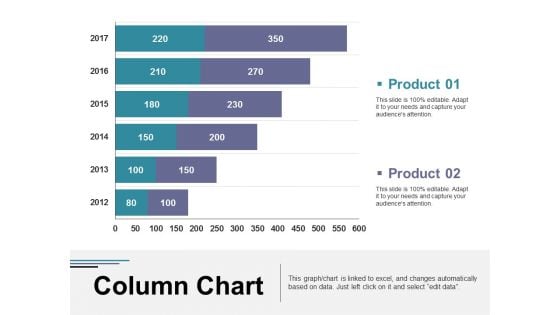
This is a column chart ppt powerpoint presentation portfolio outline. This is a two stage process. The stages in this process are column chart, business, marketing, graph, strategy.
Stock Chart Ppt PowerPoint Presentation Pictures Model
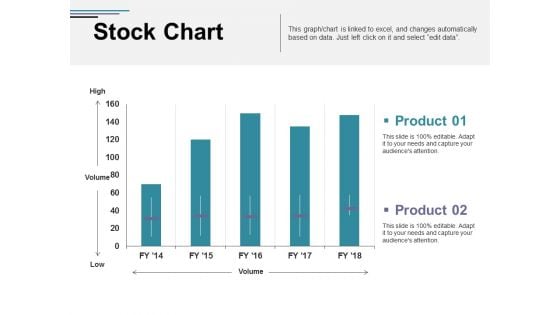
This is a stock chart ppt powerpoint presentation pictures model. This is a two stage process. The stages in this process are business, high, volume, low, chart.
Line Chart Ppt PowerPoint Presentation Layouts Topics
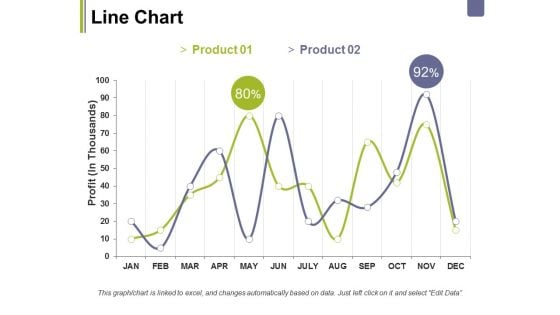
This is a line chart ppt powerpoint presentation layouts topics. This is a two stage process. The stages in this process are business, profit, chart, percentage, graph, marketing.
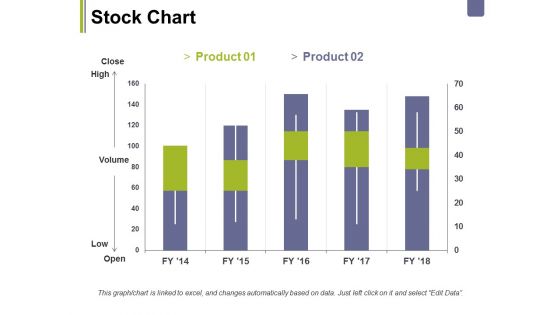
Stock Chart Ppt PowerPoint Presentation Outline Influencers
This is a stock chart ppt powerpoint presentation outline influencers. This is a two stage process. The stages in this process are business, marketing, high, volume, low, chart.
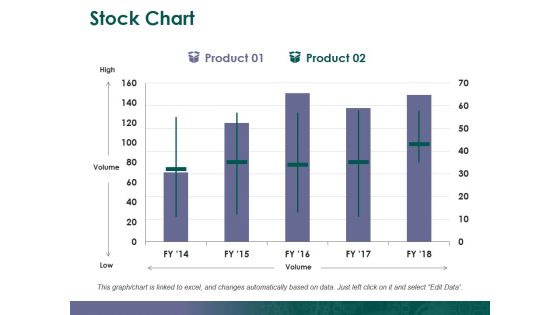
Stock Chart Ppt PowerPoint Presentation Outline Introduction
This is a stock chart ppt powerpoint presentation outline introduction. This is a two stage process. The stages in this process are stock chart, high, volume, low.
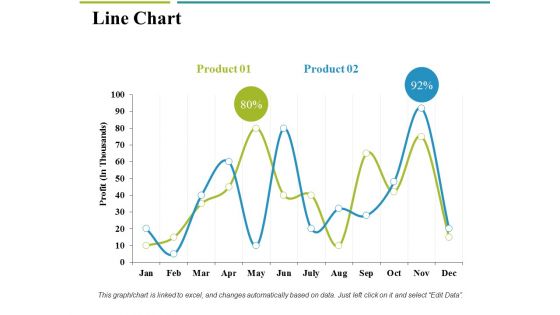
Line Chart Ppt PowerPoint Presentation Portfolio Deck
This is a line chart ppt powerpoint presentation portfolio deck. This is a two stage process. The stages in this process are business, marketing, profit, chart, percentage.
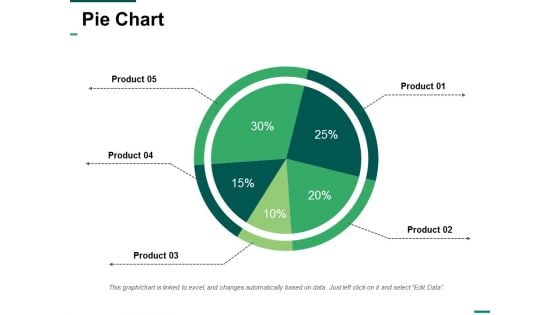
Pie Chart Ppt PowerPoint Presentation Designs Download
This is a pie chart ppt powerpoint presentation designs download. This is a five stage process. The stages in this process are pie chart, business, marketing, strategy, planning.
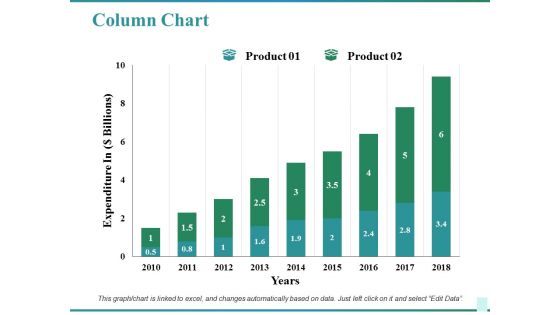
Column Chart Ppt PowerPoint Presentation Inspiration Picture
This is a column chart ppt powerpoint presentation inspiration picture. This is a two stage process. The stages in this process are business, marketing, years, expenditure in, chart.
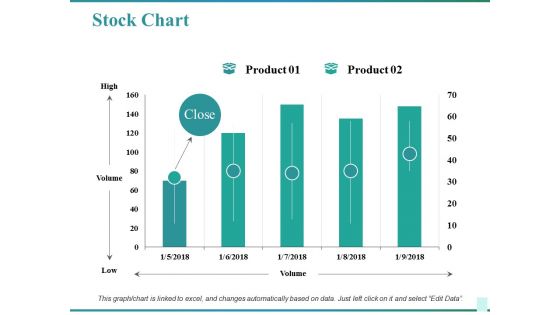
Stock Chart Ppt PowerPoint Presentation Pictures Microsoft
This is a stock chart ppt powerpoint presentation pictures microsoft. This is a two stage process. The stages in this process are business, high, volume, low, chart.
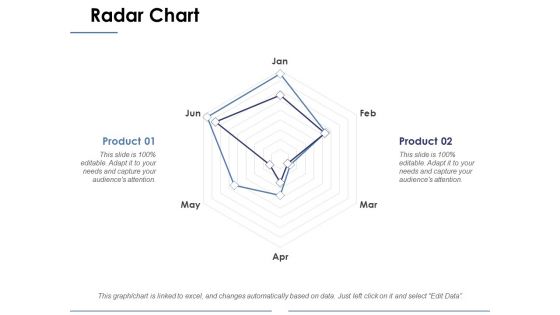
Radar Chart Ppt PowerPoint Presentation Portfolio Portrait
This is a radar chart ppt powerpoint presentation portfolio portrait. This is a two stage process. The stages in this process are business, radar chart, marketing, graph, strategy.
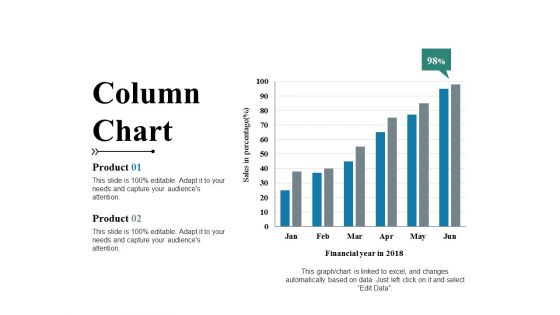
Column Chart Ppt PowerPoint Presentation Inspiration Inspiration
This is a column chart ppt powerpoint presentation inspiration inspiration. This is a two stage process. The stages in this process are column chart, growth, strategy, business, analysis.
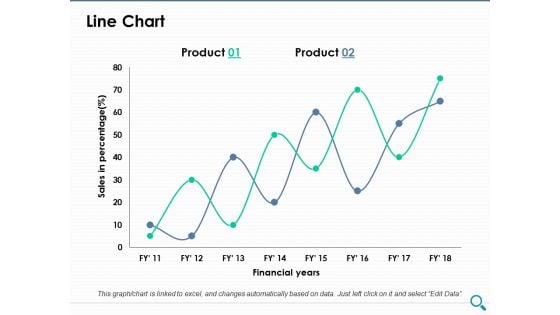
Line Chart Ppt PowerPoint Presentation Model Model
This is a line chart ppt powerpoint presentation model model. This is a two stage process. The stages in this process are line chart, growth, strategy, business, analysis.
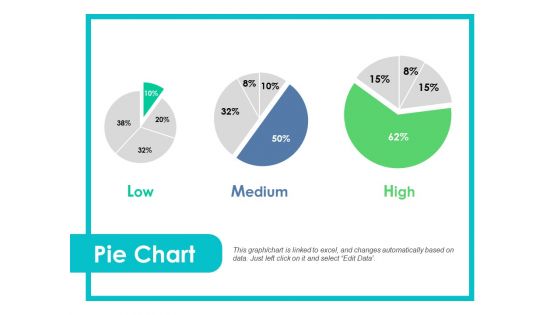
Pie Chart Ppt PowerPoint Presentation Gallery Brochure
This is a pie chart ppt powerpoint presentation gallery brochure. This is a three stages process. The stages in this process are low, medium, high, pie chart.
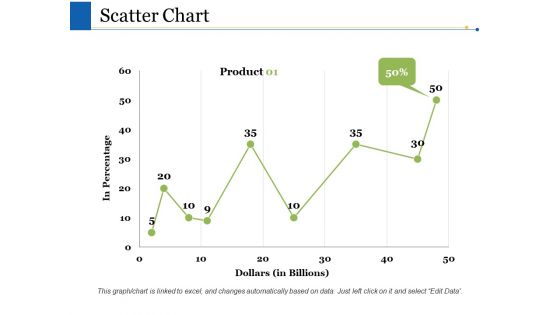
Scatter Chart Ppt PowerPoint Presentation Files
This is a scatter chart ppt powerpoint presentation files. This is a one stage process. The stages in this process are scatter chart, financial, strategy, business, planning.
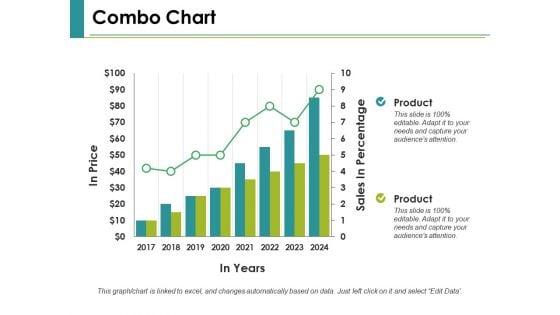
Combo Chart Ppt PowerPoint Presentation Professional Ideas
This is a combo chart ppt powerpoint presentation professional ideas. This is a two stages process. The stages in this process are combo chart, financial, business, planning, marketing.
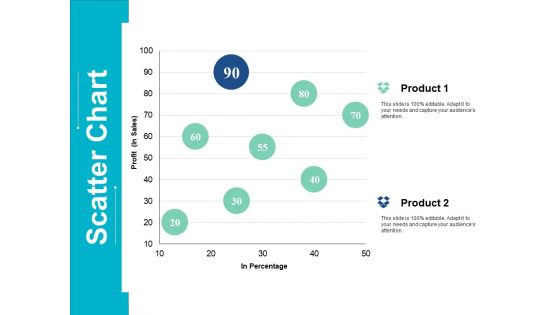
Scatter Chart Ppt PowerPoint Presentation Styles Guidelines
This is a scatter chart ppt powerpoint presentation styles guidelines. This is a two stage process. The stages in this process are scatter chart, percentage, product.
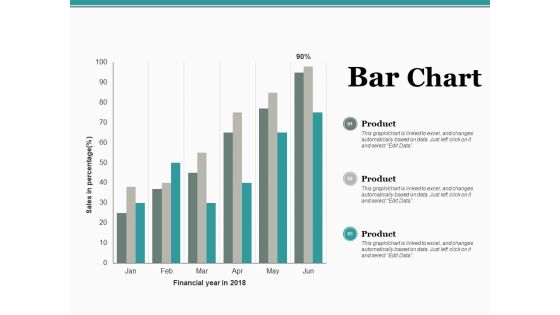
Bar Chart Ppt PowerPoint Presentation Inspiration Outfit
This is a bar chart ppt powerpoint presentation inspiration outfit. This is a three stage process. The stages in this process are percentage, product, bar chart, marketing.
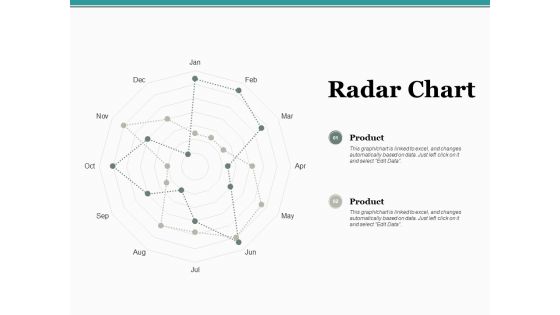
Radar Chart Ppt PowerPoint Presentation Professional Ideas
This is a radar chart ppt powerpoint presentation professional ideas. This is a two stage process. The stages in this process are product, percentage, management, marketing, chart.
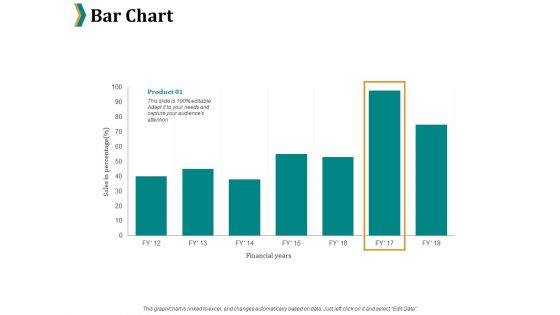
Bar Chart Ppt PowerPoint Presentation Portfolio Slides
This is a bar chart ppt powerpoint presentation portfolio slides. This is a one stage process. The stages in this process are product, percentage, marketing, business, bar chart.
Chart Growth Business PowerPoint Template 0910
Arrow pointing to the higher financial chart bar 3d illustration Enter onto your new path with our Chart Growth Business PowerPoint Template 0910. Your thoughts will make a solid beginning.
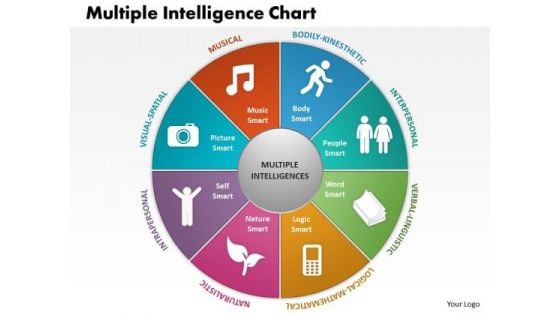
Business Framework Multiple Intelligence Chart PowerPoint Presentation
This business framework power point template has been designed with graphic of multiple intelligence chart. This kind of charts are used for testing and assessment process of any business. Add this template in your presentation and show creative ideas graphically.
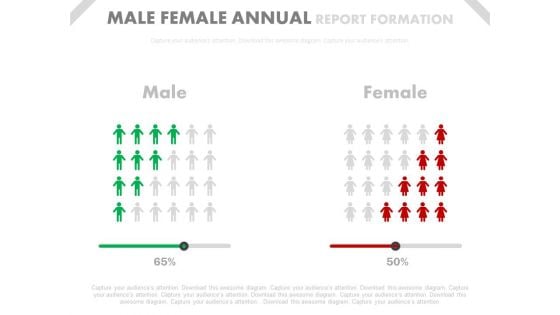
Male Female Ratio Comparison Chart Powerpoint Slides
This PowerPoint template has been designed with graphics of comparison chart. You may download this PPT slide to depict male female ratio comparison chart. Add this slide to your presentation and impress your superiors.
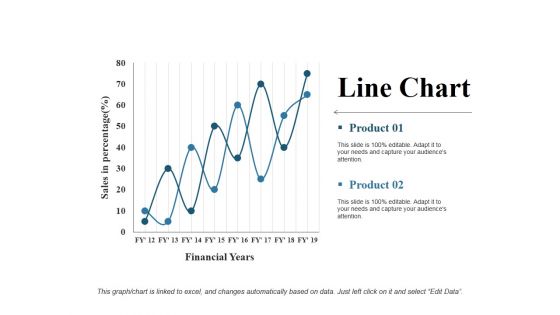
Line Chart Ppt PowerPoint Presentation Gallery Rules
This is a line chart ppt powerpoint presentation gallery rules. This is a two stage process. The stages in this process are financial years, product, sales in percentage, line chart, growth.
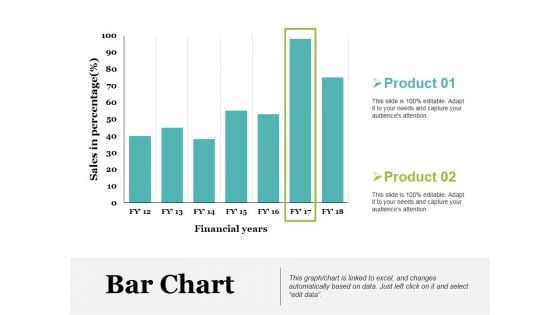
Bar Chart Ppt PowerPoint Presentation Model Picture
This is a bar chart ppt powerpoint presentation model picture. This is a two stage process. The stages in this process are product, sales in percentage, financial years, bar chart.
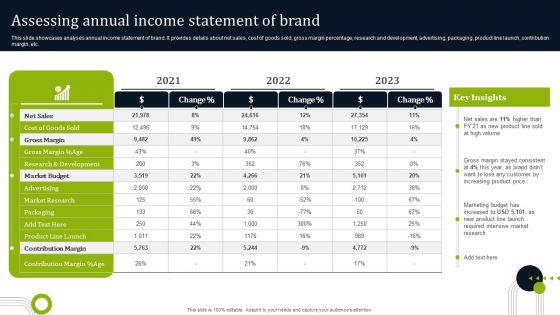
Introducing New Commodities Through Product Line Extension Assessing Annual Income Statement Diagrams PDF
This slide showcases analyses annual income statement of brand. It provides details about net sales, cost of goods sold, gross margin percentage, research and development, advertising, packaging, product line launch, contribution margin, etc. Slidegeeks is here to make your presentations a breeze with Introducing New Commodities Through Product Line Extension Assessing Annual Income Statement Diagrams PDF With our easy-to-use and customizable templates, you can focus on delivering your ideas rather than worrying about formatting. With a variety of designs to choose from, you are sure to find one that suits your needs. And with animations and unique photos, illustrations, and fonts, you can make your presentation pop. So whether you are giving a sales pitch or presenting to the board, make sure to check out Slidegeeks first.
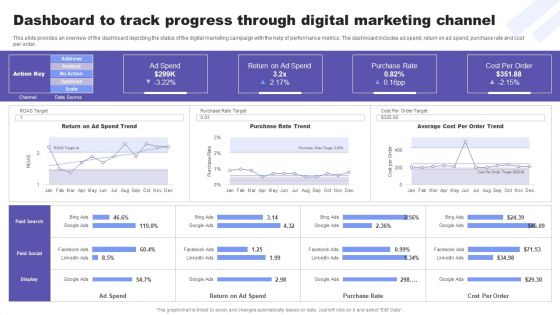
Direct Response Marketing Guide Ultimate Success Dashboard To Track Progress Diagrams PDF
This slide provides an overview of the dashboard depicting the status of the digital marketing campaign with the help of performance metrics. The dashboard includes ad spend, return on ad spend, purchase rate and cost per order. Are you in need of a template that can accommodate all of your creative concepts This one is crafted professionally and can be altered to fit any style. Use it with Google Slides or PowerPoint. Include striking photographs, symbols, depictions, and other visuals. Fill, move around, or remove text boxes as desired. Test out color palettes and font mixtures. Edit and save your work, or work with colleagues. Download Direct Response Marketing Guide Ultimate Success Dashboard To Track Progress Diagrams PDF and observe how to make your presentation outstanding. Give an impeccable presentation to your group and make your presentation unforgettable.
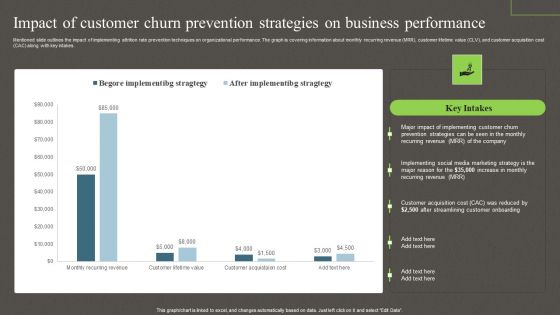
Impact Of Customer Churn Prevention Strategies On Business Performance Ppt PowerPoint Presentation Diagram Images PDF
Mentioned slide outlines the impact of implementing attrition rate prevention techniques on organizational performance. The graph is covering information about monthly recurring revenue MRR, customer lifetime value CLV, and customer acquisition cost CAC along with key intakes. The Impact Of Customer Churn Prevention Strategies On Business Performance Ppt PowerPoint Presentation Diagram Images PDF is a compilation of the most recent design trends as a series of slides. It is suitable for any subject or industry presentation, containing attractive visuals and photo spots for businesses to clearly express their messages. This template contains a variety of slides for the user to input data, such as structures to contrast two elements, bullet points, and slides for written information. Slidegeeks is prepared to create an impression.
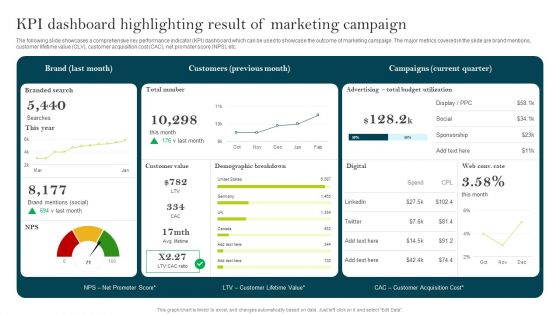
KPI Dashboard Highlighting Result Of Marketing Campaign Ppt PowerPoint Presentation Diagram Lists PDF
The following slide showcases a comprehensive key performance indicator KPI dashboard which can be used to showcase the outcome of marketing campaign. The major metrics covered in the slide are brand mentions, customer lifetime value CLV, customer acquisition cost CAC, net promoter score NPS, etc. Are you in need of a template that can accommodate all of your creative concepts This one is crafted professionally and can be altered to fit any style. Use it with Google Slides or PowerPoint. Include striking photographs, symbols, depictions, and other visuals. Fill, move around, or remove text boxes as desired. Test out color palettes and font mixtures. Edit and save your work, or work with colleagues. Download KPI Dashboard Highlighting Result Of Marketing Campaign Ppt PowerPoint Presentation Diagram Lists PDF and observe how to make your presentation outstanding. Give an impeccable presentation to your group and make your presentation unforgettable.
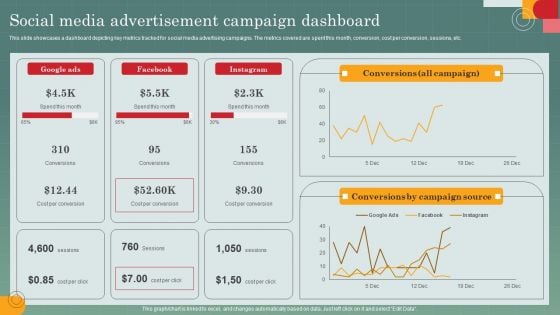
Advertising Programs Management Techniques Social Media Advertisement Campaign Dashboard Diagrams PDF
This slide showcases a dashboard depicting key metrics tracked for social media advertising campaigns. The metrics covered are spent this month, conversion, cost per conversion, sessions, etc. This modern and well arranged Advertising Programs Management Techniques Social Media Advertisement Campaign Dashboard Diagrams PDF provides lots of creative possibilities. It is very simple to customize and edit with the Powerpoint Software. Just drag and drop your pictures into the shapes. All facets of this template can be edited with Powerpoint no extra software is necessary. Add your own material, put your images in the places assigned for them, adjust the colors, and then you can show your slides to the world, with an animated slide included.
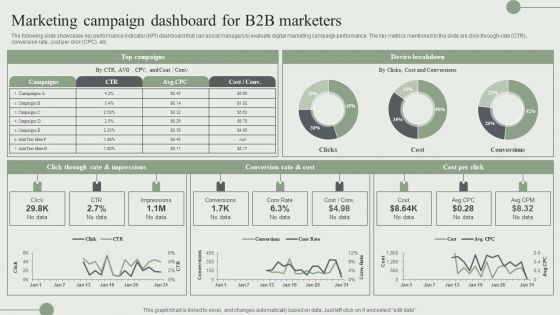
Marketing Campaign Dashboard For B2B Marketers Ppt PowerPoint Presentation File Diagrams PDF
The following slide showcases key performance indicator KPI dashboard that can assist managers to evaluate digital marketing campaign performance. The key metrics mentioned in the slide are click-through-rate CTR, conversion rate, cost per click CPC, etc. Present like a pro with Marketing Campaign Dashboard For B2B Marketers Ppt PowerPoint Presentation File Diagrams PDF Create beautiful presentations together with your team, using our easy to use presentation slides. Share your ideas in real time and make changes on the fly by downloading our templates. So whether you are in the office, on the go, or in a remote location, you can stay in sync with your team and present your ideas with confidence. With Slidegeeks presentation got a whole lot easier. Grab these presentations today.
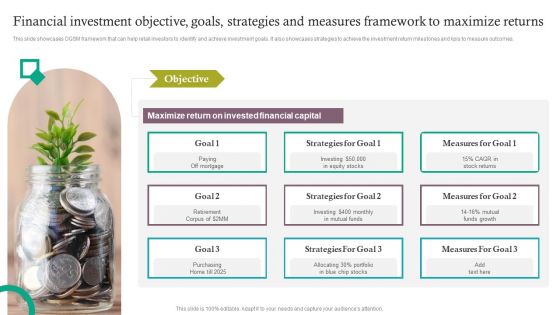
Financial Investment Objective Goals Strategies And Measures Framework To Maximize Returns Designs PDF
This slide showcases OGSM framework that can help retail investors to identify and achieve investment goals. It also showcases strategies to achieve the investment return milestones and kpis to measure outcomes. Presenting Financial Investment Objective Goals Strategies And Measures Framework To Maximize Returns Designs PDF to dispense important information. This template comprises nine stages. It also presents valuable insights into the topics including Maximize Return, Invested Financial Capital. This is a completely customizable PowerPoint theme that can be put to use immediately. So, download it and address the topic impactfully.
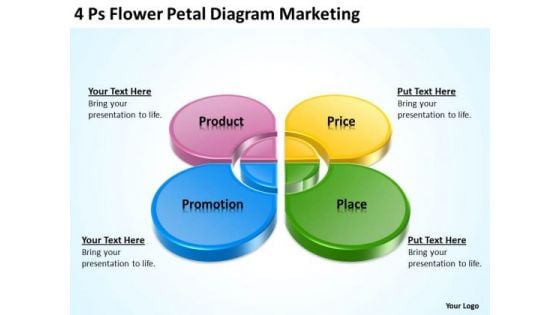
Business PowerPoint Template 4 Ps Flower Petal Diagram Marketing Ppt Slides
Get the doers into action. Activate them with our Business powerpoint template 4 ps flower petal diagram marketing ppt Slides. Put your money on our Competition PowerPoint Templates. Your ideas will rake in the dollars. Put in a dollop of our Circle Charts PowerPoint Templates. Give your thoughts a distinctive flavour. Expand on your theory with our Business PowerPoint Template 4 Ps Flower Petal Diagram Marketing Ppt Slides. Establish the cause of your confidence.
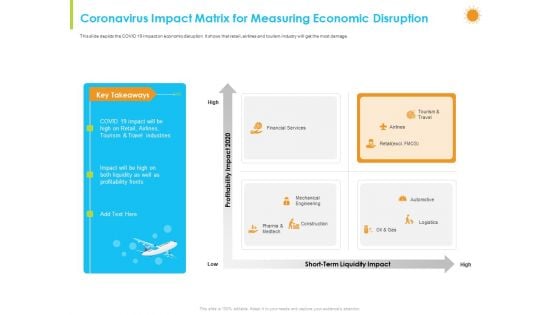
How Aviation Industry Coping With COVID 19 Pandemic Coronavirus Impact Matrix For Measuring Economic Disruption Slides PDF
This slide depicts the COVID 19 impact on economic disruption. It shows that retail, airlines and tourism industry will get the most damage.This is a how aviation industry coping with COVID 19 pandemic coronavirus impact matrix for measuring economic disruption slides pdf. template with various stages. Focus and dispense information on four stages using this creative set, that comes with editable features. It contains large content boxes to add your information on topics like financial services, mechanical engineering, pharma and medtech, construction, logistics. You can also showcase facts, figures, and other relevant content using this PPT layout. Grab it now.
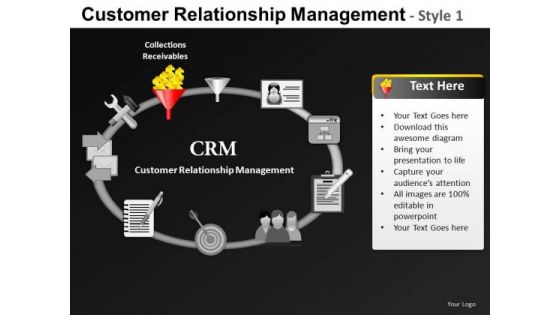
Cycle Customer Relationship Management 1 PowerPoint Slides And Ppt Diagram Templates
Cycle Customer Relationship Management 1 PowerPoint Slides And PPT Diagram Templates-These high quality, editable pre-designed powerpoint slides have been carefully created by our professional team to help you impress your audience. Each graphic in every slide is vector based and is 100% editable in powerpoint. Each and every property of any slide - color, size, shading etc can be modified to build an effective powerpoint presentation. Use these slides to convey complex business concepts in a simplified manner. Any text can be entered at any point in the powerpoint slide. Simply DOWNLOAD, TYPE and PRESENT! Calculate growth with our Cycle Customer Relationship Management 1 PowerPoint Slides And Ppt Diagram Templates. Download without worries with our money back guaranteee.
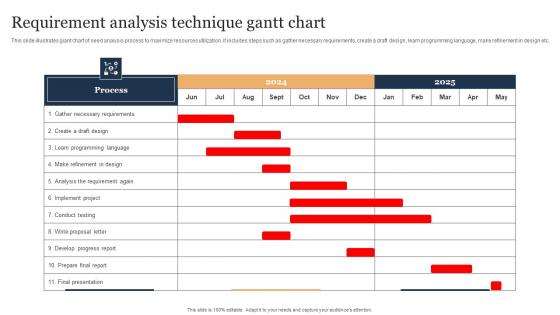
Requirement Analysis Technique Gantt Chart Guidelines Pdf
This slide illustrates giant chart of need analysis process to maximize resources utilization. It includes steps such as gather necessary requirements, create a draft design, learn programming language, make refinement in design etc. Pitch your topic with ease and precision using this Requirement Analysis Technique Gantt Chart Guidelines Pdf. This layout presents information on Requirement Analysis Technique, Resources Utilization, Learn Programming Language. It is also available for immediate download and adjustment. So, changes can be made in the color, design, graphics or any other component to create a unique layout. This slide illustrates giant chart of need analysis process to maximize resources utilization. It includes steps such as gather necessary requirements, create a draft design, learn programming language, make refinement in design etc.
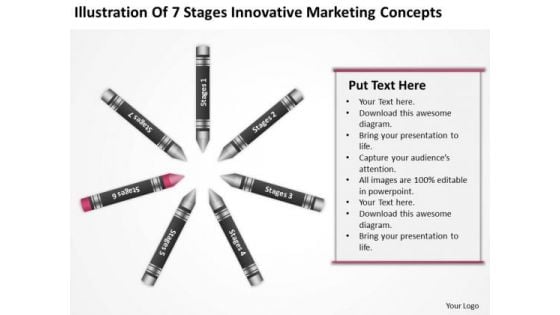
Business Process Diagram Chart Of 7 Stages Innovative Marketing Concepts Ppt 6 PowerPoint Slides
We present our business process diagram chart of 7 stages innovative marketing concepts ppt 6 PowerPoint Slides.Download and present our Education PowerPoint Templates because Our PowerPoint Templates and Slides ensures Effective communication. They help you put across your views with precision and clarity. Use our Process and Flows PowerPoint Templates because Our PowerPoint Templates and Slides will weave a web of your great ideas. They are gauranteed to attract even the most critical of your colleagues. Download our Shapes PowerPoint Templates because Our PowerPoint Templates and Slides will give good value for money. They also have respect for the value of your time. Present our Business PowerPoint Templates because You have the co-ordinates for your destination of success. Let our PowerPoint Templates and Slides map out your journey. Use our Leadership PowerPoint Templates because Our PowerPoint Templates and Slides will help you be quick off the draw. Just enter your specific text and see your points hit home.Use these PowerPoint slides for presentations relating to Crayon, wax, pastel, artist, isolated, children, hobbies, vibrant, preschool, sketching, row, drawing, close-up, colored, macro, multicolored, small, creativity, group, color, objects, colorful, blue, school, variation, education, draw, art, rainbow, kindergarten. The prominent colors used in the PowerPoint template are Red, Black, Gray. Get decisions in your favour. Our Business Process Diagram Chart Of 7 Stages Innovative Marketing Concepts Ppt 6 PowerPoint Slides ensure endorsement.
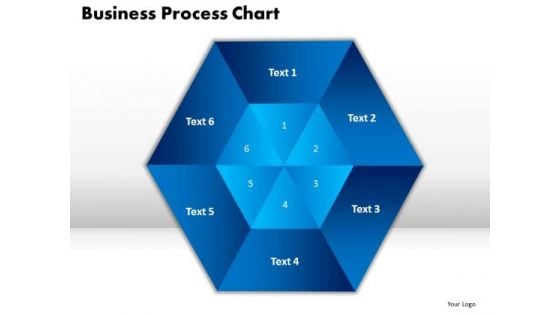
PowerPoint Slide Business Process Chart Marketing Ppt Slides
PowerPoint Slide Business Process Chart Marketing PPT Slides-This Hexagonal PowerPoint Diagram provides you the different way for explaining six approaches. This Business Process Chart will make your Presentation more Effective and interesting. -PowerPoint Slide Business Process Chart Marketing PPT Slides Excellence is an article of faith with our PowerPoint Slide Business Process Chart Marketing Ppt Slides team. They give their all and more to achieve it.
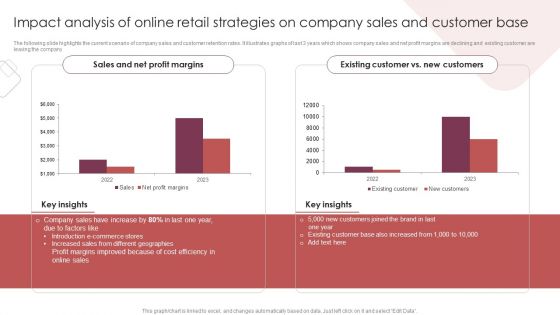
E Commerce Marketing Techniques To Boost Sales Impact Analysis Of Online Retail Strategies On Company Sales And Customer Base Slides PDF
The following slide highlights the current scenario of company sales and customer retention rates. It illustrates graphs of last 3 years which shows company sales and net profit margins are declining and existing customer are leaving the company. Explore a selection of the finest E Commerce Marketing Techniques To Boost Sales Impact Analysis Of Online Retail Strategies On Company Sales And Customer Base Slides PDF here. With a plethora of professionally designed and pre-made slide templates, you can quickly and easily find the right one for your upcoming presentation. You can use our E Commerce Marketing Techniques To Boost Sales Impact Analysis Of Online Retail Strategies On Company Sales And Customer Base Slides PDF to effectively convey your message to a wider audience. Slidegeeks has done a lot of research before preparing these presentation templates. The content can be personalized and the slides are highly editable. Grab templates today from Slidegeeks.
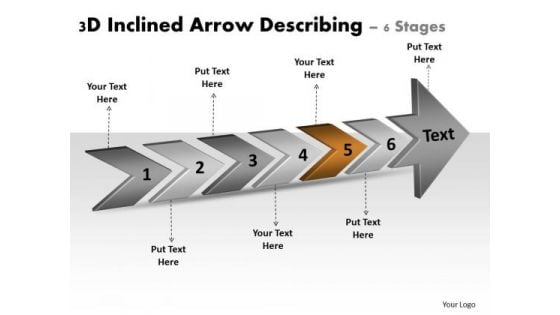
3d Inclined Arrow Describing 6 Stages Basic Process Flow Chart PowerPoint Templates
We present our 3d inclined arrow describing 6 stages basic process flow chart PowerPoint templates.Use our Finance PowerPoint Templates because,Let this slide illustrates others piggyback on you to see well over the horizon Use our Process and Flows PowerPoint Templates because, You are the star of your enlightened team. Use our Arrows PowerPoint Templates because,This Slide offers an excellent background to build up the various stages of your business process. Use our Shapes PowerPoint Templates because,You can Churn the wheels of the brains of your colleagues. Use our Business PowerPoint Templates because, It illustrates the city with a lasting tryst with resilience. You epitomise the qualities that give your city its fameUse these PowerPoint slides for presentations relating to Advertising, arrow, background, banner, bookmark, card, choice, concept, creative, design, direction, flow, idea, illustration, infographic, instruction, label, layout, manual, marketing, modern, next, number, offer, options, order, paper, process, product, promotion, sequence, simple, step, symbol, template, triangle, tutorial, vector, version, web. The prominent colors used in the PowerPoint template are Brown, Gray, Black Go get 'em with our 3d Inclined Arrow Describing 6 Stages Basic Process Flow Chart PowerPoint Templates.Be sure there will be no false bravado.
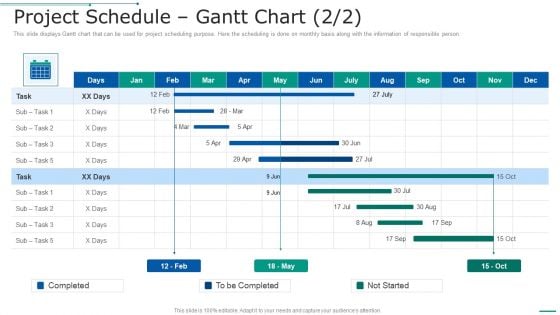
PMP Toolkit Project Schedule Gantt Chart Ppt Inspiration Slideshow PDF
This slide displays Gantt chart that can be used for project scheduling purpose. Here the scheduling is done on monthly basis along with the information of responsible person. Deliver and pitch your topic in the best possible manner with this project schedule gantt chart. Use them to share invaluable insights on project schedule gantt chart and impress your audience. This template can be altered and modified as per your expectations. So, grab it now.

Pie Chart For Business And Finance PowerPoint Templates Ppt Backgrounds For Slides 0713
Our Pie Chart For Business And Finance PowerPoint Templates PPT Backgrounds For Slides allow you to do it with ease. Just like picking the low hanging fruit. Boil the ocean with your thoughts. Our Puzzles or jigsaws PowerPoint Templates will help create waves. Make some dough with our Marketing PowerPoint Templates. Your assets will rise significantly. Brilliant backdrops are the essence of our Pie Chart For Business And Finance PowerPoint Templates Ppt Backgrounds For Slides 0713. Guaranteed to impress your audience.
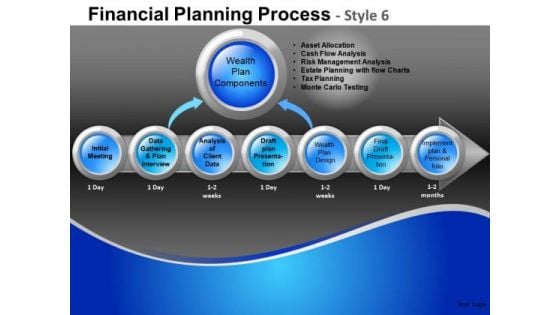
Components Financial Planning Process 6 PowerPoint Slides And Ppt Diagram Templates
Components Financial Planning Process 6 PowerPoint Slides And PPT Diagram Templates-These high quality powerpoint pre-designed slides and powerpoint templates have been carefully created by our professional team to help you impress your audience. All slides have been created and are 100% editable in powerpoint. Each and every property of any graphic - color, size, orientation, shading, outline etc. can be modified to help you build an effective powerpoint presentation. Any text can be entered at any point in the powerpoint template or slide. Simply DOWNLOAD, TYPE and PRESENT! Our Components Financial Planning Process 6 PowerPoint Slides And Ppt Diagram Templates are evidently advantageous. The balance will tilt in your favour.
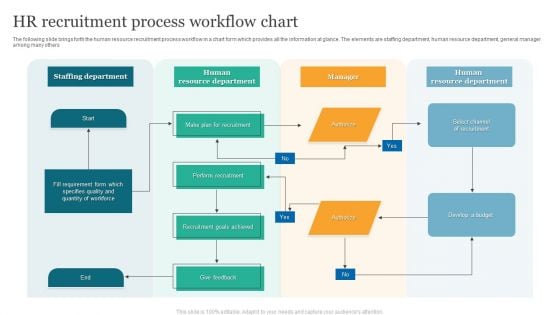
HR Recruitment Process Workflow Chart Microsoft PDF
The following slide brings forth the human resource recruitment process workflow in a chart form which provides all the information at glance. The elements are staffing department, human resource department, general manager among many others. Persuade your audience using this HR Recruitment Process Workflow Chart Microsoft PDF. This PPT design covers One stage, thus making it a great tool to use. It also caters to a variety of topics including Human Resource Department, Perform Recruitment, Recruitment Goals Achieved. Download this PPT design now to present a convincing pitch that not only emphasizes the topic but also showcases your presentation skills.
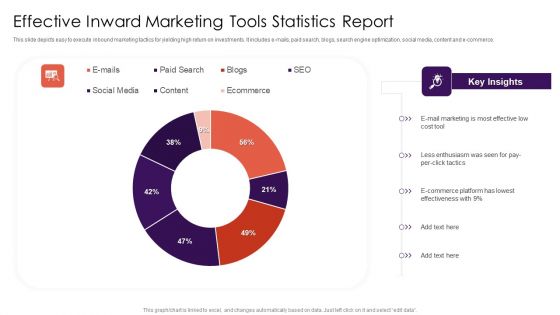
Effective Inward Marketing Tools Statistics Report Structure PDF
This slide depicts easy to execute inbound marketing tactics for yielding high return on investments. It includes e-mails, paid search, blogs, search engine optimization, social media, content and e-commerce.Showcasing this set of slides titled Effective Inward Marketing Tools Statistics Report Structure PDF. The topics addressed in these templates are E Commerce Platform, E Mail Marketing, Social Media. All the content presented in this PPT design is completely editable. Download it and make adjustments in color, background, font etc. as per your unique business setting.
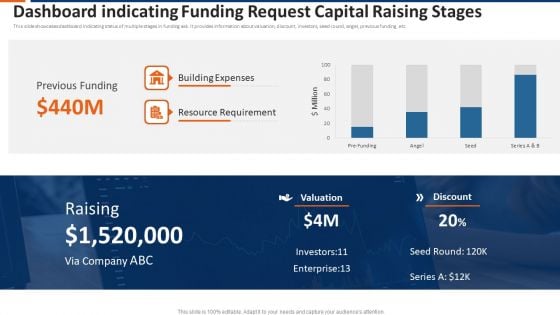
Dashboard Indicating Funding Request Capital Raising Stages Ppt Show Infographics PDF
This slide showcases dashboard indicating status of multiple stages in funding ask. It provides information about valuation, discount, investors, seed round, angel, previous funding, etc. Showcasing this set of slides titled dashboard indicating funding request capital raising stages ppt show infographics pdf. The topics addressed in these templates are previous funding, building expenses, resource requirement. All the content presented in this PPT design is completely editable. Download it and make adjustments in color, background, font etc. as per your unique business setting.
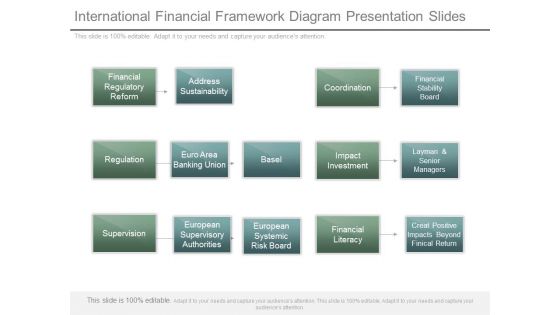
International Financial Framework Diagram Presentation Slides
This is a international financial framework diagram presentation slides. This is a five stage process. The stages in this process are financial regulatory reform, address sustainability, coordination, financial stability board, regulation, euro area banking union, basel, impact investment, layman and senior managers, supervision, european supervisory authorities, european systemic risk board, financial literacy, create positive impacts beyond finical return.
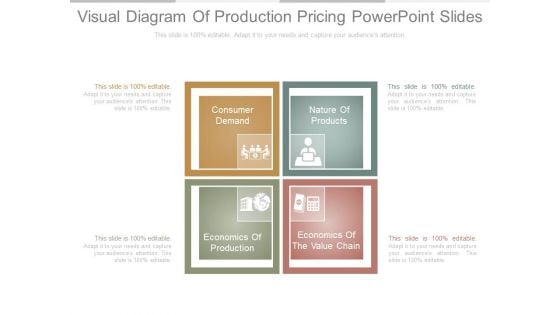
Visual Diagram Of Production Pricing Powerpoint Slides
This is a visual diagram of production pricing powerpoint slides. This is a four stage process. The stages in this process are consumer demand, nature of products, economics of the value chain, economics of production.
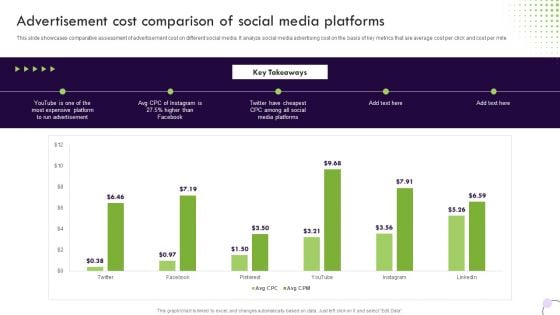
Performance Based Marketing Advertisement Cost Comparison Of Social Media Platforms Formats PDF
This slide showcases comparative assessment of advertisement cost on different social media. It analyze social media advertising cost on the basis of key metrics that are average cost per click and cost per mile. Slidegeeks is one of the best resources for PowerPoint templates. You can download easily and regulate Performance Based Marketing Advertisement Cost Comparison Of Social Media Platforms Formats PDF for your personal presentations from our wonderful collection. A few clicks is all it takes to discover and get the most relevant and appropriate templates. Use our Templates to add a unique zing and appeal to your presentation and meetings. All the slides are easy to edit and you can use them even for advertisement purposes.
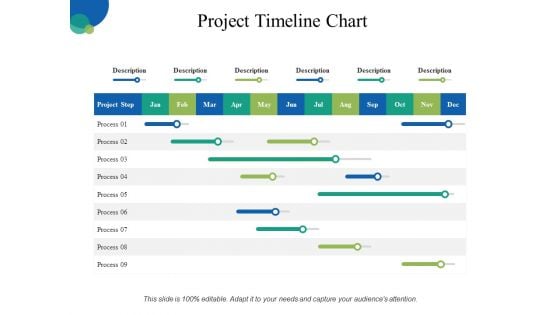
Project Timeline Chart Ppt PowerPoint Presentation Slides Graphics
This is a project timeline chart ppt powerpoint presentation slides graphics. This is a six stage process. The stages in this process are process, marketing, planning, strategy, timeline.
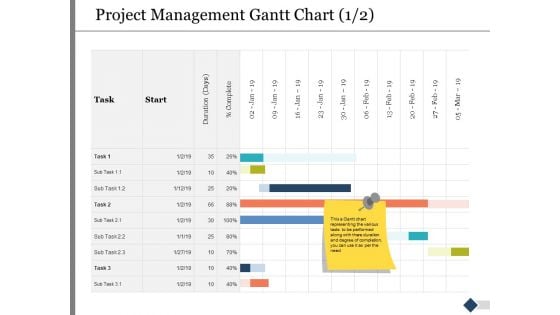
Project Management Gantt Chart Ppt PowerPoint Presentation Summary Images
This is a project management gantt chart ppt powerpoint presentation summary images. This is a two stage process. The stages in this process are marketing, business, management, compare.
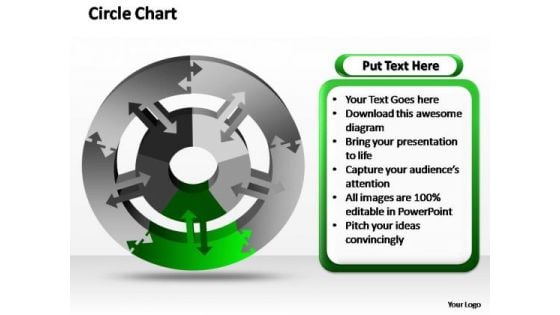
PowerPoint Design Marketing Circle Chart Ppt Backgrounds
PowerPoint Design Marketing Circle Chart PPT Backgrounds-The Circle of Life - a concept emmbedded in our minds and hence easy to comprehend. Life and Business is made up of processes comprising stages that flow from one to another. An excellent graphic to attract the attention of and understanding by your audience to improve earnings. Accelerate success with our PowerPoint Design Marketing Circle Chart Ppt Backgrounds. Download without worries with our money back guaranteee.
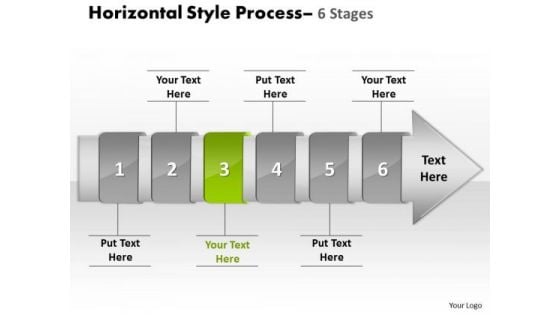
Ppt Theme Horizontal Flow Of 6 Stage Spider Diagram PowerPoint Template 4 Design
We present our PPT Theme horizontal flow of 6 stage spider diagram power point template 4 designs. Use our Arrows PowerPoint Templates because, our ready backdrops leave a lasting impression. Use our Shapes PowerPoint Templates because, it is in your DNA to analyses possible causes to the minutest detail. Use our Finance PowerPoint Templates because, Leadership Template: - Show them the way, be Captain of the ship and lead them to new shores. Use our Business PowerPoint Templates because, Marketing Strategy Business Template:- Maximizing sales of your product is the intended destination. Use our Process and Flows PowerPoint Templates because, Now use this slide to bullet point your views. Use these PowerPoint slides for presentations relating to accent, advertisement, arrow, badge, banner, business, button, collection, color, decoration, design, direction, element, financial, flow, graph, horizontal, instruction, isolated, label, manual, message, process, sale, set, shape, steps, symbol, template. The prominent colors used in the PowerPoint template are Green, Gray, and Black Our Ppt Theme Horizontal Flow Of 6 Stage Spider Diagram PowerPoint Template 4 Design help you go against the clock. They provide the basic aids.
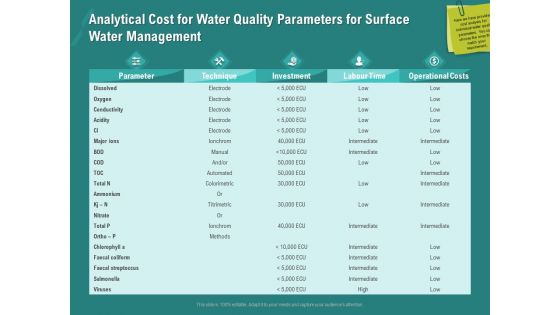
Ocean Water Supervision Analytical Cost For Water Quality Parameters For Surface Water Management Diagrams PDF
Deliver and pitch your topic in the best possible manner with this ocean water supervision analytical cost for water quality parameters for surface water management diagrams pdf. Use them to share invaluable insights on parameter, technique, investment, operational costs and impress your audience. This template can be altered and modified as per your expectations. So, grab it now.
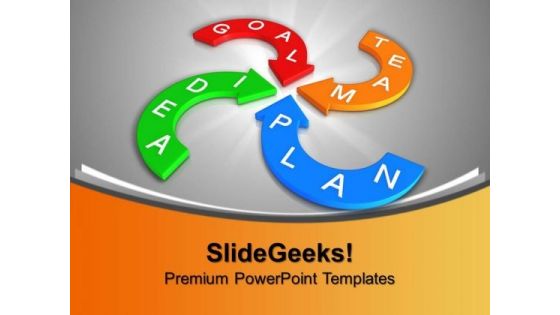
Marketing Team Objectives Business PowerPoint Templates And PowerPoint Themes 0912
Marketing Team Objectives Business PowerPoint Templates And PowerPoint Themes 0912-Microsoft Powerpoint Templates and Background with business marketing diagrams-Business marketing diagrams, arrows, shapes, marketing, business, finance Our Marketing Team Objectives Business PowerPoint Templates And PowerPoint Themes 0912 will be a crucial element. Field them with your thoughts and enjoy the effort.
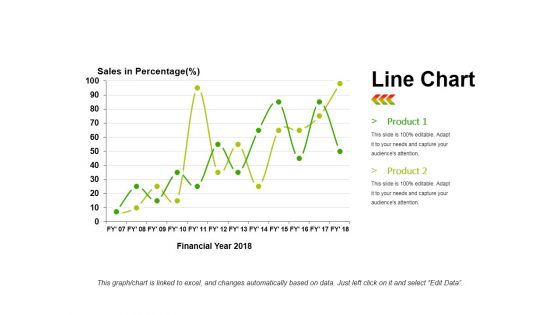
Line Chart Ppt PowerPoint Presentation Infographics Infographics
This is a line chart ppt powerpoint presentation infographics infographics. This is a two stage process. The stages in this process are product, sales in percentage, financial year, line chart, finance.

Scatter Chart Ppt PowerPoint Presentation Model Influencers
This is a scatter chart ppt powerpoint presentation model influencers. This is a one stage process. The stages in this process are scatter chart, analysis, finance, marketing, business, growth.
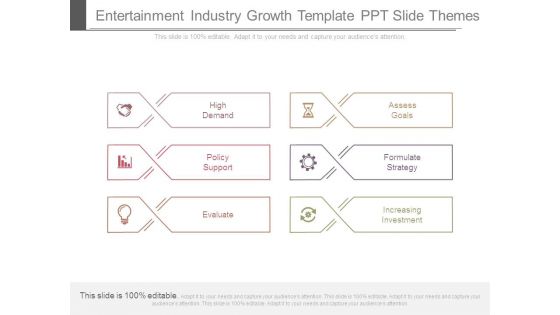
Entertainment Industry Growth Template Ppt Slide Themes
This is a entertainment industry growth template ppt slide themes. This is a six stage process. The stages in this process are high demand, policy support, evaluate, assess goals, formulate strategy, increasing investment.
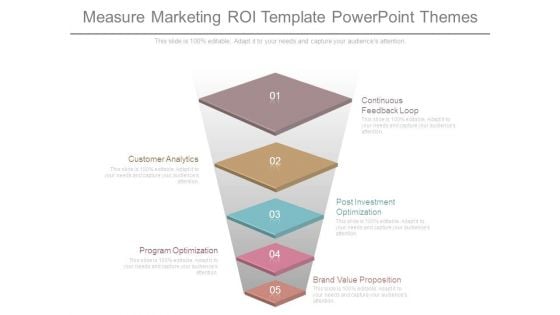
Measure Marketing Roi Template Powerpoint Themes
This is a measure marketing roi template powerpoint themes. This is a five stage process. The stages in this process are continuous feedback loop, post investment optimization, brand value proposition, customer analytics, program optimization.
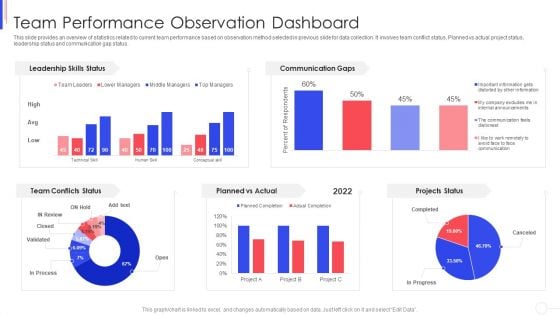
Strategy To Improve Team Proficiency Team Performance Observation Dashboard Diagrams PDF
This slide provides an overview of statistics related to current team performance based on observation method selected in previous slide for data collection. It involves team conflict status, Planned vs actual project status, leadership status and communication gap status. Deliver an awe inspiring pitch with this creative proficiency team performance observation dashboard diagrams pdf bundle. Topics like team performance observation dashboard can be discussed with this completely editable template. It is available for immediate download depending on the needs and requirements of the user.

Comprehensive Market Research Guide Growth Opportunities In Market Research Industry Diagrams PDF
The following slide outlines market size of global market research industry. Information covered in this slide is related to projected revenue from 2022 to 2030 and compound annual growth rate CAGR. Make sure to capture your audiences attention in your business displays with our gratis customizable Comprehensive Market Research Guide Growth Opportunities In Market Research Industry Diagrams PDF. These are great for business strategies, office conferences, capital raising or task suggestions. If you desire to acquire more customers for your tech business and ensure they stay satisfied, create your own sales presentation with these plain slides.
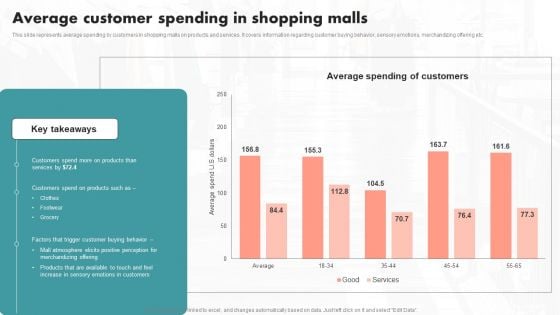
Average Customer Spending In Shopping Malls Ppt PowerPoint Presentation Diagram Images PDF
This slide represents average spending by customers in shopping malls on products and services. It covers information regarding customer buying behavior, sensory emotions, merchandizing offering etc. qIf your project calls for a presentation, then Slidegeeks is your go to partner because we have professionally designed, easy to edit templates that are perfect for any presentation. After downloading, you can easily edit Average Customer Spending In Shopping Malls Ppt PowerPoint Presentation Diagram Images PDF and make the changes accordingly. You can rearrange slides or fill them with different images. Check out all the handy templates
Business Diagram Finance PowerPoint Templates And PowerPoint Backgrounds 0511
Microsoft PowerPoint Template and Background with business diagram Assist the audience to comprehend with our Business Diagram Finance PowerPoint Templates And PowerPoint Backgrounds 0511. They will always be in your debt.

Value Production Flow Chart Presentation Powerpoint
This is a value production flow chart presentation powerpoint. This is a three stage process. The stages in this process are value production, cost, revenue, profit.
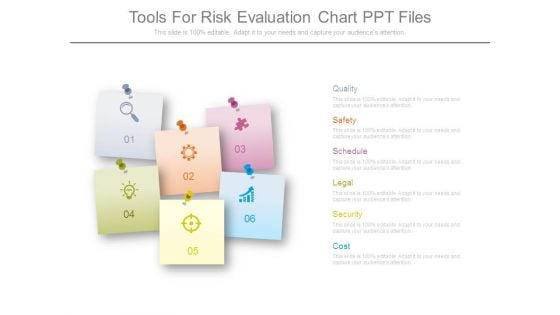
Tools For Risk Evaluation Chart Ppt Files
This is a tools for risk evaluation chart ppt files. This is a six stage process. The stages in this process are quality, safety, schedule, legal, security, cost.
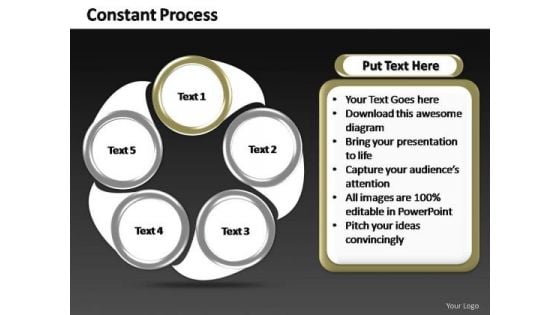
PowerPoint Slide Chart Constant Process Ppt Design
PowerPoint Slide Chart Constant Process PPT Design-PowerPoint Slide Designs Teamwork Round Moving PPT Slide Designs-Explore the various directions and layers existing in your in your plans and processes. Unravel the desired and essential elements of your overall strategy. Explain the relevance of the different layers and stages and directions in getting down to your core competence, ability and desired result.-PowerPoint Slide Chart Constant Process PPT Design Our PowerPoint Slide Chart Constant Process Ppt Design are aces at conflict control. Convert divergence into convergence.
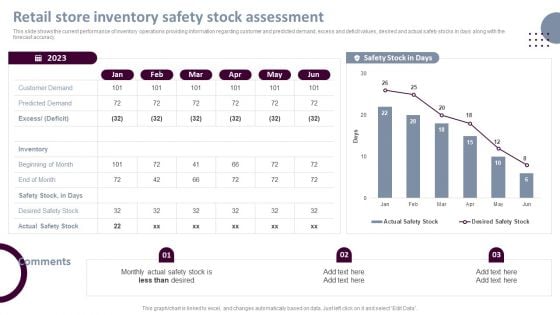
Retail Store Operations Retail Store Inventory Safety Stock Assessment Background PDF
This slide shows the current performance of inventory operations providing information regarding customer and predicted demand, excess and deficit values, desired and actual safety stocks in days along with the forecast accuracy. If you are looking for a format to display your unique thoughts, then the professionally designed Retail Store Operations Retail Store Inventory Safety Stock Assessment Background PDF is the one for you. You can use it as a Google Slides template or a PowerPoint template. Incorporate impressive visuals, symbols, images, and other charts. Modify or reorganize the text boxes as you desire. Experiment with shade schemes and font pairings. Alter, share or cooperate with other people on your work. Download Retail Store Operations Retail Store Inventory Safety Stock Assessment Background PDF and find out how to give a successful presentation. Present a perfect display to your team and make your presentation unforgettable.
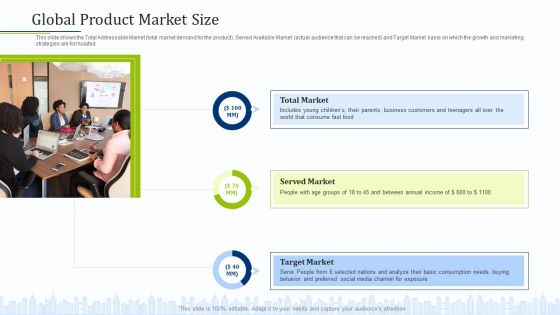
Pitch Deck To Draw External Capital From Commercial Banking Institution Global Product Market Size Background PDF
This slide shows the Total Addressable Market total market demand for the product Served Available Market actual audience that can be reached and Target Market basis on which the growth and marketing strategies are formulated.Deliver an awe-inspiring pitch with this creative pitch deck to draw external capital from commercial banking institution global product market size background pdf bundle. Topics like total market, served market, target market can be discussed with this completely editable template. It is available for immediate download depending on the needs and requirements of the user.
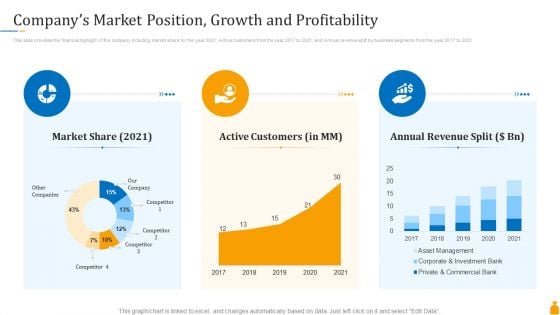
Financial Banking PPT Companys Market Position Growth And Profitability Portrait PDF
This slide provides the financial highlight of the company including market share for the year 2021, Active customers from the year 2017 to 2021, and Annual revenue split by business segments from the year 2017 to 2021. Deliver an awe-inspiring pitch with this creative financial banking ppt companys market position growth and profitability portrait pdf bundle. Topics like market share, active customers, annual revenue split can be discussed with this completely editable template. It is available for immediate download depending on the needs and requirements of the user.
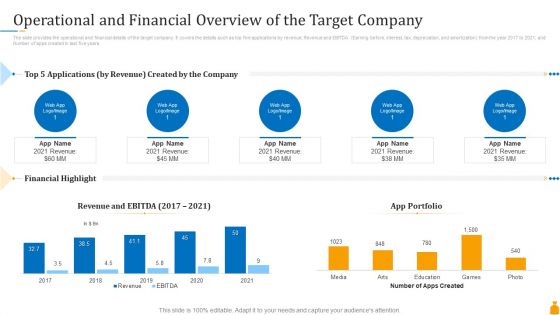
Financial Banking PPT Operational And Financial Overview Of The Target Company Pictures PDF
The slide provides the operational and financial details of the target company. It covers the details such as top five applications by revenue, Revenue and EBITDA Earning before, interest, tax, depreciation, and amortization from the year 2017 to 2021, and Number of apps created in last five years. Deliver and pitch your topic in the best possible manner with this financial banking ppt operational and financial overview of the target company pictures pdf. Use them to share invaluable insights on portfolio, revenue, operational and financial details and impress your audience. This template can be altered and modified as per your expectations. So, grab it now.
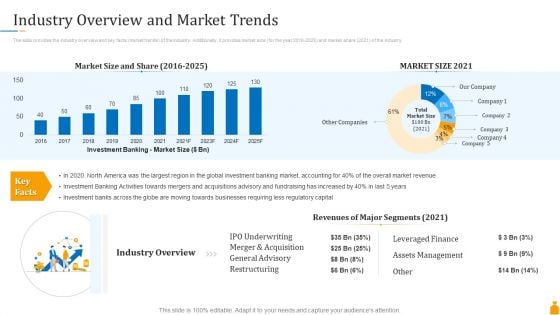
Financial Banking PPT Industry Overview And Market Trends Ppt File Layout Ideas PDF
The slide provides the industry overview and key facts market trends of the industry. Additionally, it provides market size for the year 2016-2025 and market share 2021 of the industry. Deliver an awe-inspiring pitch with this creative financial banking ppt industry overview and market trends ppt file layout ideas pdf bundle. Topics like industry overview, key facts, revenues, segments, market size can be discussed with this completely editable template. It is available for immediate download depending on the needs and requirements of the user.
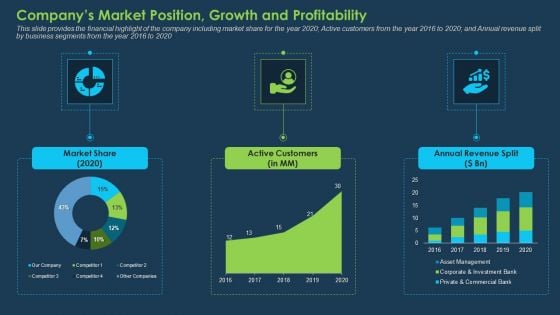
Commercial Banking Template Collection Companys Market Position Growth And Profitability Inspiration PDF
This slide provides the financial highlight of the company including market share for the year 2020 Active customers from the year 2016 to 2020 and Annual revenue split by business segments from the year 2016 to 2020. Deliver an awe-inspiring pitch with this creative commercial banking template collection companys market position growth and profitability inspiration pdf bundle. Topics like market share, active customers, annual revenue split can be discussed with this completely editable template. It is available for immediate download depending on the needs and requirements of the user.
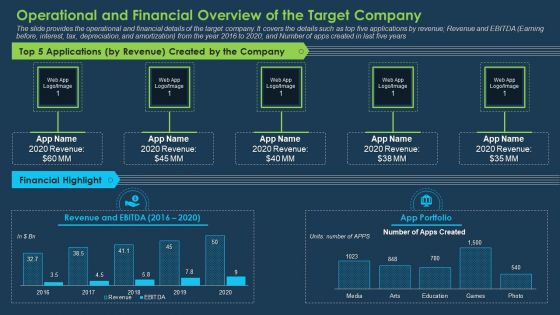
Commercial Banking Template Collection Operational And Financial Overview Of The Target Company Inspiration PDF
The slide provides the operational and financial details of the target company. It covers the details such as top five applications by revenue Revenue and EBITDA Earning before, interest, tax, depreciation, and amortization from the year 2016 to 2020 and Number of apps created in last five years. Deliver an awe-inspiring pitch with this creative commercial banking template collection operational and financial overview of the target company inspiration pdf bundle. Topics like financial highlight, revenue and ebitda, app portfolio can be discussed with this completely editable template. It is available for immediate download depending on the needs and requirements of the user.
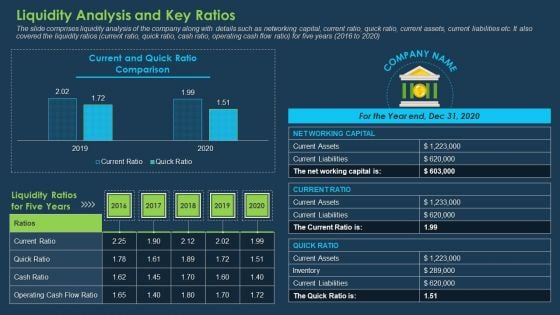
Commercial Banking Template Collection Liquidity Analysis And Key Ratios Ppt Show Gridlines PDF
The slide comprises liquidity analysis of the company along with details such as networking capital, current ratio, quick ratio, current assets, current liabilities etc. It also covered the liquidity ratios current ratio, quick ratio, cash ratio, operating cash flow ratio for five years 2016 to 2020. Deliver an awe-inspiring pitch with this creative commercial banking template collection liquidity analysis and key ratios ppt show gridlines pdf bundle. Topics like inventory, operating cash flow ratio, net working capital can be discussed with this completely editable template. It is available for immediate download depending on the needs and requirements of the user.

 Home
Home