Budget Icons
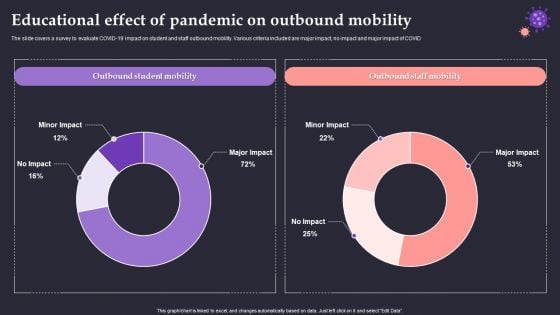
Educational Effect Of Pandemic On Outbound Mobility Elements PDF
The slide covers a survey to evaluate COVID-19 impact on student and staff outbound mobility. Various criteria included are major impact, no impact and major impact of COVID. Showcasing this set of slides titled Educational Effect Of Pandemic On Outbound Mobility Elements PDF. The topics addressed in these templates are Outbound Student Mobility, Outbound Staff Mobility, Minor Impact. All the content presented in this PPT design is completely editable. Download it and make adjustments in color, background, font etc. as per your unique business setting.
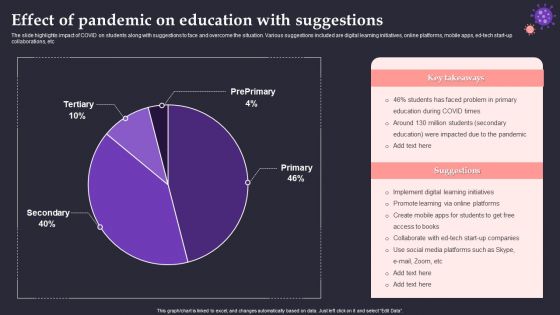
Effect Of Pandemic On Education With Suggestions Formats PDF
The slide highlights impact of COVID on students along with suggestions to face and overcome the situation. Various suggestions included are digital learning initiatives, online platforms, mobile apps, ed-tech start-up collaborations, etc. Showcasing this set of slides titled Effect Of Pandemic On Education With Suggestions Formats PDF. The topics addressed in these templates are Problem Primary, COVID Times, Digital Learning Initiatives. All the content presented in this PPT design is completely editable. Download it and make adjustments in color, background, font etc. as per your unique business setting.
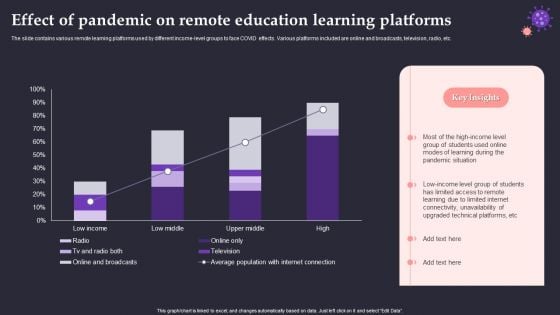
Effect Of Pandemic On Remote Education Learning Platforms Sample PDF
The slide contains various remote learning platforms used by different income-level groups to face COVID effects. Various platforms included are online and broadcasts, television, radio, etc. Pitch your topic with ease and precision using this Effect Of Pandemic On Remote Education Learning Platforms Sample PDF. This layout presents information on Pandemic Situation, High Income Level, Technical Platforms. It is also available for immediate download and adjustment. So, changes can be made in the color, design, graphics or any other component to create a unique layout.

Online Platforms To Overcome Effect Of Pandemic On Educational Impacts Portrait PDF
The slide highlights a survey of educational institutions that adopted various online platforms to combat COVID-19 impacts . Various online platforms included are e-courses, e-learning programs, blended modes of learning, etc. Showcasing this set of slides titled Online Platforms To Overcome Effect Of Pandemic On Educational Impacts Portrait PDF. The topics addressed in these templates are Educational Institutions, Offered Online Courses, Mode Of Teaching. All the content presented in this PPT design is completely editable. Download it and make adjustments in color, background, font etc. as per your unique business setting.
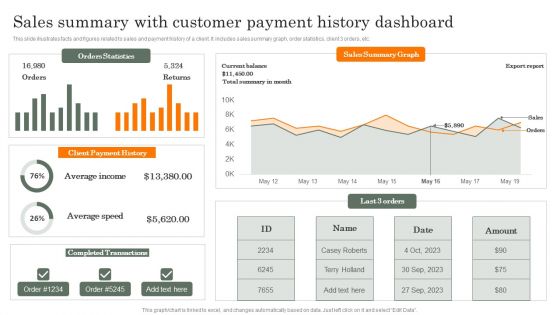
Sales Summary With Customer Payment History Dashboard Guidelines PDF
This slide illustrates facts and figures related to sales and payment history of a client. It includes sales summary graph, order statistics, client 3 orders, etc. Showcasing this set of slides titled Sales Summary With Customer Payment History Dashboard Guidelines PDF. The topics addressed in these templates are Average Income, Average Speed, Completed Transactions. All the content presented in this PPT design is completely editable. Download it and make adjustments in color, background, font etc. as per your unique business setting.
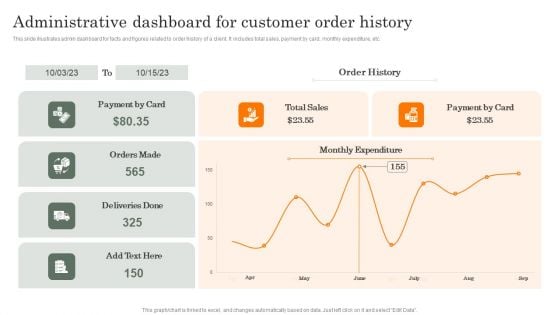
Administrative Dashboard For Customer Order History Formats PDF
This slide illustrates admin dashboard for facts and figures related to order history of a client. It includes total sales, payment by card, monthly expenditure, etc. Showcasing this set of slides titled Administrative Dashboard For Customer Order History Formats PDF. The topics addressed in these templates are Administrative, Dashboard For Customer, Order History. All the content presented in this PPT design is completely editable. Download it and make adjustments in color, background, font etc. as per your unique business setting.
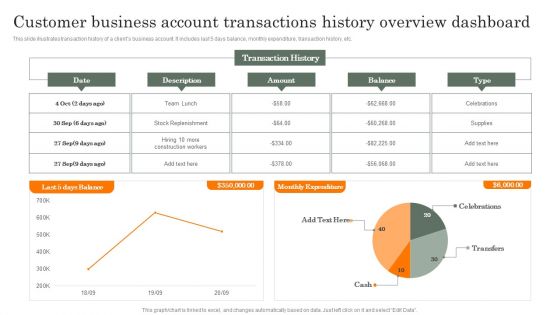
Customer Business Account Transactions History Overview Dashboard Guidelines PDF
This slide illustrates transaction history of a clients business account. It includes last 5 days balance, monthly expenditure, transaction history, etc. Showcasing this set of slides titled Customer Business Account Transactions History Overview Dashboard Guidelines PDF. The topics addressed in these templates are Customer Business, Account Transactions, History Overview. All the content presented in this PPT design is completely editable. Download it and make adjustments in color, background, font etc. as per your unique business setting.
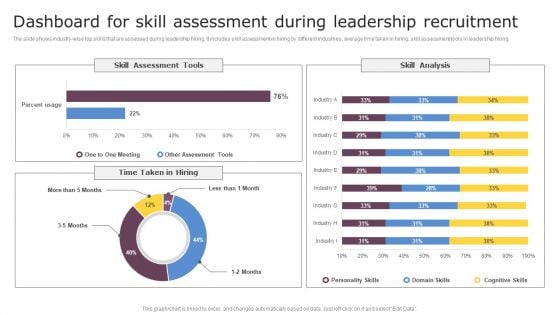
Dashboard For Skill Assessment During Leadership Recruitment Infographics PDF
The slide shows industry wise top skills that are assessed during leadership hiring. It includes skill assessment in hiring by different industries, average time taken in hiring, skill assessment tools in leadership hiring. Showcasing this set of slides titled Dashboard For Skill Assessment During Leadership Recruitment Infographics PDF. The topics addressed in these templates are Skill Assessment Tools, Skill Analysis. All the content presented in this PPT design is completely editable. Download it and make adjustments in color, background, font etc. as per your unique business setting.
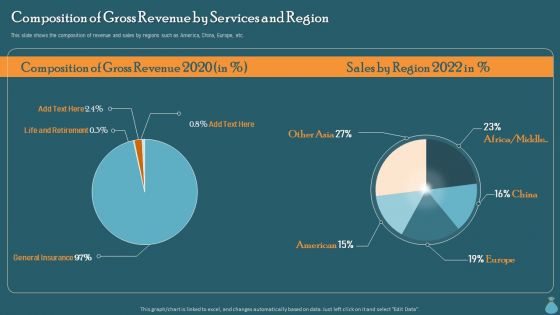
Financial Data Revelation To Varied Stakeholders Composition Of Gross Revenue By Services And Region Slides PDF
This slide shows the composition of revenue and sales by regions such as America, China, Europe, etc. Create an editable Financial Data Revelation To Varied Stakeholders Composition Of Gross Revenue By Services And Region Slides PDF that communicates your idea and engages your audience. Whether you are presenting a business or an educational presentation, pre designed presentation templates help save time. Financial Data Revelation To Varied Stakeholders Composition Of Gross Revenue By Services And Region Slides PDF is highly customizable and very easy to edit, covering many different styles from creative to business presentations. Slidegeeks has creative team members who have crafted amazing templates. So, go and get them without any delay.
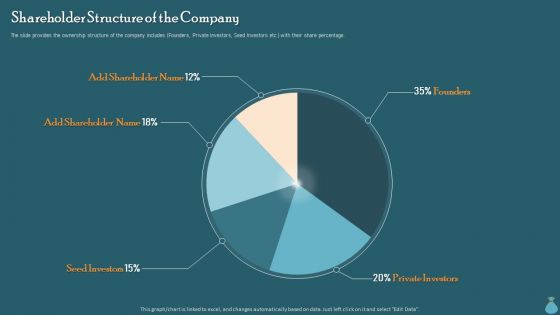
Financial Data Revelation To Varied Stakeholders Shareholder Structure Of The Company Microsoft PDF
The slide provides the ownership structure of the company includes Founders, Private Investors, Seed Investors etc. with their share percentage. Slidegeeks is here to make your presentations a breeze with Financial Data Revelation To Varied Stakeholders Shareholder Structure Of The Company Microsoft PDF With our easy to use and customizable templates, you can focus on delivering your ideas rather than worrying about formatting. With a variety of designs to choose from, you are sure to find one that suits your needs. And with animations and unique photos, illustrations, and fonts, you can make your presentation pop. So whether you are giving a sales pitch or presenting to the board, make sure to check out Slidegeeks first.
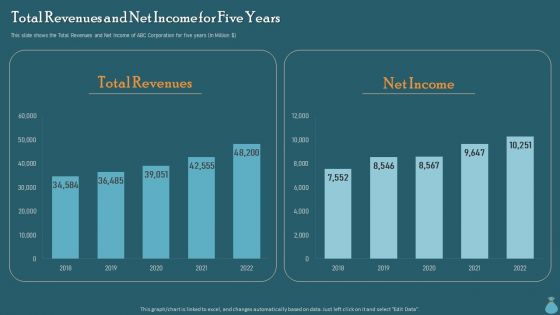
Financial Data Revelation To Varied Stakeholders Total Revenues And Net Income For Five Years Brochure PDF
This slide shows the Total Revenues and Net Income of ABC Corporation for five years In Million dollar Do you have an important presentation coming up Are you looking for something that will make your presentation stand out from the rest Look no further than Financial Data Revelation To Varied Stakeholders Total Revenues And Net Income For Five Years Brochure PDF. With our professional designs, you can trust that your presentation will pop and make delivering it a smooth process. And with Slidegeeks, you can trust that your presentation will be unique and memorable. So why wait Grab Financial Data Revelation To Varied Stakeholders Total Revenues And Net Income For Five Years Brochure PDF today and make your presentation stand out from the rest.
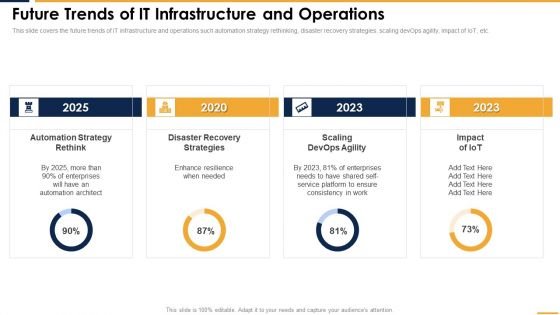
Future Trends Of IT Infrastructure And Operations Professional PDF
This slide covers the future trends of IT infrastructure and operations such automation strategy rethinking, disaster recovery strategies, scaling devOps agility, impact of IoT, etc. Crafting an eye catching presentation has never been more straightforward. Let your presentation shine with this tasteful yet straightforward Future Trends Of IT Infrastructure And Operations Professional PDF template. It offers a minimalistic and classy look that is great for making a statement. The colors have been employed intelligently to add a bit of playfulness while still remaining professional. Construct the ideal Future Trends Of IT Infrastructure And Operations Professional PDF that effortlessly grabs the attention of your audience Begin now and be certain to wow your customers.

Infrastructure Monitoring Dashboard Structure PDF
This slide covers the dashboard which can be used to monitor the server count, geo activity, processor, memory space, network security, etc. Formulating a presentation can take up a lot of effort and time, so the content and message should always be the primary focus. The visuals of the PowerPoint can enhance the presenters message, so our Infrastructure Monitoring Dashboard Structure PDF was created to help save time. Instead of worrying about the design, the presenter can concentrate on the message while our designers work on creating the ideal templates for whatever situation is needed. Slidegeeks has experts for everything from amazing designs to valuable content, we have put everything into Infrastructure Monitoring Dashboard Structure PDF.
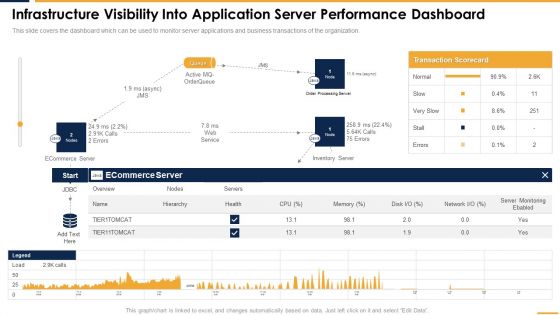
Infrastructure Visibility Into Application Server Performance Dashboard Structure PDF
This slide covers the dashboard which can be used to monitor server applications and business transactions of the organization. Coming up with a presentation necessitates that the majority of the effort goes into the content and the message you intend to convey. The visuals of a PowerPoint presentation can only be effective if it supplements and supports the story that is being told. Keeping this in mind our experts created Infrastructure Visibility Into Application Server Performance Dashboard Structure PDF to reduce the time that goes into designing the presentation. This way, you can concentrate on the message while our designers take care of providing you with the right template for the situation.
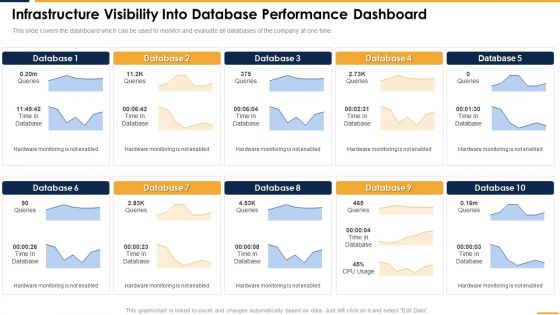
Infrastructure Visibility Into Database Performance Dashboard Rules PDF
This slide covers the dashboard which can be used to monitor and evaluate all databases of the company at one time. This modern and well arranged Infrastructure Visibility Into Database Performance Dashboard Rules PDF provides lots of creative possibilities. It is very simple to customize and edit with the Powerpoint Software. Just drag and drop your pictures into the shapes. All facets of this template can be edited with Powerpoint no extra software is necessary. Add your own material, put your images in the places assigned for them, adjust the colors, and then you can show your slides to the world, with an animated slide included.
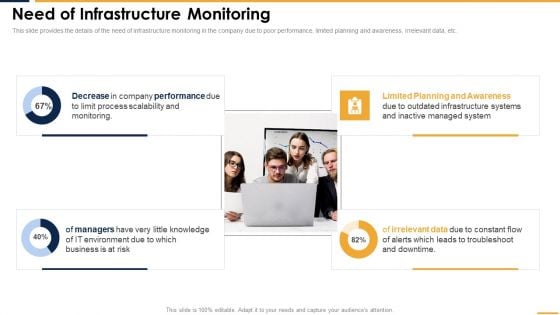
Need Of Infrastructure Monitoring Mockup PDF
This slide provides the details of the need of infrastructure monitoring in the company due to poor performance, limited planning and awareness, irrelevant data, etc. This Need Of Infrastructure Monitoring Mockup PDF is perfect for any presentation, be it in front of clients or colleagues. It is a versatile and stylish solution for organizing your meetings. The Need Of Infrastructure Monitoring Mockup PDF features a modern design for your presentation meetings. The adjustable and customizable slides provide unlimited possibilities for acing up your presentation. Slidegeeks has done all the homework before launching the product for you. So, do not wait, grab the presentation templates today.

Time Spent On Monitoring IT Infrastructure Professional PDF
This slide covers the time spend in monitoring the IT infrastructure such as extracting and analyzing logs, interpreting reports and alerts, managing tools and agents, etc. Explore a selection of the finest Time Spent On Monitoring IT Infrastructure Professional PDF here. With a plethora of professionally designed and pre made slide templates, you can quickly and easily find the right one for your upcoming presentation. You can use our Time Spent On Monitoring IT Infrastructure Professional PDF to effectively convey your message to a wider audience. Slidegeeks has done a lot of research before preparing these presentation templates. The content can be personalized and the slides are highly editable. Grab templates today from Slidegeeks.
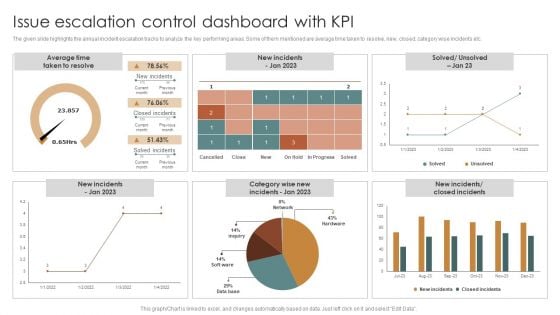
Issue Escalation Control Dashboard With KPI Clipart PDF
The given slide highlights the annual incident escalation tracks to analyze the key performing areas. Some of them mentioned are average time taken to resolve, new, closed, category wise incidents etc. Showcasing this set of slides titled Issue Escalation Control Dashboard With KPI Clipart PDF. The topics addressed in these templates are Average Time, Taken To Resolve. All the content presented in this PPT design is completely editable. Download it and make adjustments in color, background, font etc. as per your unique business setting.
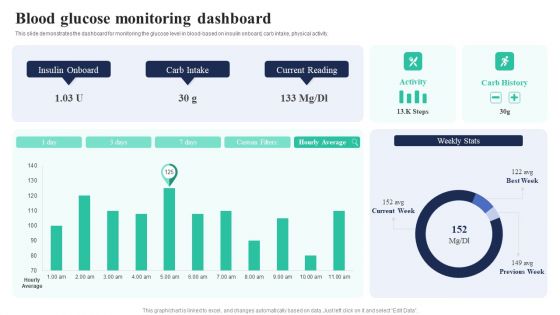
Biochips Use Cases Blood Glucose Monitoring Dashboard Introduction PDF
This slide demonstrates the dashboard for monitoring the glucose level in blood-based on insulin onboard, carb intake, physical activity. Slidegeeks has constructed Biochips Use Cases Blood Glucose Monitoring Dashboard Introduction PDF after conducting extensive research and examination. These presentation templates are constantly being generated and modified based on user preferences and critiques from editors. Here, you will find the most attractive templates for a range of purposes while taking into account ratings and remarks from users regarding the content. This is an excellent jumping-off point to explore our content and will give new users an insight into our top-notch PowerPoint Templates.
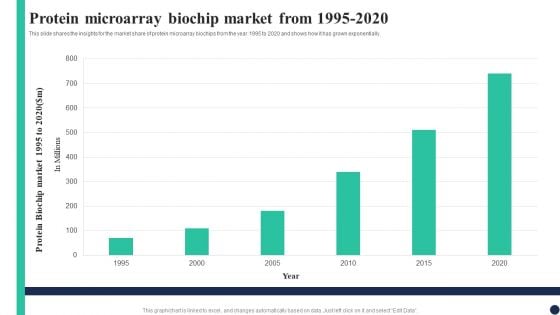
Biochips Use Cases Protein Microarray Biochip Market From 1995 To 2020 Pictures PDF
This slide shares the insights for the market share of protein microarray biochips from the year 1995 to 2020 and shows how it has grown exponentially. Here you can discover an assortment of the finest PowerPoint and Google Slides templates. With these templates, you can create presentations for a variety of purposes while simultaneously providing your audience with an eye-catching visual experience. Download Biochips Use Cases Protein Microarray Biochip Market From 1995 To 2020 Pictures PDF to deliver an impeccable presentation. These templates will make your job of preparing presentations much quicker, yet still, maintain a high level of quality. Slidegeeks has experienced researchers who prepare these templates and write high-quality content for you. Later on, you can personalize the content by editing the Biochips Use Cases Protein Microarray Biochip Market From 1995 To 2020 Pictures PDF.
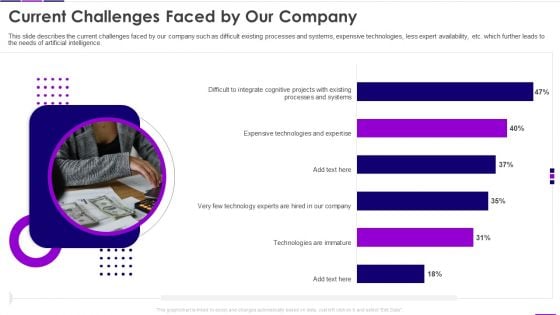
Transforming Business With AI Current Challenges Faced By Our Company Pictures PDF
This slide describes the current challenges faced by our company such as difficult existing processes and systems, expensive technologies, less expert availability, etc. which further leads to the needs of artificial intelligence. There are so many reasons you need a Transforming Business With AI Current Challenges Faced By Our Company Pictures PDF. The first reason is you can not spend time making everything from scratch, Thus, Slidegeeks has made presentation templates for you too. You can easily download these templates from our website easily.
Transforming Business With AI Digital Media Tracking Dashboard Summary PDF
This slide covers the digital marketing dashboard along with the lead breakdown, google analytics traffic, and social media channels. Do you have to make sure that everyone on your team knows about any specific topic I yes, then you should give Transforming Business With AI Digital Media Tracking Dashboard Summary PDF a try. Our experts have put a lot of knowledge and effort into creating this impeccable Transforming Business With AI Digital Media Tracking Dashboard Summary PDF. You can use this template for your upcoming presentations, as the slides are perfect to represent even the tiniest detail. You can download these templates from the Slidegeeks website and these are easy to edit. So grab these today.
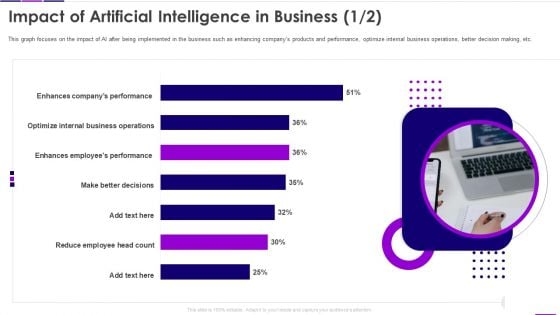
Transforming Business With AI Impact Of Artificial Intelligence In Business Rules PDF
This graph focuses on the impact of AI after being implemented in the business such as enhancing companys products and performance, optimize internal business operations, better decision making, etc. From laying roadmaps to briefing everything in detail, our templates are perfect for you. You can set the stage with your presentation slides. All you have to do is download these easy to edit and customizable templates. Transforming Business With AI Impact Of Artificial Intelligence In Business Rules PDF will help you deliver an outstanding performance that everyone would remember and praise you for. Do download this presentation today.
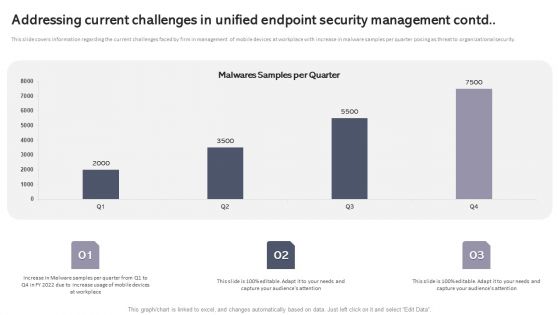
Addressing Current Challenges In Unified Endpoint Security Management Contd Introduction PDF
This slide covers information regarding the current challenges faced by firm in management of mobile devices at workplace with increase in malware samples per quarter posing as threat to organizational security. Here you can discover an assortment of the finest PowerPoint and Google Slides templates. With these templates, you can create presentations for a variety of purposes while simultaneously providing your audience with an eye catching visual experience. Download Addressing Current Challenges In Unified Endpoint Security Management Contd Introduction PDF to deliver an impeccable presentation. These templates will make your job of preparing presentations much quicker, yet still, maintain a high level of quality. Slidegeeks has experienced researchers who prepare these templates and write high quality content for you. Later on, you can personalize the content by editing the Addressing Current Challenges In Unified Endpoint Security Management Contd Introduction PDF.
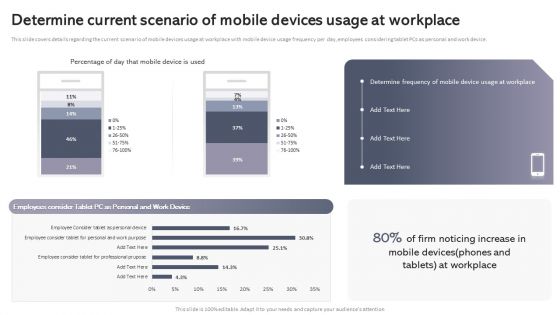
Workplace Portable Device Monitoring And Administration Determine Current Scenario Of Mobile Devices Usage At Workplace Information PDF
This slide covers details regarding the current scenario of mobile devices usage at workplace with mobile device usage frequency per day, employees considering tablet PCs as personal and work device. This Workplace Portable Device Monitoring And Administration Determine Current Scenario Of Mobile Devices Usage At Workplace Information PDF from Slidegeeks makes it easy to present information on your topic with precision. It provides customization options, so you can make changes to the colors, design, graphics, or any other component to create a unique layout. It is also available for immediate download, so you can begin using it right away. Slidegeeks has done good research to ensure that you have everything you need to make your presentation stand out. Make a name out there for a brilliant performance.
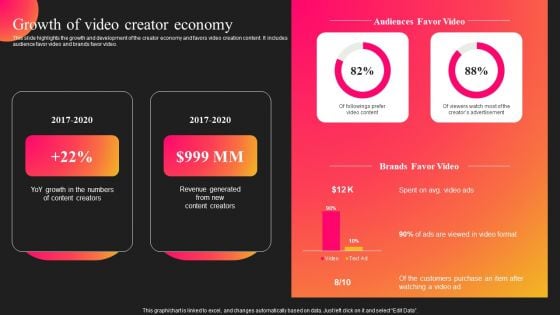
Curastory Editing Platform Pitch Deck Growth Of Video Creator Economy Template PDF
This slide highlights the growth and development of the creator economy and favors video creation content. It includes audience favor video and brands favor video. Coming up with a presentation necessitates that the majority of the effort goes into the content and the message you intend to convey. The visuals of a PowerPoint presentation can only be effective if it supplements and supports the story that is being told. Keeping this in mind our experts created Curastory Editing Platform Pitch Deck Growth Of Video Creator Economy Template PDF to reduce the time that goes into designing the presentation. This way, you can concentrate on the message while our designers take care of providing you with the right template for the situation.
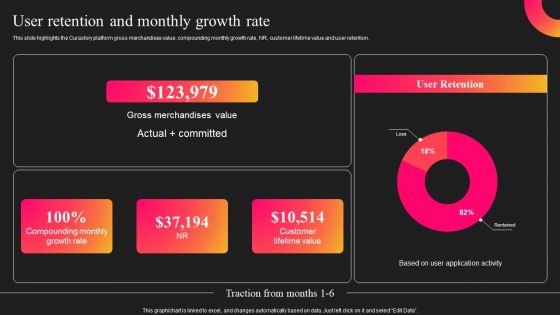
Curastory Editing Platform Pitch Deck User Retention And Monthly Growth Rate Template PDF
This slide highlights the Curastory platform gross merchandises value, compounding monthly growth rate, NR, customer lifetime value and user retention. Explore a selection of the finest Curastory Editing Platform Pitch Deck User Retention And Monthly Growth Rate Template PDF here. With a plethora of professionally designed and pre made slide templates, you can quickly and easily find the right one for your upcoming presentation. You can use our Curastory Editing Platform Pitch Deck User Retention And Monthly Growth Rate Template PDF to effectively convey your message to a wider audience. Slidegeeks has done a lot of research before preparing these presentation templates. The content can be personalized and the slides are highly editable. Grab templates today from Slidegeeks.
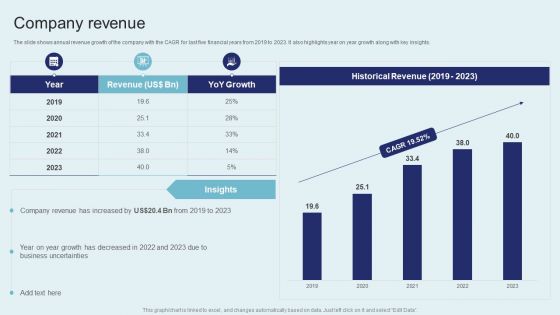
IT Firm Financial Statement Company Revenue Demonstration PDF
The slide shows annual revenue growth of the company with the CAGR for last five financial years from 2019 to 2023. It also highlights year on year growth along with key insights. Find a pre designed and impeccable IT Firm Financial Statement Company Revenue Demonstration PDF. The templates can ace your presentation without additional effort. You can download these easy to edit presentation templates to make your presentation stand out from others. So, what are you waiting for Download the template from Slidegeeks today and give a unique touch to your presentation.
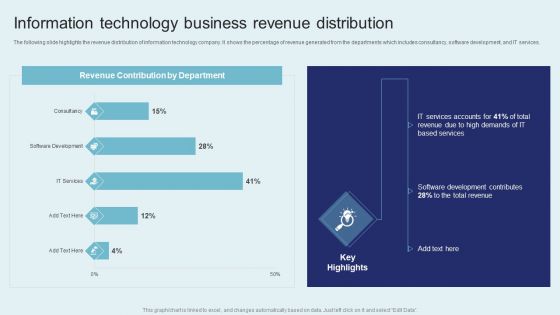
IT Firm Financial Statement Information Technology Business Revenue Distribution Portrait PDF
The following slide highlights the revenue distribution of information technology company. It shows the percentage of revenue generated from the departments which includes consultancy, software development, and IT services. Create an editable IT Firm Financial Statement Information Technology Business Revenue Distribution Portrait PDF that communicates your idea and engages your audience. Whether you are presenting a business or an educational presentation, pre designed presentation templates help save time. IT Firm Financial Statement Information Technology Business Revenue Distribution Portrait PDF is highly customizable and very easy to edit, covering many different styles from creative to business presentations. Slidegeeks has creative team members who have crafted amazing templates. So, go and get them without any delay.
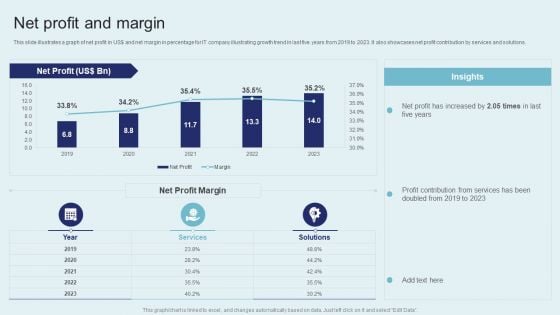
IT Firm Financial Statement Net Profit And Margin Slides PDF
This slide illustrates a graph of net profit in US dollar and net margin in percentage for IT company illustrating growth trend in last five years from 2019 to 2023. It also showcases net profit contribution by services and solutions. Do you have to make sure that everyone on your team knows about any specific topic I yes, then you should give IT Firm Financial Statement Net Profit And Margin Slides PDF a try. Our experts have put a lot of knowledge and effort into creating this impeccable IT Firm Financial Statement Net Profit And Margin Slides PDF. You can use this template for your upcoming presentations, as the slides are perfect to represent even the tiniest detail. You can download these templates from the Slidegeeks website and these are easy to edit. So grab these today.
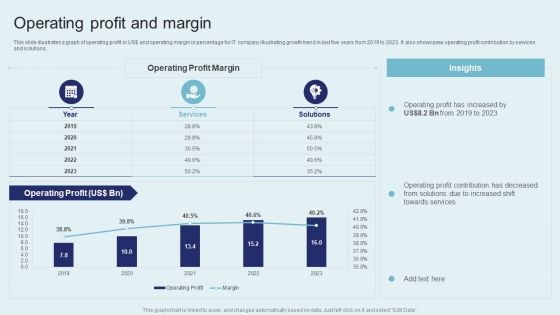
IT Firm Financial Statement Operating Profit And Margin Formats PDF
This slide illustrates a graph of operating profit in US dollar and operating margin in percentage for IT company IT Firm Fina growth trend in last five years from 2019 to 2023. It also showcases operating profit contribution by services and solutions. Get a simple yet stunning designed IT Firm Financial Statement Operating Profit And Margin Formats PDF. It is the best one to establish the tone in your meetings. It is an excellent way to make your presentations highly effective. So, download this PPT today from Slidegeeks and see the positive impacts. Our easy to edit IT Firm Financial Statement Operating Profit And Margin Formats PDF can be your go to option for all upcoming conferences and meetings. So, what are you waiting for Grab this template today.
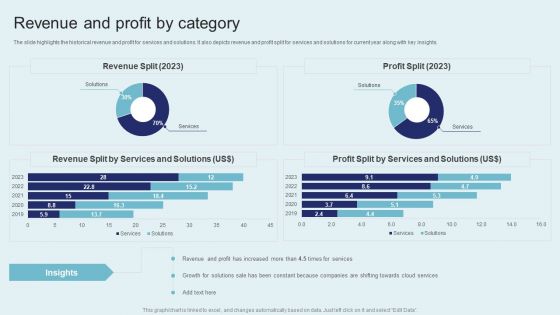
IT Firm Financial Statement Revenue And Profit By Category Portrait PDF
The slide highlights the historical revenue and profit for services and solutions. It also depicts revenue and profit split for services and solutions for current year along with key insights. From laying roadmaps to briefing everything in detail, our templates are perfect for you. You can set the stage with your presentation slides. All you have to do is download these easy to edit and customizable templates. IT Firm Financial Statement Revenue And Profit By Category Portrait PDF will help you deliver an outstanding performance that everyone would remember and praise you for. Do download this presentation today.
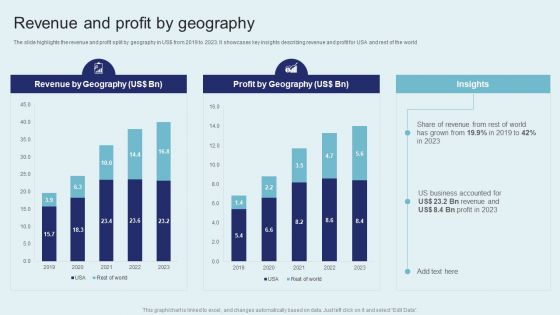
IT Firm Financial Statement Revenue And Profit By Geography Graphics PDF
The slide highlights the revenue and profit split by geography in US dollar from 2019 to 2023. It showcases key insights describing revenue and profit for USA and rest of the world. Present like a pro with IT Firm Financial Statement Revenue And Profit By Geography Graphics PDF Create beautiful presentations together with your team, using our easy to use presentation slides. Share your ideas in real time and make changes on the fly by downloading our templates. So whether you are in the office, on the go, or in a remote location, you can stay in sync with your team and present your ideas with confidence. With Slidegeeks presentation got a whole lot easier. Grab these presentations today.
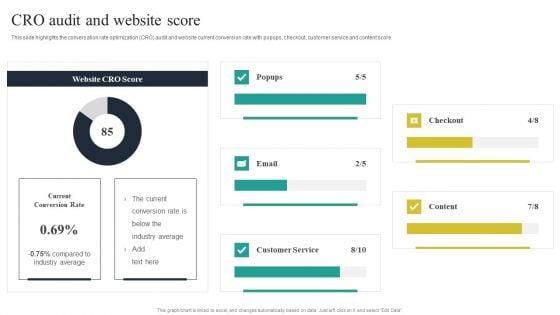
Website Audit To Increase Conversion Rate CRO Audit And Website Score Clipart PDF
This slide highlights the conversation rate optimization CRO audit and website current conversion rate with popups, checkout, customer service and content score. Are you in need of a template that can accommodate all of your creative concepts This one is crafted professionally and can be altered to fit any style. Use it with Google Slides or PowerPoint. Include striking photographs, symbols, depictions, and other visuals. Fill, move around, or remove text boxes as desired. Test out color palettes and font mixtures. Edit and save your work, or work with colleagues. Download Website Audit To Increase Conversion Rate CRO Audit And Website Score Clipart PDF and observe how to make your presentation outstanding. Give an impeccable presentation to your group and make your presentation unforgettable.
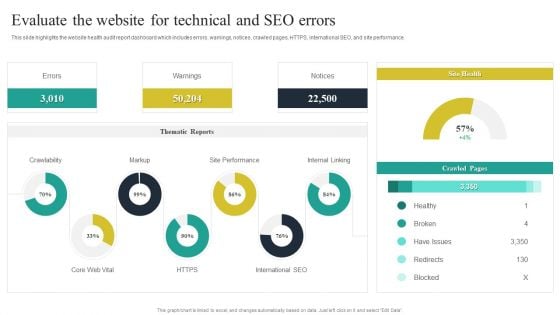
Website Audit To Increase Conversion Rate Evaluate The Website For Technical And SEO Errors Ideas PDF
This slide highlights the website health audit report dashboard which includes errors, warnings, notices, crawled pages, HTTPS, international SEO, and site performance. Crafting an eye catching presentation has never been more straightforward. Let your presentation shine with this tasteful yet straightforward Website Audit To Increase Conversion Rate Evaluate The Website For Technical And SEO Errors Ideas PDF template. It offers a minimalistic and classy look that is great for making a statement. The colors have been employed intelligently to add a bit of playfulness while still remaining professional. Construct the ideal Website Audit To Increase Conversion Rate Evaluate The Website For Technical And SEO Errors Ideas PDF that effortlessly grabs the attention of your audience Begin now and be certain to wow your customers.
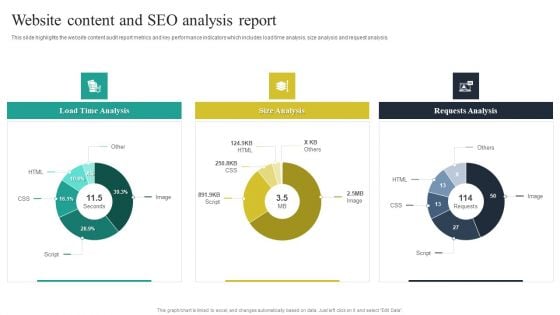
Website Audit To Increase Conversion Rate Website Content And SEO Analysis Report Microsoft PDF
This slide highlights the website content audit report metrics and key performance indicators which includes load time analysis, size analysis and request analysis. Make sure to capture your audiences attention in your business displays with our gratis customizable Website Audit To Increase Conversion Rate Website Content And SEO Analysis Report Microsoft PDF. These are great for business strategies, office conferences, capital raising or task suggestions. If you desire to acquire more customers for your tech business and ensure they stay satisfied, create your own sales presentation with these plain slides.
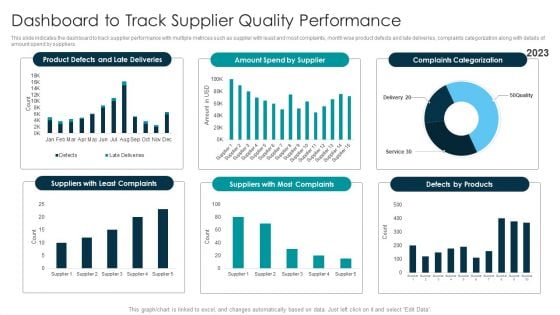
Tactical Approach For Vendor Reskilling Dashboard To Track Supplier Quality Performance Template PDF
This slide indicates the dashboard to track supplier performance with multiple metrices such as supplier with least and most complaints, month wise product defects and late deliveries, complaints categorization along with details of amount spend by suppliers. Make sure to capture your audiences attention in your business displays with our gratis customizable Tactical Approach For Vendor Reskilling Dashboard To Track Supplier Quality Performance Template PDF. These are great for business strategies, office conferences, capital raising or task suggestions. If you desire to acquire more customers for your tech business and ensure they stay satisfied, create your own sales presentation with these plain slides.
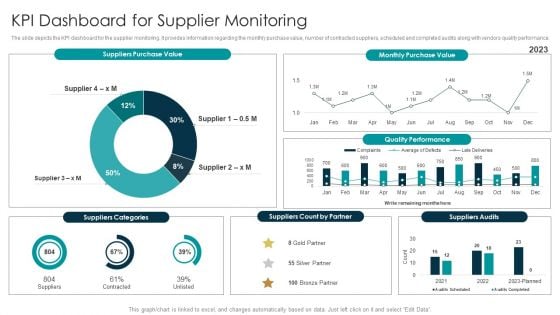
Tactical Approach For Vendor Reskilling KPI Dashboard For Supplier Monitoring Slides PDF
The slide depicts the KPI dashboard for the supplier monitoring. It provides information regarding the monthly purchase value, number of contracted suppliers, scheduled and completed audits along with vendors quality performance. Coming up with a presentation necessitates that the majority of the effort goes into the content and the message you intend to convey. The visuals of a PowerPoint presentation can only be effective if it supplements and supports the story that is being told. Keeping this in mind our experts created Tactical Approach For Vendor Reskilling KPI Dashboard For Supplier Monitoring Slides PDF to reduce the time that goes into designing the presentation. This way, you can concentrate on the message while our designers take care of providing you with the right template for the situation.
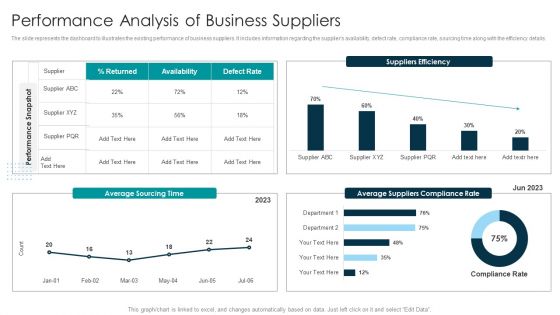
Tactical Approach For Vendor Reskilling Performance Analysis Of Business Suppliers Portrait PDF
The slide represents the dashboard to illustrates the existing performance of business suppliers. It includes information regarding the suppliers availability, defect rate, compliance rate, sourcing time along with the efficiency details. This modern and well arranged Tactical Approach For Vendor Reskilling Performance Analysis Of Business Suppliers Portrait PDF provides lots of creative possibilities. It is very simple to customize and edit with the Powerpoint Software. Just drag and drop your pictures into the shapes. All facets of this template can be edited with Powerpoint no extra software is necessary. Add your own material, put your images in the places assigned for them, adjust the colors, and then you can show your slides to the world, with an animated slide included.
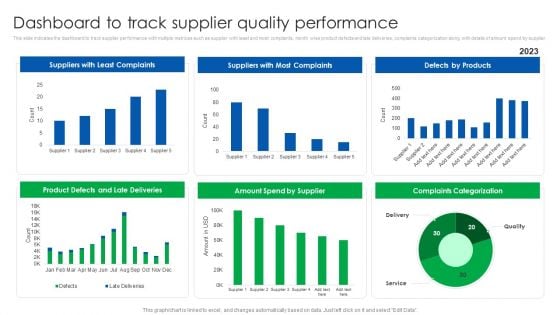
Vendor Relationship Management Strategic Plan Dashboard To Track Supplier Quality Performance Portrait PDF
This slide indicates the dashboard to track supplier performance with multiple metrices such as supplier with least and most complaints, month wise product defects and late deliveries, complaints categorization along with details of amount spend by supplier. Make sure to capture your audiences attention in your business displays with our gratis customizable Vendor Relationship Management Strategic Plan Dashboard To Track Supplier Quality Performance Portrait PDF. These are great for business strategies, office conferences, capital raising or task suggestions. If you desire to acquire more customers for your tech business and ensure they stay satisfied, create your own sales presentation with these plain slides.
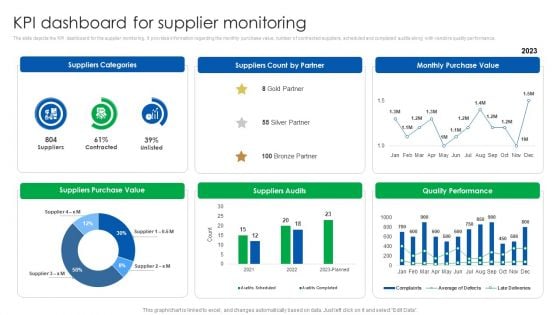
Vendor Relationship Management Strategic Plan KPI Dashboard For Supplier Monitoring Infographics PDF
The slide depicts the KPI dashboard for the supplier monitoring. It provides information regarding the monthly purchase value, number of contracted suppliers, scheduled and completed audits along with vendors quality performance. Coming up with a presentation necessitates that the majority of the effort goes into the content and the message you intend to convey. The visuals of a PowerPoint presentation can only be effective if it supplements and supports the story that is being told. Keeping this in mind our experts created Vendor Relationship Management Strategic Plan KPI Dashboard For Supplier Monitoring Infographics PDF to reduce the time that goes into designing the presentation. This way, you can concentrate on the message while our designers take care of providing you with the right template for the situation.
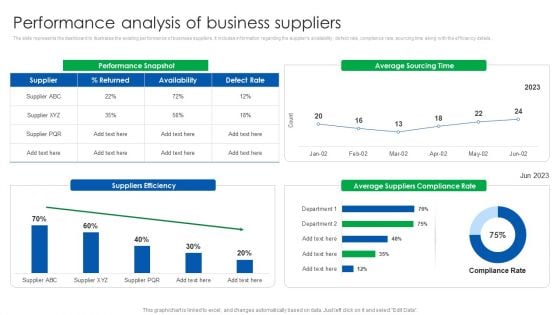
Vendor Relationship Management Strategic Plan Performance Analysis Of Business Suppliers Designs PDF
The slide represents the dashboard to illustrates the existing performance of business suppliers. It includes information regarding the suppliers availability, defect rate, compliance rate, sourcing time along with the efficiency details. This modern and well arranged Vendor Relationship Management Strategic Plan Performance Analysis Of Business Suppliers Designs PDF provides lots of creative possibilities. It is very simple to customize and edit with the Powerpoint Software. Just drag and drop your pictures into the shapes. All facets of this template can be edited with Powerpoint no extra software is necessary. Add your own material, put your images in the places assigned for them, adjust the colors, and then you can show your slides to the world, with an animated slide included.
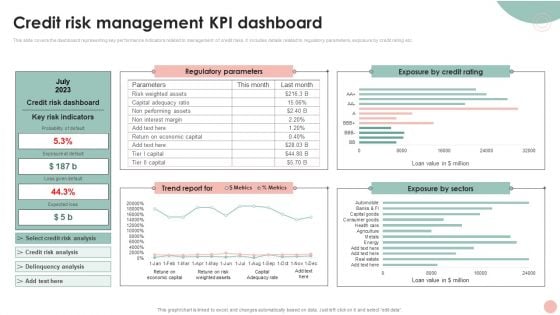
Company Risk Assessment Plan Credit Risk Management KPI Dashboard Rules PDF
This slide covers the dashboard representing key performance indicators related to management of credit risks. It includes details related to regulatory parameters, exposure by credit rating etc. Do you have an important presentation coming up. Are you looking for something that will make your presentation stand out from the rest. Look no further than Company Risk Assessment Plan Credit Risk Management KPI Dashboard Rules PDF. With our professional designs, you can trust that your presentation will pop and make delivering it a smooth process. And with Slidegeeks, you can trust that your presentation will be unique and memorable. So why wait. GrabCompany Risk Assessment Plan Credit Risk Management KPI Dashboard Rules PDF today and make your presentation stand out from the rest.
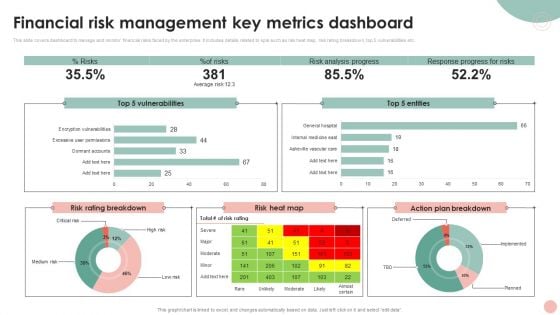
Company Risk Assessment Plan Financial Risk Management Key Metrics Dashboard Brochure PDF
This slide covers dashboard to manage and monitor financial risks faced by the enterprise. It includes details related to kpis such as risk heat map, risk rating breakdown, top 5 vulnerabilities etc. Crafting an eye catching presentation has never been more straightforward. Let your presentation shine with this tasteful yet straight forward Company Risk Assessment Plan Financial Risk Management Key Metrics Dashboard Brochure PDF template. It offers a minimalistic and classy look that is great for making a statement. The colors have been employed intelligently to add a bit of playfulness while still remaining professional. Construct the ideal Company Risk Assessment Plan Financial Risk Management Key Metrics Dashboard Brochure PDF that effortlessly grabs the attention of your audience. Begin now and be certain to wow your customers.

Competitor Assessment To Determine Companys Share Competitor Analysis Based On Companys Market Share Formats PDF
This slide covers the graphical representation of competitors market share. It also includes key takeaways such as market share of top competitors which is almost double of most others. Coming up with a presentation necessitates that the majority of the effort goes into the content and the message you intend to convey. The visuals of a PowerPoint presentation can only be effective if it supplements and supports the story that is being told. Keeping this in mind our experts created Competitor Assessment To Determine Companys Share Competitor Analysis Based On Companys Market Share Formats PDF to reduce the time that goes into designing the presentation. This way, you can concentrate on the message while our designers take care of providing you with the right template for the situation.
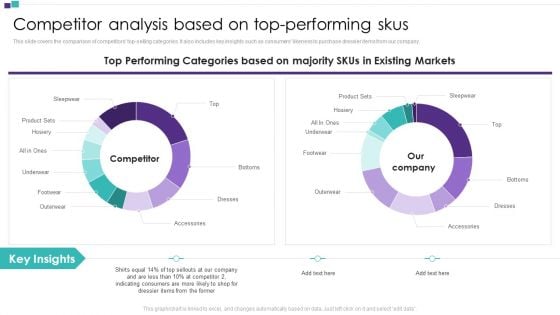
Competitor Assessment To Determine Companys Share Competitor Analysis Based On Top Performing Skus Clipart PDF
This slide covers the comparison of competitors top selling categories. It also includes key insights such as consumers likeness to purchase dressier items from our company. This modern and well arranged Competitor Assessment To Determine Companys Share Competitor Analysis Based On Top Performing Skus Clipart PDF provides lots of creative possibilities. It is very simple to customize and edit with the Powerpoint Software. Just drag and drop your pictures into the shapes. All facets of this template can be edited with Powerpoint no extra software is necessary. Add your own material, put your images in the places assigned for them, adjust the colors, and then you can show your slides to the world, with an animated slide included.
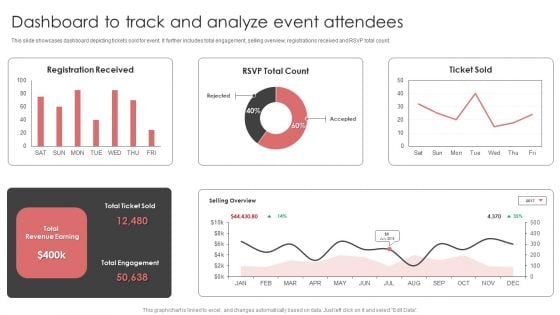
New Product Launch Event Management Activities Dashboard To Track And Analyze Event Attendees Rules PDF
This slide showcases dashboard depicting tickets sold for event. It further includes total engagement, selling overview, registrations received and RSVP total count.Get a simple yet stunning designed New Product Launch Event Management Activities Dashboard To Track And Analyze Event Attendees Rules PDF. It is the best one to establish the tone in your meetings. It is an excellent way to make your presentations highly effective. So, download this PPT today from Slidegeeks and see the positive impacts. Our easy-to-edit New Product Launch Event Management Activities Dashboard To Track And Analyze Event Attendees Rules PDF can be your go-to option for all upcoming conferences and meetings. So, what are you waiting for Grab this template today.
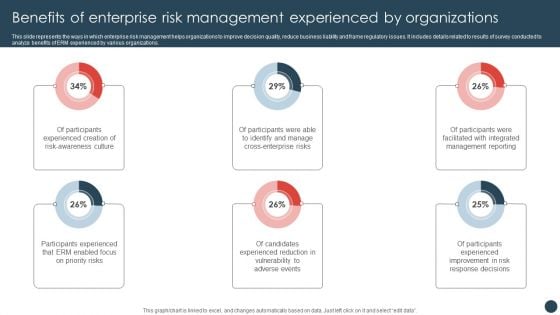
Benefits Of Enterprise Risk Management Experienced By Organizations Mockup PDF
This slide represents the ways in which enterprise risk management helps organizations to improve decision quality, reduce business liability and frame regulatory issues. It includes details related to results of survey conducted to analyze benefits of ERM experienced by various organizations.Do you have an important presentation coming up Are you looking for something that will make your presentation stand out from the rest Look no further than Benefits Of Enterprise Risk Management Experienced By Organizations Mockup PDF. With our professional designs, you can trust that your presentation will pop and make delivering it a smooth process. And with Slidegeeks, you can trust that your presentation will be unique and memorable. So why wait Grab Benefits Of Enterprise Risk Management Experienced By Organizations Mockup PDF today and make your presentation stand out from the rest.
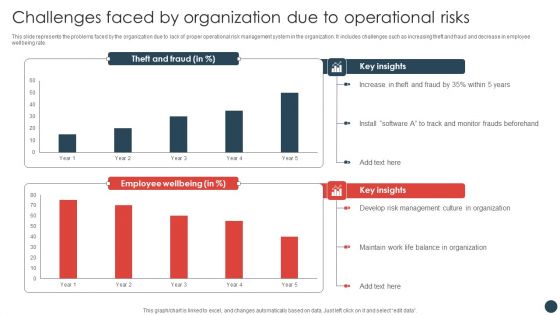
Strategic Risk Management Plan Challenges Faced By Organization Due To Operational Risks Elements PDF
This slide represents the problems faced by the organization due to lack of proper operational risk management system in the organization. It includes challenges such as increasing theft and fraud and decrease in employee wellbeing rate.Are you in need of a template that can accommodate all of your creative concepts This one is crafted professionally and can be altered to fit any style. Use it with Google Slides or PowerPoint. Include striking photographs, symbols, depictions, and other visuals. Fill, move around, or remove text boxes as desired. Test out color palettes and font mixtures. Edit and save your work, or work with colleagues. Download Strategic Risk Management Plan Challenges Faced By Organization Due To Operational Risks Elements PDF and observe how to make your presentation outstanding. Give an impeccable presentation to your group and make your presentation unforgettable.
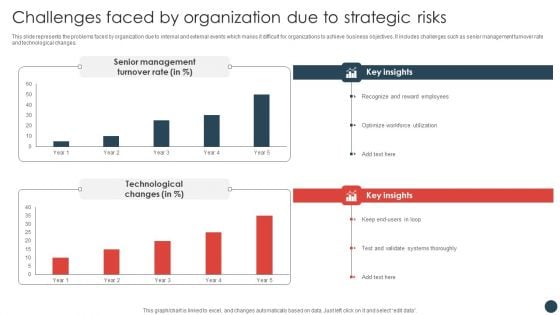
Strategic Risk Management Plan Challenges Faced By Organization Due To Strategic Risks Introduction PDF
This slide represents the problems faced by organization due to internal and external events which makes it difficult for organizations to achieve business objectives. It includes challenges such as senior management turnover rate and technological changes.Crafting an eye-catching presentation has never been more straightforward. Let your presentation shine with this tasteful yet straightforward Strategic Risk Management Plan Challenges Faced By Organization Due To Strategic Risks Introduction PDF template. It offers a minimalistic and classy look that is great for making a statement. The colors have been employed intelligently to add a bit of playfulness while still remaining professional. Construct the ideal Strategic Risk Management Plan Challenges Faced By Organization Due To Strategic Risks Introduction PDF that effortlessly grabs the attention of your audience Begin now and be certain to wow your customers.
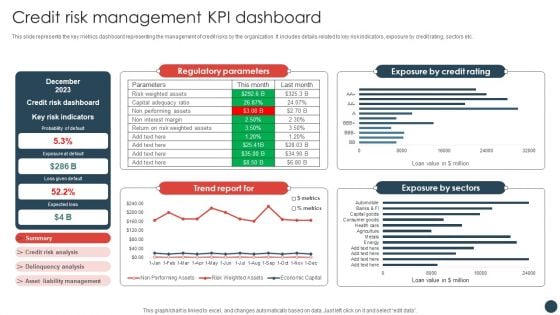
Strategic Risk Management Plan Credit Risk Management KPI Dashboard Information PDF
This slide represents the key metrics dashboard representing the management of credit risks by the organization. It includes details related to key risk indicators, exposure by credit rating, sectors etc.Coming up with a presentation necessitates that the majority of the effort goes into the content and the message you intend to convey. The visuals of a PowerPoint presentation can only be effective if it supplements and supports the story that is being told. Keeping this in mind our experts created Strategic Risk Management Plan Credit Risk Management KPI Dashboard Information PDF to reduce the time that goes into designing the presentation. This way, you can concentrate on the message while our designers take care of providing you with the right template for the situation.
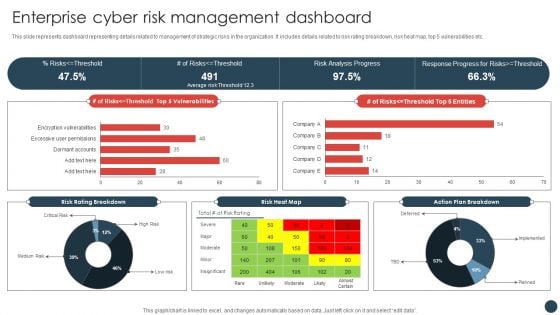
Strategic Risk Management Plan Enterprise Cyber Risk Management Dashboard Information PDF
This slide represents dashboard representing details related to management of strategic risks in the organization. It includes details related to risk rating breakdown, risk heat map, top 5 vulnerabilities etc.This Strategic Risk Management Plan Enterprise Cyber Risk Management Dashboard Information PDF is perfect for any presentation, be it in front of clients or colleagues. It is a versatile and stylish solution for organizing your meetings. The Strategic Risk Management Plan Enterprise Cyber Risk Management Dashboard Information PDF features a modern design for your presentation meetings. The adjustable and customizable slides provide unlimited possibilities for acing up your presentation. Slidegeeks has done all the homework before launching the product for you. So, do not wait, grab the presentation templates today.
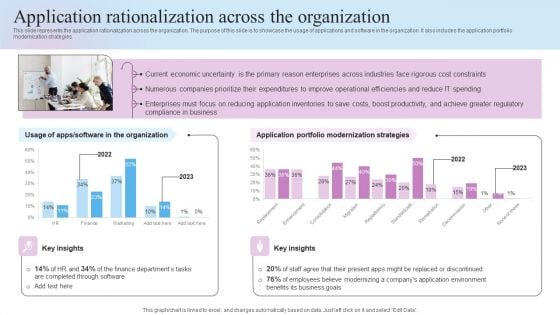
IT Business Alignment Framework Application Rationalization Across The Organization Portrait PDF
This slide represents the application rationalization across the organization. The purpose of this slide is to showcase the usage of applications and software in the organization. It also includes the application portfolio modernization strategies.Crafting an eye-catching presentation has never been more straightforward. Let your presentation shine with this tasteful yet straightforward IT Business Alignment Framework Application Rationalization Across The Organization Portrait PDF template. It offers a minimalistic and classy look that is great for making a statement. The colors have been employed intelligently to add a bit of playfulness while still remaining professional. Construct the ideal IT Business Alignment Framework Application Rationalization Across The Organization Portrait PDF that effortlessly grabs the attention of your audience Begin now and be certain to wow your customers.
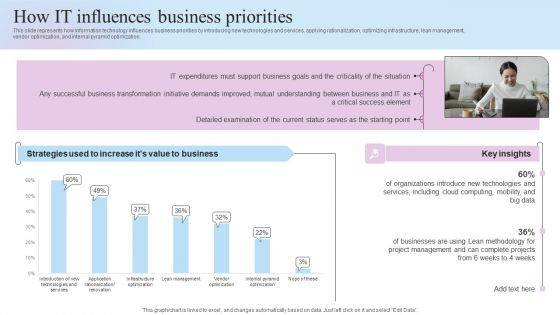
IT Business Alignment Framework How IT Influences Business Priorities Information PDF
This slide represents how information technology influences business priorities by introducing new technologies and services, applying rationalization, optimizing infrastructure, lean management, vendor optimization, and internal pyramid optimization.Find a pre-designed and impeccable IT Business Alignment Framework How IT Influences Business Priorities Information PDF. The templates can ace your presentation without additional effort. You can download these easy-to-edit presentation templates to make your presentation stand out from others. So, what are you waiting for Download the template from Slidegeeks today and give a unique touch to your presentation.
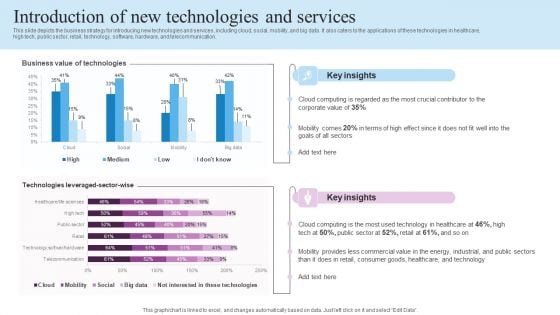
IT Business Alignment Framework Introduction Of New Technologies And Services Rules PDF
This slide depicts the business strategy for introducing new technologies and services, including cloud, social, mobility, and big data. It also caters to the applications of these technologies in healthcare, high tech, public sector, retail, technology, software, hardware, and telecommunication.Get a simple yet stunning designed IT Business Alignment Framework Introduction Of New Technologies And Services Rules PDF. It is the best one to establish the tone in your meetings. It is an excellent way to make your presentations highly effective. So, download this PPT today from Slidegeeks and see the positive impacts. Our easy-to-edit IT Business Alignment Framework Introduction Of New Technologies And Services Rules PDF can be your go-to option for all upcoming conferences and meetings. So, what are you waiting for Grab this template today.
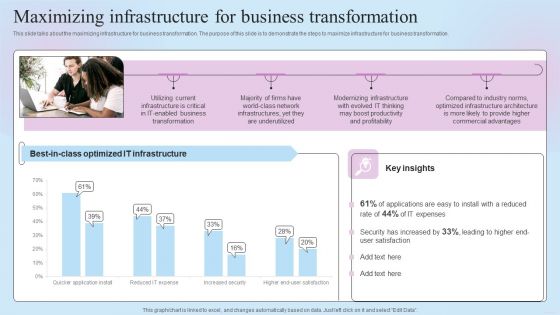
IT Business Alignment Framework Maximizing Infrastructure For Business Transformation Elements PDF
This slide talks about the maximizing infrastructure for business transformation. The purpose of this slide is to demonstrate the steps to maximize infrastructure for business transformation. Do you have an important presentation coming up Are you looking for something that will make your presentation stand out from the rest Look no further than IT Business Alignment Framework Maximizing Infrastructure For Business Transformation Elements PDF. With our professional designs, you can trust that your presentation will pop and make delivering it a smooth process. And with Slidegeeks, you can trust that your presentation will be unique and memorable. So why wait Grab IT Business Alignment Framework Maximizing Infrastructure For Business Transformation Elements PDF today and make your presentation stand out from the rest.
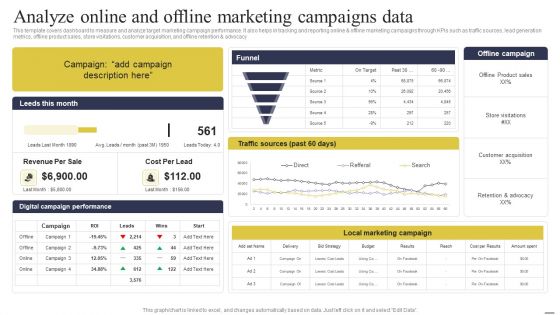
Defining Generic Target Marketing Techniques Analyze Online And Offline Marketing Campaigns Data Topics PDF
This template covers dashboard to measure and analyze target marketing campaign performance. It also helps in tracking and reporting online and offline marketing campaigns through KPIs such as traffic sources, lead generation metrics, offline product sales, store visitations, customer acquisition, and offline retention and advocacy. Create an editable Defining Generic Target Marketing Techniques Analyze Online And Offline Marketing Campaigns Data Topics PDF that communicates your idea and engages your audience. Whether you are presenting a business or an educational presentation, pre designed presentation templates help save time. Defining Generic Target Marketing Techniques Analyze Online And Offline Marketing Campaigns Data Topics PDF is highly customizable and very easy to edit, covering many different styles from creative to business presentations. Slidegeeks has creative team members who have crafted amazing templates. So, go and get them without any delay.
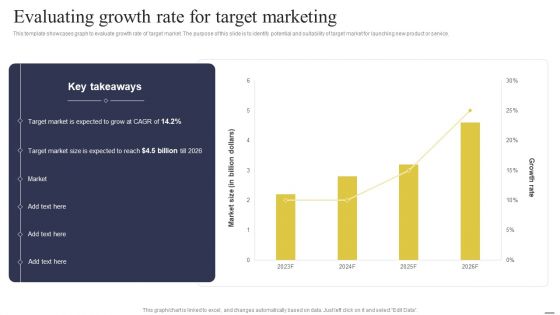
Defining Generic Target Marketing Techniques Evaluating Growth Rate For Target Marketing Information PDF
This template showcases graph to evaluate growth rate of target market. The purpose of this slide is to identify potential and suitability of target market for launching new product or service. Find a pre designed and impeccable Defining Generic Target Marketing Techniques Evaluating Growth Rate For Target Marketing Information PDF. The templates can ace your presentation without additional effort. You can download these easy to edit presentation templates to make your presentation stand out from others. So, what are you waiting for Download the template from Slidegeeks today and give a unique touch to your presentation.
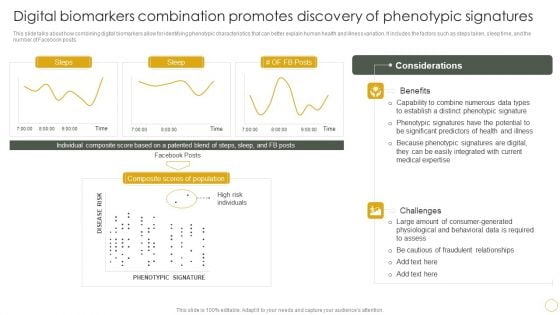
Digital Biomarkers Combination Promotes Discovery Of Phenotypic Signatures Summary PDF
This slide talks about how combining digital biomarkers allow for identifying phenotypic characteristics that can better explain human health and illness variation. It includes the factors such as steps taken, sleep time, and the number of Facebook posts. Create an editable Digital Biomarkers Combination Promotes Discovery Of Phenotypic Signatures Summary PDF that communicates your idea and engages your audience. Whether you are presenting a business or an educational presentation, pre designed presentation templates help save time. Digital Biomarkers Combination Promotes Discovery Of Phenotypic Signatures Summary PDF is highly customizable and very easy to edit, covering many different styles from creative to business presentations. Slidegeeks has creative team members who have crafted amazing templates. So, go and get them without any delay.
Digital Resilience Biomarker Technologies IT Dashboard For Digital Biomarkers Tracking Elements PDF
This slide represents the dashboard for digital biomarkers tracking, and it covers details about coughing, talking, physical activity, respiration, cardiac activity, body orientation, and snoring, including the date and time of these activities. Present like a pro with Digital Resilience Biomarker Technologies IT Dashboard For Digital Biomarkers Tracking Elements PDF Create beautiful presentations together with your team, using our easy to use presentation slides. Share your ideas in real time and make changes on the fly by downloading our templates. So whether you are in the office, on the go, or in a remote location, you can stay in sync with your team and present your ideas with confidence. With Slidegeeks presentation got a whole lot easier. Grab these presentations today.


 Continue with Email

 Home
Home


