Budget Management
Sample Employee Evaluation Form Ppt PowerPoint Presentation Pictures Deck Cpb
This is a sample employee evaluation form ppt powerpoint presentation pictures deck cpb. This is a three stage process. The stages in this process are sample employee evaluation form.
Consumer Market Research Firms Ppt PowerPoint Presentation Infographics Deck Cpb
This is a consumer market research firms ppt powerpoint presentation infographics deck cpb. This is a four stage process. The stages in this process are consumer market research firms.
Lead Marketing Network Sales Ppt PowerPoint Presentation Styles Information Cpb
This is a lead marketing network sales ppt powerpoint presentation styles information cpb. This is a six stage process. The stages in this process are lead marketing network sales.
Our Business Goal Arrow Success Ppt PowerPoint Presentation Layout
This is a our business goal arrow success ppt powerpoint presentation layout. This is a three stage process. The stages in this process are arrow, marketing, strategy, competition, success.

Our Target Arrow Planning Ppt PowerPoint Presentation Pictures Diagrams
This is a our target arrow planning ppt powerpoint presentation pictures diagrams. This is a one stage process. The stages in this process are arrow, marketing, strategy, competition, success.
Saas Sale Paid Users Ppt PowerPoint Presentation Ideas Icon
This is a saas sale paid users ppt powerpoint presentation ideas icon. This is a four stage process. The stages in this process are website users, intent users, paid users, retained users, marketing.
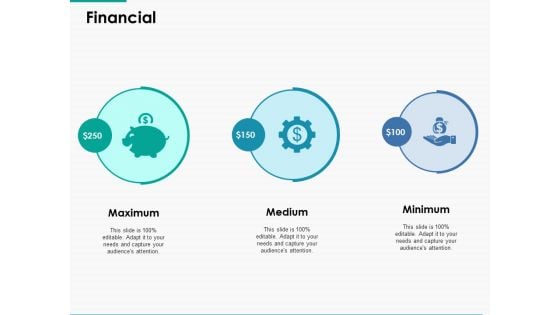
Financial Maximum Medium Ppt Powerpoint Presentation Ideas Graphics Design
This is a financial maximum medium ppt powerpoint presentation ideas graphics design. This is a three stage process. The stages in this process are financial, minimum, maximum, marketing, strategy.
Our Goal Quality Ppt PowerPoint Presentation Visual Aids Show
This is a our goal quality ppt powerpoint presentation visual aids show. This is a three stage process. The stages in this process are Awareness, Quality, Success, Planning, Marketing.
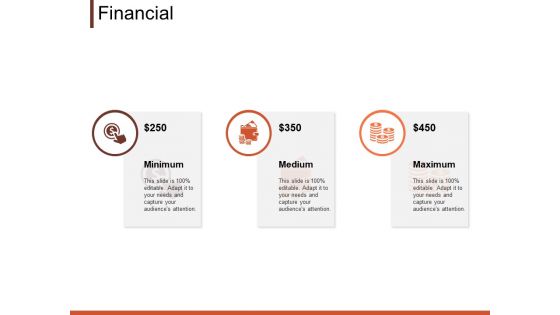
Financial Minimum Medium Ppt PowerPoint Presentation Layouts Graphics Example
This is a financial minimum medium ppt powerpoint presentation layouts graphics example. This is a three stage process. The stages in this process are financial, maximum, medium, minimum, marketing.
Cash Flow Green Drop With Dollar Symbol Ppt PowerPoint Presentation Professional Graphic Tips
This is a cash flow green drop with dollar symbol ppt powerpoint presentation professional graphic tips. This is a four stage process. The stages in this process are liquidity, cash assets, solvency.
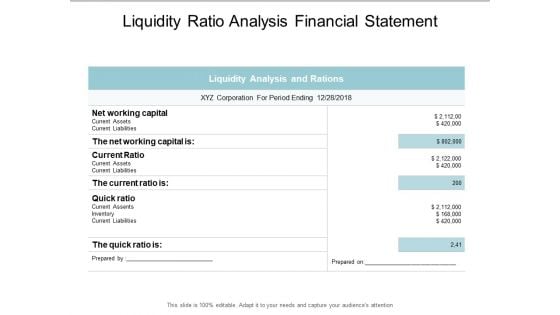
Liquidity Ratio Analysis Financial Statement Ppt PowerPoint Presentation Ideas Layouts
This is a liquidity ratio analysis financial statement ppt powerpoint presentation ideas layouts. This is a four stage process. The stages in this process are liquidity, cash assets, solvency.
Financial Maximum Medium Ppt Powerpoint Presentation Icon Master Slide
This is a financial maximum medium ppt powerpoint presentation icon master slide. This is a three stage process. The stages in this process are financial, minimum, maximum, marketing, strategy.
Our Goal Arrow Target Ppt PowerPoint Presentation Layouts Brochure
This is a our goal arrow target ppt powerpoint presentation layouts brochure. This is a four stage process. The stages in this process are arrow, marketing, strategy, competition, success.
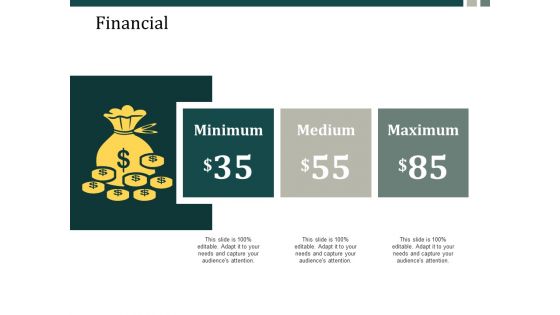
Financial Maximum Medium Ppt Powerpoint Presentation Infographics Slideshow Ppt Powerpoint Presentation Portfolio Ideas
This is a financial maximum medium ppt powerpoint presentation infographics slideshow ppt powerpoint presentation portfolio ideas. This is a three stage process. The stages in this process are financial, minimum, maximum, marketing, strategy.
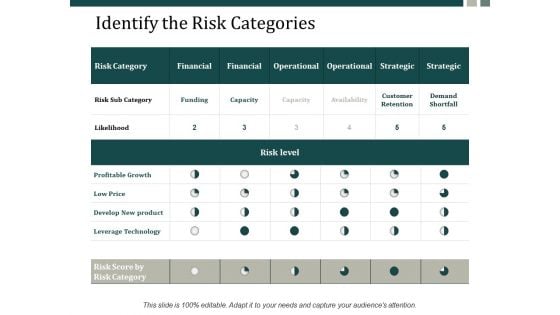
Identify The Risk Categories Ppt Powerpoint Presentation Infographics Structure Ppt Powerpoint Presentation Gallery Summary
This is a identify the risk categories ppt powerpoint presentation infographics structure ppt powerpoint presentation gallery summary. This is a six stage process. The stages in this process are financial, operational, strategic, capacity, profitable growth.
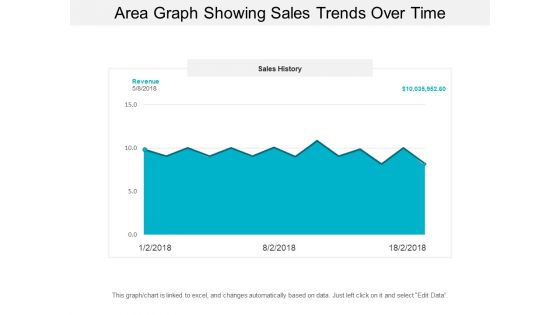
Area Graph Showing Sales Trends Over Time Ppt PowerPoint Presentation Model Background Designs
This is a area graph showing sales trends over time ppt powerpoint presentation model background designs. This is a three stage process. The stages in this process are financial analysis, quantitative, statistical modelling.
Bar Graph Icon For Data Analysis Ppt PowerPoint Presentation Pictures Ideas
This is a bar graph icon for data analysis ppt powerpoint presentation pictures ideas. This is a four stage process. The stages in this process are financial analysis, quantitative, statistical modelling.
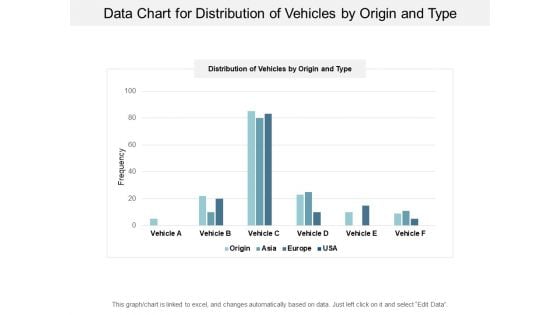
Data Chart For Distribution Of Vehicles By Origin And Type Ppt PowerPoint Presentation Infographics Topics
This is a data chart for distribution of vehicles by origin and type ppt powerpoint presentation infographics topics. This is a four stage process. The stages in this process are financial analysis, quantitative, statistical modelling.
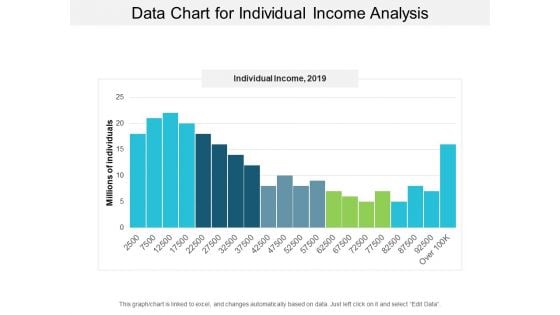
Data Chart For Individual Income Analysis Ppt PowerPoint Presentation Layouts Visual Aids
This is a data chart for individual income analysis ppt powerpoint presentation layouts visual aids. This is a five stage process. The stages in this process are financial analysis, quantitative, statistical modelling.
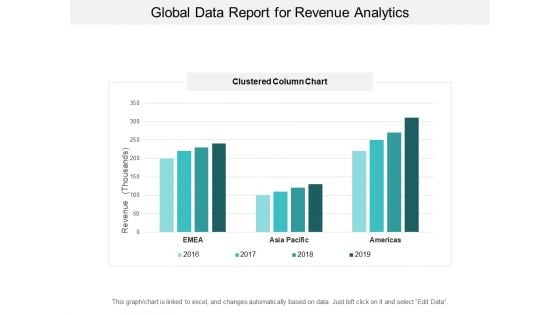
Global Data Report For Revenue Analytics Ppt PowerPoint Presentation Inspiration Visuals
This is a global data report for revenue analytics ppt powerpoint presentation inspiration visuals. This is a four stage process. The stages in this process are financial analysis, quantitative, statistical modelling.
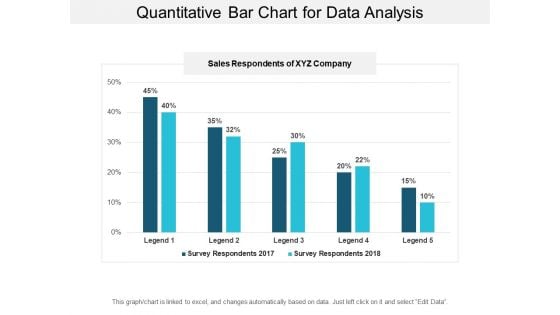
Quantitative Bar Chart For Data Analysis Ppt PowerPoint Presentation Model Graphic Tips
This is a quantitative bar chart for data analysis ppt powerpoint presentation model graphic tips. This is a two stage process. The stages in this process are financial analysis, quantitative, statistical modelling.
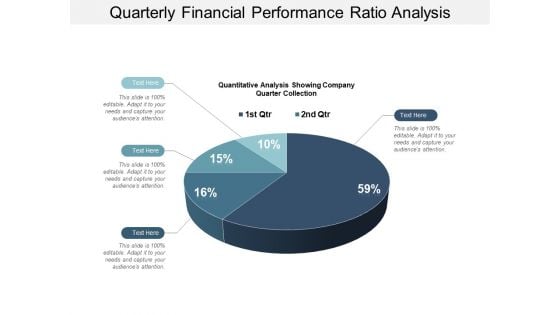
Quarterly Financial Performance Ratio Analysis Ppt PowerPoint Presentation Model Format Ideas
This is a quarterly financial performance ratio analysis ppt powerpoint presentation model format ideas. This is a four stage process. The stages in this process are financial analysis, quantitative, statistical modelling.
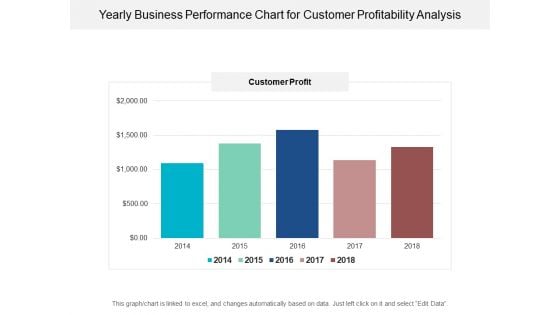
Yearly Business Performance Chart For Customer Profitability Analysis Ppt PowerPoint Presentation Ideas Picture
This is a yearly business performance chart for customer profitability analysis ppt powerpoint presentation ideas picture. This is a five stage process. The stages in this process are financial analysis, quantitative, statistical modelling.
Our Target Arrow Planning Ppt PowerPoint Presentation Visual Aids Backgrounds
This is a our target arrow planning ppt powerpoint presentation visual aids backgrounds. This is a three stage process. The stages in this process are arrow, marketing, strategy, competition, success.
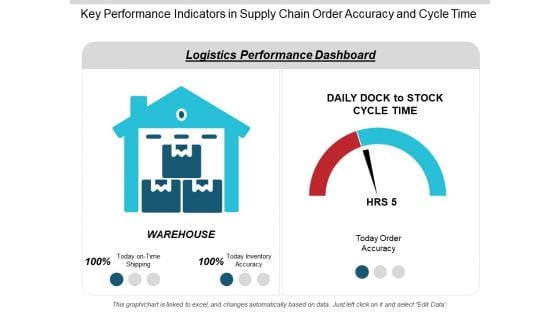
Key Performance Indicators In Supply Chain Order Accuracy And Cycle Time Ppt PowerPoint Presentation Infographics Slideshow
This is a key performance indicators in supply chain order accuracy and cycle time ppt powerpoint presentation infographics slideshow. This is a two stage process. The stages in this process are logistics performance, logistics dashboard, logistics kpis.

Kpis In Shipping Perfect Order Rate And On Time Shipment Ppt PowerPoint Presentation Show Guide
This is a kpis in shipping perfect order rate and on time shipment ppt powerpoint presentation show guide. This is a six stage process. The stages in this process are logistics performance, logistics dashboard, logistics kpis.
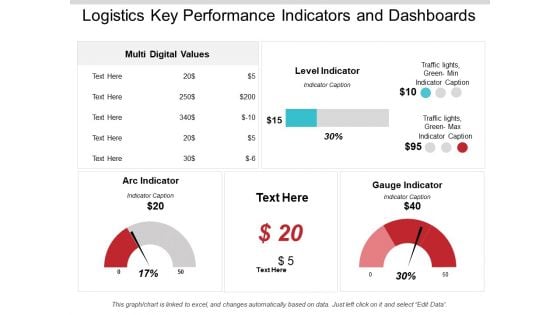
Logistics Key Performance Indicators And Dashboards Ppt PowerPoint Presentation Infographics Background Image
This is a logistics key performance indicators and dashboards ppt powerpoint presentation infographics background image. This is a three stage process. The stages in this process are logistics performance, logistics dashboard, logistics kpis.
Logistics Kpis And Metrics Percentage Of Orders Delivered Ppt PowerPoint Presentation Icon
This is a logistics kpis and metrics percentage of orders delivered ppt powerpoint presentation icon. This is a five stage process. The stages in this process are logistics performance, logistics dashboard, logistics kpis.
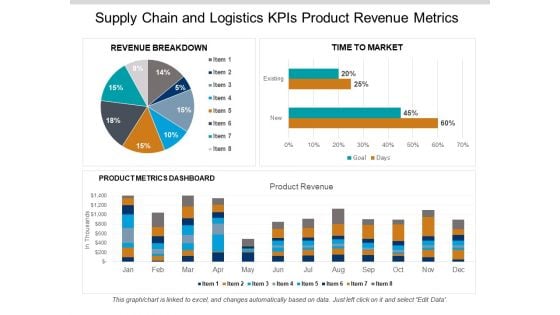
Supply Chain And Logistics Kpis Product Revenue Metrics Ppt PowerPoint Presentation Gallery Aids
This is a supply chain and logistics kpis product revenue metrics ppt powerpoint presentation gallery aids. This is a three stage process. The stages in this process are logistics performance, logistics dashboard, logistics kpis.
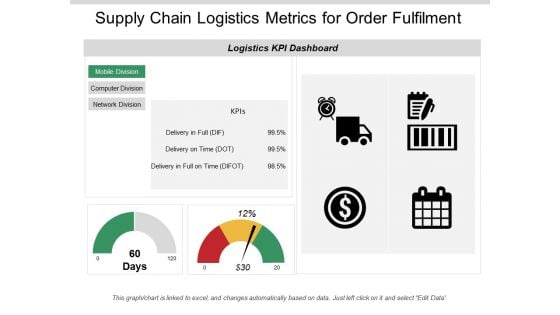
Supply Chain Logistics Metrics For Order Fulfilment Ppt PowerPoint Presentation Infographic Template Information
This is a supply chain logistics metrics for order fulfilment ppt powerpoint presentation infographic template information. This is a two stage process. The stages in this process are logistics performance, logistics dashboard, logistics kpis.

Supply Chain Metrics Fleet Efficiency Loading Time And Weight Ppt PowerPoint Presentation Portfolio Guidelines
This is a supply chain metrics fleet efficiency loading time and weight ppt powerpoint presentation portfolio guidelines. This is a four stage process. The stages in this process are logistics performance, logistics dashboard, logistics kpis.
Retail Competition Ppt PowerPoint Presentation Icon Microsoft
This is a retail competition ppt powerpoint presentation icon microsoft. This is a six stage process. The stages in this process are customer service, shipping speed, product quality, price, product fidelity.
Our Target Competition Ppt PowerPoint Presentation Model Design Ideas
This is a our target competition ppt powerpoint presentation model design ideas. This is a two stage process. The stages in this process are arrow, marketing, strategy, competition, success.
Employee Engagement Dashboard Ppt PowerPoint Presentation Icon Shapes
This is a employee engagement dashboard ppt powerpoint presentation icon shapes. This is a four stage process. The stages in this process are personal growth, technical skills, marketing, planning, strategy.
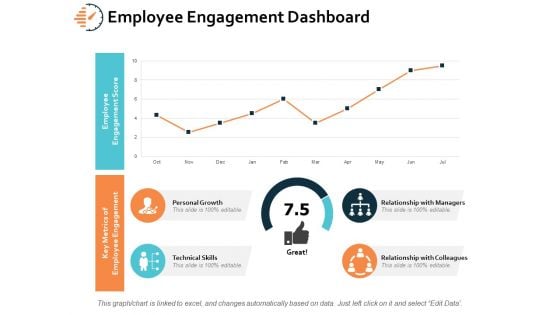
Employee Engagement Dashboard Ppt PowerPoint Presentation Layouts Inspiration
This is a employee engagement dashboard ppt powerpoint presentation layouts inspiration. This is a four stage process. The stages in this process are personal growth, technical skills, marketing, planning, strategy.

Dollar Signs With Growing Up Arrow For Profit Growth Ppt PowerPoint Presentation Layouts Examples
This is a dollar signs with growing up arrow for profit growth ppt powerpoint presentation layouts examples. This is a four stage process. The stages in this process are growth, increase sales, increase revenue.
Financial And Income Growth Bar Graph Dollar Sign Ppt PowerPoint Presentation Professional Shapes
This is a financial and income growth bar graph dollar sign ppt powerpoint presentation professional shapes. This is a four stage process. The stages in this process are growth, increase sales, increase revenue.
Financial Growth Strategy Arrow Up On Bar Graph Ppt PowerPoint Presentation Gallery Example
This is a financial growth strategy arrow up on bar graph ppt powerpoint presentation gallery example. This is a four stage process. The stages in this process are growth, increase sales, increase revenue.
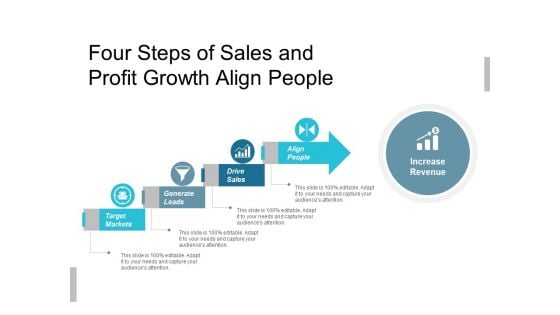
Four Steps Of Sales And Profit Growth Align People Ppt PowerPoint Presentation Infographic Template Deck
This is a four steps of sales and profit growth align people ppt powerpoint presentation infographic template deck. This is a four stage process. The stages in this process are growth, increase sales, increase revenue.
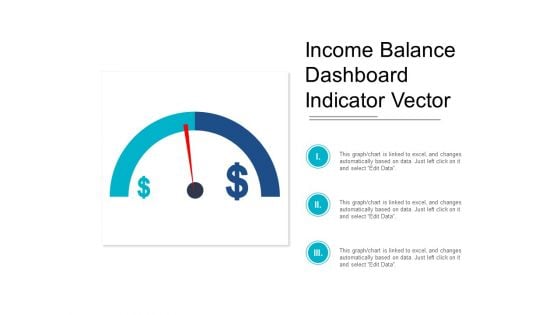
Income Balance Dashboard Indicator Vector Ppt PowerPoint Presentation Professional Diagrams
This is a income balance dashboard indicator vector ppt powerpoint presentation professional diagrams. This is a three stage process. The stages in this process are growth, increase sales, increase revenue.
Profit And Financial Growth Arrow With Dollar Signs Ppt PowerPoint Presentation Icon Topics
This is a profit and financial growth arrow with dollar signs ppt powerpoint presentation icon topics. This is a three stage process. The stages in this process are growth, increase sales, increase revenue.
Profit Growth Bar Graph With Rising Arrow And Dollar Sign Ppt PowerPoint Presentation Icon Designs
This is a profit growth bar graph with rising arrow and dollar sign ppt powerpoint presentation icon designs. This is a five stage process. The stages in this process are growth, increase sales, increase revenue.
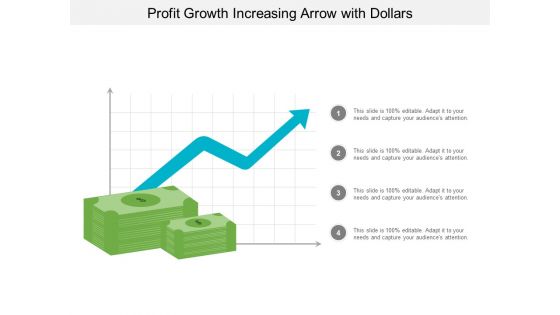
Profit Growth Increasing Arrow With Dollars Ppt PowerPoint Presentation Model Outfit
This is a profit growth increasing arrow with dollars ppt powerpoint presentation model outfit. This is a four stage process. The stages in this process are growth, increase sales, increase revenue.
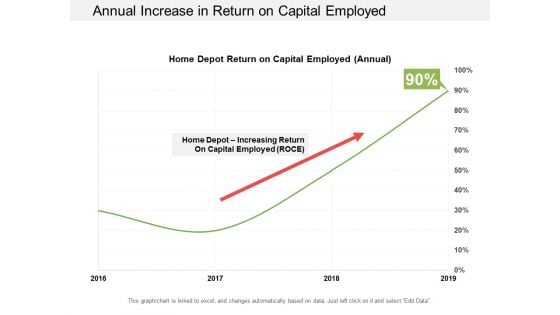
Annual Increase In Return On Capital Employed Ppt PowerPoint Presentation Outline Objects
This is a annual increase in return on capital employed ppt powerpoint presentation outline objects. This is a four stage process. The stages in this process are accounting ratio, roce, return on capital employed.

Comparison Chart Return On Capital Employed Ppt PowerPoint Presentation Portfolio Templates
This is a comparison chart return on capital employed ppt powerpoint presentation portfolio templates. This is a two stage process. The stages in this process are accounting ratio, roce, return on capital employed.
Return On Capital Employed Graph Vector Icon Ppt PowerPoint Presentation Portfolio Design Inspiration
This is a return on capital employed graph vector icon ppt powerpoint presentation portfolio design inspiration. This is a three stage process. The stages in this process are accounting ratio, roce, return on capital employed.
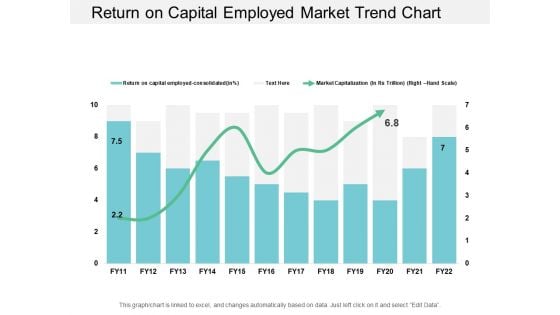
Return On Capital Employed Market Trend Chart Ppt PowerPoint Presentation Styles Examples
This is a return on capital employed market trend chart ppt powerpoint presentation styles examples. This is a two stage process. The stages in this process are accounting ratio, roce, return on capital employed.
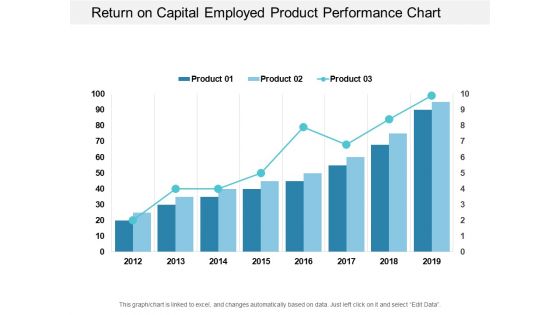
Return On Capital Employed Product Performance Chart Ppt PowerPoint Presentation Portfolio Visuals
This is a return on capital employed product performance chart ppt powerpoint presentation portfolio visuals. This is a three stage process. The stages in this process are accounting ratio, roce, return on capital employed.
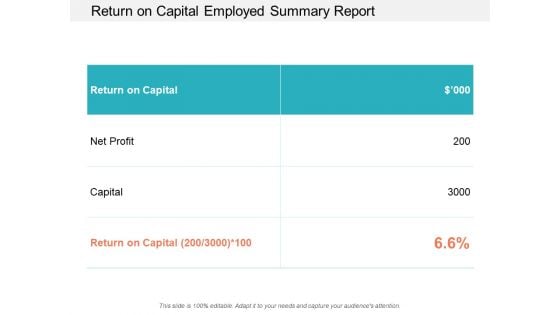
Return On Capital Employed Summary Report Ppt PowerPoint Presentation Summary Slide Portrait
This is a return on capital employed summary report ppt powerpoint presentation summary slide portrait. This is a two stage process. The stages in this process are accounting ratio, roce, return on capital employed.
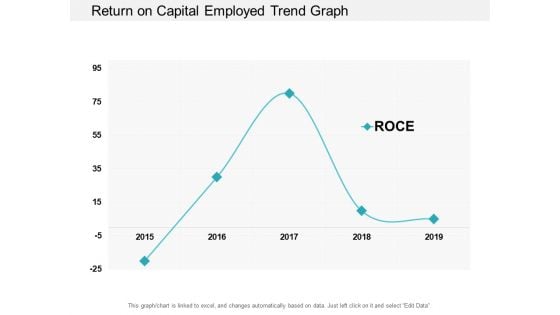
Return On Capital Employed Trend Graph Ppt PowerPoint Presentation Professional Example Topics
This is a return on capital employed trend graph ppt powerpoint presentation professional example topics. This is a one stage process. The stages in this process are accounting ratio, roce, return on capital employed.
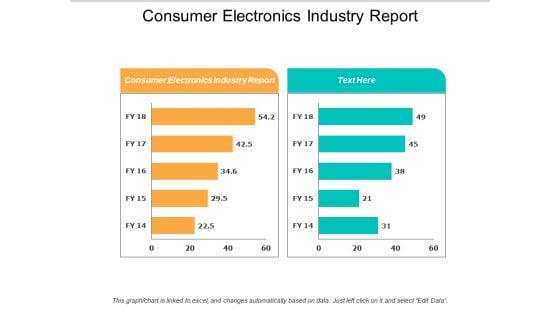
Consumer Electronics Industry Report Ppt PowerPoint Presentation Model Elements Cpb
This is a consumer electronics industry report ppt powerpoint presentation model elements cpb. This is a two stage process. The stages in this process are consumer electronics industry report.
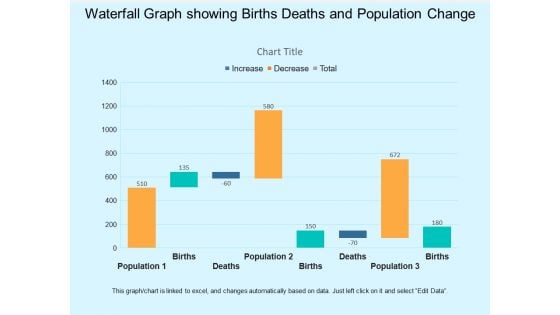
Waterfall Graph Showing Births Deaths And Population Change Ppt PowerPoint Presentation Infographic Template Visual Aids
This is a waterfall graph showing births deaths and population change ppt powerpoint presentation infographic template visual aids. This is a three stage process. The stages in this process are profit and loss, balance sheet, income statement, benefit and loss.
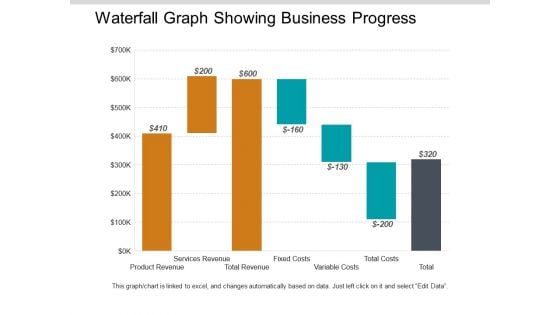
Waterfall Graph Showing Business Progress Ppt PowerPoint Presentation Styles Model
This is a waterfall graph showing business progress ppt powerpoint presentation styles model. This is a three stage process. The stages in this process are profit and loss, balance sheet, income statement, benefit and loss.
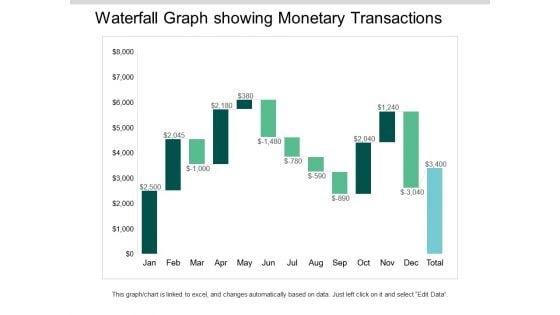
Waterfall Graph Showing Monetary Transactions Ppt PowerPoint Presentation Ideas Visuals
This is a waterfall graph showing monetary transactions ppt powerpoint presentation ideas visuals. This is a three stage process. The stages in this process are profit and loss, balance sheet, income statement, benefit and loss.
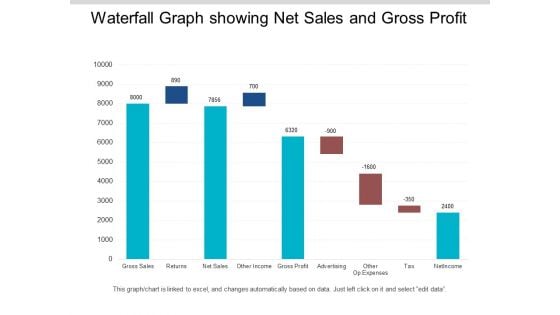
Waterfall Graph Showing Net Sales And Gross Profit Ppt PowerPoint Presentation Infographics Format
This is a waterfall graph showing net sales and gross profit ppt powerpoint presentation infographics format. This is a three stage process. The stages in this process are profit and loss, balance sheet, income statement, benefit and loss.
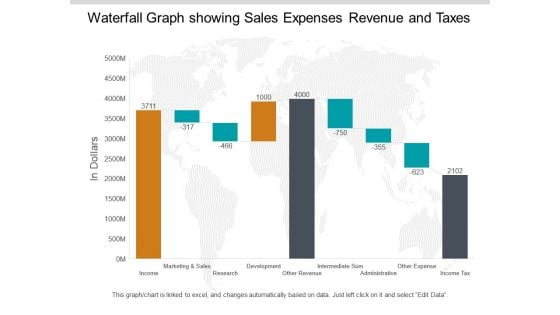
Waterfall Graph Showing Sales Expenses Revenue And Taxes Ppt PowerPoint Presentation Pictures Summary
This is a waterfall graph showing sales expenses revenue and taxes ppt powerpoint presentation pictures summary. This is a three stage process. The stages in this process are profit and loss, balance sheet, income statement, benefit and loss.
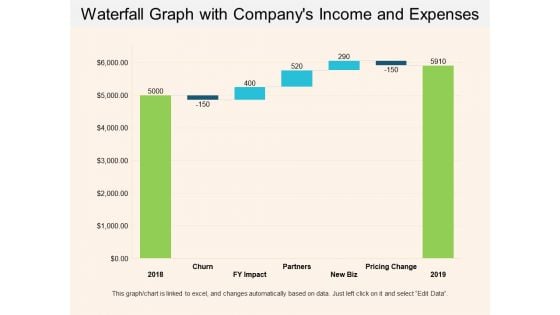
Waterfall Graph With Companys Income And Expenses Ppt PowerPoint Presentation Show Example Introduction
This is a waterfall graph with companys income and expenses ppt powerpoint presentation show example introduction. This is a three stage process. The stages in this process are profit and loss, balance sheet, income statement, benefit and loss.
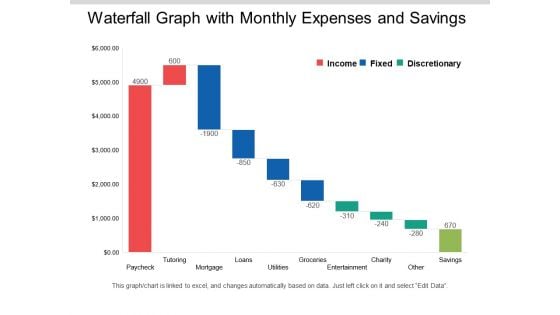
Waterfall Graph With Monthly Expenses And Savings Ppt PowerPoint Presentation Layouts Clipart Images
This is a waterfall graph with monthly expenses and savings ppt powerpoint presentation layouts clipart images. This is a three stage process. The stages in this process are profit and loss, balance sheet, income statement, benefit and loss.
Business Performance Report Template Ppt PowerPoint Presentation Layouts Influencers Cpb
This is a business performance report template ppt powerpoint presentation layouts influencers cpb. This is a three stage process. The stages in this process are business performance report template.
Public Relations Media Relations Ppt PowerPoint Presentation Layouts Skills Cpb
This is a public relations media relations ppt powerpoint presentation layouts skills cpb. This is a six stage process. The stages in this process are public relations media relations.


 Continue with Email

 Home
Home


